
1 Queen’s Hospitality Services Truths and Myths about food at Queen’s.
THE ECONOMIC IMPACT OF
QUEEN’S UNIVERSITY BELFASTON THE NORTHERN IRELAND ECONOMY
Universities UKIN FOCUS

This report was produced for Universities UK by Ursula Kelly, Iain McNicoll and James White of Viewforth Consulting Ltd.
INTRODUCTION 2
1. KEY UNIVERSITY CHARACTERISTICS 3
1.1 Revenue 3
1.2 Export earnings 3
1.3 Employment 4
1.4 Expenditure 4
1.5 Student profile 4
2. SECONDARY OR ‘KNOCK-ON’ EFFECTS ON THE ECONOMY 6
2.1 Generation of ‘knock-on’ effects 6
2.2 Output generated by the institution 6
2.3 Output multipliers 7
2.4 Employment generated by the university 7
2.5 Employment multipliers 8
2.6 GVA generated by the university 9
2.7 GVA multipliers 9
3. THE ADDITIONAL ECONOMIC IMPACT OF STUDENTS 10
3.1 Student expenditure 10
3.2 Impact of student off-campus expenditure 11
4. SUMMARY: THE COMBINED ECONOMIC IMPACT OF HIGHER EDUCATION INSTITUTIONS AND THEIR STUDENTS 12
5. CONCLUSIONS 14
ANNEXES 15
Annexe A: Methodology and data sources 15
Annexe B: References and bibliography 16

IN FOCUS 1
List of figures
List of figures
Figure 1: University revenue, 2012–13
Figure 2: University income by broad source, 2012–13
Figure 3: Occupational profile of employment, 2012–13
Figure 4: University expenditure, 2012–13
Figure 5: Students at Queen’s University Belfast, 2012–13
Figure 6: Total output generated by Queen’s University Belfast, 2012–13
Figure 7: Secondary output generated by Queen’s University Belfast, 2012–13
Figure 8: Employment generated by Queen’s University Belfast, 2012–13
Figure 9: Secondary employment generated by Queen’s University Belfast, 2012–13
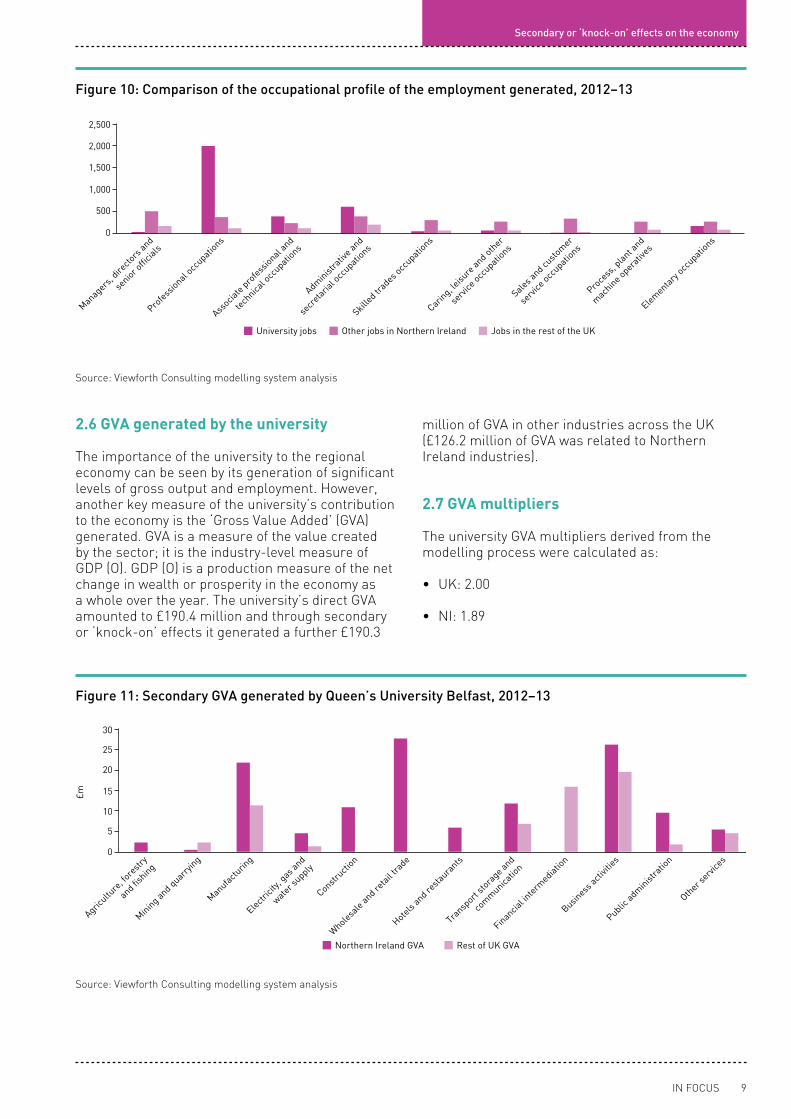
Figure 10: Comparison of the occupational profile of the employment generated, 2012–13
Figure 11: Secondary GVA generated by Queen’s University Belfast, 2012–13
Figure 12: Additional economic impact on Northern Ireland of the off-campus expenditure of students
Figure 13: Summary of total output generated, 2012–13 (university and students together)
Figure 14: Summary of total employment generated, 2012–13 (university and students together)
Figure 15: Summary of total contribution to regional GVA (university and students together)

2
The economic impact of Queen’s University Belfast
INTRODUCTION
This study provides an analysis of the economic impact of Queen’s University Belfast and its students on the Northern Ireland economy. Based in the City of Belfast, the university has over 22,500 students. Its turnover of nearly £290 million makes it Northern Ireland’s largest university in terms of its financial standing. With origins going back to 1845 as Queen’s College, the university gained formal independent university status in 1908. It has an extensive portfolio of teaching and research across 20 schools and 11 specialist institutes covering a range of disciplines including the sciences, social sciences, computing, engineering, arts and humanities, law, medicine, pharmacy and nursing.
This report’s primary aim is to assess the economic impact of the university as a business generating economic activity and contributing to Northern Ireland in terms of the jobs, output and ‘Gross Value Added’ (GVA) generated in a ‘snapshot year’. The report presents key economic aspects of Queen’s University Belfast (QUB) in the academic and financial year 2012–13 and its impact on Northern Ireland and on the rest of the UK. 2012–13 was the most recent year for which the relevant Higher Education Statistics Agency (HESA) data was available.
Major economic characteristics of the university are examined, including its revenue, expenditure and employment. The study also includes modelled analysis of the economic activity generated in other sectors of the economy through the secondary or ‘knock-on’ effects of the expenditure of the university and its students.
This analysis used a two-stage approach to the estimation of the economic impact of the university. Firstly, the impact of the university on the UK was modelled, using a purpose-designed economic model of the UK. Analysis was then undertaken, using a Location Quotient approach, to estimate the share of the university’s impact likely to have accrued to Northern Ireland.
The model used was a ‘Type II’ input-output model based on data derived from the UK Input-Output tables and related Office for National Statistics data. The model had been specifically designed to analyse higher education impact and was updated in 2013 to undertake a UK-wide study of higher education for Universities UK along with studies of the nine regions of England.1 This modelling system and analysis framework has also been used for a study of higher education in Wales2 as well as studies of individual institutions. Institutional income and expenditure data was sourced from HESA and student expenditure data from surveys undertaken for the UK Department for Business, Innovation and Skills (BIS). Further details of data sources and methodology are available in Annexe A.
1. Universities UK (2014) The impact of universities on the UK economy and The economic impact of higher education institutions in the English regions available at: www.universitiesuk.ac.uk/highereducation/Pages/ImpactOfUniversities.aspx
2. Higher Education Wales (2013) The Economic Impact of Higher Education in Wales available at: www.uniswales.ac.uk/wp/media/2013-June-The-Economic-Impact-of-Higher-Education-in-Wales1.pdf

IN FOCUS 3
Key university characteristics
3. In this analysis, based on HESA HE Finance Plus information, tuition fees paid through the Student Loans Company are classed as ‘private’ as the payments are made on behalf of specific private individuals who are then responsible for repayment to the SLC.
CHAPTER 1KEY UNIVERSITY CHARACTERISTICS
1.1 Revenue
The university had a total income of £289 million in 2012–13. This was earned for a wide range of educational and related services.
Figure 1: University revenue, 2012–13
33%
21%
26%
18%
2%
Funding council grants Research grants and contracts
Other income Endowment and investment incomeTuition fees, education grants and contracts
Source: HESA HE Finance Plus 2012/13
As Figure 1 illustrates, the largest part of institutional revenue (80%) was earned for the delivery of teaching and research (funding council grants, tuition fees and research grants and contracts). This came from a range of sources and included individual student fee payments and research contracts with private and international clients as well as money from public sources. In addition to money for teaching and research the university also earned 18% of its income from other services, including, for example, consultancy services, the provision of residence and catering, conference support and facilities hire. Income from endowments and investments (frequently these come from charitable or philanthropic donations) stand at 1.9%. While this appears relatively modest, it is in fact unusually high for a UK university – only a handful of UK universities have endowment income exceeding 1% of total income.
Around 57% of university revenue in the study year was estimated as being derived from public sector sources. However, only around 33% of this was the baseline support from the higher education
funding body (the Department for Employment and Learning [DEL]). ‘Other’ public sector income made up an estimated 24% of total university income. This includes tuition fees paid by public sector bodies, eg for some types of postgraduate training as well as research and consultancy contracts with public sector bodies including the UK research councils or contracts won in competition against private firms. Thirty-one per cent of university income came from the UK private sector and 12% from international sources. Private income includes student fee payments (whether made by directly by individuals, by industrial sponsors or through loans from the Student Loans Company3). It also includes payments for other services such as residence and catering, consultancy or contract research for private firms. International income (estimated as amounting to around £34.4 million) includes international (ie both non-EU and rest of EU) student fees as well as residence and conference income and research and consultancy for international clients.
Figure 2: University income by broad source, 2012–13
Funding council grants (DEL) Other public sources
33%
24%
31%
12%
Private sources International sources
Source: Viewforth Consulting analysis of income data from HESA HE Finance Plus 2012/13
1.2 Export earnings
The university’s international revenue of £34.4 million, together with the estimated off-campus expenditure of international students (£26.8 million), represents a total of £61.2 million of export earnings, contributing to the UK balance of trade.

4
The economic impact of Queen’s University Belfast
1.3 Employment
The university directly provided 3,303 full-time equivalent (FTE) jobs across a wide range of occupations. The occupational profile of university employment is shown in Figure 3. Unsurprisingly, academic professions (professors, lecturers and researchers) are the largest single type of occupation. However, there are also a range of other skilled and semi-skilled jobs. This reflects the need to maintain a significant university estate, including many listed buildings of architectural and historic importance. There are lecture halls, laboratories and offices as well as halls of residence, cafeteria and related facilities for students such as sports facilities.
1.4 Expenditure
University expenditure, together with the expenditure of university staff and students, generates economic activity through secondary or ‘knock-on’ effects. In 2012–13 HESA data shows total expenditure of Queen’s University Belfast (including staff salaries) of just under £275 million.
1.5 Student profile
Queen’s University Belfast had a total (headcount) student population in 2012–13 of 22,700.
Summary of results for each region
Figure 3: Occupational profile of employment, 2012–13
500
1,000
1,500
2,000
Elementa
ry occ
upations
Caring, le
isure
and
other s
ervice
occupat
ions
Skilled tr
ades o
ccupat
ions
Administ
rativ
e and se
creta
rial
occupat
ions
Associa
te pro
fessional
and
tech
nical o
ccupat
ions
Proce
ss, p
lant a
nd mac
hine
operativ
es
Sales a
nd custo
mer s
ervice
occupat
ions
Profess
ional occ
upations
Manag
ers, d
irecto
rs an
d
senior o
fficia
ls
Non academic contract Academic contract
Num
ber
of jo
bs (F
TE)
0
Source: HESA staff data 2013–14
Figure 5: Students at Queen’s University Belfast, 2012–13
Local (NI) students Students from rest of UK
87%
5%4%4%
Students from rest of EU Students from rest of world
Source: HESA student data 2012–13
Figure 4: University expenditure, 2012–13
Staff costs Other operating expenses
58%36%
5%
Depreciation Interest payable
1%
Source: HESA HE Finance Plus 2012/13

IN FOCUS 5
Key university characteristics
The university attracted 2,130 international students – 915 from other parts of the EU and 1,215 from the rest of the world. As well as paying fees to the university, international students spend money on rent, food and other living expenses, much of which accrues to the local area. International student off-campus expenditure amounted to an estimated £26.8 million in 2012–13.
In addition, the university attracted 955 students from other parts of the UK, who spent an estimated £12 million on living and personal expenses. The expenditure of students from the rest of the UK can be regarded as a financial injection into Northern Ireland.
The university also enrolled 19,615 local students, ie those from Northern Ireland itself. While the expenditure of Northern Ireland students is not additional to the region, being able to secure a place at Queen’s University arguably meant that these students stayed in Northern Ireland rather than going further afield to study. In this case the university could be regarded as instrumental in helping to retain these students and their expenditure within the region. Northern Ireland students spent an estimated £247.1 million and this too generated jobs and output in Northern Ireland.

6
The economic impact of Queen’s University Belfast
CHAPTER 2SECONDARY OR ‘KNOCK-ON’ EFFECTS ON THE ECONOMY
2.1 Generation of ‘knock-on’ effects
Universities generate economic impact through their expenditure. Known as ‘knock-on’ effects, this impact is chiefly recognised as occurring in two ways:
• Indirect: through the universities buying goods and services from a wide range of suppliers (from books and stationery to legal services, laboratory equipment to catering supplies); the suppliers also have to make purchases in order to fulfil the university orders and their suppliers in turn make other purchases and so on, rippling through the economy
• Induced: through the universities paying wages to their employees, who in turn spend their salaries on housing, food and other consumer goods and services; this creates income for employees in other businesses and sectors, who also spend their income and so on
With universities that are long established in a particular location (Queen’s University has been established in Belfast since the mid 19th century), purchasing linkages tend to be highly developed within their host region. Previous studies of universities in the UK have shown that universities have a relatively high propensity to spend on UK, rather than imported, goods and services, generating greater local economic impact than businesses that rely more heavily on imports.4
Staff expenditure tends to follow a different pattern from institutional expenditure, being more consumer oriented. But while staff expenditure will have a higher proportion of expenditure on imported consumer goods and goods from elsewhere in the UK (eg through online shopping), there is still an observable reliance on local goods and services – such as cafes, pubs, restaurants, fast food outlets, taxi services and personal services such as hairdressing. This ‘snapshot’ analysis of the impact of expenditure will reflect the composition of those linkages.
In this particular study, the impact of Queen’s University Belfast’s expenditure on the UK as a
whole was modelled and then analysis made of the proportion of that impact accruing to Northern Ireland. This took into account the business and industry structure of the region as well as consideration of purchases that are most likely to be more locally based.
2.2 Output generated by the institution
The university’s output in 2012–13 was £289 million.5 Through the ‘knock-on’ effects of its expenditure in that year, the university generated an additional £388 million in other industries throughout the UK, with the majority (£257 million) accruing to Northern Ireland businesses.
Figure 6: Total output generated by Queen’s University Belfast, 2012–13
University output Output in the rest of the region
43%
19%
38%
Output in the rest of the UK
Source: Viewforth Consulting modelling system analysis
The impact was spread across a range of other industries, with an emphasis on manufacturing, wholesale and retail, and business activities. The spread of impact is determined by the types of goods and services bought by the universities and their staff – as well as from whom they are bought. A university may buy laboratory equipment direct from a manufacturer, for instance, or through a wholesaler. They may purchase legal services from a local firm of solicitors. University staff expenditure tends to be more oriented towards consumer goods
4. McNicoll (1997)5. Institutional revenue or ‘turnover’ equates to institutional output.
Summary of results for each region

IN FOCUS 7
Secondary or ‘knock-on’ effects on the economy
and services, many of these from local companies and shops. Figure 7 shows the pattern of output impact across industries.
2.3 Output multipliers
The impact is generated by university expenditure. By studying the volume of impact generated, it is possible to calculate ‘multipliers’. Analysis of the output impact enabled Type II output multipliers for the Queen’s University Belfast to be derived. These were:
• UK: 2.34
• Northern Ireland: 1.89
In other words, every £1 million of university output will generate a further secondary output impact of £1.34 million in the UK, with £0.89 million of this being in Northern Ireland.
2.4 Employment generated by the university
In addition to directly providing 3,303 full-time equivalent (FTE) jobs, university expenditure generated additional jobs in other parts of the economy. 3,859 more FTE jobs were generated outside the university. The majority of the additional jobs were generated in Northern Ireland itself (2,938 FTE jobs), with 921 jobs in the rest of the UK.
Total employment generated by the university (direct plus secondary) therefore came to 7,162 FTE jobs, 6,241 of which were in Northern Ireland.
Figure 8: Employment generated by Queen’s University Belfast, 2012–13
University jobs Jobs in the rest of the region
46%
41%
13%
Jobs in the rest of the UK
Source: Viewforth Consulting modelling system analysis
Figure 9 shows the other industries within which the additional jobs would be generated. This pattern of employment generated has a particular emphasis on the wholesale and retail trade, business activities and public administration. This is because of a combination of two major factors: that the university had a relatively high output impact in these areas and also that these industries tend to be relatively labour intensive.
Figure 7: Secondary output generated by Queen’s University Belfast, 2012–13
Northern Ireland Rest of UK
Agricultu
re, fo
restr
y
and fishing
Mining and quarrying
Manufacturin
g
Electrici
ty, gas a
nd
water supply
Constructi
on
Wholesale and re
tail
trade
Hotels and re
staura
nts
Transp
ort sto
rage and
com
munica
tion
Financial in
termediatio
n
Business
activit
ies
Public adm
inistra
tion
Other s
ervice
s0
10
20
30
40
50
60
70
£ m
illio
n
Source: Viewforth Consulting modelling system analysis

8
The economic impact of Queen’s University Belfast
2.5 Employment multipliers
As with the analysis of output impact, it is possible to calculate ‘multiplier’ values. The Type II employment multipliers derived for Queen’s University were observed to be:
• UK: 2.17
• NI: 1.89
In other words, for every 100 direct full-time equivalent (FTE) jobs created in the university itself, another 117 jobs would be generated outside the university in other UK industries, 89 of which would be in Northern Ireland.
The total UK employment impact of £1 million received by the university is 24.82 FTE jobs. Every £1 million of Queen’s University output creates:
• 11.45 FTE jobs directly in the university
• 10.18 FTE jobs elsewhere in Northern Ireland
• 3.19 FTE jobs elsewhere in the UK
Figure 3 showed how the university’s employment profile covers the full range of skill levels. By translating the institutional employment profile into Standard Occupational Classifications it is possible to compare the profile of higher education employment with that generated outside the university. Figure 10 compares the university occupational profile with that of the employment created outside the university in the rest of Northern Ireland and in the rest of the UK.
As Figure 10 illustrates, university employment is relatively specialised in high skilled ‘white collar’ jobs compared to jobs generated in the rest of the economy. This might be expected from the knowledge intensive nature of university activity. The relatively fewer ‘managerial’ occupations in universities compared to the jobs generated in the rest of the economy will tend to be more of a reflection of how universities classify their own staff, with many academics (who are classed as professional occupations, rather than managers) undertaking managerial roles.
6. The economic model used is based on SIC 2003 descriptors, which at a 1 digit level are not significantly different from SIC 2007. Hence the industry descriptors used here are SIC 2003.
Figure 9: Secondary employment generated by Queen’s University Belfast, 2012–136
Agricultu
re, fo
restr
y
and fishing
Mining and quarrying
Manufacturin
g
Electrici
ty, gas a
nd
water supply
Constructi
on
Wholesale and re
tail tra
de
Hotels and re
staura
nts
Transp
ort sto
rage and
com
munica
tion
Financial in
termediatio
n
Business
activit
ies
Public adm
inistra
tion
Other s
ervice
s0
200
400
600
800
Other industries in Northern Ireland Rest of UK
Source: Viewforth Consulting modelling system analysis
IN FOCUS 9
Secondary or ‘knock-on’ effects on the economy
2.6 GVA generated by the university
The importance of the university to the regional economy can be seen by its generation of significant levels of gross output and employment. However, another key measure of the university’s contribution to the economy is the ‘Gross Value Added’ (GVA) generated. GVA is a measure of the value created by the sector; it is the industry-level measure of GDP (O). GDP (O) is a production measure of the net change in wealth or prosperity in the economy as a whole over the year. The university’s direct GVA amounted to £190.4 million and through secondary or ‘knock-on’ effects it generated a further £190.3
million of GVA in other industries across the UK (£126.2 million of GVA was related to Northern Ireland industries).
2.7 GVA multipliers
The university GVA multipliers derived from the modelling process were calculated as:
• UK: 2.00
• NI: 1.89
Figure 10: Comparison of the occupational profile of the employment generated, 2012–13
Managers, d
irecto
rs and
senior o
fficia
ls
Profess
ional occ
upations
Associa
te profess
ional and
technica
l occ
upations
Administ
rativ
e and
secr
etarial o
ccupatio
ns
Skilled tr
ades occ
upations
Caring, le
isure
and other
serv
ice occ
upations
Sales and cu
stom
er
serv
ice occ
upations
Proce
ss, p
lant and
mach
ine operativ
es
Elementary
occupatio
ns0
500
1,000
1,500
2,000
2,500
University jobs Other jobs in Northern Ireland Jobs in the rest of the UK
Source: Viewforth Consulting modelling system analysis
Figure 11: Secondary GVA generated by Queen’s University Belfast, 2012–13
Agricultu
re, fo
restr
y
and fishing
Mining and quarrying
Manufacturin
g
Electrici
ty, gas a
nd
water supply
Constructi
on
Wholesale and re
tail tra
de
Hotels and re
staura
nts
Transp
ort sto
rage and
com
munica
tion
Financial in
termediatio
n
Business
activit
ies
Public adm
inistra
tion
Other s
ervice
s
30
25
20
15
10
0
5
Northern Ireland GVA Rest of UK GVA
£m
Source: Viewforth Consulting modelling system analysis
10
The economic impact of Queen’s University Belfast
CHAPTER 3THE ADDITIONAL ECONOMIC IMPACT OF STUDENTS
3.1 Student expenditure
In 2012–13 the university had a total (headcount) student population of 22,700.7 The vast majority of students (87%) came from Northern Ireland, with 4% from the rest of the UK, 4% from the rest of the EU and 5% from the rest of the world.
Student expenditure is also important to the economy. Student expenditure contributes to the economy in two main ways:
• Firstly students pay money to the universities for their fees, accommodation (where applicable) and other ancillaries (canteen/on-campus catering, etc). The universities then respend the money and the impact of these payments by students is captured within the analysis of university impact.
• Secondly, students also spend money on a wide range of goods and services off campus. The private rented sector benefits from students’ need for accommodation, local supermarkets sell food and drink and local pubs and clubs frequently rely heavily on student trade. Even a casual observer will note that around any university or college (and the entire university area in Belfast is a case in point) there is a proliferation of cafes, snack bars, pubs and ‘fashionable’ shops that seem to draw a large proportion of their business from students. These are very tangible positive economic consequences of a student presence in the city.
The on-campus expenditure (for fees or university residence) is included in the university impact. To analyse off-campus student expenditure we drew on a number of student expenditure surveys and
university guidance on finance and living expenses to make estimates of overall student expenditure for different types of student (non-EU, rest of EU, rest of UK etc).8 We also took into account the (relatively limited) supply of university-owned student accommodation to fine-tune estimates of overall living expenditure that may have been paid to the university rather than spent off campus. We then incorporated student expenditure estimates into the model. The impact of four groups of students was separately modelled. These were:
a. Students from non-EU countries studying at Queen’s University
b. Students from the rest of the EU studying at Queen’s University
c. Students from the rest of the UK studying at Queen’s University
d. Northern Ireland students studying at Queen’s University
The groups are modelled separately as there can be different policy implications relating to each group. Expenditure by international students (both non-EU and rest of EU students) represents export earnings.9 They are modelled and results presented separately because of their different immigration standing (and changes in visa policies impact differently on these groups). Expenditure by students from the rest of the UK is important for regional policy as it is a clear additional injection of money into Northern Ireland. Expenditure by Northern Ireland-domiciled students is also important to note, since the university helped retain these students and their spending within Northern Ireland.
The summary results for impact of off-campus student expenditure are shown in Figure 12.
7. Source: HESA Students in Higher Education 2012/138. The most recent expenditure survey of Northern Ireland students was for 2004–05. However, the Department for Business, Innovation and
Skills has conducted more recent surveys (for 2011–12) and also made estimates of international student expenditure, which we used. For more details see Annexe A.
9. The BIS estimates of international student expenditure that were used here take account of any UK-sourced money spent by international students, eg money from UK grants or part-time earnings. Hence all the international student expenditure included in this analysis can be regarded as export earnings.

IN FOCUS 11
The additional economic impact of students
3.2 Impact of student off-campus expenditure
Figure 12: Additional economic impact on Northern Ireland of the off-campus expenditure of students
Student numbers 2012–13
Estimated expenditure off-campus
(£ million)
Output generated in
UK by off-campus student
expenditure(£ million)
Output generated
in NI by off-campus
expenditure(£ million)
Employment generated
in UK by off-campus
expenditure(FTE jobs)
Employment generated
in NI by off-campus
expenditure(FTE jobs)
RegionalGVA
generated by off-campus
expenditure(£ million)
Students from outside the EU
1,215 16.16 25.3 16.8 214 171 8.1
Students from the rest of the EU
915 10.61 16.6 11.0 140 112 5.3
Students from the rest of the UK
955 12.03 12.5* 12.5 127* 127 6.0
Northern Ireland students
19,615 247.1 256.8* 256.8 2,607* 2,607 124.1
TOTALS 22,700 285.9 311.2 297.1 3,088 3,017 143.5
Source: Viewforth Consulting economic modelling system analysis
* Because of the wider displacement effects of domestic student expenditure, the knock-on impact of domestic student expenditure only on the UK as a whole is defined to be identically equal to the estimated impact on the region.

12
The economic impact of Queen’s University Belfast
CHAPTER 4SUMMARY: THE COMBINED ECONOMIC IMPACT OF HIGHER EDUCATION INSTITUTIONS AND THEIR STUDENTS
Figures 13, 14 and 15 show the results for the combined impact of the university and its students together. These results show that the university overall (ie together with its students) makes a significant impact on the economy, generating nearly £843 million of output in Northern Ireland,
generating over 9,250 FTE jobs and contributing £460 million to Northern Ireland GVA. 9,250 FTE jobs is equivalent to around 1.3% of 2013 Northern Ireland employment10 and £460 million GVA makes up nearly 1.4% of 2013 Northern Ireland GVA.11
Figure 13: Summary of total output generated, 2012–13 (university and students together)
Direct
(£ million)Knock-on
impact on UK*
Of which accruing to the
region
Total UK impact (direct
& knock-on)
Total impact on the region (direct
& knock-on)
University 288.5 388.1 257.0 676.6 545.5
Plus non-EU students 0.0 25.3 16.8 25.3 16.8
Subtotal 288.5 413.4 273.8 701.9 562.3
Plus EU students 0.0 16.6 11.0 16.6 11.0
Subtotal 288.5 430.0 284.8 718.5 573.4
Plus RUK students 0.0 12.5* 12.5 12.5 12.5
Subtotal 288.5 442.5 297.3 731.0 585.9
Plus NI students 0.0 256.8* 256.8 256.8 256.8
Total combined impact 288.5 699.3 554.1 987.7 842.6
Source: Viewforth Consulting modelling system analysis
RUK = Rest of UK
* Because of the wider displacement effects of domestic student expenditure, the knock-on impact of domestic student expenditure only on the UK as a whole is defined to be identically equal to the estimated impact on the region.
** Totals may not sum due to rounding.
10. BRES (2013). The total number of employee jobs in September 2012 was 692,516.11. 2013 Northern Ireland GVA amounted to £32.8 billion. (ONS 2014)

IN FOCUS 13
Summary
Figure 14: Summary of total employment generated, 2012–13 (university and students together)
Direct employment
(FTEs)
Knock-on impact on
UK*
Of which accruing to the
region
Total UK impact (direct
& knock-on)
Total impact on the region (direct
& knock-on)
University 3,303 3,859 2,938 7,162 6,241
Plus non-EU students 0 214 171 214 171
Subtotal 3,303 4,073 3,109 7,376 6,412
Plus EU students 0 140 112 140 112
Subtotal 3,303 4,213 3,221 7,516 6,524
Plus RUK students 0 127* 127 127 127
Subtotal 3,303 4,340 3,347 7,643 6,650
Plus NI students 0 2,607* 2,607 2,607 2,607
Total combined impact 3,303 6,947 5,955 10,250 9,258
Source: Viewforth Consulting modelling system analysis
RUK = Rest of UK
* Because of the wider displacement effects of domestic student expenditure, the knock-on impact of domestic student expenditure only on the UK as a whole is defined to be identically equal to the estimated impact on the region.
** Totals may not sum due to rounding.
Figure 15: Summary of total contribution to regional GVA (university and students together)
Direct (£ million) Secondary Total
University 190.4 126.2 316.6
Plus non-EU students 0.0 8.1 8.1
Subtotal 190.4 134.3 324.7
Plus EU students 0.0 5.3 5.3
Subtotal 190.4 139.6 330.0
Plus RUK students 0.0 6.0 6.0
Subtotal 190.4 145.6 336.1
Plus NI students 0.0 124.1 124.1
Total combined impact 190.4 269.7 460.2
Source: Viewforth Consulting modelling system analysis
RUK = Rest of UK
* Totals may not sum due to rounding.

14
The economic impact of Queen’s University Belfast
CHAPTER 5CONCLUSIONS
This report presents an analysis of the economic impact of Queen’s University Belfast as an enterprise generating economic activity, jobs and output and contributing to GDP.
Universities are frequently regarded as ‘anchor institutions’ attracting and retaining business and investment in a region.12 Among the advantages of universities as anchor institutions is that they are historically closely identified with their host communities and are considerably less likely than other enterprises to move or relocate. Queen’s University is one of Belfast’s largest employers and is located close to the centre of the city with a number of ‘landmark’ and listed buildings, such as the Sir William Whitla Hall, which form part of the city’s architectural, civic and cultural heritage. A further important aspect of universities forming part of a region’s ‘core’ economy is that they tend to be countercyclical – while they may not grow as fast as other enterprises during a boom time, they tend to remain stable or contract less than other enterprises in times of recession. Therefore they provide stability in the local economy.
This report highlights the important contribution of Queen’s University to the Northern Ireland economy as an enterprise in itself. The employment generated by the university and its students is significant: equivalent to around 1.3% of all Northern Ireland employment.13 The university’s activities generated nearly £843 million of output in Northern Ireland in 2012–13 and £460 million of Northern Ireland GVA, equivalent to around 1.4% of 2013 Northern Ireland GVA.14 Decisions affecting the university’s business operations therefore have implications that go beyond the university itself and will consequently have a knock-on effect on the wider economy and the other Northern Ireland businesses that depend on the university.
12. The importance of the higher education institutions in Belfast as large enterprises was highlighted in the 2013 report The Impact of Anchor Institutions in Belfast (CLES 2013).
13. BRES (2013). The total number of employee jobs in September 2012 was 692,516.14. 2013 Northern Ireland GVA amounted to £32.8 billion (ONS 2014).

IN FOCUS 15
Annexe A
ANNEXE AMETHODOLOGY AND DATA SOURCES
The primary focus of the study was the higher education sector in Northern Ireland as an industry and the impact generated by the sector’s activity during the academic and financial year 2012–13.
The study utilised a two-stage approach to the estimation of the economic impact of the higher education sector. The impact of the higher education institutions on the UK economy was modelled, using a purpose-designed economic model of the UK. Analysis was then undertaken, using a Location Quotient approach, to estimate the share of the institutional impact on the UK likely to have accrued to Northern Ireland.
The model used was a ‘Type II’ input-output model based on actual UK data derived from the UK Input-Output Tables (Office for National Statistics) together with Labour Force Survey and Annual Business Inquiry data and the 2008 UK Blue Book. The modelling system was updated in 2013 to reflect productivity increases and related economic changes. Additional data sources include the Producers’ Prices Index, ONS Regional Accounts and Local Area Data from the ONS including the Business Register and Employment Survey and other regional labour market data from nomisweb.co.uk. The core modelling system is based on SOC 2000 and SIC 2003 classifications and this has been used for the 1 digit aggregate presentation of results. The modelling system used was purpose-designed for UK higher education institutions and is the most recent version of the Universities UK modelling system. The technical specification for the model is included in The impact of universities on the UK economy (Universities UK, 2014).
Other data sources
The main source of higher education data used was the Higher Education Statistics Agency (HESA) publications on higher education finance, staffing and students. Domestic student expenditure data was drawn from the most recent survey undertaken by BIS (for 2011–12) and uprated using the consumer
price index (CPI). International (ie both non-EU and rest of EU) student off-campus expenditure was estimated by drawing on the detailed analysis of international student expenditure carried out by BIS for the HM Government International Education Strategy Paper International Education: Global Growth and Prosperity (July 2013) (these figures were also uprated by the CPI). The BIS figures are the only extant estimates of international (rather than domestic) student expenditure in the UK. Hence we have assumed that international students studying in Northern Ireland will have similar expenditure patterns to international students in other parts of the UK. The BIS figures had taken account of any UK-source monies spent by international students (eg from grants or part-time work) and hence all of the international student expenditures included can be regarded as export earnings. Overall student spend figures were adjusted downwards to reflect an estimated amount likely to have been spent on campus (for residence, catering etc) and therefore paid to the universities. This was to avoid double counting. Amounts spent on campus are already included in the university impact.
In relation to student expenditure it is worth noting that the last Northern Ireland-specific student expenditure survey was conducted for 2004–05. However, when the survey findings are uprated to 2011–12 using the CPI to match the same time period of the 2011–12 survey of students in England, the figures turn out to be remarkably similar, with the minor differences in the uprated Northern Ireland expenditure figures and the recent England expenditure figures being within the same order of magnitude as the difference between the 2004–05 Northern Ireland expenditure survey and the 2004–05 England expenditure survey.
The final total expenditure figures for students were derived separately for each of the four groups of students of interest, reflecting the characteristics of the 2012–13 cohort of students. For instance there were a relatively high number of part-time postgraduates among the group from the rest of the UK.

16
The economic impact of Queen’s University Belfast
ANNEXE BREFERENCES AND BIBLIOGRAPHY
Belfast City Council (2012) Belfast: A Learning City Holyland and Wider University Area Strategic Study Louise Browne Associates
Belfast City Council (2013) Framework for Student Housing and Purpose Built Student Accommodation
Belfast City Council (2011) Holyland and Wider University Area Strategic Study Baseline Report C Buchanan and Partners
Belfast City Council (2014) Belfast: A Learning City The economic impact of higher education students on the economy of Belfast Viewforth Consulting
Belfast City Council (2013) Belfast City Masterplan Available at: www.belfastcity.gov.uk/business/developmentplans/belfastmasterplan.aspx
Department for Business, Innovation and Skills (2013) Student Income and Expenditure Survey 2011/12 Research Paper Number 115
Department for Business, Innovation and Skills (2013) Universities in their local communities, enabling economic growth Sir Andrew Witty’s Review
Department for Employment and Learning (2012) Graduating to success: a higher education strategy for Northern Ireland Available at: http://dera.ioe.ac.uk/14162/
ESRC Impact of HEIs on regional economies research initiative. Available at: www.impact-hei.ac.uk
Higher Education Statistics Agency (2013) 2012/13 publications on Finance, Staff and Students
Higher Education Wales (2013) The Economic Impact of Higher Education in Wales Kelly U, McNicoll I
HM Government (2013) International Education: Global Growth and Prosperity
Munro M, Turok I, Livingston M (2009) Students in Cities: A Preliminary Analysis of their Patterns and Affects. Environment and Planning A, 41 (8)
Nomisweb: www.nomisweb.co.uk
Northern Ireland Statistics and Research Agency: Census 2011. Available at: www.nisra.gov.uk
Northern Ireland Statistics and Research Agency: Quarterly Employment Survey 2013. Available at: www.nisra.gov.uk
Office for National Statistics (2008) United Kingdom, Input-Output Analyses, 2008 Edition
Office for National Statistics: United Kingdom National Accounts – The Blue Book 2008
Office for National Statistics Regional Accounts
Office for National Statistics Regional Summary of Labour Markets Headline Indicators
Office for National Statistics Business Register and Employment Survey (BRES) 2013
Queen’s University Belfast Accommodation Guide. Available at: www.stayatqueens.com/sites/StayAtQueens/ProspectiveStudents/Accommodation
Queen’s University Belfast website: www.qub.ac.uk
Universities UK (2009) The impact of universities on the UK economy Kelly U, McLellan D, McNicoll I
Universities UK (2014) The impact of universities on the UK economy Kelly U, McNicoll I, White J
Universities UK (2014) The economic impact of higher education institutions in the English Regions Kelly U, McNicoll I, White J

To download this report and its sister analysis of the University of Ulster, plus accompanying infographics, visit www.universitiesuk.ac.uk/highereducation

Higher education in focusUniversities UK’s Higher education in focus series covers additions to the evidence base to inform higher education policy development, and is the brand of Universities UK’s analytical unit. The series includes the unit’s in-house analysis and research, external research that the unit has commissioned, and data visualisations and infographics by the unit.
Des
igne
d by
Soa
pbox
This publication has been produced by Universities UK, the representative organisation for the UK’s universities. Founded in 1918, its mission is to be the definitive voice for all universities in the UK, providing high quality leadership and support to its members to promote a successful and diverse higher education sector. With 133 members and offices in London, Cardiff and Edinburgh, it promotes the strength and success of UK universities nationally and internationally.
Woburn House 20 Tavistock Square London WC1H 9HQ
Tel: +44 (0)20 7419 4111Email: [email protected] Website: www.universitiesuk.ac.ukTwitter: @UniversitiesUK
ISBN: 978-1-84036-335-7
© Universities UK
March 2015
To download this publication, or for the full list of Universities UK publications,visit www.universitiesuk.ac.uk
Printed by Universities UK Facilities Unit. To discuss your printing needs email [email protected] or call 020 7419 5437