The Economic Impact of Peanut Research on Poverty...
26
The Economic Impact of Peanut Research on Poverty Reduction: Resistance Strategies to Control Peanut Viruses in Uganda By Sibusiso Moyo, George W. Norton, and Jeffrey Alwang Selected paper presented at the American Agricultural Economics Association Annual Meetings Denver, CO-August 1-4, 2004
Transcript of The Economic Impact of Peanut Research on Poverty...

The Economic Impact of Peanut Research on PovertyReduction: Resistance Strategies toControl Peanut Viruses in Uganda
By
Sibusiso Moyo, George W. Norton, and Jeffrey Alwang
Selected paper presented at theAmerican Agricultural Economics Association Annual Meetings
Denver, CO-August 1-4, 2004
The Economic Impact of Peanut Research on Poverty Reduction:
Resistance Strategies to Control Peanut Viruses in Uganda
Sibusiso Moyo, George W. Norton, and Jeffrey Alwang*
* Graduate research assistant, professor, and professor respectively, Virginia Polytechnic
Institute and State University, Blacksburg, Virginia 24061. The authors would like to
thank Charlene Brewster for comments and acknowledge the financial support of the
USAID funded Peanut CRSP and IPM CRSP projects.
1
The Economic Impact of Peanut Research on Poverty Reduction:
Resistance Strategies to Control Peanut Viruses in Uganda
Abstract Economic impacts of research that developed Rosette Virus-resistance peanut in Uganda
are estimated. Changes in economic surplus are calculated and combined with household
data to assess changes in poverty rates and effects on livelihoods of the poor. The poverty
rate may decline up to 1.5 percent as a result of the research.

2
The Economic Impact of Peanut Research on Poverty Reduction:
Resistance Strategies to Control Peanut Viruses in Uganda
Introduction Rural households in Sub-Saharan Africa depend largely on agriculture, and peanuts are
an important crop in many areas. Peanuts are often the principal source of digestible
protein, cooking oil and vitamins in African countries, with women taking the lead in
growing and managing the crop. Peanut productivity has a significant bearing on the
economic and nutritional well being of a large segment of the population in several
countries. Unfortunately, peanut production is affected by the prevalence of various
viruses and diseases, the most common being Groundnut Rosette disease, a viral infection
first reported in Tanganyika (now Tanzania) as early as 1907 (Gibbons). The
International Crop Research Institute for Semi-Arid Tropics (ICRISAT) reports that
Groundnut Rosette disease has been and continues to be responsible for devastating
losses to peanut production in Africa. For example, the rosette epidemic in 1994-1995 in
central Malawi and eastern Zambia destroyed the crop to such an extent that the total area
of groundnut grown in Malawi fell from 92,000 ha in 1994-1995 to 65,000 ha in 1995-
1996. Losses in Zambia were estimated at US$ 5 million that year. Overall losses due to
rosette disease in Africa were estimated at about US$ 156 million per annum.
Through the auspices of ICRISAT and the USAID-funded Peanut CRSP, peanut
varieties with resistance to Rosette virus have been developed and released in Malawi
and Uganda, countries with high incidence of poverty. It is estimated that the majority of
people in both countries live below a poverty line of US$ 1.00 per person per day.
Benefits of the agricultural research that developed the virus-resistant peanut may have
3
had and may continue to have significant economic benefits, and more importantly, may
have reduced poverty at the margin in these countries. Benefits may have resulted from,
higher yields, reduced risk, lower production costs per quantity of peanuts produced,
lower food prices, and increased marketed surplus with possible positive effects on
household income.
Little is known about the economic impacts of research on peanut viruses and
disease resistance in Uganda and Malawi. An example of such research is the project on
“Control strategies for peanut viruses: Transgenic resistance, natural resistance, and virus
variability” being carried out in the two countries, with support from the Peanut CRSP
and ICRISAT, the benefits of which have never been estimated. An understanding of the
impact of this research could provide useful information that might help guide the level
of effort and funding required for similar projects, either now or in the future. Funding
organizations are interested not only in impacts on crop losses, yields, and incomes, but
on poverty reduction. Knowledge of the impact on poverty could provide information
that would lead to a reallocation of scarce research resources to activities with a
likelihood of reaching intended objectives. In addition, continued research support may
depend on demonstrating effects on intended beneficiaries. Given this need for impact
assessment, this paper summarizes results of a study to estimate the economic benefits of
peanut virus research in Uganda at the aggregate level, and then estimates the impacts of
the research on the poor. It begins with a brief review on methods used for assessing
poverty levels and impacts of agricultural research on poverty.
Agricultural research and poverty

4
Scientists, research administrators and policy makers face increasing pressure to justify
continued public investment in agricultural research. As demands proliferate for scarce
government funds, better evidence is needed to show that agricultural research generates
attractive rates of return compared to alternative investment opportunities. The result has
been an upsurge in studies, seeking credible ex ante estimates of the expected benefits of
current and proposed programs of research and ex post estimates of benefits from
previously performed research (Smith and Pardey, Morris and Heisey).
Ex ante or ex post estimates of the impact of increased agricultural productivity
on poverty are not easy to quantify as they depend on many factors. There may be effects
on labor if increased productivity affects labor demand, which in turn may affect both on-
farm and off-farm wages. The poor have little land or capital, so they gain
disproportionately from employment generated by agricultural growth and from lower
food prices, as do the urban poor, who spend most of their incomes on food (Thirtle, et
al,). Technology may bring along with it new cropping patterns whose characteristics are
difficult to predict, but with effects on household allocation of resources, labor included,
and thus affecting welfare. Higher productivity resulting from such technologies could
also bring along broad-based multiplier effects within the rural community that could
result in employment creation in industries related to the crop, e.g. fertilizer and post-
farm, oil making, and roadside marketing.
Considering these factors as a whole, there is a general consensus within
agricultural economics that agricultural productivity growth drives pro-poor growth,
benefiting poor farmers and landless laborers by increasing both production and
employment. It benefits the rural and urban poor through growth in the urban and rural
5
non-farm economy. It leads to access to crops that are high in nutrients and empowers the
poor by increasing their access to decision making processes, increasing their capacity for
collective action, and reducing their vulnerability to shocks, through asset accumulation
(Hazell and Haddad, 2001). However, measuring these myriad effects can be difficult.
Alwang and Siegel present a relatively simple method of measuring the impact of
agricultural research that can be used in research evaluations when there is an interest in
assessing poverty effects, once the first round aggregate income effects are measured.
That method relies on calculations of changes in poverty rate measures of the Foster-
Greer- Thorbecke (FGT) type. Of course first-round effects, although potentially large,
positive and widely distributed for plant genetic improvement research, are themselves
subject to many methodological and practical challenges in documentation and
measurement (Morris and Heisey, 2003). Problems are associated with measuring
adoption and diffusion of hybrid or improved seed, and with apportioning benefits
attributable to new hybrid or improved varieties as opposed to other factors. Alston et al.
(2000) argue that when greater attention is paid to methodological issues, estimated rates
of return are not as high as is generally believed. However, in this paper we present
results based on a fairly standard set of economic surplus calculations, recognizing its
potential limitations, and then link the results to poverty rate changes.
Methods and data
The overall economic impacts of the research that developed Rosette Virus-resistant
peanut in Uganda are estimated over a 15 year period, focusing on the region of the

6
country where peanuts are most prevalent. Peanut producing households are studied in a
second analysis to quantify the effects of research on the livelihoods of the poor.
First, changes in economic surplus are calculated that result from adoption of
virus-resistant peanut varieties. A small open economy model is assumed, which implies
that the primary beneficiaries are the peanut producers, either through sales or through
home consumption. Economic surplus gains imply an increase in real income of
producers. In a diagrammatic depiction of the small open economy model (figure 1), the
initial equilibrium is defined by consumption, C0, and production Q0, at the world market
price, PW, with export quantity QT0 equal to the magnitude of the difference between
consumption and production. Research causes supply to shift from S0 to S1 and
production to increase to Q1. As a result, exports increase to QT1. Because the country
does not affect the world price, economic surplus change is all producer surplus and is
equal to area I0abI1.
Figure 1: Research benefits in a small open economy
Price
Quantity
S0
S1
0 C0 Q1 Q0
D
a bPW
I0
I1 QT1
QT0

7
To enable estimation of the economic surplus changes, primary data on yield and costs
changes as well as realized and expected adoption were obtained from breeders at
research institutes, extension officers, farmers, and other industry experts in Uganda
during July and August of 2003. More specifically, the data consisted of current peanut
yields and costs of production for traditional and virus-resistant varieties (Serenut 3 and
4) as well as realized and projected adoption rates. Research costs were also collected, as
well as basic price, quantity, trade, and elasticity data from secondary sources. These
varieties were released in 2001 and therefore there has already been some adoption (15
percent) and a higher adoption rate is expected over the next few years (up to 50 percent).
The second step involves taking the change in producer surplus resulting from the
technical change and plugging it into FGT additive measures of poverty to compute
poverty changes. The FGT indices are the most commonly used measure of poverty and
are useful because they are additively decomposable with population share weights and
therefore allow quantification of poverty for different population subgroups in terms of
depth of poverty and its severity, and therefore allow possible evaluation of effects of
agricultural and other government policies.
The FGT class of poverty measures is defined asα
α ∑=
−
=q
i
i
zyz
nP
1
1 , where n is
the total population, q is the number of poor households, yi is income or expenditure of
the ith poor household, z is the poverty line and is measured in the same units as the is y,
and α is a parameter of inequality aversion. When α = 0, Pα is the headcount index,
which is a measure of the prevalence of poverty or the proportion of the population that is
poor. When α = 1, Pα is the poverty gap index, a measure of depth of poverty. It is based
on the aggregate poverty deficit of the poor relative to the poverty line. When α = 2, Pα is

8
a measure of severity of poverty. Each α tells the analyst different things about the
patterns of poverty in a population and allows comparison of policies. The index is also
additively decomposable, allowing comparison of changes in poverty among population
sub-groups.
Household income data are used to compute poverty indices which permit poverty
decomposition by income group. Realized research benefits from the economic surplus
model are incorporated into the poverty indices to estimate how households of differing
economic profiles move relative to the poverty line as their incomes are affected by the
improved technology.
With methods for estimating economic surplus and poverty formulated, it is
necessary design a procedure to identify those farmers likely to adopt hybrid or improved
seed varieties. For that we turn to a probit model. Consider a decision maker (deciding on
behalf of a household) faced with choosing between two alternatives. If we assume that
the household derives a certain amount of utility from each of the outcomes, then it
follows that the individual will choose the alternative that provides greater utility. For any
household we can observe the alternative chosen and define a discrete (dummy)
economic variable as the outcome, yi = 1 if household i adopts the technology and yi = 0
if household does not adopt.
The probit model can be specified
as
Φ=
=
−−== ∑∑∑
===
K
kkk
K
kkk
K
kkk xxFxFyob
1111)1(Pr βββ , where the more general
form of the cumulative distributive function, F, is replaced by the standard normal
cumulative distributive function, Φ. The probit model can be used to predict probabilities
of adoption for each household. Households can then be ranked in order of decreasing
9
probability of adoption and “adopting households” can be identified based on the total
percentage assumed to adopt.
Data for calculation of poverty indices were obtained from national household
surveys conducted by The International Food Policy Research Institute (IFPRI). The data
sets are extensive (2949 households in the peanut growing region), enabling computation
of the poverty indices and providing information on other socio-economic characteristics
that may affect producer behavior in the two countries.
The total number of holdings, which is the same as the number of households
carrying out crop farming for Uganda, was estimated to be about 3.3 million in 1999.
Thus each crop farming household had only one holding. The eastern region, the area of
focus for this research, had 922,000 holdings (slightly less than 30% of total number of
holdings in Uganda).
Results
Results are presented in two main sections. The first section presents the economic
surplus model results, while the second identifies farmers most likely to adopt hybrid
seed and then presents the impact of adoption of rosette resistant seed varieties on their
poverty status.
Economic surplus estimation
Data on supply and demand elasticities, production (yield and costs changes), adoption
rates, output prices, and research costs were collected. Use of these different types of data
in estimating economic surplus is described in detail below.

10
Years of operation of the project
The National Agricultural Research Organization (NARO) had been conducting research
on Groundnut Rosette Virus (GRV) for several years when the Peanut CRSP came on
board in May 2001 to supplement ongoing research. This analysis estimates changes in
economic surplus for a fifteen year period starting from inception of Peanut CRSP
activities in May 2001 through 2015.
Supply and demand elasticities
Many studies have been carried out to determine the responsiveness of supply to changes
in prices for a variety of crops. Examples include work by Askari and Cummings (1977),
Tsakok (1990) and Rao (1998). Although none of these studies included peanuts in
Uganda, a lot can still be learned from them. Rao (1988) states, for example, that crop-
specific acreage elasticities range between zero and 0.8 in the short run while long run
elasticities tend to be higher (between 0.3 and 1.2). Yield responses to price are smaller
and display much less stability than acreage elasticities. Askari and Cummings (1977)
emphasize that there is likely to be a wide variation in the quality of the estimates
presented in studies of supply responsiveness. Specifically, the differences of definition
in the price variable itself, in the price deflators, and in the output measures preclude
rigid comparison of elasticity estimates.
Economic theory suggests that agricultural commodities that use relatively little
land and few other specialized factors tend to have high elasticities (Alston et al, 1995).
The peanut crop in Uganda is in most cases grown on small plots of land by poor farmers

11
using limited resources, in most cases with only seed and labor costs. It is therefore easy
to increase or decrease production in the short run in response to changing price
incentives. Alston et al (1995) propose that in the absence of adequate information it
might be appropriate to assign a supply elasticity of 1 since long run elasticities for most
agricultural commodities are greater than one, while short run and intermediate
elasticities are usually close to one. Therefore using a supply elasticity of one as a starting
point might not be a far fetched assumption, thus this idea is adopted in computing
economic surplus for eastern Uganda. The elasticity of demand is assumed to be infinite
because Ugandan production is small on a global market scale and the Ugandan economy
is relatively open.
Yield and cost change
Based on evaluation data by Ugandan scientists and other experts of the two varieties of
seed involved, Serenut 3 and 4, an average yield increase of 67 percent is assumed1. We
converted the expected yield change to a per unit cost change by dividing it by the
elasticity of supply. Input use is expected to increase by 50 percent per hectare upon
adopting the technology, mostly due to higher seed costs. We converted this per hectare
cost change to a per ton cost change using the formula in Alston, Norton and Pardey, and
subtracted it from the per unit cost change due to the yield change to arrive at a net per
unit cost change of 37.1 percent.
Adoption rate
1 The estimates for yield and cost changes are based on on-farm trial data and opinions of peanut breeders and extension workers.

12
At the time of data collection the project had already created a rosette resistant variety, so
part of the objective had been achieved. Fifteen percent of farmers were estimated by
extension workers to be using the rosette resistant peanut seed varieties in 2003. For
subsequent years, we project adoption, which is expected to reach a maximum of 50
percent after nine years. The projected maximum adoption rate is based on expert
opinion. A plot of the assumed adoption profile is shown below.
Rosette resistant peanut adoption profile for Eastern Uganda
0
0.1
0.2
0.3
0.4
0.5
0.6
2001 2002 2003 2004 2005 2006 2007 2008 2009 2010 2011 2012 2013 2014 2015
Time in years
Ado
ptin
g fa
rmer
s (%
)
Adoption rate
Price
Although peanuts are traded, Ugandan production is assumed not to influence world
prices because of its low output relative to other producing nations. A three-year average
border price for 1999 to 2001 was used as the base price in the economic surplus model.
Based on this average, a ton of peanuts was assumed to be worth $750 in 2001, the time

13
of inception of the Peanut CRSP project. This price is used in estimating the economic
surplus generated by the project.
Quantity
Quantity produced refers to production volumes specific to the part of the country
(Eastern Province) where the evaluation is being carried out. Between the 1999 and 2001
agricultural seasons, Eastern Province districts combined produced an average of 42.8
thousand tons of peanuts. This quantity is used as the base quantity in the estimation.
Quantity is also assumed to have an exogenous growth rate of one percent per year,
irrespective of the new varieties.
Research cost
USAID, through the Peanut CRSP, will have contributed approximately $56,000 to the
project by September 2004. This amount represents only part of the costs. Other costs
were incurred by the public sector in Uganda, by ICRISAT in Malawi, and by the
University of Georgia. Looking at it from USAID/Uganda perspective, a 20 percent
adjustment was made to account for cash inflows from other Ugandan sources, for
example to cover salaries of breeders and certain other costs. The total cost (Ugandan
plus USAID) of the project is estimated to be about $67,120 or $16,780 per annum, for
the four-year period (2001-2004) in which the research was carried out. The other costs
incurred by ICRISAT and Georgia need not be considered when calculating the returns
on the USAID/Uganda investment.
14
Potential changes in peanut income
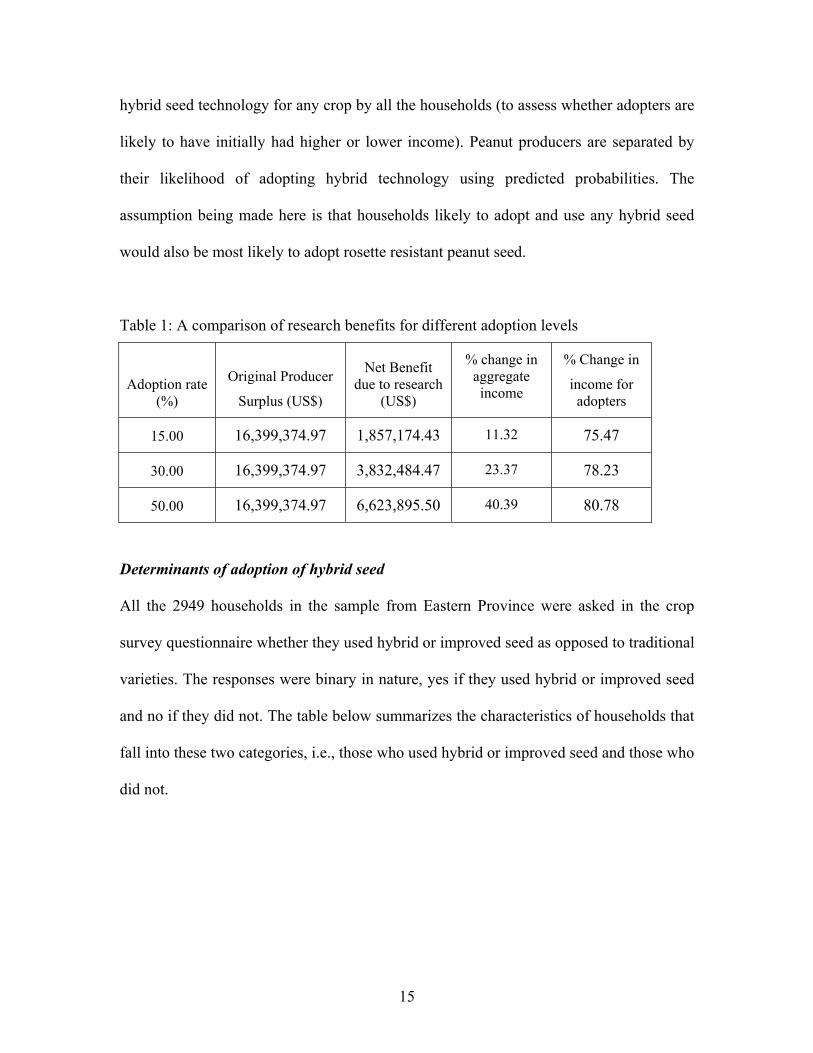
With a supply elasticity of 1, the net present value (Total change in economic surplus
minus research costs from 2001 – 2015) is projected to be $US 47 million, $38.8 million
and $32.3 million at the 3 percent, 5 percent and 7 percent discount rates respectively.
These net present values are equivalent to the sum of area I0abI1 calculated for each year
in Figure 1 (minus the research costs which are only in the early years) discounted over
the 15 year period.
To arrive at changes in poverty rates, the change in income as a result of a
productivity change is first compared to the original income given by area PwaI0 in the
same figure. A comparison of the original income (producer surplus) and the income
change due to the research gives a percent increase in income due to research and is
summarized in column 4 of table 1 for different levels of adoption. Results in table 1
indicate that aggregate peanut income is expected to increase by approximately 75
percent, 78 percent and 81 percent for the 15 percent, 30 percent and 50 percent levels of
adoption respectively if aunit peanut supply elasticity is assumed. These aggregate
changes in income are then converted to a per household basis to examine changes in
poverty rates. Column 5 in table 1 indicates the percent change in average household
income for those who adopt.
Having determined changes in household peanut income for the Eastern Province,
the next challenge is to identify those farmers who cultivate and report income from
peanuts who have or are expected to adopt the technologies. It is this group of peanut
producers for which the estimated income increases, with potential effects on poverty
rates. A binary Probit model is estimated to determine the likelihood of adoption of
15
hybrid seed technology for any crop by all the households (to assess whether adopters are
likely to have initially had higher or lower income). Peanut producers are separated by
their likelihood of adopting hybrid technology using predicted probabilities. The
assumption being made here is that households likely to adopt and use any hybrid seed
would also be most likely to adopt rosette resistant peanut seed.
Table 1: A comparison of research benefits for different adoption levels
Adoption rate (%)
Original Producer
Surplus (US$)
Net Benefit due to research
(US$)
% change in aggregate income
% Change in
income for adopters
15.00 16,399,374.97 1,857,174.43 11.32 75.47
30.00 16,399,374.97 3,832,484.47 23.37 78.23
50.00 16,399,374.97 6,623,895.50 40.39 80.78
Determinants of adoption of hybrid seed
All the 2949 households in the sample from Eastern Province were asked in the crop
survey questionnaire whether they used hybrid or improved seed as opposed to traditional
varieties. The responses were binary in nature, yes if they used hybrid or improved seed
and no if they did not. The table below summarizes the characteristics of households that
fall into these two categories, i.e., those who used hybrid or improved seed and those who
did not.
16
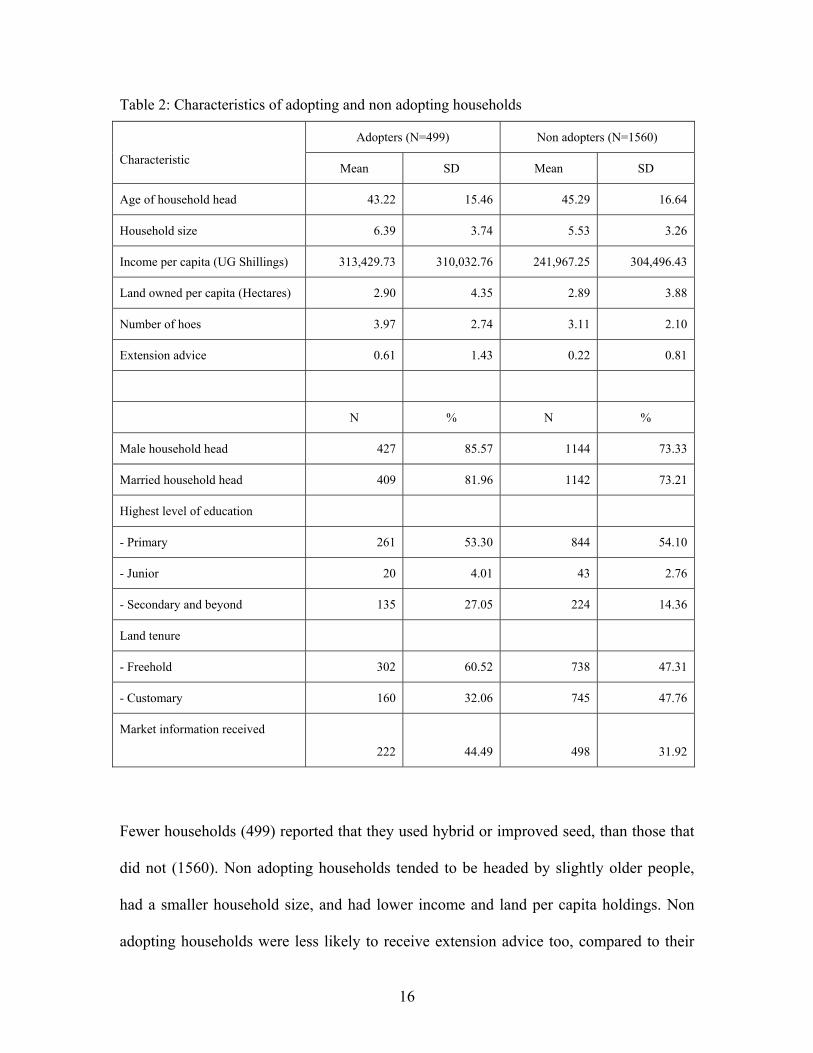
Table 2: Characteristics of adopting and non adopting households
Adopters (N=499) Non adopters (N=1560)
Characteristic Mean SD Mean SD
Age of household head 43.22 15.46 45.29 16.64
Household size 6.39 3.74 5.53 3.26
Income per capita (UG Shillings) 313,429.73 310,032.76 241,967.25 304,496.43
Land owned per capita (Hectares) 2.90 4.35 2.89 3.88
Number of hoes 3.97 2.74 3.11 2.10
Extension advice 0.61 1.43 0.22 0.81
N % N %
Male household head 427 85.57 1144 73.33
Married household head 409 81.96 1142 73.21
Highest level of education
- Primary 261 53.30 844 54.10
- Junior 20 4.01 43 2.76
- Secondary and beyond 135 27.05 224 14.36
Land tenure
- Freehold 302 60.52 738 47.31
- Customary 160 32.06 745 47.76
Market information received
222
44.49
498
31.92
Fewer households (499) reported that they used hybrid or improved seed, than those that
did not (1560). Non adopting households tended to be headed by slightly older people,
had a smaller household size, and had lower income and land per capita holdings. Non
adopting households were less likely to receive extension advice too, compared to their

17
adopting counterparts. Adopting households were mostly headed by males, who were
married in 82 percent of the cases. Adopting households had more (27 percent) people
who had some form of post secondary education (university education included) than
non-adopting households (14 percent). Most importantly, adopting households had more
access to land, on a freehold tenure basis, and were more likely to receive some market
information related to crop production and marketing.
The variables used to estimate the probit model were sex and age of household
head, marital status, education, extension services, market information, land tenure,
household size, income, land holdings and number of hoes owned. Some variables were
not continuous, but were dummy variables. These were variables pertaining to sex,
marital status, land tenure, market information and education. Results are summarized in
table 3.
The signs for most of the variables conform to economic theory. For example, a
positive relationship is expected between adoption and level of education, access to
information, income, and ownership of production resources. The older the household
head, the less likely he or she is to adopt hybrid or improved seed as shown by a negative
sign on the parameter estimate. Marital status has a negative sign as well, but is
statistically non-significant.
18
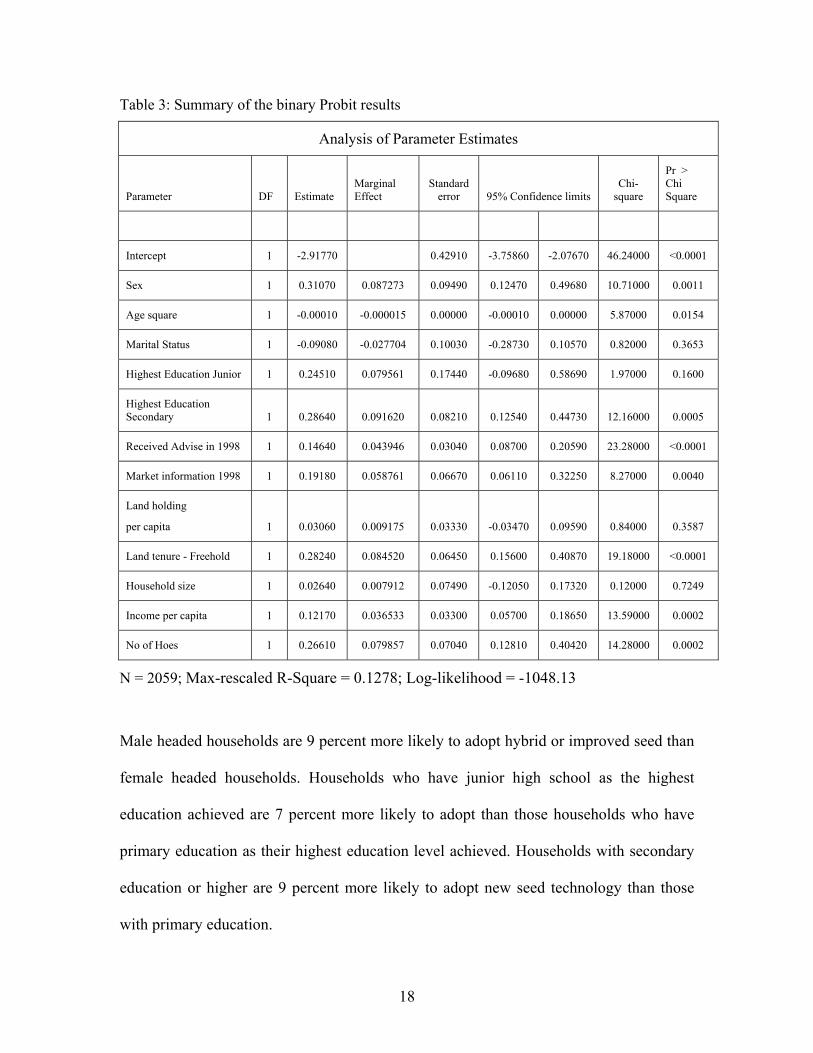
Table 3: Summary of the binary Probit results
Analysis of Parameter Estimates
Parameter DF Estimate Marginal Effect
Standard error 95% Confidence limits
Chi-square
Pr > Chi Square
Intercept 1 -2.91770 0.42910 -3.75860 -2.07670 46.24000 <0.0001
Sex 1 0.31070 0.087273 0.09490 0.12470 0.49680 10.71000 0.0011
Age square 1 -0.00010 -0.000015 0.00000 -0.00010 0.00000 5.87000 0.0154
Marital Status 1 -0.09080 -0.027704 0.10030 -0.28730 0.10570 0.82000 0.3653
Highest Education Junior 1 0.24510 0.079561 0.17440 -0.09680 0.58690 1.97000 0.1600
Highest Education Secondary 1 0.28640 0.091620 0.08210 0.12540 0.44730 12.16000 0.0005
Received Advise in 1998 1 0.14640 0.043946 0.03040 0.08700 0.20590 23.28000 <0.0001
Market information 1998 1 0.19180 0.058761 0.06670 0.06110 0.32250 8.27000 0.0040
Land holding
per capita 1 0.03060 0.009175 0.03330 -0.03470 0.09590 0.84000 0.3587
Land tenure - Freehold 1 0.28240 0.084520 0.06450 0.15600 0.40870 19.18000 <0.0001
Household size 1 0.02640 0.007912 0.07490 -0.12050 0.17320 0.12000 0.7249
Income per capita 1 0.12170 0.036533 0.03300 0.05700 0.18650 13.59000 0.0002
No of Hoes 1 0.26610 0.079857 0.07040 0.12810 0.40420 14.28000 0.0002
N = 2059; Max-rescaled R-Square = 0.1278; Log-likelihood = -1048.13
Male headed households are 9 percent more likely to adopt hybrid or improved seed than
female headed households. Households who have junior high school as the highest
education achieved are 7 percent more likely to adopt than those households who have
primary education as their highest education level achieved. Households with secondary
education or higher are 9 percent more likely to adopt new seed technology than those
with primary education.
19
An increase in the age of the household head by 1 year results in the probability of
adoption decreasing by 2*(0.000015)*(43.45)*100 = 0.13035 %. For logarithmic
variables, the marginal effect is divided by the mean, to get the impact on adoption of a
unit increase in a variable. An increase in per capita income by a Shilling results in an
increase in the probability of adoption by 0.036533/34593.89*100 = 1.055*10-5 %, a very
small change. Similar interpretation applies to the number of hoes, household size, and
landholding per capita, which are other variables transformed by natural logarithms.
The Probit results are used to identify farmers who are most likely to adopt new
hybrid seed technology. The predicted probability of adoption is used to order the
households according to likelihood of adoption. We then apply the income changes from
the new technology to the first 15 percent, 30 percent and 50 percent according to
adoption probability. The first 15 percent (90) peanut producing households in the
survey experience a 75 percent peanut income shift (see table 1). The number of adopting
households increases to 180 at 30 percent predicted adoption and 300 at a predicted 50
percent rate.
Impact on poverty
The economic surplus results indicated that adoption of Rosette resistant peanut seed
would result in income derived from production of the crop increasing from 75 and 81
percent depending on the rate of adoption. To estimate the impact of this income change
on welfare, the three FGT measures of poverty were computed for peanut producing
households before and after the adoption of hybrid or improved seed for the three levels
20
of adoption. Two poverty lines were also used, one pegged at $0.50 per adult equivalent
and the other $0.75.
Based on the $0.50 poverty line, the headcount index is 0.2556 before adoption
and 0.2333 after adoption, which implies that 25.56 percent of the households were poor
before adoption and that level of poverty falls to 23.33 percent after adoption (table 4).
The other indices, poverty gap and severity of poverty also change. The poverty gap
decreases from 0.0872 before adoption to 0.0813 after adoption. The severity of poverty
decreases from 0.0432 before adoption to 0.0393 after adoption. Based on the headcount
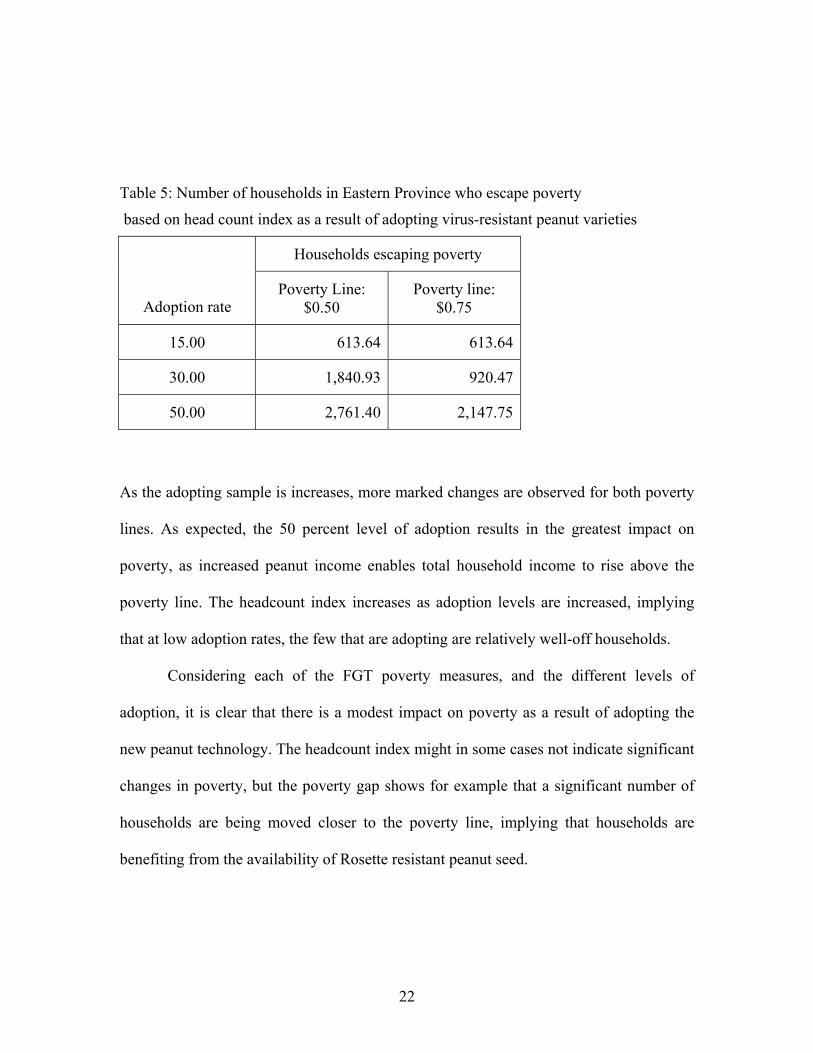
index, two households escape poverty in this sample of households. The sample is
representative of households in the region. The 601 peanuts producers in the survey are
20 percent of the households surveyed. Given that there are 922,000 households in
eastern Uganda, 20 percent of those households are 184,400 households. This translates
into an impact of 614 households ( 64.613400,184*6012
= ) across the eastern region of
Uganda being lifted above the $0.50 poverty line as a result of adopting rosette resistant
peanut seed (table 5). A similar number of households would be uplifted beyond the
poverty line for the $0.75 poverty line.
An adoption level of 30 percent implies 180 households in the survey adopt the
technology while 421 households do not. The $0.50 poverty line results in a headcount
index of 0.3722 before adoption and 0.3389 afterwards. Six households out of 601 peanut
farmers escape poverty due to adoption of the peanut technology, as measured by the
headcount index. Region-wide, the impact on poverty is 93.840,1000,184*6016
=
households. After increasing the poverty line to $0.75, only 920 households are deemed
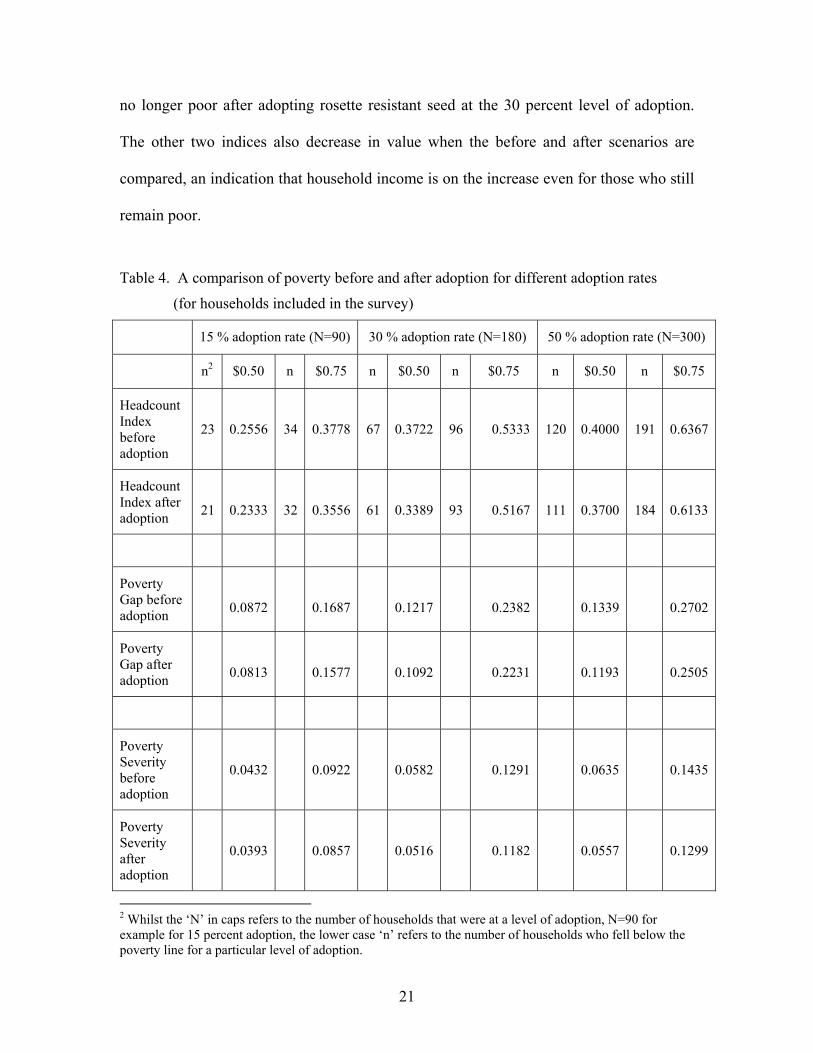
21
no longer poor after adopting rosette resistant seed at the 30 percent level of adoption.
The other two indices also decrease in value when the before and after scenarios are
compared, an indication that household income is on the increase even for those who still
remain poor.
Table 4. A comparison of poverty before and after adoption for different adoption rates
(for households included in the survey)
15 % adoption rate (N=90) 30 % adoption rate (N=180) 50 % adoption rate (N=300)
n2 $0.50 n $0.75 n $0.50 n $0.75 n $0.50 n $0.75
Headcount Index before adoption
23
0.2556
34
0.3778
67
0.3722
96
0.5333
120
0.4000
191
0.6367
Headcount Index after adoption
21
0.2333
32
0.3556
61
0.3389
93
0.5167
111
0.3700
184
0.6133
Poverty Gap before adoption
0.0872
0.1687
0.1217
0.2382
0.1339
0.2702
Poverty Gap after adoption
0.0813
0.1577
0.1092
0.2231
0.1193
0.2505
Poverty Severity before adoption
0.0432
0.0922
0.0582
0.1291
0.0635
0.1435
Poverty Severity after adoption
0.0393
0.0857
0.0516
0.1182
0.0557
0.1299
2 Whilst the ‘N’ in caps refers to the number of households that were at a level of adoption, N=90 for example for 15 percent adoption, the lower case ‘n’ refers to the number of households who fell below the poverty line for a particular level of adoption.
22
Table 5: Number of households in Eastern Province who escape poverty
based on head count index as a result of adopting virus-resistant peanut varieties
Households escaping poverty
Adoption rate Poverty Line:
$0.50 Poverty line:
$0.75
15.00 613.64 613.64
30.00 1,840.93 920.47
50.00 2,761.40 2,147.75
As the adopting sample is increases, more marked changes are observed for both poverty
lines. As expected, the 50 percent level of adoption results in the greatest impact on
poverty, as increased peanut income enables total household income to rise above the
poverty line. The headcount index increases as adoption levels are increased, implying
that at low adoption rates, the few that are adopting are relatively well-off households.
Considering each of the FGT poverty measures, and the different levels of
adoption, it is clear that there is a modest impact on poverty as a result of adopting the
new peanut technology. The headcount index might in some cases not indicate significant
changes in poverty, but the poverty gap shows for example that a significant number of
households are being moved closer to the poverty line, implying that households are
benefiting from the availability of Rosette resistant peanut seed.

23
Conclusion
Results indicate that sizable research benefits are generated by adopting rosette resistant
seed varieties and that they accrue mostly to farmers as there is no price effect in the
model. These benefits are estimated to be $47 million, $38.8 million and $32.3 million at
the 3 percent, 5 percent and 7 percent discount rates respectively. Poverty rates vary in
the eastern province depending on whether the $0.50 or $0.75 poverty lines are used. The
poverty gap and a severity of poverty measure show marked changes in poverty,
reflecting the fact that more households are being drawn closer to the poverty lines (and
hence escaping poverty) as a result of adoption. The headcount index indicates that over
2000 household would rise above the poverty line as result of adopting the varieties if 50
percent of them adopt; a reduction in the poverty rate of approximately 1.5 percent.
References Alston, J.M., Norton, G.W., Pardey, P.G. Science Under Scarcity: Principles and
Practice forAgricultural Research Evaluation and Priority Setting. (Ithaca, NY:
Cornell University Press, 1995).
Askari, H. and J. Cummings. Agricultural Supply Response: A Survey of Econometric
Evidence (New York: Praeger, 1977).
Foster, J., Greer, J., Thorbecke, E. “A Class of Decomposable Poverty Measures.”
Econometrica, Vol. 52 No. 3 (1984): 761-766.
Gibbons, R.W. . “Disease, Pests and Weeds in Tropical Crops: Groundnut Rosette
Virus.” Pgs. 19-21 in: Diseases of Tropical Crops. J. Cranz, J Schutter, and W. Koch,
(eds.) (Berlin: Verlag Paul Parey, 1977).

24
Hazell, P., Haddad, L. “Agricultural Research and Poverty Reduction, Food, Agriculture,
and the Environment.” Discussion paper 34, IFPRI/Technical Advisory Committee of
the CGIAR, Washington DC 2001.
Morris, M.L., Heisey, P.W. “Estimating the Benefits of Plant Breeding Research:
Methodical Issues and Practical Challenges.” Agricultural Economics, 29 (2003):241-
252
Rao, J.M. “Agricultural Supply Response: A Survey.” Agricultural Economics 3 (1989):
1-22
Smith, V.H., Pardey, P.G.. “Sizing Up Social Science Research (Measuring the Benefits
of Social Science Research).” American Journal of Agricultural Economics 79: 5
(2003): 1530-1534
Thirtle, C., Lin L., Piesse, J. “Impact of Research Led Agricultural Productivity Growth
on Poverty Reduction in Africa, Asia and Latin America. World Development, 31: 12
(2003): 1959-1975
Tsakok, I. (1990) Agricultural Price Policy: A practitioner’s Guide to Partial
Equilibrium Analysis. (Ithaca, NY: Cornell University Press, 1995).