THE ECONOMIC FEASIBILITY OF PAYING COLLEGE …
32
THE ECONOMIC FEASIBILITY OF PAYING COLLEGE ATHLETES By: Nicholas Rhea Warren Submitted in partial fulfillment of the requirements for Departmental Honors in the Department of Finance Texas Christian University Fort Worth, Texas May 8, 2017
Transcript of THE ECONOMIC FEASIBILITY OF PAYING COLLEGE …

THE ECONOMIC FEASIBILITY OF PAYING COLLEGE ATHLETES
By:
Nicholas Rhea Warren
Submitted in partial fulfillment of the
requirements for Departmental Honors in
the Department of Finance
Texas Christian University
Fort Worth, Texas
May 8, 2017

2
THE ECONOMIC FEASIBILITY OF PAYING COLLEGE ATHLETES
Project Approved:
Supervising Professor: Steven Mann, Ph.D.
Department of Finance
Barbara Wood, Ph.D.
Department of Finance
Chad Proell, Ph.D.
Department of Accounting

3
ABSTRACT
The purpose of this thesis is to look at the financial ability of Division 1 athletic programs
to pay their college athletes an annual salary. It has long been debated whether or not college
athletes should be paid for the revenues that they bring in for their schools from ticket and apparel
sales, but most of this debate comes in the form of subjective and opinion based articles and
sources. This paper will take that highly ethical question and look at it through an objective
financial lens in order to determine if athletes could receive salaries based off of the profits of their
respective institutions, similar to that of a business. One of my findings is that most Division 1
programs are not sufficiently profitable, as only 6 of the 106 teams from the sample observed
would be able to pay their athletes an annual salary of $25,000 a year.

4
PART I: INTRODUCTION
In 2015, for the first time ever, the men making up the Division 1 football team at
Northwestern submitted a case to form a players’ union, much like that of the NFLPA. The passing
of this case and the allowance of the team to unionize would allow them to negotiate paying
salaries. This submission was made on the basis that the student-athletes on the team believed that
they should reap the rewards of their hard work that had greatly benefited the National Collegiate
Athletic Association (NCAA) and their university, making millions of dollars through ticket sales
and TV contracts. By claiming that each of the student athletes was in fact an employee of the
university, they argued for collective bargaining rights (Strauss, 2015). Ultimately, the case was
ruled in the NCAA’s favor and the student-athletes were not allowed to unionize, but not before
re-sparking a popular national debate, should college athletes be paid?
Discussion regarding the payment of college athletes has, to this point, been more of an
ethical conversation. It has looked at whether or not a scholarship and a small stipend is enough
for the hard working athletes, or if student-athletes should be paid similarly to professional
athletes, receiving a salary as well as being able to sign endorsement deals. With some of the top
college athletes in recent history, including Heisman Trophy winners Johnny Manziel and Cam
Newton, getting into hot water for allegations regarding payments received during their time in
school, it has been a topic that has lingered, and will not soon go away. This thesis plans to take
the ethical question of whether or not student-athletes should be paid one step further and look into
whether or not the NCAA and its member universities could financially afford to pay student
athletes based on their profitability.
With the overall theme of paying college athletes being a highly subjective question, there
is not much existing work from a quantitative standpoint as to whether or not the payment could

5
be done. Rather, most research that has been done takes small bits of financial information like the
revenues of the NCAA as a whole and applies that information to a qualitative report making a
case for or against the payment of players. There is a relatively large hole in terms of research that
looks into whether or not payment is financially feasible from the revenue standpoint of the NCAA
and the universities. This information could be very important in answering the more widely
looked at ethical side, for if the NCAA and the schools can’t even afford to pay all of their student
athletes, the question of whether or not athletes should be paid could effectively be eliminated
from conversation.
On the other side, if the findings show that the NCAA or its member schools could afford
to pay athletes, it would substantially increase the bargaining power of student-athletes across the
nation. With over 460,000 NCAA student-athletes in the United States, this topic is one that could
serve a large number of people, and have a wide scope of influence. Before starting on this topic,
my initial thoughts were that due to the sheer size of the number of athletes under the NCAA
umbrella, less than 50% of programs in the sample would be able to pay their players.
To start my research, I will be looking at literature on the topic, analyzing current research
on both the financial workings of the NCAA and the arguments for and against paying college
athletes. This will help in understanding the concessions and demands that are wanted by athletes
as well as the current financial situation of the NCAA. Additionally, this may allow for the
discovery of new information that may be shored up by one side of a fairly opinionated topic, like
the potential for information about if and how much money may already be given to players that
can help add to the financial data that will be collected. After looking at the research that has been
done in the past few years, the thesis will move into the actual collection and analysis of financial
data.

6
The paper will analyze whether or not the universities that have been researched have
enough revenue generation and realized profits to pay players. In the instance there are schools
that do not generate enough revenue to pay, I will look at what percent can’t afford to pay as a
result of lack of profits. Due to the size of the NCAA, which is broken up into Division I, Division
II, and Division III, based on athletic program size, the research in the thesis will be limited to
Division I athletic programs that have a Football Bowl Series (FBS, formerly D1A) football team.
This will eliminate the schools that are classified as Division I with a Football Championship
Series team (FCS, formerly DIAA), Division II, and Division III schools, leaving 106 public
schools to analyze. One thing that will be held constant is the amount of scholarships that the
NCAA gives out per year, so I will not have to estimate the amount of freed up capital the NCAA
could have to pay athletes if scholarships were removed to help pay contracts. Upon researching
and reading literature that deals with the arguments for and against the payment of athletes, I will
search for a common number that many articles and reports seem to agree on for a yearly base
salary and use that number to estimate the necessary capital required for each player in order to
fall into the category of financially sound enough to pay their players.
Once all data is collected and analyzed, the next step will be to look at the data and compare
it to the initial thoughts both before the review of literature and after the review of literature. In
addition to looking at the results from a viewpoint of where they stand in relation to the initial
feelings of the topic, it will also be important to apply the findings to the more qualitative ethical
question and see whether or not athletes can in fact be paid or not. At that point, it will be
determined with a reasonable amount of confidence whether or not the findings have the ability to
have serious implications in a much more behavioral setting.

7
PART II: LITERATURE REVIEW
With the topic of paying college athletes sparking every time a player gets in trouble for
accepting money or gifts, there is a good amount of literature on the topic from a qualitative and
mostly opinion based standpoint. Such literature ranges from sources like Time, The Wall Street
Journal, and The New York Times, to scholarly reports written by professors from all over the
country. There is not extensive research pertaining to the actual profitability of each university,
rather, the literature that I found was in two camps: articles that pertained to the actual payment of
college athletes and had financial information that was pertinent to this thesis topic, and those that
looked more into the NCAA as a whole in regard to its revenue sources.
Literature on the Payment of Student Athletes
Analyzing the literature regarding the payment of college athletes, authors and articles fall
for the most part into two opposing sides. The first group believes that the student-athletes should
be paid and that the schools have, for lack of a better term, turned student-athletes into near
indentured servants. Most pro-payment articles vary much more than their anti-payment
counterparts, offering up different reasons that the students should be paid and giving different
opinions on how to pay them. One major theme amongst the pro-payment articles is the fact that
the top programs in the nation and their deals with companies like Nike are cited numerous times,
but articles rarely mentioned programs outside of the historically large and successful programs.
Rather than look at that articles’ proposed solutions, I will analyze the information similar to the
endorsement deal information separate of the biases in the articles. The authors employ this type
of data to show the contrast between the organizations and the individuals, but the information is
still helpful in getting an idea of the profitability of the schools.

8
Though many of the pro-payment articles differed in their analysis of the situation, an
interesting point that was discovered throughout reading was that a good amount of the material
proposed some type of “free market” system for the payments. This style of paying the athletes,
as highlighted in the New York Times article, “A Way to Start Paying College Athletes,” serves as
a way for those athletes in profitable sports to reap what the market could bear, similar to that of
the NFL (Nocera, 2016). Interestingly enough though, most of the articles also recognized that
only basketball and football were profitable. That means that under the free market system that
most of the arguments call for, only two sports would be receiving salaries. By not mentioning any
other sports, the articles avoided a discussion on the point that in order to pay college athletes, all
athletes need to be paid in order to keep up with the NCAA standards and national laws like Title
IX. While these arguments leave large holes in the overall debate, they do lead to a thinking point
in terms of the overall ability of schools and the NCAA to pay for their student athletes. Outside
of the lens of the “free market” approach, if it is widely acknowledged that only two sports at any
given school are recognized as profitable, then it becomes harder to believe that these sports are
profitable enough to offset the losses suffered by other sports that were not consistently mentioned
in pro-payment plans.
Taking a look at the opposing group of articles that argued that college athletes should not
get paid, the recurring trend dealt with the fact that the students received such high quality
treatment as it is, and didn’t need to get more money. This group differed from the pro-payment
group in the sense that while not all in the pro-payment group seemed to have similar viewpoints,
most of the anti-payment articles had similar beliefs that the free education that regularly eclipses
hundreds of thousands of dollars was more than enough compensation for the hard work that the

9
athletes put in. In addition to the scholarship itself, student athletes also receive stipends and other
benefits not given to regular students, such as tutors and private study areas (Chudacoff, 2016).
One piece of information in the anti-pay camp that was particularly thought provoking was
brought up by a University of Kentucky professor named John Thelin. In a piece in Time, Thelin
noted that many arguments in the debate failed to capture the fact that each school operates
differently and thus would have different hurdles to meet in order to pay their athletes. His points
on how different tuition cost per student, the overall costs of some schools compared to others,
and the differing tax laws in different states would hinder the ability of some universities to
compete with salary style payment. Thelin also brought up a good defense to arguments that flaunt
the fact that the median revenues of athletic programs have been increasing, stating how few look
at the rising costs of the programs (Thelin, 2016). This is shown in another paper, “The Case for
Paying College Athletes,” by John Siegfried and Allen Sanderson. Their report touts possibly the
strongest financial information in regards to growing revenue in the NCAA, but does little to show
any sign of a flat line or a decrease in costs. While they show a revenue trend moving in the right
direction for the overall collegiate market, their inability to show costs hurts their case for the
growing profitability and strength of the universities, which is what they base their argument for
the payment of college athletes on (Sanderson & Siegfried, 2015).
Literature on the Revenue Sources and Trends of the NCAA
The final area of literature that is out there, while in some cases scarce, are articles and
papers that deal directly with the financial side of the NCAA and its members through television
contracts, endorsement deals, and overall revenue trends. Deals between TV networks and the
NCAA and its members are not new, but in years of late, these deals have grown to an exponential
size and have started to make an impact on the overall revenue of the organizations involved. In a
10
press release in 2016, the NCAA announced that they had signed an extension on their contract
with the Turner network and CBS for exclusive coverage of “March Madness”. Though seemingly
innocuous as this is not an uncommon practice, the fact that the contract was for $8.8 billion over
the next sixteen years is where the argument that the NCAA makes enough money to pay their
athletes or subsidize their universities comes into play (NCAA Press Release, 2016). As
viewership of college sports continues to increase, so too will the profits of the NCAA. In addition
to this, individual conferences and schools are signing exclusive deals like the “Longhorn
Network” that Texas signed with ESPN in 2011, and the “SEC Network” signed with CBS shortly
thereafter. These deals not only bring in money, but also bring in increased notoriety which can
indirectly raise admissions and ultimately tuition, boosting the ability of schools to pay their
entertainers.
Similar to the formation of super contracts in media in recent years, sponsors like Nike,
Adidas, and Under Armour have begun to pay larger sums of money and give larger amounts of
merchandise to programs. Of the schools in the Power Five conferences, the contracts with shoe
companies are public for 41 of the 64 schools, and those 41 schools made a combined $127.4
million in 2014. With the recent addition of Nike’s $169 million deal with Michigan that lasts
through 2027, the precedent has been set for more super contracts to come (Gaines, 2014). These
contracts not only bring in millions in cash directly to the programs, but they also generate
merchandise revenue that will continue to flow into the universities’ coffers into the future.
The last two pieces pertaining to the NCAA and the universities a whole, while different
in nature, both provide a good amount of information that shed light on where the collegial market
currently is and where it’s going. The first work, Sanderson’s and Siegfried’s journal, “The Case
for Paying College Athletes,” contains a chart that shows the median revenue of a sample of
11
universities over the course of ten years as well as the increase in average scholarships during that
time period. The median yearly revenue rose from around $28 million to around $63 million during
the period of 2004-2013 while the average number of scholarships per school only raised from
577-611 during that same time period (Sanderson & Siegfried, 2015). Though these numbers seem
to be trending in a very positive direction, the chart doesn’t show the rising costs of running the
programs, the profit margins of programs, or where profits go after they are realized. In the early
stages of the journal, there is something that also seems to directly juxtapose the positive chart,
and that’s the comments that point to the authors’ belief that there may only be twenty or so
programs that are profitable, while the remainder are subsidized. Overall, though the authors argue
the growing strength of the NCAA could lead to the payment of players, their assumption on the
number of profitable schools show more weakness than strength.
The other piece that really takes a deeper look into the finances of the programs, “Are
Division I NCAA WAC Sports Profitable?” is a research article from the International Journal of
Economics, written by Dr. James Schaap of the University of Nevada. The article looks at the
WAC conference, a non-power five athletic conference made up of middle tier Division I programs
that have an FBS football team, fitting the qualifications of teams that will be observed. By
following all of the sports for the schools in the conference for six years, Schaap was able to
determine that the sports other than football and basketball were overwhelmingly unsuccessful, so
much so that their losses overlooked the successes of the profitable and financially stable teams.
While Schaap was simply looking to see if the programs made money, he makes a few comments
at the end of his conclusion that steer researchers in the direction that he does not believe these
programs are worth keeping afloat, let alone pay their athletes (Schaap, 2013). This might have

12
been one of the most important pieces that was researched, as it painted the picture of the financial
situation of the non-power five athletic conferences, which is seemingly negative.
After looking over all of the collected literature and clearing some of the weeds to find real
data, there ended up being a significant amount of valuable information within even the articles
that focused less of data and more on the argument as to whether or not athletes should be paid.
Upon reading multiple plans for payment of student-athletes from pro-payment articles, moving
forward, a base salary of $25,000 will be used when looking at paying athletes. By using a uniform
base, the data will be more comparable across different athletic conferences.
Overall, the literature seemed to support the pre-data hypothesis that less than 50% of the
106 public universities with FBS football teams would be financially strong enough to pay their
players. Though there have been great advances of wealth in terms of endorsements, partnerships
and broadband contracts; that money seems to go to the same large universities that were
continually mentioned by those writing in favor of payments with a “free market” approach
(Nocera, 2016). These universities make up less than half of the total count, and the old adage,
“the rich get richer” seems to be the rule of thumb, which will surely leave the non-Power Five
conferences to be left behind. Additionally, the surprising lack of conversation about any other
sports outside of basketball and football also make it harder to believe that the hypothesis will be
proved wrong (Gregory, 2013). Keeping in mind that the football teams can only give out 85
scholarships and basketball can only give out 13, which means that out of the average 611
scholarships, around 84% of them are not mentioned more than in just passing (Sanderson &
Siegfried, 2015). If that truly is the case, an extra layer of defense falls onto the hypothesis, as it
would seem highly improbable that 16% of the scholarships produce enough revenue and profit to
13
pay all 100% of athletes after being offset by the significant losses of so many other sports,
regardless of the help provided by TV deals and endorsements.
PART III: METHODS & RESULTS
The original idea for the collection of data was to scour each school’s athletic and academic
websites to see if there was any way to find useful financial information that could help with
proving the hypothesis, either right or wrong. There was only one problem with this data collection
strategy, and that is the simple fact that many public schools do not make their financial
information available to the public, and virtually no private schools make their information public.
Obviously this was a setback, but was solved by the discovery of massive amounts of information
on the financial website of the NCAA in the form of annual reports. While this data still did not
include private institutions in the FBS classification such as Notre Dame and BYU, it did include
all of the public universities that are required to file their athletic program’s financials with the
governing body. Of the relevant information found, this thesis will analyze the overall profits of
each program in 2015, the most recent year that has been published by the NCAA, and the actual
profitability of programs broken out by both sport and gender.
Profitability Breakdown by School
The first set of data collected broke out total revenues, expenses, and profits for each of the
public schools with an FBS football team in 2015. The information for 2016 was not used, as the
NCAA doesn’t have a time table for the release of information, and the end of the data collection
was at the beginning of 2017, so the NCAA had not produced the actual numbers for each school
for the previous fiscal year. The total revenues included revenues from ticket sales, apparel sales,
endorsements, television deals and donations from alumni directly to the programs. In order to not

14
only look at the overall profitability of the schools on an individual basis, I also broke the
information up by each of the conferences. There are two categories of conferences: the ‘Power
Five’ conferences, including: the Big-12, the Big-10, the Pac-12, the ACC, and the SEC; and the
largest five of the remaining conferences in the FBS division. By breaking it down this way, the
data was able to show not only how each school performed individually, but also show any trends
amongst the larger schools verses the smaller schools, which should have been able to help support
the theory that only those schools who were large enough to get the largest contracts and donations
would be able to attain profitability.
The initial screening of the schools themselves did not support the hypothesis that less than
50% of the schools would be profitable enough to pay their athletes, with a surprising 71 of the
106 school showing profitability, an impressive 67%. A further look though, showed that of those
71 profitable schools, only 26 of them had a gross profit margin greater than 5%, showing, that
while the number of profitable schools was actually greater than expected, a large part of that
number was only marginally profitable and would struggle to pay all of their athletes any salary at
all, let alone a salary of $25,000 a year (Fulks, 2016). In fact, when looking at the top fifteen most
profitable schools in terms of the gross profits, if you take their profits and divide by the average
611 student athletes on a college campus, only six schools could pay their athletes a salary greater
than $25,000, and all of those schools came from Power Five conferences. The chart on the next
page lists out the top fifteen schools ranked by profitability, and then shows the maximum potential
salary each student athlete could receive, under the assumption that all of the excess profits go to
the student athletes in the form of salaries, as all other expenses that need to be covered by the
programs are included in the total expenses. Realistically, this number could be on the higher end
as it is unlikely that all profits generated would go to the athletes.

15
Figure 1: Information Extracted from NCAA Division I Intercollegiate Athletics Programs Report, Fulks , 2016
The lack of schools from the non-Power Five conferences in the list of the most profitable
schools was not unexpected, but the severity of the absence was something that guided the next
two steps of the data analysis. The first step was to analyze the profits of the schools filtered by
conference in order to see how wide the gap was between the haves and have-nots in terms of
conference power. It quickly became apparent just how large the disparity from the rich to the poor
truly was. With the larger conferences able to wield the power of their programs to grab enticing
and successful endorsement deals and television deals, the difference was staggering. Observing
only at revenues as to look solely at the money generating ability of the schools rather than their
cost structures, the comparison of one of the weaker Power Five conferences, the Pac-12, and its
mean revenue of $81,255,208; opposed to the strongest of the non-Power Five, the Mountain West,
and its mean revenue of $39,008,493, show the vast difference between the larger and smaller
conferences.
School Conference Total Revenue Total Expenses Total Profits Salary / Athlete
Texas A&M SEC $192,608,876 $109,313,651 $83,295,225 $136,326
Florida SEC $147,105,242 $125,384,443 $21,720,799 $35,550
Georgia SEC $116,151,279 $96,559,307 $19,591,972 $32,065
Arkansas SEC $114,172,847 $97,106,539 $17,066,308 $27,932
LSU SEC $138,642,237 $121,947,775 $16,694,462 $27,323
Alabama SEC $148,911,674 $132,354,913 $16,556,761 $27,098
Tennessee SEC $126,584,033 $113,413,325 $13,170,708 $21,556
Ohio State Big-10 $167,166,065 $154,033,208 $13,132,857 $21,494
Oklahoma Big-12 $134,269,349 $123,017,251 $11,252,098 $18,416
Texas Big-12 $183,521,028 $173,248,133 $10,272,895 $16,813
Florida State ACC $120,822,522 $111,386,681 $9,435,841 $15,443
Auburn SEC $124,657,247 $115,498,047 $9,159,200 $14,991
Kansas State Big-12 $75,323,278 $67,316,209 $8,007,069 $13,105
Air Force MWC $50,191,669 $43,481,337 $6,710,332 $10,983
Arizona Pac-12 $87,135,331 $80,706,405 $6,428,926 $10,522
16
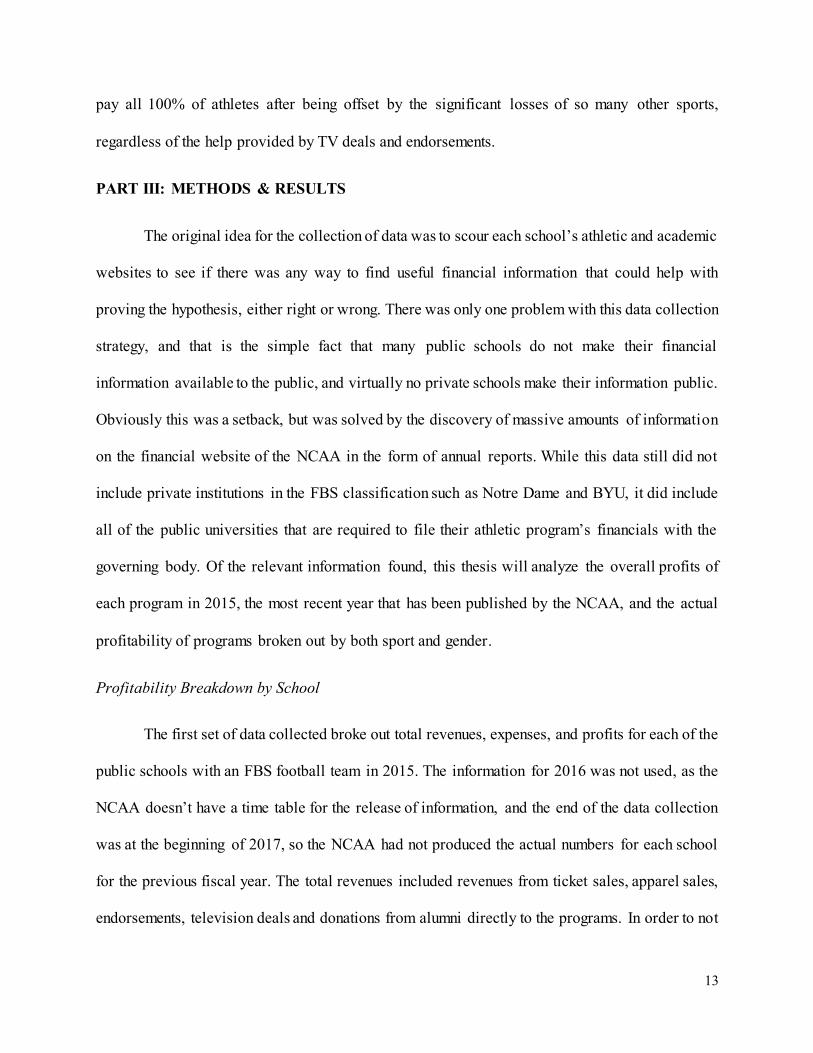
Figure 2: Information Extracted from NCAA Division I Intercollegiate Athletics Programs Report, Fulks, 2016
The graph above shows the highest revenue produced by a program in each conference as
well as the average revenue produced by all of the schools that compete in the respective
conferences. A quick glance at the data shows overwhelmingly that the larger conferences hold all
of the revenue generating power in the NCAA. This information, coupled with the chart displaying
the top fifteen most profitable schools, shows that there is very little chance that the smaller
conferences would be able to pay their college athletes.
After viewing the given information on the schools and the conferences, I decided to look
into some drivers that could potentially give reason for the large gap, and possibly determine what
brought home the revenues for the more powerful schools as opposed to the schools in the weaker
conferences. The step taken to look at this was to perform a single variable regression between the
revenues of the school and another factor that could drive the schools revenues. When looking into
the other variables, two different drivers came to mind, the number of students on campus and the
success of the athletic program. For the variables, I decided to use student body population in 2015

17
for the first driver, and number of football championships in the past one hundred years for the
performance of the programs. While one hundred years dates back very far and may not show
overall strength of a program in current day, this was done to have a sufficient sample size.
Championships were used as opposed to wins because after a quick screening, schools that have
more championships have more donations regardless of the number of wins in recent history. An
example of this would be the University of Texas and its football program of late compared to its
donation totals. After running the two regressions, the regression that showed the highest
correlation with the revenues of the schools was that of the student body size.
Figure 3: Regression Performed with Information from both the NCES and the NCAA
While not overwhelmingly correlated, the R Squared at roughly 35% was much larger than
the performance driven regression which showed an R Squared of less than 10%. Though the
student population regression may seem intuitive as a larger school can provide larger ticket sales
Slope = .000016 Student/USD
($6,022 USD / Student)
Y-Intercept = 19,278 Students
R Squared = 35%

18
and higher apparel sales, that’s not the only reason why this is true. Further investigation showed
that the larger schools and more profitable schools were those who had larger alumni bases that
could donate a larger total sum of money back to each campus, boosting their revenues and helping
profitability. For example, the University of Texas, which has struggled in years past athletically,
but has a population of roughly 50,000 students, was able to raise over $850 million total in 2014
alone, with a large portion going to the athletics program (Texas, 2015). Compare this donation
total to a school like Clemson that only has a student population of roughly 23,000, and it’s not
close. Clemson, after going to the National Championship for College Football in 2015, raised
only $136 million, which was a new record for the university (Denny, 2015). Though each school
may be able to gain a larger number of revenues from various sources, none of the top 10 schools
in terms of revenues had enrollment numbers lower than 30,000. With 61,000 students and one of
the larger alumni bases in the country, Texas A&M led the charge, followed by the powerhouse
schools of the Big-10, Ohio State and Michigan, each with populations of 58,000 and 43,700
respectively (National Center for Education Statistics, 2016).
Profitability Breakdown by Gender and Sport
The other segment of data collected from the NCAA and its respective members pertained
to the profitability of each individual sport as a whole and the profitability of men’s and women’s
sports. While not exactly in line with the actual hypothesis of whether or not college athletes as a
whole could be paid, the data seemed pertinent to the discussion, as much of the literature around
the topic did nothing to discuss the profitably of female sports, the payment of female athletes, nor
the profitability of any sport other than football and basketball.
The first part of this data section will look at the profitability of women’s athletic programs
over the course of six years (Fulks, 2011-2016). This segment of the information was largely not

19
broken out by the NCAA to show year over year growth from sport to sport, but there was still
enough helpful information about the gender breakdown of profitability to get conclusions. The
data in the following charts shows whether or not a school reported a profit or a loss for a given
year and the percent of schools that showed as such, as well as the median profits, broken down
by gender.
Figure 4: Tables above were created using data extracted from NCAA Division I Intercollegiate Athletics Programs Report from 2010-2015
Looking at the data, it is obvious that not only are women’s sports less profitable than
men’s sports, they are not profitable at all from a holistic standpoint. From 2010-2015, not a single
school in Division 1 reported a profit for their women’s athletic teams and programs. In
comparison, the same data collection style for men’s programs shows that about half of Division
1 schools report their men’s programs as profitable. Additionally, while the men’s median profit
is growing year over year and has done so for all years in the sample, the median profit for women’s
sports has continually decreased year over year during the same time period.
Women's ProgramsRevenues Exceeded Expenses Expenses Exceed Revenues
Year Schools % Total Median Profit Year Schools % Total Median Profit
2015 0 0% -$ 2015 128 100% (8,477,000)$
2014 0 0% -$ 2014 125 100% (8,449,000)$
2013 0 0% -$ 2013 123 100% (7,450,000)$
2012 0 0% -$ 2012 120 100% (7,325,000)$
2011 0 0% -$ 2011 120 100% (6,937,000)$
2010 0 0% -$ 2010 120 100% (6,353,000)$
Men's ProgramsRevenues Exceeded Expenses Expenses Exceed Revenues
Year Schools % Total Median Profit Year Schools % Total Median Profit
2015 63 49% 18,867,000$ 2015 65 51% (8,422,000)$
2014 61 49% 16,783,000$ 2014 64 51% (7,134,000)$
2013 62 50% 14,975,000$ 2013 61 50% (6,636,000)$
2012 60 50% 14,661,000$ 2012 60 50% (5,670,000)$
2011 63 53% 11,743,000$ 2011 57 48% (5,233,000)$
2010 63 53% 14,359,000$ 2010 57 48% (5,176,000)$
20
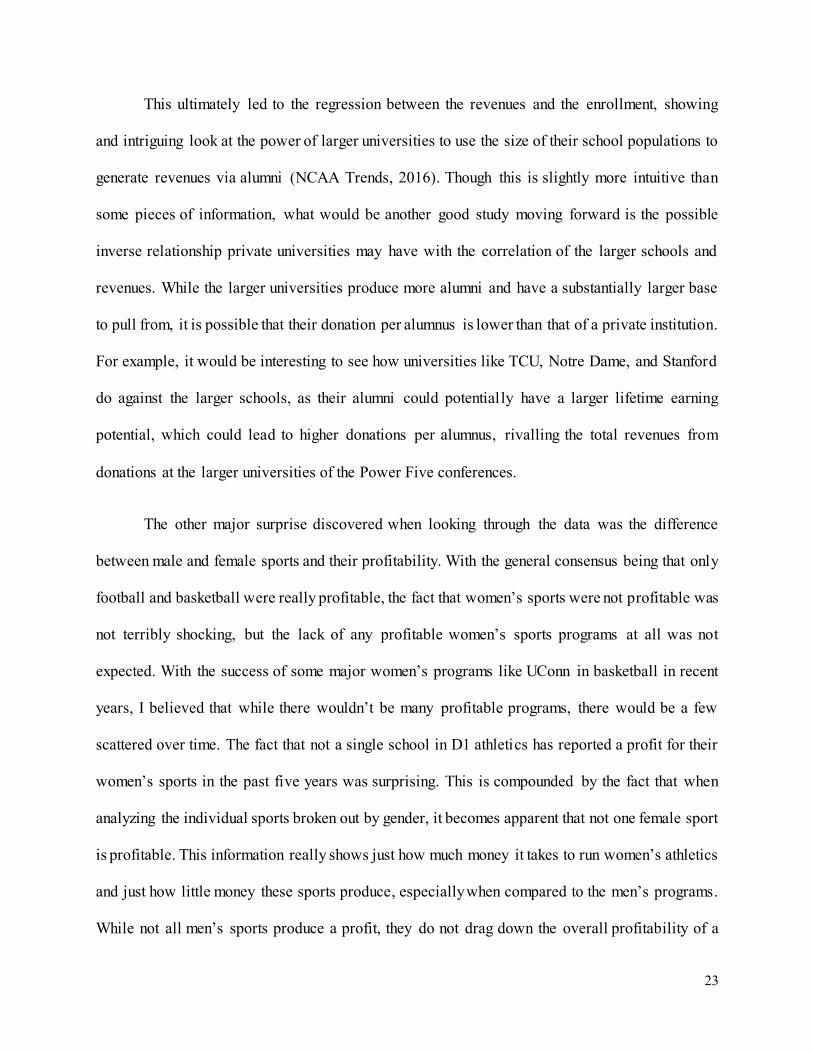
The other part of the data that was broken out by gender looked at the median profits of
each sport. The profits in this chunk of information are found differently than that of the early data
sets. As opposed to total revenue, which includes all revenues gained by different athletic
programs, this data uses generated revenue which is revenues generated from the sport itself. This
includes ticket sales, concession sales, and in stadium apparel sales. This metric is used for the
breakdown of various sports as it shows more of the operating revenues of the sports individually
as opposed to the donations for each program and the distribution of revenue from things like TV
deals.
Figure 5: Table above was created using data extracted from NCAA Division I Intercollegiate Athletics Programs Report from 2010-2015
You can see that with generated revenues as the metric as opposed to the total, the only
male sport that is profitable is college football. College basketball is only profitable in total revenue
settings as the sport generates much of its revenues from deals in relation to the March Madness
Tournament. This just shows that even when looking at the profitability of men’s sports, the only
reason that a decent amount of them are able to stay afloat is due to the ability of football to pull
Men's Programs Women's Programs
Sport Generated Revs. Expenses Profits
Baseball $440,000 $1,664,000 -$1,224,000
Basketball $5,712,000 $5,808,000 -$96,000
Fencing $30,000 $256,000 -$226,000
Football $21,602,000 $16,385,000 $5,217,000
Golf $90,000 $576,000 -$486,000
Gymnastics $93,000 $776,000 -$683,000
Ice Hockey $882,000 $2,496,000 -$1,614,000
Lacrosse $668,000 $1,711,000 -$1,043,000
Rifle $0 $43,000 -$43,000
Skiing $53,000 $528,000 -$475,000
Soccer $122,000 $1,001,000 -$879,000
Swimming $85,000 $1,002,000 -$917,000
Tennis $67,000 $630,000 -$563,000
Track / CC $70,000 $1,043,000 -$973,000
Volleyball $138,000 $824,000 -$686,000
Water Polo $204,000 $708,000 -$504,000
Wrestling $127,000 $1,007,000 -$880,000
Other $176,000 $619,000 -$443,000

21
more than its share of the weight. When looking at the women’s sports, it comes as no surprise
that there are no profitable sports, which matches with the data suggesting that no women’s
program has turned a profit in this decade. Something additional to note though, is the amount of
female sports, which is much larger than male sports due to the number of scholarships that need
to be provided to female athletes in order to match the scholarships given out to football players.
This generally hurts the ability of the female sports programs as a whole to be profitable, as on
average, eleven women’s sports generate a net loss greater than $1 million, which is greater than
the three men’s sports in the same category. This is in line with previous findings that the average
women’s athletic program is seeing increased losses year over year, especially when compared to
men’s athletic programs.
Figure 5: Table above was created using data extracted from NCAA Division I Intercollegiate Athletics Programs Report from 2010-2015
Women's Programs
Sport Generated Revs. Expenses Profits
Basketball $328,000 $2,861,000 -$2,533,000
Bowling $24,000 $359,000 -$335,000
Crew $116,000 $1,557,000 -$1,441,000
Equestrian $139,000 $1,772,000 -$1,633,000
Fencing $51,000 $424,000 -$373,000
Field Hockey $48,000 $1,092,000 -$1,044,000
Golf $73,000 $564,000 -$491,000
Gymnastics $116,000 $1,206,000 -$1,090,000
Ice Hockey $224,000 $1,913,000 -$1,689,000
Lacrosse $167,000 $1,264,000 -$1,097,000
Rifle $29,000 $72,000 -$43,000
Rugby $71,000 $219,000 -$148,000
Sand Volleyball $16,000 $202,000 -$186,000
Skiing $54,000 $580,000 -$526,000
Soccer $101,000 $1,175,000 -$1,074,000
Softball $114,000 $1,155,000 -$1,041,000
Swimming $70,000 $1,048,000 -$978,000
Tennis $54,000 $688,000 -$634,000
Track / CC $87,000 $1,279,000 -$1,192,000
Volleyball $106,000 $1,229,000 -$1,123,000
Water Polo $61,000 $844,000 -$783,000
Other $36,000 $345,000 -$309,000

22
PART IV: DISCUSSION OF FINDINGS
After collecting and analyzing the data, the results ruled heavily in favor of the original
hypothesis that less than 50% of Division 1 schools could pay their athletes a salary of $25,000
per year. While the number of schools that were profitable at all was surprisingly high at 71 total
of the 106 schools surveyed, the actual number of those who could generate enough profit for the
given salary, one that is often identified as ideal by those with knowledge on the subject, was
abysmally low. With only 5.5% of schools able to pay their athletes the predetermined salary, it is
relatively safe to say that the ability of the athletic programs as a whole to support the payment of
student athletes is not going to happen any time soon without substantial help in the form of
subsidies. That being said there were pieces of the information that did differ from both the original
hypothesis and the thoughts after performing the literature review.
There were two points of data that were off from the original expectations, the first being
the disparity between the larger conferences and the smaller conferences and their ability to
generate revenues. After reading and digesting the earlier report over the profitability of the WAC,
it did not come as a shock that the smaller conferences analyzed in this research such as the Sun
Belt and the MAC had lower revenues and profits, but the gap between those conferences and the
Power Five was more than expected. The original thought was that while there would be a
difference in the two as a result of the endorsement deals, donations and televisions deals, the gap
would not be particularly large as the understanding was that no schools, regardless of the size,
really generated many revenues due to the fact that only one or two of their sports would actually
make money. The difference of around $50 million in average revenue between the weakest of the
Power Five and the strongest of the lower divisions was interesting to say the least and lead to the
search for drivers of this disparity.
23
This ultimately led to the regression between the revenues and the enrollment, showing
and intriguing look at the power of larger universities to use the size of their school populations to
generate revenues via alumni (NCAA Trends, 2016). Though this is slightly more intuitive than
some pieces of information, what would be another good study moving forward is the possible
inverse relationship private universities may have with the correlation of the larger schools and
revenues. While the larger universities produce more alumni and have a substantially larger base
to pull from, it is possible that their donation per alumnus is lower than that of a private institution.
For example, it would be interesting to see how universities like TCU, Notre Dame, and Stanford
do against the larger schools, as their alumni could potentially have a larger lifetime earning
potential, which could lead to higher donations per alumnus, rivalling the total revenues from
donations at the larger universities of the Power Five conferences.
The other major surprise discovered when looking through the data was the difference
between male and female sports and their profitability. With the general consensus being that only
football and basketball were really profitable, the fact that women’s sports were not profitable was
not terribly shocking, but the lack of any profitable women’s sports programs at all was not
expected. With the success of some major women’s programs like UConn in basketball in recent
years, I believed that while there wouldn’t be many profitable programs, there would be a few
scattered over time. The fact that not a single school in D1 athletics has reported a profit for their
women’s sports in the past five years was surprising. This is compounded by the fact that when
analyzing the individual sports broken out by gender, it becomes apparent that not one female sport
is profitable. This information really shows just how much money it takes to run women’s athletics
and just how little money these sports produce, especially when compared to the men’s programs.
While not all men’s sports produce a profit, they do not drag down the overall profitability of a

24
program as severely as their female counterparts do. This fact alone would make the payments
hard, due to the fact that in order to pay athletes on campus, you have to pay all athletes, not just
men that are on teams that generate profits. This would be increasingly hard to justify for the half
of college athletics made up of women’s sports that have continually increased losses since 2010
and show no sign of righting the ship in the near future.
In addition to several surprises in the data, the study opened door for a few other topics that
would be interesting to see in future studies. The first would be to see how major Division 1
programs that are private institutions fare against the larger public institutions. This would be
particularly interesting to see how the alumni base interacts with the campus in terms of their
donations and revenue generating abilities for the programs. As previously stated, it could be
argued that alumnus from private schools could have a larger donation potential and be more
involved in the fundraising arena as there is a smaller and possibly closer knit group of people to
take charge of this. A study into the private institutions in terms of recent performance and their
profitability would be noteworthy as well. In the most recent years, schools such as TCU, Baylor,
and Stanford have done very well in the college football space, the largest revenue producer. With
this recent success, it would be interesting to see if the donation totals have increased and if so,
how the profitability of the programs have been affected. A deeper dive into private schools would
also allow for researchers to view the past performance of schools like Notre Dame and Miami
who have more storied programs and could have potentially seen a run up profitability similar to
that of the newer programs, decades ago.
The other topic that could be really looked into given more information would be the cost
structure of the programs and universities. For this particular study, not enough information was
given by the NCAA or its members to really look at how each school operates, but this data could
25
be collected if a future study was granted access to each individual school’s ledgers. One thing
that was noted was that while some of the top revenue earners were from the Big-10 conference,
such as Michigan and Ohio State, the top seven most profitable schools were from the SEC. In
comparison, from the Big-10, only Ohio State was in the top fifteen most profitable schools.
Having more information on costs could lead to more explanation as to why teams from
conferences in southern states are seemingly more profitable than teams in the northern
conferences. Additionally, having more insight into the accounting of these programs could help
look into programs like the University of Alabama Birmingham. UAB recently shut down its
football program, citing that the program made no money. Upon further inspection though, it
actually turned out that the cost structure of the program prohibited the teams from being able to
capitalize on the revenues that they generated (Rascher & Schwarz, 2015). By understanding
examples like UAB, and looking into all of the FBS schools, the door could be opened to more
profitable programs, allowing for the payment of college athletes.
Moving forward, there are limitless variations of this research and thesis that could take
place in order to answer the same questions I set out to answer. In this report, I looked only at the
overall profitability of the schools themselves and held constant a multitude of factors such as the
cost structure and the ability of the NCAA to reduce scholarships to aid payments. Currently the
NCAA brings in over $1 billion a year in revenues, almost all of which is distributed in the form
of scholarships to the student athletes. As the debate continues, the odds that the organization as a
whole reviews its distribution plan will more than likely increase, and this could be a potential area
for further research.

26
PART V: IMPLICATIONS
Following the analysis of the data, it is possible that the results could make a major mark
on the current ethical argument in the world of whether or not college athletes should be paid. With
many in the nation citing large television deals, endorsements, and ticket and apparel sales as the
main drivers for the argument of paying college athletes, there is little focus on the actual profits
gained from these revenues. By not discussing the large costs that come with the revenues and the
lack of revenues from the majority of the other sports, there is little substance to many opinion
based arguments. It becomes increasingly more difficult for the pro-pay arguments to stand when
the actual profits of the programs as a whole as found in this study are matched up with each
opinion based piece.
Additionally, most of the literature around this topic that argue points for the payment of
athletes only focus on a select number of universities that are widely known as some of the
powerhouses in the nation. Though some of these programs could stand to support a salary for
their athletes, it is because of their status as the college athletic juggernauts that they are able to
generate large donations and endorsements, and they are in the minority. The vast majority of
programs at even the highest of levels within the Power Five conferences cannot generate the
revenues needed to offset the costs of operations to the point that they could pay athletes,
something that is commonly left out of the ethical argument.
Furthermore, when comparing this data to some of the “free market” rhetoric that is wished
for by many who have an understanding of this topic, it becomes apparent that my original thought
of the “rich get richer” would be increasingly more relevant as the powerhouse programs would
surely thrive. While there was little correlation between championships and revenues, a free market
27
approach could definitely increase the chances of that correlation becoming a relevant factor in the
college sports world. With the majority of the top earners in terms of both revenues and profits
already coming from schools that historically enjoy success, this could eliminate the possibility of
schools from lower tiers or even smaller schools in the larger conferences from being able to
compete for championships. Since the year 2000, fourteen of the national championships for
college football have been won by teams that are in the top fifteen most profitable schools (NCAA
Trends, 2016). Under a free market system, this trend would surely continue to increase, as teams
that produce the most profit would be able to offer the most lucrative contracts to the nation’s top
players, allowing these programs to see continued success.
The other major implication of a free market system would be the complications that would
arise from Title IX and the payment of female athletes. With no female programs being profitable,
there would be no payment for the women who make up those teams. If schools paid their players
based off of the profits produced, the lack of profits in women’s sports would equate to no salary,
much like that of a company that makes no money. This produces a complication with Title IX,
which dictates that there be as many female scholarships awarded to women as there are to men,
and would definitely argue for equal pay. Even outside of Title IX, it would be very challenging
to tell a program like the UConn Women’s basketball team, who has won six of the last ten national
championships and won a record 111 straight games, that they will either make no money or very
little money. That hardly seems like a system that would foster growth for women’s athletics or
the development of opportunities for female athletes to attend college, especially when compared
to a hypothetical men’s football team that has produced few wins but is slightly profitable due to
donations that have been shored up since the team’s glory days twenty years ago.

28
This argument has already begun on a professional level with the underpayment of the US
Women’s National Soccer team, which is widely known as one of the top teams in the world,
winning numerous championships. The women on the team make a sizeable amount less than the
players on the men’s national team, which has never attained the success of its counterpart. That
argument has begun to catch on in recent years, and only concerns the salaries of less than thirty
women. One can only imagine the discussion that would occur if that argument were to take place
on the magnified scale that college athletics would provide.
PART VI: CONCLUSION
As long as college athletics remain a major revenue producer for both their respective
schools and the NCAA, the discussion of whether or not the athletes should be paid will continue
to be a hot topic. In researching the topic and writing this paper, I analyzed and discussed the
profitability of Division 1 athletic programs with an FBS football team to see whether or not this
discussion, which is highly debated from an ethical stand point, held any ground in an objective
setting. The original thought process for selecting this as a question to research was to see if there
was a way to answer the subjective question with hard evidence and data. In order to answer that
question, my original hypothesis was that less than 50% of the programs could pay their athletes a
relatively moderate annual salary of $25,000, with the understanding that if the hypothesis was
correct and less than half could pay their athletes, then there would be less of a need for any ethical
debate.
Looking through an initial screening of literature on the topic, I quickly realized that most
discussion on the topic was not academic in nature and contained spotty data used solely to argue
a specific side of the aisle, whether or not athletes deserved salaries or if scholarships were enough.

29
Even with the limited data available from these sources, it was relatively easy to get an idea of
what sports were generally accepted as revenue producing, which was the very small selection of
only football and basketball. While revenues do not always mean profits, the sheer number of non-
revenue producing sports in the college athletic realm was reassuring that the overall number of
profitable programs would be small regardless of the emergence of new forms of revenue
generation such as endorsements.
Upon actually collecting and analyzing the data, I was initially surprised as nearly two
thirds of programs in the sample were in fact profitable, but found that when looking at the numbers
of schools who produce any significant amount of profits, the number drastically decreased, falling
in line with the original expectations. With only six programs profitable enough to actually pay
out salaries to all of the athletes on their campus’, the data quickly went from surprisingly in
opposition of the hypothesis to surprisingly in favor of the hypothesis, alluding to the fact that the
50% mark was actually too high. In addition to this, further data was collected to see the disparity
between men’s and women’s sports, as well as to really take a deeper dive into what was driving
the lack of revenues. This yielded information that supported my original thoughts from the literary
review, that only football and basketball were profitable, and only men’s programs were profitable.
As it stands now, the data analyzed in this study overwhelmingly supports the original
hypothesis, proving that the current operations of the NCAA and the colleges in the Division 1 tier
of athletics, there is no way to pay athletes from the profits of the athletic programs themselves.
Additionally, the data related to the gap between the conference have’s and have not’s, as well as
the difference in men’s and women’s sports showed the potential for conflict if the NCAA was to
move to a system of payment that truly operated like the business world without the subsidies or
intervention of the organization as a whole.

30
PART VII: REFERENCES
Chudacoff, H. P. (2016, March 28). Let’s Not Pay College Athletes. Retrieved from Wall Street
Journal: http://www.wsj.com/articles/lets-not-pay-college-athletes-1459206949
Denny, R. S. (2015, July 20). Clemson Newsstand. Retrieved from
www.newsstand.clemson.edu: www.newsstand.clemson.edu/mediarelations/clemson-
university-marks-record-year-of-donations-capital-campaign-passes-900-million/
Fulks, D. L. (2011). Division I Intercollegiate Athletics Report 2004-2010. Indianapolis: NCAA.
Fulks, D. L. (2012). Division I Intercollegiate Athletics Report 2004-2011. Indianapolis: NCAA.
Fulks, D. L. (2013). Division I Intercollegiate Athletics Report 2004-2012. Indianapolis: NCAA.
Fulks, D. L. (2014). Division I Intercollegiate Athletics Report 2004-2013. Indianapolis: NCAA.
Fulks, D. L. (2015). Division I Intercollegiate Athletics Report 2004-2014. Indianapolis: NCAA.
Fulks, D. L. (2016). Division I Intercollegiate Athletics Report 2004-2015. Indianapolis: NCAA.
Gaines, C. (2014, September 12). The Amount Of Money Shoe Companies Are Paying Schools
To Wear Their Products Is Staggering. Retrieved from www.businessinsider.com:
http://www.businessinsider.com/ shoe-companies-paying-schools-nike-under-armour-
adidas-2014-9
Gregory, S. (2013, September). It's Time to Pay College Athletes. Time Magazine.
Lawrence, P. (1982). The Intercollegiate Athletic Cartel: The Economics, History, Institutions,
and Legal Arrangement of the National Collegiate Athletic Association. Virginia
Polytechnic Institute and State University.

31
National Center for Education Statistics. (2016, May). Retrieved from nces.ed.gov:
www.nces.ed.gov/programs/coe/indicator_cha.asp
NCAA. (2016, April 12). Turner, CBS and the NCAA Reach Long-Term Multimedia Rights
Extension for NCAA Division I Men's Basketball Championship. Retrieved from
www.ncaa.com: http://www.ncaa.com/news/basketball-men/article/2016-04-12/turner-
cbs-and-ncaa-reach-long-term-multimedia-rights
NCAA. (2016). Twelve Year Trends in Division I Athletics Finances. Indianapolis: NCAA.
Nocera, J. (2016, January 8). A Way to Start Paying College Athletes. Retrieved from New York
Times: from https://www.nytimes.com/2016/01/09/sports/a-way-to-start-paying-college-
athletes.html
Rascher, D. P., & Schwarz, A. P. (2015). The Incremental Benefits and Costs of Football,
Bowling, and Rifle at the University of Alabama at Birmingham. OSKR.
Sanderson, A., & Siegfried, J. (2015). The Case for Paying College Athletes. Journal of
Economic Perspectives, 115-138.
Sanderson, A., & Siegfried, J. (2016, February 4). Enough Madness: Just Pay College Athletes.
Retrieved from Chicago Tribune: http://www.chicagotribune.com/news/opinion
/commentary/ct-ncaa-athletes-pay-sports-college-perspec-0203-20160202-story.html
Schaap, J. (2013). Are Division I NCAA WAC Sports Profitable? University of Nevada.
Strauss, B. (2015, August 17). N.L.R.B. Rejects Northwestern Football Players' Union BId.
Retrieved from New York Times:

32
https://www.nytimes.com/2015/08/18/sports/ncaafootball/nlrb-says-northwestern-
football-players-cannot-unionize.html?_r=0
Texas, University. of. (2015, December 11). UT Austin Raises Record $856 Million in Final
Year of $3 Billion Campaign to Support Students and Excellence. Retrieved from UT
News: www.news.utexas.edu/2014/09/02
Thelin, J. (2016, March 1). Here's Why We Shouldn't Pay College Athletes. Retrieved from
Money: http://time.com/money/4241077/why-we-shouldnt-pay-college-athletes/