The economic cost of infertility-related services: an examination of the Massachusetts infertility...
8
The economic cost of infertility-related services: an examination of the Massachusetts infertility insurance mandate Martha Griffin* and William F. Panak, Ph.D. University of Rhode Island, Kingston, Rhode Island, and University of Northern Iowa, Cedar Falls, Iowa Objective: To examine the costs and outcomes of infertility-related services in Massachusetts during a time of expanded use of assisted reproductive technology (ART). Design: Cost data were obtained from the Massachusetts Department of Insurance Rate-Setting Commission and 9 large group insurance plans for the period 1986 –1993. Utilization and success rates of ART were examined, and the cost per live delivery with the use of ART in 1993 was estimated. Setting: The state of Massachusetts, in which access to infertility-related services has been mandated by law since 1989. Patient(s): The study population consisted of 8 large health maintenance organization plans and the Blue Cross/Blue Shield indemnity plan. Intervention(s): None. Main Outcome Measure(s): Per capita infertility-related expenditures, infertility-related expenditures as a percentage of total expenditures, live deliveries per initiated ART cycle, and cost per live delivery. Result(s): Expenditures for infertility services increased at a rate similar to or slower than inflation during the years 1988 –1992. Increases were slowest in health maintenance organizations, probably as a result of provider arrangements. Infertility services accounted for 0.41% of total expenditures within the indemnity plan in 1993 (approximately $1.71 per contract-month). Examination of ART utilization showed no evidence of overutilization by patients with a low chance of success. The cost per live delivery with the use of ART in 1993 was $59,484. Conclusion(s): Mandated infertility coverage was associated with increased use of ART but not with excessive increases in consumer cost for infertility insurance coverage. (Fertil Sterilt 1998;70:22–9. ©1998 by American Society for Reproductive Medicine.) Key Words: Infertility, insurance, IVF, in vitro fertilization, IVF registry, HMO The cost of medical care in the United States currently accounts for approximately 13% of the gross national product, or about $1 trillion (1). Policy makers, economists, medical pro- fessionals, and bioethicists have become in- creasingly concerned over the high rate of medical cost inflation during the past decade (2). This concern has led to debate on a funda- mental question in health care policy: can we as a nation increase access to health care or must we move toward rationing of health care (3)? One area of medical care that often is in- cluded in a discussion of rationing is the diag- nosis and treatment of infertility, especially the treatment of infertility with the use of IVF and related assisted reproductive technologies (ARTs) (4, 5). Recently, Neumann et al. (6) attempted to quantify the economic impact of IVF services by estimating the cost per live delivery with the use of this technology. Their estimated cost per live delivery ranged from a base estimate of $66,667 (base case assump- tions, success in the first IVF cycle) to a high estimate of $800,000 (base case cost assump- tion for women .40 years old with accompa- nying male factor infertility, success in the fifth IVF cycle). An alternative approach to estimat- ing the medical cost of IVF focuses on the cost of providing insurance coverage for these ser- vices within group insurance plans (7). This estimate, based on current utilization of IVF on a national basis, suggests that the monthly cost of providing insurance coverage for IVF ser- Received September 30, 1997; revised and accepted January 13, 1998. Supported by a contract from RESOLVE (M.G.). Reprint requests: Martha Griffin, Ph.D. Candidate, College of Nursing, White Hall, University of Rhode Island, Kingston, Rhode Island 02881-0814 (FAX: 401-874-2061). * College of Nursing, University of Rhode Island. Department of Psychology, University of Northern Iowa. INFERTILITY FERTILITY AND STERILITYt VOL. 70, NO. 1, JULY 1998 Copyright ©1998 American Society for Reproductive Medicine Published by Elsevier Science Inc. Printed on acid-free paper in U.S.A. 0015-0282/98/$19.00 PII S0015-0282(98)00107-1 22
-
Upload
martha-griffin -
Category
Documents
-
view
213 -
download
1
Transcript of The economic cost of infertility-related services: an examination of the Massachusetts infertility...

The economic cost of infertility-relatedservices: an examination of theMassachusetts infertility insurancemandate
Martha Griffin* and William F. Panak, Ph.D.†
University of Rhode Island, Kingston, Rhode Island, and University of Northern Iowa, Cedar Falls, Iowa
Objective: To examine the costs and outcomes of infertility-related services in Massachusetts during a time of expandeduse of assisted reproductive technology (ART).
Design: Cost data were obtained from the Massachusetts Department of Insurance Rate-Setting Commission and 9 largegroup insurance plans for the period 1986–1993. Utilization and success rates of ART were examined, and the cost per livedelivery with the use of ART in 1993 was estimated.
Setting: The state of Massachusetts, in which access to infertility-related services has been mandated by law since 1989.
Patient(s): The study population consisted of 8 large health maintenance organization plans and the Blue Cross/Blue Shieldindemnity plan.
Intervention(s): None.
Main Outcome Measure(s): Per capita infertility-related expenditures, infertility-related expenditures as a percentage oftotal expenditures, live deliveries per initiated ART cycle, and cost per live delivery.
Result(s): Expenditures for infertility services increased at a rate similar to or slower than inflation during the years1988–1992. Increases were slowest in health maintenance organizations, probably as a result of provider arrangements.Infertility services accounted for 0.41% of total expenditures within the indemnity plan in 1993 (approximately $1.71 percontract-month). Examination of ART utilization showed no evidence of overutilization by patients with a low chance ofsuccess. The cost per live delivery with the use of ART in 1993 was $59,484.
Conclusion(s): Mandated infertility coverage was associated with increased use of ART but not with excessive increasesin consumer cost for infertility insurance coverage. (Fertil Sterilt 1998;70:22–9. ©1998 by American Society forReproductive Medicine.)
Key Words: Infertility, insurance, IVF, in vitro fertilization, IVF registry, HMO
The cost of medical care in the United Statescurrently accounts for approximately 13% ofthe gross national product, or about $1 trillion(1). Policy makers, economists, medical pro-fessionals, and bioethicists have become in-creasingly concerned over the high rate ofmedical cost inflation during the past decade(2). This concern has led to debate on a funda-mental question in health care policy: can weas a nation increase access to health care ormust we move toward rationing of health care(3)?
One area of medical care that often is in-cluded in a discussion of rationing is the diag-nosis and treatment of infertility, especially thetreatment of infertility with the use of IVF andrelated assisted reproductive technologies
(ARTs) (4, 5). Recently, Neumann et al. (6)attempted to quantify the economic impact ofIVF services by estimating the cost per livedelivery with the use of this technology. Theirestimated cost per live delivery ranged from abase estimate of $66,667 (base case assump-tions, success in the first IVF cycle) to a highestimate of $800,000 (base case cost assump-tion for women.40 years old with accompa-nying male factor infertility, success in the fifthIVF cycle). An alternative approach to estimat-ing the medical cost of IVF focuses on the costof providing insurance coverage for these ser-vices within group insurance plans (7). Thisestimate, based on current utilization of IVF ona national basis, suggests that the monthly costof providing insurance coverage for IVF ser-
Received September 30,1997; revised andaccepted January 13,1998.Supported by a contractfrom RESOLVE (M.G.).Reprint requests: MarthaGriffin, Ph.D. Candidate,College of Nursing, WhiteHall, University of RhodeIsland, Kingston, RhodeIsland 02881-0814 (FAX:401-874-2061).* College of Nursing,University of Rhode Island.† Department ofPsychology, University ofNorthern Iowa.
INFERTILITY FERTILITY AND STERILITY tVOL. 70, NO. 1, JULY 1998
Copyright ©1998 American Society for Reproductive MedicinePublished by Elsevier Science Inc.
Printed on acid-free paper in U.S.A.
0015-0282/98/$19.00PII S0015-0282(98)00107-1
22

vices is approximately $0.26, or less than 0.1% of the totalhealth care premium in the typical family health care benefitsplan.
Each type of cost model has strengths and weaknesses.The model used by Neumann et al. (6) provides a baselineestimate of the cost of successful treatment of infertility withthe use of IVF. However, it is important to compare theseestimates with actual costs for a variety of treatments. Anal-ysis of actual expenditures suggests that the model used byNeumann et al. (6) overestimates the cost of a successfuldelivery using IVF (8), and comparative cost analyses havesuggested that IVF is cost-effective compared with alterna-tive therapies such as tuboplasty (9). Alternatively, modelsof the cost of providing insurance coverage for IVF servicesin isolation cannot incorporate either cost savings when IVFreplaces less effective therapies or cost increases when IVFis added to a health benefits plan. This is especially impor-tant, given that data from other countries strongly suggestthat IVF utilization increases when these services are addedto health benefits plans (10).
Regardless of the usefulness of either type of cost esti-mate for IVF services (cost per live delivery versus cost ofproviding insurance coverage), it is important to consider theeconomic costs of the full range of infertility-related healthservices (diagnostic procedures, conventional interventions,and ART). The number of individuals seeking infertility-related services has increased substantially during the past20 years (11), and there have been parallel advances ininfertility treatment options (12, 13).
Expenditures for infertility services were estimated toaccount for 1% of reproduction-related health care expensesin 1982, or about $3.29 for each woman between the ages of15 and 44 years during that year (14). In addition, with theuse of 1984 data on typical infertility service charges, it wasestimated that the cost per successful treatment of infertilitywas $10,700; the cost per successful treatment of tubal factorinfertility was substantially higher ($31,841) (15). Boththese cost estimates were published before the widespreaduse of ART and the enactment of state mandates to regulateaccess to ART within health care plans.
The purpose of the current investigation was to documenttrends in the economic cost of providing comprehensiveinfertility services within group insurance plans. Data from 9large insurance plans in Massachusetts were analyzed todetermine the total cost of providing coverage for the diseaseof infertility. Corrections for inflation in the medical sectorof the economy and changes in the market share of the planswere used to document inflation-adjusted cost changes forinfertility services.
Additional data provided to the Insurance Commission byBlue Cross/Blue Shield of Massachusetts were used to illus-trate the consumer cost of providing comprehensive cover-age for infertility within the Blue Cross/Blue Shield of
Massachusetts indemnity plan as a percentage of total healthcare expenditures. The patient characteristics and successrates for ART services within Massachusetts also were ex-amined with the use of the 1993 IVF registry (16). This wasdone so that the relation between mandated coverage forART procedures and the use of these procedures could beexamined. Finally, the cost per live delivery with the use ofART in Massachusetts was estimated.
MATERIALS AND METHODS
We examined infertility cost data from Massachusettsbecause of the comprehensive infertility treatment mandatein that state. In October 1987, the Massachusetts legislatureenacted “An Act Providing a Medical Definition of Infertil-ity,” essentially clarifying that infertility is an illness requir-ing coverage by insurance after 1988 (17). We will refer tothis as the “Mandate.” In effect, the Mandate requires insur-ance providers to cover infertility-related medical services tothe same extent as pregnancy-related services (i.e., parity incoverage for hospital charges, physician fees, drug charges,co-payments, and deductibles). The Mandate does not re-quire coverage for experimental procedures, surrogacy, re-versal of voluntary sterilization, or procurement of donorgametes (fertilization and transfer of donor gametes arecovered procedures, and intracytoplasmic sperm injection[ICSI] is now a covered procedure under the Mandate).
We initially sought a database that would allow exami-nation of Current Procedural Terminology (CPT) codes dur-ing the years before and after the Mandate was passed.Unfortunately, these codes were not uniformly availableacross a wide range of health care plans. An alternativedatabase was identified. The Massachusetts Department ofInsurance Rate-Setting Commission collects diagnostic codedata on disease. Infertility related codes are part of thatdatabase. Their hospital cost data were broken down bypublic and private payers, with the private sector marketdivided by indemnity (predominantly Blue Cross/BlueShield of Massachusetts) and health maintenance organiza-tion (HMO) plans, as well as self-insured entities. Medicare,Medicaid, and self-insured plans were excluded from furtherconsideration because those plans are not required to complywith state-legislated health insurance mandates.
The first investigator on this study, along with the Rate-Setting Commission, arranged relevant primary and second-ary International Classification of Diseases-9 (ICD-9) codesbased on available data that linked CPT and ICD-9 codes.These codes included male factor infertility codes (i.e.,606.x), female factor infertility codes (i.e., 628.x), and en-dometriosis (i.e., 617.x), as well as codes that may be relatedto infertility such as prostatitis (i.e., 601.x), ovarian, tubal,pelvic, uterine, or cervical inflammation (i.e., 614.x), nonin-flammatory disorders (620.x), and codes such as malpositionof the uterus (621.6), stricture and stenosis of the cervix(622.4), and pelvic congestion syndrome (625.5).
FERTILITY & STERILITY t 23
These codes were reviewed and judged to be relevant tothe diagnosis of infertility by several Massachusetts physi-cians with well-established infertility practices. We at-tempted to develop a liberal definition of infertility-relatedservices in selecting ICD-9 codes so that the data would bebiased toward an overestimation of the economic cost ofcomprehensive infertility benefits. For example, codes forendometriosis were included, even though we were not ableto exclude cases in which the women were not seekinginfertility treatment.
In 1992, the Blue Cross/Blue Shield of Massachusettsindemnity plan, HMOs, and Preferred Provider Organiza-tions (PPOs) covered approximately 32%, 33%, and 3% ofinsured Massachusetts residents, respectively. Because ofthe low number of PPO plans, these data were excluded fromfurther analysis, resulting in a study population that repre-sented approximately 65% of the privately insured popula-tion of Massachusetts. From this population, the total annualexpenditures for the relevant ICD-9 codes of 8 large HMOplans and the Blue Cross/Blue Shield of Massachusetts in-demnity plan were sampled. These plans were selected be-cause, taken together, they reported relevant data to theMassachusetts Department of Insurance for each year from1986–1993 (data from 1992 were incomplete, however, re-quiring us to interpolate from the 1991 and 1993 data).
Aggregating across plans, this resulted in an average planenrollment of 242,481 members in 1991, and the HMO plansthat were sampled represented approximately 75% of theHMO market share in that year. Data were not available foreach HMO plan for proprietary reasons; rather, the Massa-chusetts Department of Insurance supplied summary statis-tics for the 8 HMO plans. Thus, the term “HMO plans” refersto the aggregate of these 8 plans.
All expenditures related to ICD-9 diagnostic codes forinfertility-related services were summed within the 2 insur-ance groups (HMOs and the Blue Cross/Blue Shield ofMassachusetts indemnity plan). Data for the years 1986 and1987 were included so that costs before the enactment of theMandate could be examined. Expenditures in the years 1987through 1993 were corrected for inflation based on the re-gional Health Care Consumer Price Index (18) so that therate of medical inflation for infertility treatment relative tothe general rate of medical inflation could be examined. Theannual rates of medical inflation in the years 1987, 1988,1989, 1990, 1991, 1992, and 1993 were 5.1%, 9.4%, 9.2%,10.6%, 12.4%, 9.8%, and 6.5%, respectively.
These analyses were repeated separately for the aggregateHMO plans and the Blue Cross/Blue Shield of Massachu-setts indemnity plan because of the substantial difference inthe proportion of members between 15 and 44 years old inthe 2 groups (56% and 38%, respectively, in 1993). Themarket share of the HMO plans increased from 22% to 33%between 1988 and 1992, whereas the market share of theBlue Cross/Blue Shield of Massachusetts indemnity plan
decreased from 51% to 32%. We corrected for changes inmarket share between 1988 and 1992 so that trends in percapita expenditures could be examined. Unfortunately, year-by-year market share statistics were not available; thus, wecould only examine per capita expenditure changes from1988–1992.
Total expenditures for the Blue Cross/Blue Shield ofMassachusetts indemnity plan, provided by the Massachu-setts Department of Insurance, were used to calculate con-sumer costs for infertility services as a percentage of totalmonthly health care premiums. Total expenditures were notavailable for the aggregate HMO plans, so costs as a per-centage of total expenditures could not be calculated for thisgroup.
The clinic-specific reports to the IVF registry for 1993were used to document ART utilization, patient characteris-tics, and success rates for ART in Massachusetts. All IVFand GIFT cycles performed at the 9 Massachusetts clinicsthat reported to the IVF registry were tabulated and groupedaccording to the age of the woman (,40 years versus$40years) and the presence or absence of male factor infertility.
The overall success rates and the relative proportions ofinitiated cycles and success rates for the 4 resultant patientgroups then were compared with those of the rest of theUnited States and Canada by subtracting the Massachusettsclinic-specific data from the 1993 IVF registry summary data(the IVF registry summary data were converted to the metricof live delivery per initiated cycle by multiplying the deliv-ery/retrieval success rate by the probability of an initiatedcycle reaching egg retrieval). This allowed for statisticalcomparisons of patient characteristics and success rates be-tween Massachusetts and the remainder of the IVF registrydatabase.
We also used the clinic-specific data on IVF, GIFT,zygote intrafallopian transfer (ZIFT), and cryopreserved eggtransfers to estimate the cost per live delivery in Massachu-setts with the use of ART. For the purposes of these analyses,we estimated the cost of IVF, GIFT, ZIFT, and cryopre-served egg transfer cycles to be $8,000, $8,000, $10,000, and$2,000, respectively, based on published cycle cost data(6–8).
RESULTS
Table 1 illustrates trends in the total economic cost ofinfertility-related services within the Blue Cross/Blue Shieldof Massachusetts and HMO plans in the years 1986–1993. Inboth types of insurance plans, most of the expenditures werefor endometriosis and “other codes”; primary and secondarydiagnostic codes for male factor and female factor infertilityaccounted for no more than 12% of all infertility-relatedcodes between 1986 and 1993. Further, the proportion ofdollars spent within each diagnostic code category was rel-atively constant, both across plans and across the years
24 Griffin and Panak Infertility costs and utilization Vol. 70, No. 1, July 1998
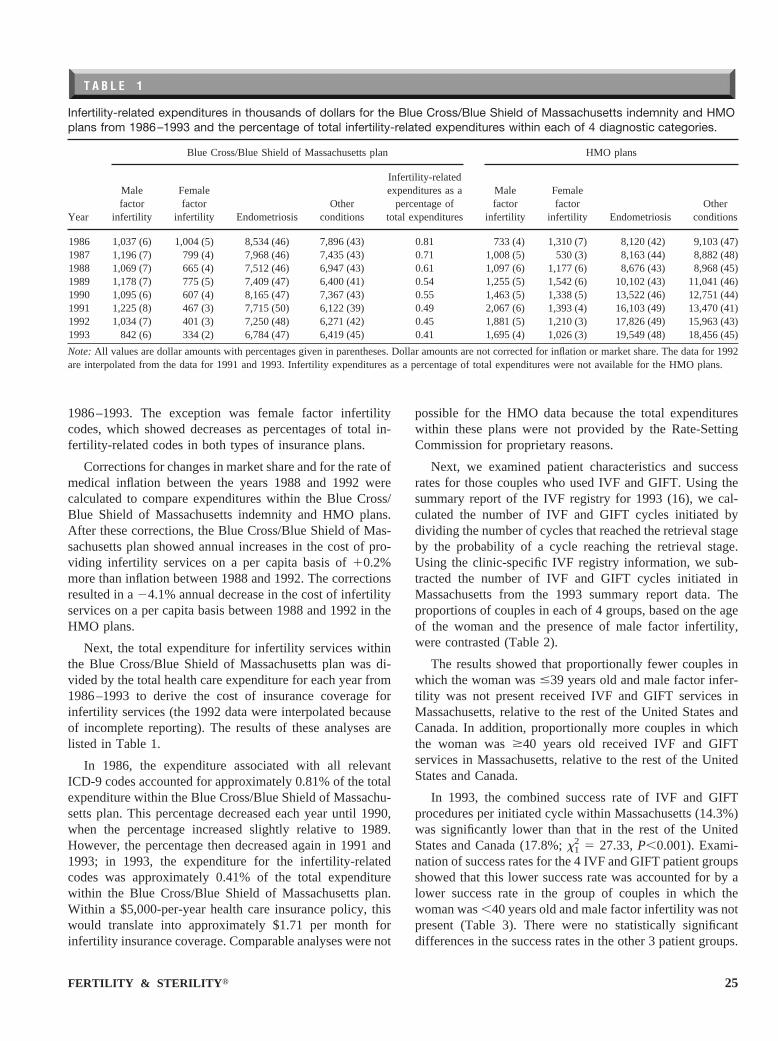
1986–1993. The exception was female factor infertilitycodes, which showed decreases as percentages of total in-fertility-related codes in both types of insurance plans.
Corrections for changes in market share and for the rate ofmedical inflation between the years 1988 and 1992 werecalculated to compare expenditures within the Blue Cross/Blue Shield of Massachusetts indemnity and HMO plans.After these corrections, the Blue Cross/Blue Shield of Mas-sachusetts plan showed annual increases in the cost of pro-viding infertility services on a per capita basis of10.2%more than inflation between 1988 and 1992. The correctionsresulted in a24.1% annual decrease in the cost of infertilityservices on a per capita basis between 1988 and 1992 in theHMO plans.
Next, the total expenditure for infertility services withinthe Blue Cross/Blue Shield of Massachusetts plan was di-vided by the total health care expenditure for each year from1986–1993 to derive the cost of insurance coverage forinfertility services (the 1992 data were interpolated becauseof incomplete reporting). The results of these analyses arelisted in Table 1.
In 1986, the expenditure associated with all relevantICD-9 codes accounted for approximately 0.81% of the totalexpenditure within the Blue Cross/Blue Shield of Massachu-setts plan. This percentage decreased each year until 1990,when the percentage increased slightly relative to 1989.However, the percentage then decreased again in 1991 and1993; in 1993, the expenditure for the infertility-relatedcodes was approximately 0.41% of the total expenditurewithin the Blue Cross/Blue Shield of Massachusetts plan.Within a $5,000-per-year health care insurance policy, thiswould translate into approximately $1.71 per month forinfertility insurance coverage. Comparable analyses were not
possible for the HMO data because the total expenditureswithin these plans were not provided by the Rate-SettingCommission for proprietary reasons.
Next, we examined patient characteristics and successrates for those couples who used IVF and GIFT. Using thesummary report of the IVF registry for 1993 (16), we cal-culated the number of IVF and GIFT cycles initiated bydividing the number of cycles that reached the retrieval stageby the probability of a cycle reaching the retrieval stage.Using the clinic-specific IVF registry information, we sub-tracted the number of IVF and GIFT cycles initiated inMassachusetts from the 1993 summary report data. Theproportions of couples in each of 4 groups, based on the ageof the woman and the presence of male factor infertility,were contrasted (Table 2).
The results showed that proportionally fewer couples inwhich the woman was#39 years old and male factor infer-tility was not present received IVF and GIFT services inMassachusetts, relative to the rest of the United States andCanada. In addition, proportionally more couples in whichthe woman was$40 years old received IVF and GIFTservices in Massachusetts, relative to the rest of the UnitedStates and Canada.
In 1993, the combined success rate of IVF and GIFTprocedures per initiated cycle within Massachusetts (14.3%)was significantly lower than that in the rest of the UnitedStates and Canada (17.8%;x1
2 5 27.33,P,0.001). Exami-nation of success rates for the 4 IVF and GIFT patient groupsshowed that this lower success rate was accounted for by alower success rate in the group of couples in which thewoman was,40 years old and male factor infertility was notpresent (Table 3). There were no statistically significantdifferences in the success rates in the other 3 patient groups.
T A B L E 1
Infertility-related expenditures in thousands of dollars for the Blue Cross/Blue Shield of Massachusetts indemnity and HMOplans from 1986–1993 and the percentage of total infertility-related expenditures within each of 4 diagnostic categories.
Year
Blue Cross/Blue Shield of Massachusetts plan HMO plans
Malefactor
infertility
Femalefactor
infertility EndometriosisOther
conditions
Infertility-relatedexpenditures as a
percentage oftotal expenditures
Malefactor
infertility
Femalefactor
infertility EndometriosisOther
conditions
1986 1,037 (6) 1,004 (5) 8,534 (46) 7,896 (43) 0.81 733 (4) 1,310 (7) 8,120 (42) 9,103 (47)1987 1,196 (7) 799 (4) 7,968 (46) 7,435 (43) 0.71 1,008 (5) 530 (3) 8,163 (44) 8,882 (48)1988 1,069 (7) 665 (4) 7,512 (46) 6,947 (43) 0.61 1,097 (6) 1,177 (6) 8,676 (43) 8,968 (45)1989 1,178 (7) 775 (5) 7,409 (47) 6,400 (41) 0.54 1,255 (5) 1,542 (6) 10,102 (43) 11,041 (46)1990 1,095 (6) 607 (4) 8,165 (47) 7,367 (43) 0.55 1,463 (5) 1,338 (5) 13,522 (46) 12,751 (44)1991 1,225 (8) 467 (3) 7,715 (50) 6,122 (39) 0.49 2,067 (6) 1,393 (4) 16,103 (49) 13,470 (41)1992 1,034 (7) 401 (3) 7,250 (48) 6,271 (42) 0.45 1,881 (5) 1,210 (3) 17,826 (49) 15,963 (43)1993 842 (6) 334 (2) 6,784 (47) 6,419 (45) 0.41 1,695 (4) 1,026 (3) 19,549 (48) 18,456 (45)
Note:All values are dollar amounts with percentages given in parentheses. Dollar amounts are not corrected for inflation or market share. The data for 1992are interpolated from the data for 1991 and 1993. Infertility expenditures as a percentage of total expenditures were not available for the HMO plans.
FERTILITY & STERILITY t 25

Finally, we estimated the cost per live delivery in Mas-sachusetts for the year 1993 (Table 4). Clinic-specific datafrom the IVF registry showed that 2,942 IVF cycles, 564GIFT cycles, and 12 ZIFT cycles were initiated in the 9 IVFclinics that reported to the IVF registry. In addition, 591cryopreserved egg transfer cycles were attempted. Overall,the estimated cost per live delivery was $59,484; the costwas somewhat higher for IVF cycles ($69,448) than forGIFT cycles ($49,469). None of the 12 ZIFT cycles per-formed in Massachusetts in 1993 were successful, accordingto the clinic-specific IVF registry report. Although cryopre-served egg transfer cycles were less successful than IVFcycles overall, the lower cost per cycle resulted in a net costsavings when fresh and cryopreserved egg transfer cycleswere considered together.
We also examined the cost per live delivery for the 4patient groups described in Tables 2 and 3. The cost per livedelivery was lowest in the group of couples in which thewoman was#39 years old and male factor infertility was notpresent ($47,677) and somewhat higher in the group inwhich the woman was#39 years old and male factor infer-tility was present ($58,323). The cost per live delivery wassubstantially higher in the group of couples in which thewoman was$40 years old and male factor infertility was notpresent ($100,000) and in the group in which the woman was$40 years old and male factor infertility was present($106,667).
These cost estimates reflect neither additional costs re-sulting from medical complications or multiple gestationsnor cost savings resulting from cancelled cycles or capitationarrangements between clinics and insurance plans. In addi-tion, these cost estimates include data on all ART cyclesreported to the IVF registry, regardless of the level of insur-ance coverage.
DISCUSSION
The goals of this study were to examine the costs andutilization of medical services for infertility within the con-text of group health insurance plans and mandated access toall forms of medically indicated, nonexperimental treatment.Analysis of total expenditures for infertility-related serviceswithin 9 large insurance plans showed that expendituresincreased during a time when insurance coverage was ex-tended to many individuals. Correction of these data for thegeneral rate of medical inflation and for changes in themarket shares of these plans showed that the rate of changein infertility-related expenditures was dependent on the typeof insurance plan. The Blue Cross/Blue Shield of Massachu-setts indemnity plan showed a slight increase in per capitaexpenditures, whereas the HMO plans showed an inflation-corrected decrease in per capita expenditures.
Taken together, these results show that the rate of changein infertility-related expenditures on a per capita basis varied
T A B L E 2
Percentages of IVF and GIFT cycles performed in 4 patient groups: comparison of Massachusetts versus all the otherclinics in the United States and Canada that reported to the IVF registry in 1993.
Location
Age of woman (y)
#39 $40
No male factor Male factor No male factor Male factor
Massachusetts 59%* 19% 17%* 5%*Other clinics in the United States and Canada 67%* 18% 11%* 3%*
Note: x32 5 128.48,P,0.001.
* Column percentages are significantly different, based on post hoc analysis of standardized residuals.
T A B L E 3
Success rates for IVF and GIFT cycles performed in 4 patient groups: comparison of Massachusetts versus the averages ofall the other clinics in the United States and Canada that reported to the IVF registry in 1993.
Location
Age of woman (y)
#39 $40
No male factor Male factor No male factor Male factor
Massachusetts 17%* 14% 8% 8%Other clinics in the United States and Canada 20%* 16% 8% 8%
* Column percentages are significantly different (z 5 23.90,P,0.05).
26 Griffin and Panak Infertility costs and utilization Vol. 70, No. 1, July 1998

substantially between the Blue Cross/Blue Shield of Massa-chusetts indemnity and HMO plans within Massachusetts. Itis noteworthy that per capita expenditures decreased in theHMO plans, even though these plans enrolled a higherpercentage of women in their childbearing years.
These inflation-adjusted trends in infertility-related ex-penditures occurred during a period of substantial expansionof ART services in Massachusetts. The number of clinicsreporting to the IVF registry in Massachusetts increasedfrom 1 clinic in 1985 to 9 clinics in 1993 (17, 19). Exami-nation of the clinic-specific IVF registry report suggests that,although Massachusetts accounts for only 2.3% of the pop-ulation of the United States (20), approximately 10% of theIVF and GIFT procedures performed in the United Statesand Canada each year are performed in Massachusetts. Over-all, the utilization of ART services in Massachusetts, on a percapita basis, was substantially higher than in the rest of theUnited States and Canada in 1993 and was similar to thelevel of utilization in France (7). This raises the question ofwhy infertility-related expenditures have increased at a rateslower than inflation within the HMO plans, particularlywhen those plans have many more young members who arelikely to use infertility-related services in general and ARTin particular.
There are numerous possible reasons why costs within theHMO plans have been decreasing relative to the rate ofinflation. Most infertile couples are treated using low-cost,conventional interventions (12, 13). The cost increases forthese interventions probably have lagged behind the generalrate of medical inflation because most of the interventionsare performed on an outpatient basis with the use of availabletechnology. Most of the components of ART (i.e., ultra-sound, blood assays, laparoscopic surgery, medications) alsoare established technologies that probably have not increasedin cost at a rate any higher than the general rate of medicalinflation. Finally, the Massachusetts Mandate has beenamended to include new technologies, such as ICSI, thatappear to be cost-effective relative to IVF in the treatment ofsevere male factor infertility (21).
Some cost savings may be due to the increased successrates of ART procedures. To examine this possibility, weestimated the success rate for IVF based on the 1985–1986summary report of the IVF registry and compared this withthe 1993 success rate data. From 1985–1993, the successrates of IVF procedures, expressed in terms of live deliveriesper initiated cycles, have nearly tripled, from an estimated5.4% in 1985 to 16% in 1993. Additional economic gainsmay be attributed to the use of other ART procedures, suchas GIFT and cryopreserved IVF cycles (8), as well as toimproved treatment protocols that have reduced cycle can-cellation rates (12). Some cost savings may have accruedbecause ART replaced alternative therapies, such as tubo-plasty (9).
Perhaps the most important cost-saving measure, how-ever, was provider arrangements and capitation plans withinthe HMO groups that led to substantial discounts for infer-tility-related services in general and ART services in partic-ular within Massachusetts (22). This may be the reason whyper capita infertility-related expenditures have been increas-ing at a rate lower than inflation within the HMO plans butat a rate slightly higher than inflation within the Blue Cross/Blue Shield of Massachusetts plan.
In terms of cost to the consumer for infertility insurance,the data suggest that expenditures for all services that may berelated to the diagnosis and treatment of infertility wereapproximately 0.8% of total expenditures within the BlueCross/Blue Shield of Massachusetts plan before the Man-date. This cost decreased at a stable rate through 1993, whenthe cost of all services was approximately 0.4% of the totalexpenditures within the Blue Cross/Blue Shield of Massa-chusetts plan. Much of this decline can be attributed to theshift of younger individuals who were more likely to useinfertility-related services toward the HMO plans.
It also should be noted that these statistics include allexpenditures associated with the diagnosis and treatment ofendometriosis; we believe that 0.41% is an upper-limit esti-mate of the cost of providing infertility-related serviceswithin the Blue Cross/Blue Shield of Massachusetts plan.Unfortunately, we were unable to obtain total health careexpenditure data from the HMO plans. We speculate thatinfertility-related expenditures are lower in the HMO plansbecause of capitation arrangements, but more research needsto be done in this area.
For both the Blue Cross/Blue Shield of Massachusettsindemnity and HMO plans, the proportion of infertility-related expenditures attributable to male factor and femalefactor infertility diagnostic codes was,15% of the totalinfertility-related expenditures for the years 1986–1993.This stable, low proportion of male and female factor infer-tility diagnostic code expenditures relative to endometriosisand other diagnostic code expenditures can be interpreted intwo ways.
Before the enactment of the Mandate, there was concern
T A B L E 4
Estimated cost per live delivery in Massachusetts, basedon 1993 IVF registry data.
ProcedureNo. of
initiated cyclesNo. of livedeliveries
Cost perdelivery (U.S.$)
IVF 2,942 386 69,448GIFT 564 114 49,469ZIFT 12 0 —Cryopreservation 591* 74 15,500
Total 574 59,484
Note: Estimates assume an average cost of $8,000, $8,000, $10,000, and$2,000 for IVF, GIFT, ZIFT, and cryopreservation attempts, respectively.* No. of attempted embryo thawings.
FERTILITY & STERILITY t 27
that many costs of infertility treatment were hidden through“creative coding” (23). This would suggest that, once theMandate was in effect, there would be an increase in the useof male and female factor infertility diagnostic codes. Thelack of such an increase could be interpreted as evidenceagainst the widespread use of “creative coding” before theMandate. Alternatively, it may be that, before the Mandate,physicians were using ICD-9 codes that were more likely tobe reimbursed by insurance plans. These physicians mayhave continued their diagnostic labeling out of simple habit.
Future research examining the relations between diagnos-tic and procedural codes would help to clarify the extent towhich endometriosis and other diagnostic codes examined inthe current study reflect infertility-related services versusservices that are not attributable to the treatment of infertil-ity. In addition, more detailed examination of the linksbetween diagnostic and procedural codes would help toquantify the effect of expanded ART services on the utili-zation of alternative treatments such as tuboplasty and wouldfurther our understanding of the cost-effectiveness of a widerrange of specific infertility treatments.
Success rates of ART procedures vary by patient charac-teristics such as the age of the woman and the presence ofmale factor infertility (16). In examining the Massachusettsclinic-specific data from 1993, however, it does not appearthat selection of patients on the basis of positive prognosticindicators occurs in Massachusetts. In fact, the data supportthe opposite; proportionally more older women undergo IVFand GIFT procedures in Massachusetts than in the rest of theUnited States and Canada (Table 2). In examining successrates for these various patient groups, however, it appearsthat the higher use of IVF and GIFT by older women has notresulted in a lower success rate in Massachusetts than in therest of the United States and Canada (Table 3).
Taken together, the data suggest that although more olderwomen are receiving ART services in Massachusetts, thesewomen are not using these services to the extent that successrates are being adversely affected. At the same time, successrates in Massachusetts are lower among those couples inwhich the woman is,40 years old and male factor infertilityis not present. The reason for this cannot be discerned fromour data, but it should be examined by fertility specialists inMassachusetts.
These analyses, contrasting Massachusetts IVF registrydata with the remainder of the United States and Canada, arebased on the assumption that clinics that did not report datato the Society for Assisted Reproductive Medicine registryin 1993 were not atypical in their size or success rates (16).Finally, it will be useful to break down the actual cost perlive delivery data according to the level of insurance cover-age; it is possible that the cost per live delivery is higher forcouples who have greater access to ART through healthinsurance coverage.
In the future, health care policymakers may turn toward
the rationing of services as an approach to containing med-ical costs. Infertility-related services often have been tar-geted for such rationing. Ideally, the rationing of infertilitytreatment should be examined in the context of clinical trialsthat use random assignment to alternative treatments so thatextraneous factors can be controlled while cost comparisonsare made among a wide range of treatments. In the absenceof such research, the cost of infertility treatment must beestimated from available data on patient charges, successrates, utilization, and insurance expenditures.
The available data indicate that the consumer savings interms of reduced insurance premiums that would result frombenefit limits on infertility-related services would be smallrelative to total premiums. Possible adverse effects of ration-ing also should be considered. Rationing of diagnostic pro-cedures could delay the treatment of endometriosis and otherreproductive problems that, if treated early, could preventfuture infertility-related expenditures. Much of the cost ofinfertility treatment is incurred for conventional therapies;limiting the use of these therapies could push couples towardthe use of ART prematurely.
Limiting access to ART could result in overutilization andwaste of conventional treatment resources such as tubo-plasty. Finally, limiting the number of ART attempts couldmotivate clinics to maintain policies of transferring numer-ous embryos as a way of increasing success rates for coupleswho cannot afford numerous ART attempts. Thus, limits onART cycles could inadvertently maintain high rates of mul-tiple births and the associated medical complications andeconomic costs of these births (24).
Ultimately, consumers will request insurance coveragefor infertility treatment based on their level of risk (11),knowledge of treatment options (13) and success rates (16),knowledge of treatment costs (6, 15), and knowledge ofinsurance costs (7, 14). We assert that consumers will makemore competent decisions when they are educated as to theincremental cost of providing insurance coverage for infer-tility services (25). We hope that the data presented here willadvance the discourse on the economic impact of infertilitybenefits within group health care insurance plans.
References1. Fuchs VR. Health system reform: a different approach. JAMA 1994;
272:560–3.2. Eddy DM. Principles for making difficult decisions in difficult times.
JAMA 1994;271:1792–8.3. Brock DW, Daniels N. Ethical foundations of the Clinton admnistra-
tion’s proposed health care system. JAMA 1994;271:1189–96.4. Henifin MS. New reproductive technologies: equity and access to
reproductive health care. Journal of Social Issues 1993;49:61–74.5. Stack MF. Who should pay for infertility? Hastings Cent Rep 1987;17:
3–4.6. Neumann PJ, Gharib SD, Weinstein MC. The cost of a successful
delivery with in vitro fertilization. N Engl J Med 1994;331:239–43.7. Collins JA, Bustillo M, Visscher RD, Lawrence LD. An estimate of the
cost of in vitro fertilization services in the United States in 1995. FertilSteril 1995;64:538–45.
8. Van Voorhis BJ, Syrop CH, Allen BD, Sparks AET, Stovall DW. Theefficacy and cost effectiveness of embryo cryopreservation comparedwith other assisted reproductive technologies. Fertil Steril 1995;64:647–50.
28 Griffin and Panak Infertility costs and utilization Vol. 70, No. 1, July 1998

9. Van Voorhis BJ, Stovall DW, Sparks AET, Syrop CH, Allen BD,Chapler FK. Cost effectiveness of infertility treatments: a cohort study.Fertil Steril 1997;67:830–6.
10. World Health Organization. World Health Statistics Annual 1992.Geneva: World Health Organization, 1993.
11. Wilcox LS, Mosher WD. Use of infertility services in the United States.Obstet Gynecol 1993;82:122–7.
12. Chen SH, Wallach EE. Five decades of progress in management of theinfertile couple. Fertil Steril 1994;62:665–85.
13. Jones HW, Toner JP. The infertile couple. N Engl J Med 1993;329:1710–5.
14. Fuchs VR, Perreault L. Expenditures for reproduction-related healthcare. JAMA 1986;255:76–81.
15. Cooper GS. An analysis of the costs of infertility treatment. Am JPublic Health 1986;76:1018–9.
16. The American Fertility Society. Assisted reproductive technology in theUnited States and Canada: 1993 results generated from The AmericanFertility Society/Society for Assisted Reproductive Technology Regis-try. Fertil Steril 1995;64:13–21.
17. Commonwealth of Massachusetts. An act providing for a medicaldefinition of infertility (H 3721). 1987.
18. U.S. Department of Commerce. Statistical abstract of the United States,1993. 113th ed. Washington, DC: General Printing Office, 1994.
19. The American Fertility Society. In vitro fertilization/embryo transfer inthe United States: 1985 and 1986 results from the National IVF/ETRegistry. Fertil Steril 1988;49:212–5.
20. Commonwealth of Massachusetts. Annual report: vital statistics ofMassachusetts. Public document #1. October 1993.
21. Palermo GD, Cohen J, Alikani M, Adler A, Rosenwaks Z. Intracyto-plasmic sperm injection: a novel treatment for all forms of male factorinfertility. Fertil Steril 1995;63:1231–40.
22. DeCherney AH. Infertility: we’re not taking new patients. Fertil Steril1995;64:470–3.
23. Massachusetts Department of Medical Security. A household survey ofthe health insurance status of Massachusetts residents: Final report,October 1990.
24. Seoud M, Toner JP, Kruithoff CK, Muasher SJ. Outcome of twin,triplet, and quadruplet in vitro fertilization pregnancies: the Norwalkexperience. Fertil Steril 1992;57:825–34.
25. Reiser SJ. Consumer competence and the reform of American healthcare. JAMA 1992;267:1511–5.
FERTILITY & STERILITY t 29