The Economic Benefits of Passing the DREAM Act · Passing the federal DREAM Act would add a total...
29
The Economic Benefits of Passing the DREAM Act Juan Carlos Guzmán and Raúl C. Jara October 2012 WWW.AMERICANPROGRESS.ORG AP PHOTO/RICH PEDRONCELLI
Transcript of The Economic Benefits of Passing the DREAM Act · Passing the federal DREAM Act would add a total...
The Economic Benefits of Passing the DREAM Act
Juan Carlos Guzmán and Raúl C. Jara October 2012
WWW.AMERICANPROGRESS.ORG
AP PH
OTO
/RICH PED
RON
CELLI
The Economic Benefits of Passing the DREAM Act
Juan Carlos Guzmán and Raúl C. Jara October 2012
1 Introduction and summary
5 Findings of our economic analysis
12 Conclusion
13 Appendix: Methodology
21 About the authors
22 Endnotes
Contents
2.1 MILLION ELIGIBLE DREAMERS = 50,000
Two ways in which this population will increase their earning:
Receiving legal status Pursuing higher educationThis creates an aggregate 19 percent
increasing in earnings by 2030, totaling
$148 BILLION
Those earnings in turn trigger spending on goods and services:
1.4 MILLIONnew jobs
$181 BILLIONin induced economic impact
$10 BILLIONin increased revenue
THAT SPENDING RIPPLES THROUGHOUT THE ECONOMY CREATING:
$329 BILLIONin total economic impact for 2.1 million eligible DREAMers
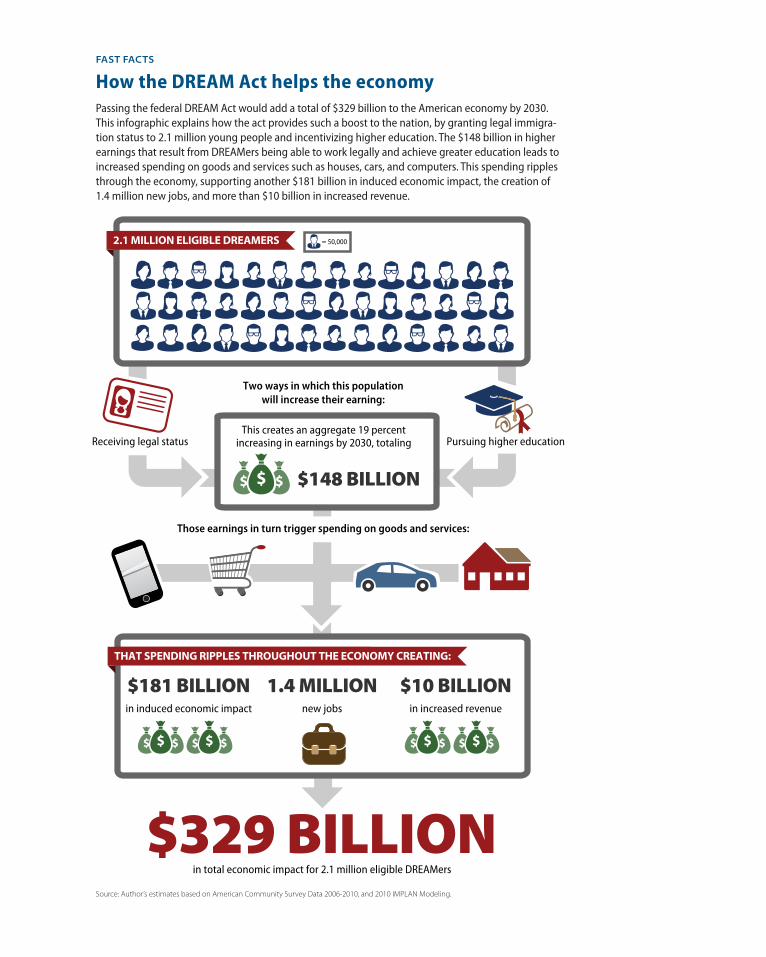
FAST FACTS
How the DREAM Act helps the economyPassing the federal DREAM Act would add a total of $329 billion to the American economy by 2030. This infographic explains how the act provides such a boost to the nation, by granting legal immigra-tion status to 2.1 million young people and incentivizing higher education. The $148 billion in higher earnings that result from DREAMers being able to work legally and achieve greater education leads to increased spending on goods and services such as houses, cars, and computers. This spending ripples through the economy, supporting another $181 billion in induced economic impact, the creation of 1.4 million new jobs, and more than $10 billion in increased revenue.
Source: Author’s estimates based on American Community Survey Data 2006-2010, and 2010 IMPLAN Modeling.
1 Center for American Progress | The Economic Benefits of Passing the DREAM Act
Introduction and summary
Until now, much of the debate surrounding the Development, Relief, and Education for Alien Minors Act, or DREAM Act—a bill to provide a pathway to legal status for eligible young people who were brought here as children and who complete high school and some college or military service1—focused on legal, ethical, and logistical concerns.2 But there are other important benefits of enacting the DREAM Act, most importantly the boost to the economy.
This report takes a close look at this economic perspective. We present an analysis to understand what would happen if the United States were to grant a pathway to legal status to an estimated 2.1 million eligible youth in our country by pass-ing the DREAM Act. Overall, we find that the passage of the DREAM Act would add $329 billion to the U.S. economy and create 1.4 million new jobs by 2030,3 demonstrating the potential of the proposed law to boost economic growth and improve our nation’s fiscal health.
In making these projections we used American Community Survey data from 2006 to 2010 to calculate the number of eligible unauthorized youth that would qualify for the DREAM Act—creating the largest dataset of unauthorized immi-grants to date—and then put the data into a robust model of the likely educational and job attainment potential of eligible DREAMers to estimate their likely future earnings.4 This model takes into account factors such as educational level, age, sex, race and ethnicity, and constitutes our estimate of the direct economic conse-quences of the DREAM Act. This is similar to the methodology used by education economist Luis Crouch and many of his colleagues in the field.5
We then used the IMPLAN system of input-output matrices to detail the so-called induced effects of passage of the DREAM Act on the U.S. economy. This approach enables us to gauge how the buying power from the increased future earnings of DREAMers ripples through the economy to support additional economic growth, job creation, and increased revenues.6 The IMPLAN model is used by the U.S. government—including the Bureau of Economic Analysis and the Department

2 Center for American Progress | The Economic Benefits of Passing the DREAM Act
of Defense—as well as a variety of departments in 39 different states and private industry to estimate the induced effects of legislative and other changes that impact the inputs in an economy.7
Because the data sets used for both direct and induced impact were taken from 2006 to 2010 and include the height of the recession in generating expected performance, the findings presented here likely understate the actual economic impact of the DREAM Act. Our forward-looking analysis begins in the year 2010, the last year in which detailed economic and demographic baselines are available, and runs through 2030, at which point a significant portion of eligible DREAMers would have completed their schooling and entered the workforce.8
We find in this report that enabling these 2.1 million eager-to-be-Americans to contribute to building the American Dream would deliver a double boost to our economy. First, enacting the law would provide an incentive for their further education because for most of those who would be eligible the legalization provi-sions can only be attained through completion of high school and some college.9 Receiving more education opens access to higher-paying jobs, enabling these undocumented youth to become much more productive members of our society. Second, gaining legal status itself translates into higher earnings for these youth since legal status allows DREAMers to apply to a broader range of high-paying jobs rather than having to resort to low-wage jobs from employers who are willing to pay them under the table.10
Thus our projections track both the gap in current earnings between unauthorized individuals at various levels of education and their U.S.-born counterparts, as well as the gains in earnings from attaining more education. Overall, our research finds that by 2030 the eligible DREAMer population will earn 19 percent more in earnings than without passage of the DREAM Act, in turn increasing their consumption and contributing more in the way of tax revenue to the federal government.11
In detailing the ways in which passage of the DREAM Act will add significant value, jobs, and tax revenue to the American economy, it is important to note that the benefits would not simply be a one-time addition but instead unfold over time, with the economic benefits growing larger as time goes on. This upward trajectory comes because eligible DREAMers will have a staggered entrance into the workforce, with many eligible youth still in elementary or secondary school at the time of passage.
3 Center for American Progress | The Economic Benefits of Passing the DREAM Act
While studies by groups in favor of restricting immigration tend to take a snapshot view of the costs and benefits of immigrants at one specific point in time—usually finding high education costs from the children of immigrants12—our study finds that investments in these students will pay off greatly in the future.13 The passage of the DREAM Act (see Box on page 4) will ensure that a steady stream of people is able to attend college and achieve better jobs.
One important caveat is necessary: This study looks solely at the economic bene-fits from passing the DREAM Act, and not any costs that may be incurred. But we believe future costs from the DREAM Act will be limited.14 Eligible DREAMers will still be subject to the same restriction for most public benefits as other legal immigrants, and would only be allowed to receive most non-emergency federal benefits after five years of lawful permanent residence—holding a green card, or becoming a citizen through naturalization. The Act contains an additional 6 year conditional period before eligible DREAMers can receive legal permanent resident status.15
The U.S. economy is not a zero-sum game and increased earnings from DREAMers create greater demand for services among the most important drivers of job growth in the country, expanding opportunities for all Americans.16 There are also very good reasons to think that the DREAMers will not be displacing American workers.
First, many economists find that immigrants tend to complement the skills of native workers rather than compete with them, especially as immigrants move up the education and skills chain. Increasing the education of immigrant workers would therefore decrease the competition between DREAMers and the native-born.17
Second, research shows that an increase in college-educated immigrants directly increases U.S. gross domestic product—the largest measure of economic growth—which correlates to more jobs for American workers. In the 1990s, for example, the increase in college-educated immigrants was found to be responsible for a 1.4 percent to 2.4 percent increase in U.S. GDP.18 Finally, by giving legal sta-tus to DREAMers, fewer employers would be able to pay workers under the table and more would have to abide by a system that is fair to all workers.
This study’s findings are clear: Passage of the DREAM Act would improve the American economy and contribute to the economic recovery and our future eco-nomic stability. (see Table 1)
4 Center for American Progress | The Economic Benefits of Passing the DREAM Act
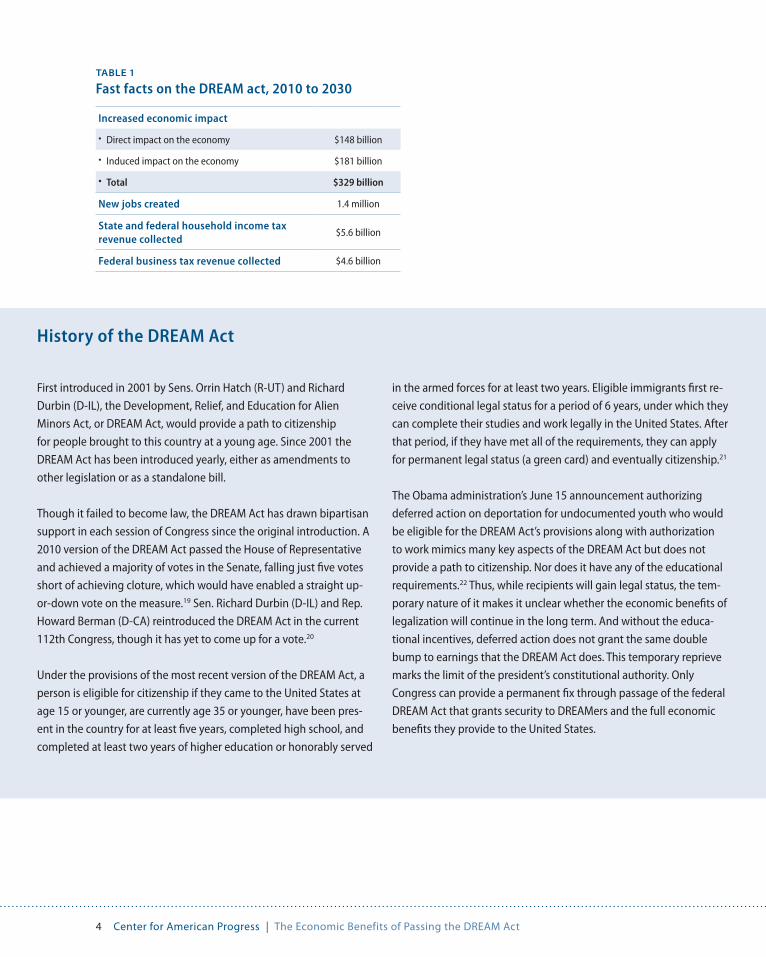
TABLE 1
Fast facts on the DREAM act, 2010 to 2030
Increased economic impact
• Direct impact on the economy $148 billion
• Induced impact on the economy $181 billion
• Total $329 billion
New jobs created 1.4 million
State and federal household income tax revenue collected
$5.6 billion
Federal business tax revenue collected $4.6 billion
First introduced in 2001 by Sens. Orrin Hatch (R-UT) and Richard
Durbin (D-IL), the Development, Relief, and Education for Alien
Minors Act, or DREAM Act, would provide a path to citizenship
for people brought to this country at a young age. Since 2001 the
DREAM Act has been introduced yearly, either as amendments to
other legislation or as a standalone bill.
Though it failed to become law, the DREAM Act has drawn bipartisan
support in each session of Congress since the original introduction. A
2010 version of the DREAM Act passed the House of Representative
and achieved a majority of votes in the Senate, falling just five votes
short of achieving cloture, which would have enabled a straight up-
or-down vote on the measure.19 Sen. Richard Durbin (D-IL) and Rep.
Howard Berman (D-CA) reintroduced the DREAM Act in the current
112th Congress, though it has yet to come up for a vote.20
Under the provisions of the most recent version of the DREAM Act, a
person is eligible for citizenship if they came to the United States at
age 15 or younger, are currently age 35 or younger, have been pres-
ent in the country for at least five years, completed high school, and
completed at least two years of higher education or honorably served
in the armed forces for at least two years. Eligible immigrants first re-
ceive conditional legal status for a period of 6 years, under which they
can complete their studies and work legally in the United States. After
that period, if they have met all of the requirements, they can apply
for permanent legal status (a green card) and eventually citizenship.21
The Obama administration’s June 15 announcement authorizing
deferred action on deportation for undocumented youth who would
be eligible for the DREAM Act’s provisions along with authorization
to work mimics many key aspects of the DREAM Act but does not
provide a path to citizenship. Nor does it have any of the educational
requirements.22 Thus, while recipients will gain legal status, the tem-
porary nature of it makes it unclear whether the economic benefits of
legalization will continue in the long term. And without the educa-
tional incentives, deferred action does not grant the same double
bump to earnings that the DREAM Act does. This temporary reprieve
marks the limit of the president’s constitutional authority. Only
Congress can provide a permanent fix through passage of the federal
DREAM Act that grants security to DREAMers and the full economic
benefits they provide to the United States.
History of the DREAM Act
5 Center for American Progress | The Economic Benefits of Passing the DREAM Act
Findings of our economic analysis
Our analysis examines what would happen to the U.S. economy were Congress to pass the DREAM Act. Our projections begin in the year 2010, the latest year for which baseline data on demographics and earnings are available. We first describe the number of potentially eligible DREAM Act recipients and then calculate the likely additional educational achievement DREAMers will obtain, based on the fact that DREAM eligibility will require high school completion and at least some college education or military service. 23
After calculating the number of eligible DREAMers and their future educational potential, we apply that data to a synthetic earnings model24 to calculate the aggregate earnings potential of DREAMers both with and without passage of the DREAM Act. A synthetic earnings model is the sum of the average earnings that a worker is expected to receive—given his or her race and ethnicity, age, sex, education level, and nativity—throughout the worker’s lifetime. These values are calculated based on two groups: DREAMers’ earning potential with passage of the DREAM Act and DREAMers’ earning potential without passage of the DREAM Act. The difference between these two values constitutes our estimate of the direct impact of the bill’s passage. Direct impacts refer to the immediate effects of, in this case, legal status and higher education attainments on earnings in the economy, and give us an estimate of the amount of extra earnings that will be earned by DREAMers over the next two decades.
We then use the IMPLAN economic modeling system to calculate the induced impact on the American economy, through the year 2030. This modeling system takes the difference in earnings detailed above and applies that to the spend-ing patterns of households at different income levels to calculate an increase in demand for goods and services. Industries respond to this demand by increasing production and often must hire more workers in order to do so.
These added earnings go to the DREAMers themselves, of course, but also
6 Center for American Progress | The Economic Benefits of Passing the DREAM Act
deliver a ripple effect through the entire economy as the spending power of these immigrants causes businesses to grow, and supports the creation of a slew of new jobs to meet demand for increased consumption. This ripple effect is measured through the induced impact on the economy, which captures the way that demand drives the economy. (see our methodology on page 13 for a more complete expla-nation of our examination of the direct and induced effects as well as why we do not calculate the indirect effects.)
Estimates of the number of eligible DREAMers
Building on the work of demographer Jeffrey Passel of the Pew Hispanic Center, we apply his detailed probabilistic method25 of assigning legal status to individual cases to five years of American Community Survey data based on previously pub-lished estimates of the size of the unauthorized immigrants by state between 2005 and 2010.26 The U.S. Census Bureau, which conducts those surveys, does not ask questions about individuals’ legal status as part of their surveys, so it is necessary to use statistical modeling to develop a reasonable estimate of how many undocu-mented DREAM eligible youth are in the nation. After excluding people who are likely to be in the country legally (those born in the United States, refugees, nonimmigrant aliens), we assign legal status to the remaining members based on this probabilistic model.
For this model, we take into account state population estimates, gender, country of origin, state of residence, occupation, and family units. This process gives us a dataset of all unauthorized immigrants in the country, which we can then use to directly calculate how many people meet the basic age and educational require-ments either to apply either directly for permanent status under the DREAM Act or to apply for temporary status in the hopes of later fulfilling the requirements for permanent status.
Educational attainment is not the only way to meet eligibility requirement for the DREAM Act. It is also possible to meet the requirements through military service. Some potential DREAMers will take this route, but since a program such as this has never been attempted before, the data needed to make a reliable estimate as to how many is sadly lacking. So in line with previous estimates from the Migration Policy Institute, we estimate that roughly 5 percent of those DREAMers who might not meet the education requirement will gain eligibility through the mili-tary service provisions.27
7 Center for American Progress | The Economic Benefits of Passing the DREAM Act
It is important to note that the DREAM Act would certainly incentivize military service, which is reflected by using 5 percent in our calculations rather than the 1 percent rate of Hispanics currently serving in the military.28
Projected education gains made by DREAMers
Since the benefits of legalization are tied to educational attainment—achiev-ing a high school degree and at least some higher education—the DREAM Act provides a strong incentive to obtain postsecondary degrees. At all levels more education translates into higher earnings, though the effect is greatest for those who obtain at least a bachelor’s degree. The DREAM Act itself only requires some college, not completion of a bachelor’s degree. Nevertheless, the passage of the DREAM Act should incentivize at least a portion of the population to complete their undergraduate studies in line with comparable numbers of U.S. born resi-dents with a similar demographic profile. Still, our estimate also takes into account people who receive 2-year associate degrees.29
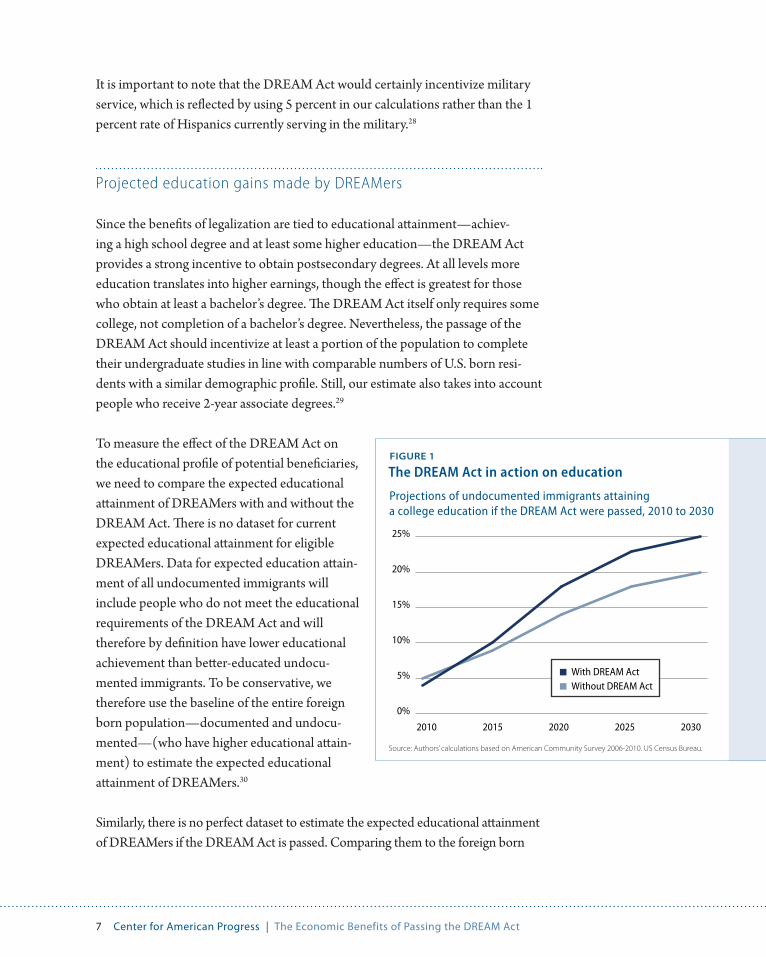
To measure the effect of the DREAM Act on the educational profile of potential beneficiaries, we need to compare the expected educational attainment of DREAMers with and without the DREAM Act. There is no dataset for current expected educational attainment for eligible DREAMers. Data for expected education attain-ment of all undocumented immigrants will include people who do not meet the educational requirements of the DREAM Act and will therefore by definition have lower educational achievement than better-educated undocu-mented immigrants. To be conservative, we therefore use the baseline of the entire foreign born population—documented and undocu-mented—(who have higher educational attain-ment) to estimate the expected educational attainment of DREAMers.30
Similarly, there is no perfect dataset to estimate the expected educational attainment of DREAMers if the DREAM Act is passed. Comparing them to the foreign born
FIGURE 1
The DREAM Act in action on education
Projections of undocumented immigrants attaining a college education if the DREAM Act were passed, 2010 to 2030
0%
5%
10%
15%
20%
25%
2010 2015 2020 2025 2030
With DREAM ActWithout DREAM Act
Source: Authors’ calculations based on American Community Survey 2006-2010. US Census Bureau.
8 Center for American Progress | The Economic Benefits of Passing the DREAM Act
would undervalue their likely success since this would include many immigrants who came to the United States later in life after studying in their home countries. Since DREAMers all came here and participated in U.S. education, a better compari-son point for educational achievement is their U.S.-born counterparts, controlling for sex, age, and race and ethnicity, which is what we have done here.31
Our estimates find that by the year 2030 there will be a total of 1.5 million DREAMers with at least a high school or equivalent degree and 223,000 more individuals with a postsecondary degree (associate’s and bachelor’s degrees) in the work force if the DREAM Act became law. As Figure 1 illustrates, the percentage of eligible DREAMers with a college degree would be 4 percent higher with the passage of the DREAM Act. And these figures do not take into account people who may still be completing their education in 2030, leading to even higher out-comes in the future. (see Figure 1)
Projected gains in earnings made by DREAMers
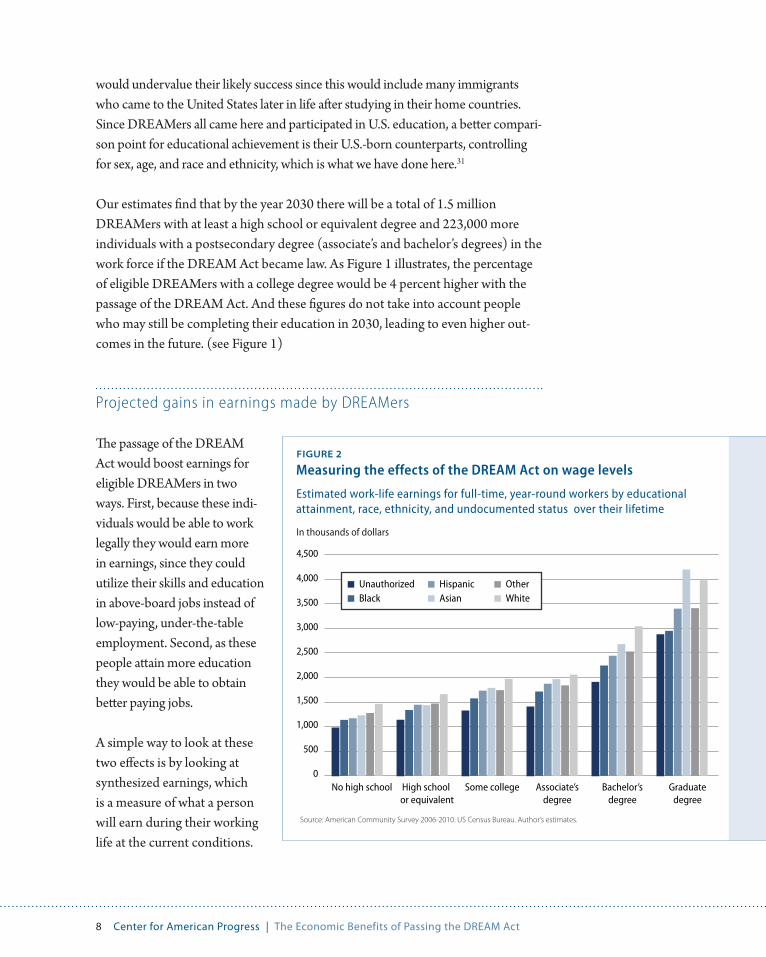
The passage of the DREAM Act would boost earnings for eligible DREAMers in two ways. First, because these indi-viduals would be able to work legally they would earn more in earnings, since they could utilize their skills and education in above-board jobs instead of low-paying, under-the-table employment. Second, as these people attain more education they would be able to obtain better paying jobs.
A simple way to look at these two effects is by looking at synthesized earnings, which is a measure of what a person will earn during their working life at the current conditions.
FIGURE 2
Measuring the effects of the DREAM Act on wage levels
Estimated work-life earnings for full-time, year-round workers by educational attainment, race, ethnicity, and undocumented status over their lifetime
In thousands of dollars
Source: American Community Survey 2006-2010. US Census Bureau. Author’s estimates.
0
1,000
2,000
3,000
4,000
500
1,500
2,500
3,500
4,500
No high school High school or equivalent
Some college Associate’sdegree
Bachelor’sdegree
Graduatedegree
UnauthorizedBlack
HispanicAsian
OtherWhite
9 Center for American Progress | The Economic Benefits of Passing the DREAM Act
Figure 2 shows the synthetic work-life earnings for full-time, year-round workers32 with various levels of education, broken down by white, Asian, Hispanic, black, and unauthorized earnings. (see Figure 2).
Unauthorized workers are in the bottom of the scale in terms of earnings for every education level. Passage of the DREAM Act not only moves a greater number of people into higher educational levels (a rightward movement along the chart) but also out of the unauthorized groups, enabling their earnings levels to rise to the level of a demographically similar cohort with legal status and enabling higher education to have an even larger return for the DREAM Act eligible population.
Summary of direct effects on the U.S. economy
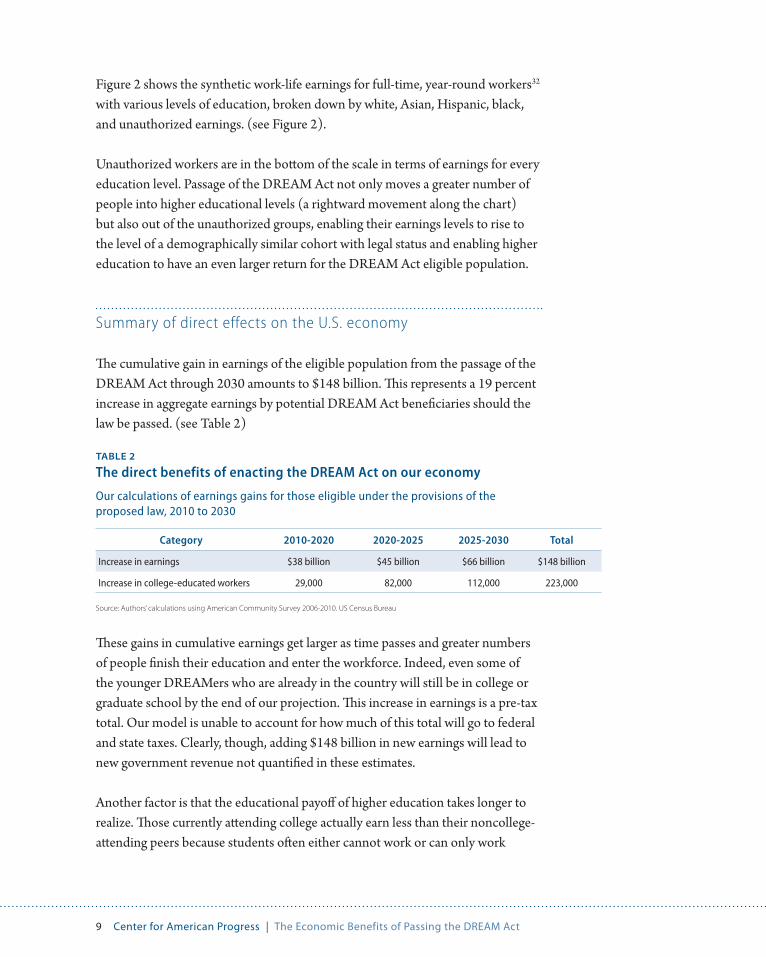
The cumulative gain in earnings of the eligible population from the passage of the DREAM Act through 2030 amounts to $148 billion. This represents a 19 percent increase in aggregate earnings by potential DREAM Act beneficiaries should the law be passed. (see Table 2)
TABLE 2
The direct benefits of enacting the DREAM Act on our economy
Our calculations of earnings gains for those eligible under the provisions of the proposed law, 2010 to 2030
Category 2010-2020 2020-2025 2025-2030 Total
Increase in earnings $38 billion $45 billion $66 billion $148 billion
Increase in college-educated workers 29,000 82,000 112,000 223,000
Source: Authors’ calculations using American Community Survey 2006-2010. US Census Bureau
These gains in cumulative earnings get larger as time passes and greater numbers of people finish their education and enter the workforce. Indeed, even some of the younger DREAMers who are already in the country will still be in college or graduate school by the end of our projection. This increase in earnings is a pre-tax total. Our model is unable to account for how much of this total will go to federal and state taxes. Clearly, though, adding $148 billion in new earnings will lead to new government revenue not quantified in these estimates.
Another factor is that the educational payoff of higher education takes longer to realize. Those currently attending college actually earn less than their noncollege-attending peers because students often either cannot work or can only work
10 Center for American Progress | The Economic Benefits of Passing the DREAM Act
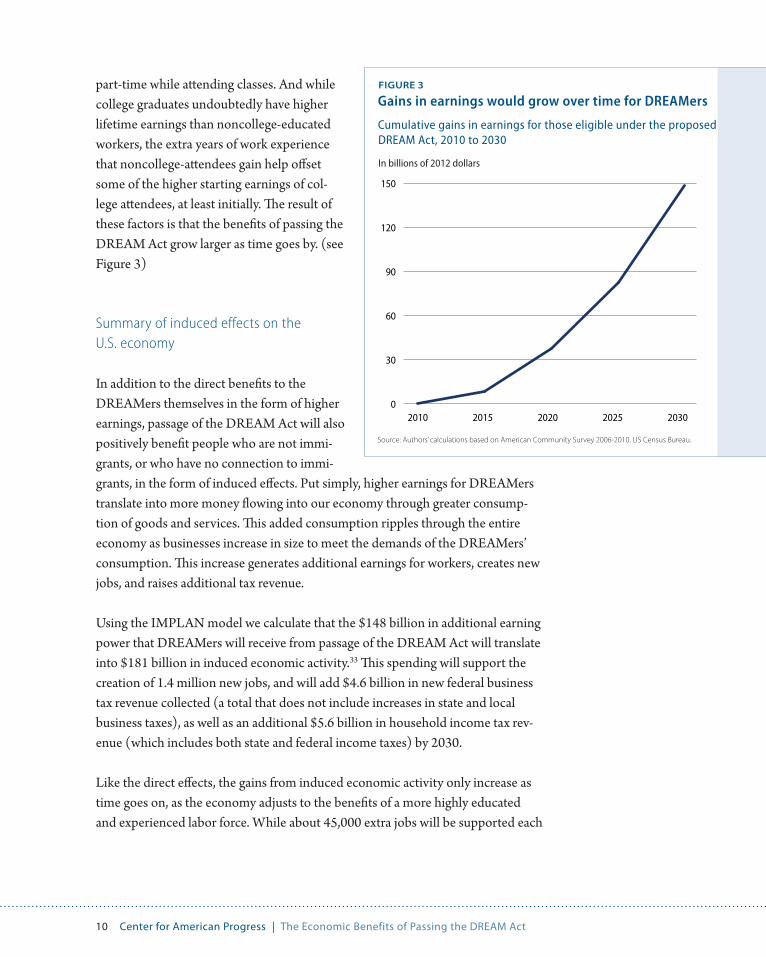
part-time while attending classes. And while college graduates undoubtedly have higher lifetime earnings than noncollege-educated workers, the extra years of work experience that noncollege-attendees gain help offset some of the higher starting earnings of col-lege attendees, at least initially. The result of these factors is that the benefits of passing the DREAM Act grow larger as time goes by. (see Figure 3)
Summary of induced effects on the U.S. economy
In addition to the direct benefits to the DREAMers themselves in the form of higher earnings, passage of the DREAM Act will also positively benefit people who are not immi-grants, or who have no connection to immi-grants, in the form of induced effects. Put simply, higher earnings for DREAMers translate into more money flowing into our economy through greater consump-tion of goods and services. This added consumption ripples through the entire economy as businesses increase in size to meet the demands of the DREAMers’ consumption. This increase generates additional earnings for workers, creates new jobs, and raises additional tax revenue.
Using the IMPLAN model we calculate that the $148 billion in additional earning power that DREAMers will receive from passage of the DREAM Act will translate into $181 billion in induced economic activity.33 This spending will support the creation of 1.4 million new jobs, and will add $4.6 billion in new federal business tax revenue collected (a total that does not include increases in state and local business taxes), as well as an additional $5.6 billion in household income tax rev-enue (which includes both state and federal income taxes) by 2030.
Like the direct effects, the gains from induced economic activity only increase as time goes on, as the economy adjusts to the benefits of a more highly educated and experienced labor force. While about 45,000 extra jobs will be supported each
FIGURE 3
Gains in earnings would grow over time for DREAMers
Cumulative gains in earnings for those eligible under the proposed DREAM Act, 2010 to 2030
In billions of 2012 dollars
0
30
60
90
120
150
2010 2015 2020 2025 2030
Source: Authors’ calculations based on American Community Survey 2006-2010. US Census Bureau.
11 Center for American Progress | The Economic Benefits of Passing the DREAM Act
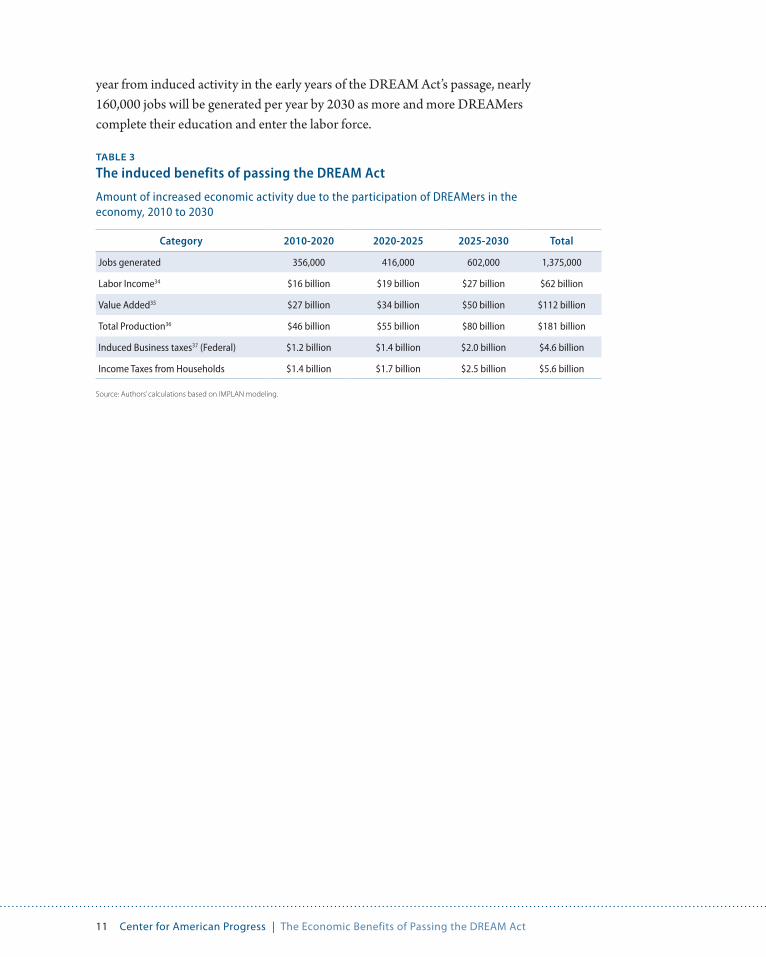
year from induced activity in the early years of the DREAM Act’s passage, nearly 160,000 jobs will be generated per year by 2030 as more and more DREAMers complete their education and enter the labor force.
TABLE 3
The induced benefits of passing the DREAM Act
Amount of increased economic activity due to the participation of DREAMers in the economy, 2010 to 2030
Category 2010-2020 2020-2025 2025-2030 Total
Jobs generated 356,000 416,000 602,000 1,375,000
Labor Income34 $16 billion $19 billion $27 billion $62 billion
Value Added35 $27 billion $34 billion $50 billion $112 billion
Total Production36 $46 billion $55 billion $80 billion $181 billion
Induced Business taxes37 (Federal) $1.2 billion $1.4 billion $2.0 billion $4.6 billion
Income Taxes from Households $1.4 billion $1.7 billion $2.5 billion $5.6 billion
Source: Authors’ calculations based on IMPLAN modeling.
12 Center for American Progress | The Economic Benefits of Passing the DREAM Act
Conclusion
Through a combination of improved educational attainment and higher paid jobs available to authorized immigrants, the passage of the DREAM Act would result directly in $148 billion in increased earnings for beneficiaries of the passage of the proposed law. This direct effect would result in an induced effect of an addi-tional $181 billion of economic activity. We conservatively estimate the combined economic benefits of the DREAM Act would be approximately $329 billion over the next 20 years, leading to 1.4 million new jobs and at least an additional $10.2 billion in tax revenue.
This study shows that passing the DREAM Act would lead to economic growth and improved fiscal health for our nation. Quite simply, extending legal status to more college-age undocumented immigrants who have known no other home but America is the economically sensible approach. It will encourage more students to enroll in school and result in a more highly educated workforce.
The choice could not be clearer: Persist in immigration policies that have kept DREAMers on the economic sidelines or help fulfill the nation’s potential by passing the DREAM Act and adding hundreds of billions of dollars to the nation’s economy.
13 Center for American Progress | The Economic Benefits of Passing the DREAM Act
Appendix: Methodology
For this analysis of the economic benefits of passing the DREAM Act, we produced a dataset of unauthorized immigrants that has the largest number of cases used in published research to date. With this foundation, we conducted a detailed analysis on the likely educational attainment of DREAMers based on methodology by econ-omist Luis Crouch using yearly information to deduce cohort educational transition rates (how likely a group of DREAMers in the same age group are to graduate from college with a bachelor’s degree) based on differences between age groups.38
We then applied our educational attainment projection to a synthetic lifetime earnings model used by U.S. Census Bureau researchers to develop an estimation of the direct economic impact of the DREAM Act on potential beneficiaries.39 This model takes into account factors such as education, age, sex, and race and ethnicity. Finally, we used the IMPLAN input-output matrix to study the induced economic effect that would result from the direct economic impact.40
Much of the analysis for this report was conducted using Stata, a statistical software package. To produce our estimates, we wrote a great deal of Stata code. We have made this code available for others who wish to replicate or exam-ine our methodology. It can be found at: https://github.com/Guzman-Jara/DREAM-economic-impact.
The period we looked at in our analysis was between 2010 and 2030. We chose 2010 as the starting point because the latest demographic data is available for that year. We chose 2030 as an end year both to avoid making predictions too far into the future and also because the majority of DREAM eligible people will then be old enough to have graduated from college (if they attend) and have spent some time in the labor force.
There are four main components necessary to conduct this procedure and esti-mate the total economic impact of passing the DREAM Act.
14 Center for American Progress | The Economic Benefits of Passing the DREAM Act
– A data set of unauthorized immigrants – Educational profiles – Conditional and permanent resident status requirements – Profiles of earnings and the induced economic activity that results from them
We briefly describe each of these components in the sections that follow.
As with any projections, these numbers are estimates and contain a certain amount of uncertainty. We assume, for example, that economic conditions will remain roughly the same as the period between 2006 and 2010, and assume that the rates of educational attainment will stay the same in the future—meaning that attendance and graduation rates for postsecondary education will remain roughly the same as today.
While we believe our final estimate reflects best available data, there are many reasons to conclude that the estimate is conservative. Our estimate of direct impact is based heavily on American Community Survey data from between 2006 and 2010, a period of time that overlaps with the Great Recession, which began in 2007. Our estimate of induced impact is based not only on our estimate of direct impact, but also on 2010 economic data, which the Great Recession also affected. The adverse economic conditions of the period we examined almost certainly reduce our final estimate.
Additionally, our model assumes that removing the barriers to higher education that potential DREAMers face will lead to attainment rates similar to their U.S. born counterparts of the same race and ethnicity. Yet potential DREAMers actu-ally have incentives far above those of U.S. citizens to attain a postsecondary edu-cation. Their very presence in the country could depend on achieving a degree, which in turn could lead to attendance rates significantly higher than the relatively low rates which groups like U.S. born Hispanics now face.
Finally, because our estimate of educational attainment rates is based on the entire foreign-born population, and not just the unauthorized population, it is possible that we are overestimating the educational attainment of potential DREAMers in the absence of the DREAM Act’s passage.
15 Center for American Progress | The Economic Benefits of Passing the DREAM Act
In short, if we are overestimating the educational attainment of undocumented youth without the benefit of the DREAM Act, then we are underestimating the difference between what we would expect with the status quo, and what we would expect from the passage of the DREAM Act.
Demographics of eligible DREAMers
The first step in this economic analysis involved creating a demographic dataset based on the eligible population of DREAM Act beneficiaries. Creating such a dataset is not a trivial task, as no national survey undertaken by the Census Bureau asks for participants’ immigration status. Nevertheless, researchers have devel-oped statistical techniques for producing estimates of unauthorized population and its demographic characteristics.
The most widely known and cited data on the number of unauthorized immi-grants living in the United States have been Pew Hispanic Center demographer Jeffrey Passel’s annually updated estimates. In a 2009 paper Pew published demographic characteristics of the unauthorized population based on a meth-odology of assigning an immigration status to individual cases in the 2007-2009 March Supplements of the Current Population Survey.41 Even with three years’ worth of data, the total sample size is only about 620,000 cases, with only about 23,000 cases of unauthorized immigrants. The sample size of potential DREAMers is even smaller, at less than 5,000 cases. While that sample is robust enough to draw reasonable estimates about the size and broad demographic characteristics of potential DREAMers, it is not sufficient for the more detailed analysis required for this report.
In order to construct a larger dataset, we apply Passel’s procedure for estimating the unauthorized population to the U.S. Census Bureau’s 2006 to 2010 American Community Survey.42 From the approximately 25 million cases in the 2006 to 2010 survey, we were able to produce a dataset of unauthorized immigrants that includes nearly 420,000 cases—and from those a sample of potential DREAMers with a little over 89,000 cases. To the best of our knowledge, this is the largest dataset of unauthorized immigrants produced to date.

16 Center for American Progress | The Economic Benefits of Passing the DREAM Act
Passel’s methodology takes previously derived estimates of the unauthorized immigrant population by state and uses these numbers to determine probabilities that an individual case in survey data represents an unauthorized immigrant. It involves three major steps.
•The first is the elimination of cases that are with a very unlikely to represent an unauthorized immigrant.
•The second is assignment of initial probabilities to all remaining cases based on occupational data derived from the Legalized Population Survey.
•The third is to revise those initial probabilities to account for family units while maintaining a target population consistent with the previously derived estimates.
The elimination of cases unlikely to be unauthorized immigrants begins by eliminating any cases born in the United States or those who immigrated before 1980. Then checks are performed using date of arrival to the United States, occupation, and key demographic characteristic to determine if a person is likely to have a valid work visa. Finally, State Department data on refugees combined with American Community Survey data on country of origin is used to determine which countries of origin are likely to indicate refugee status by year. This data is then used to exclude those likely to be refugees.
Initial probabilities of unauthorized status are based on country of origin and Legalized Population Survey data, which is a survey of 6,193 previously unauthor-ized immigrants who were interviewed when they sought permanent legal resi-dence, sponsored by the departments of Homeland Security, Labor, Agriculture, and Commerce. From the Legalized Population Survey, percentage distributions are calculated by broad occupational category, region of the country, and sex. These distributions are updated by rates in change of occupational category in the country as a whole. These distributions, in combination with country of origin data are used to create a target distribution for unauthorized immigrants.
Once the target distribution based on country of origin and occupation is cal-culated, probabilities of unauthorized status for individual cases in the ACS are calculated for the working age population (ages 18 to 65) such that the distribu-tion of those selected as unauthorized will match the target distribution. These probabilities are then revised so that state populations are consistent with the previously derived estimates, while maintaining the target occupation/country
17 Center for American Progress | The Economic Benefits of Passing the DREAM Act
of origin distribution. These probabilities are revised one more time to take into account the children of those selected.
As a final check, we compared key demographic characteristics derived from our dataset against the Pew data, including educational distributions, country of origin, and broad occupational groups for the unauthorized population as a whole. We then compared data on the number of, location of, and DREAM Act criteria met to data published by the Migration Policy Institute on potential DREAM Act beneficiaries.43 Although our dataset covers a broader period (2006 to 2010) than the studies we compared it to (which cover the 2007 to 2009 period), making direct comparisons difficult, we found broad agreement between our numbers and those previously published. For a more detailed explanation of Passel’s methodol-ogy, please see his original paper.44
Future educational-attainment rates
The future education profile of a population depends on several factors that are captured in graduation and transition rates for each educational level. These rates, however, are not available for the combination of: age, sex, race and ethnicity, migration status, and the different postsecondary levels needed for this study.
Instead, we calculated these rates by using a synthetized cohort analysis—which allows us to analyze different age groups of people as if they were a single age cohort passing through time—of the educational profile of the population, similarly to how demographers calculate life tables to estimate life expectancy. We used five-year cohorts of the American Community Survey by sex, race/ethnicity, and nativity to calculate transition rates in the educational profile of the popula-tion. We estimated transition rates between the following education levels:
– Less than high school – High school diploma or GED – Some college education – Associate’s degree – Bachelor’s degree – Higher than bachelor’s, which includes Master’s, doctoral and professional degrees.
18 Center for American Progress | The Economic Benefits of Passing the DREAM Act
In our model we also assume that no further education occurs after the age of 40. We calculated one set of rates for the U.S-born population and one set of rates for the foreign-born population.
Because earnings vary by work experience and because individuals do not com-plete their education all at the same age, it is necessary to simulate the passing of time to produce a reasonable estimate. We do this by “aging” the population in five-year increments. For each period, we applied education-transition rates, adjusted earnings based on a workers new age and education, and summed the total earnings and induced effect for that period.
For the actual calculation, we compared the educational distribution of one five-year age group, compared it to its successor, and calculated the transition rate needed to obtain the educational percentage distribution of the successor. We used percent-ages distribution instead of frequency distributions to eliminate difference in cohort size. We followed this procedure for each sex, race/ethnicity, and nativity group.
In our final estimate we assumed that if the DREAM Act is enacted, the eligible pop-ulation would experience the transition rates of their U.S.-born counterparts; other-wise they will experience the graduation rates of their foreign-born counterparts. We used the entire foreign-born population, including documented and undocumented people, instead of just the unauthorized population for two reasons.
The first is that using the larger population allowed us to produce more robust estimates of educational transition rates. A more important reason, however, is that DREAMers who arrived in the United States during or before their teens are not directly comparable to what is normally meant by first-generation immigrants. They comprise what is commonly termed “1.5 Generation” immigrants, those who have immigrated early enough in life to allow a more easy assimilation into their new culture than their parents. Including legal, foreign-born immigrants in our estimation of educational transition rates helps us to split the difference between unauthorized first generation immigrants and a group that faces less adversity in its quest to attain education.
19 Center for American Progress | The Economic Benefits of Passing the DREAM Act
The economic impact
The economic impact is divided into direct and induced impacts. The direct impact is the economic changes that we would observe directly in the DREAMers, which is basically the change in their earnings potential. The induced impact is the economic activity that the increase in earnings would generate in the overall economy.
Direct impact
The direct impact is the difference between the aggregate earnings that eligible migrants to the DREAM Act would receive if the DREAM Act were to become law, and the earnings that eligible migrants would receive were the DREAM Act not enacted.
The earnings are calculated for U.S. and foreign-born residents based on 10-year age groups, sex, education level, and race and ethnicity. We calculated the mean earnings for each age/sex/race and ethnicity/education level combination using 10 regions defined as each of the six largest states (Arizona, California, Florida, Illinois, New York, Texas) and the four Census Bureau regions (Northeast, Midwest, South, and West). The division into these six states and four regions allowed us to take into account earning and labor market differentials. We use 10-year intervals for the age groups because they allow for robust results.
After applying the transition rates of U.S.- and foreign-born individuals to the potential DREAMers, we assigned the earning corresponding to each age/sex/education level group, and calculated the difference between the two estimates by each year. This difference constituted our estimate of the direct impact.
The induced impact: the IMPLAN model
This study uses the IMPLAN input-output models for 2010—IMPLAN stands for “IMpact analysis for PLANing.” IMPLAN allows researchers to calculate the impacts resulting from changes in policy and economic activity. The study esti-mates the impacts on economic output and employment in each industry, and the resulting impact on tax contributions, given a range of assumed changes to migra-tion-related policies. The model allows identification of direct economic effects in affected industries and induced effects that cascade through the economy.
20 Center for American Progress | The Economic Benefits of Passing the DREAM Act
In the present study, we produced our own estimate of direct impact and, there-fore, only used the IMPLAN to produce an estimate of the induced impact.
We divided our estimate of direct impact by state (and the District of Columbia) and five-year period in order to conduct a series of multiregion analyses over the 20-year period between 2010 and 2030. This resulted in a total of 204 multiregion analyses, each comprised of two regions: the state in question and a composite region comprised of the remaining states. As input for the analysis we use the difference in earnings generated by potential DREAMers should the DREAM Act be passed in that state and time period divided by income level. Our final total estimate of induced impact is comprised of the aggregate totals of each of these multiregion analyses.
21 Center for American Progress | The Economic Benefits of Passing the DREAM Act
About the authors
Juan Carlos Guzmán is a monitoring and evaluation specialist at the Initiative for Global Development. After obtaining his doctorate from Princeton University in Public Affairs, Dr. Guzman worked in international education for the American Institutes for Research, gender and development for the World Bank, and Latino Studies for the Institute for Latino Studies at the University of Notre Dame. Dr. Guzman’s research looks at economic impact of policy changes, and impact evalu-ation of project for global development.
Raúl Jara is a research associate at the University of Notre Dame’s Institute for Latino Studies. Jara’s projects at the institute have included economic and demo-graphic research, editing, and web development. Jara received a master of fine arts degree in creative writing from Notre Dame in 2009.
Acknowledgements
The authors would like to thank Bárbara Knopel for her invaluable research assis-tance, the Institute for Latino Studies for its support, and the Center for American Progress Immigration, Editorial, and Art teams for their insightful comments and perseverance in the face of our jargon.
22 Center for American Progress | The Economic Benefits of Passing the DREAM Act
Endnotes
1 Marshall Fitz and Ann Garcia, “The DREAM Act by the Numbers: Providing High-Achieving Young People a Path to Earn Citizenship” (Washington: Center for American Progress, 2010), available at http://www.americanprogress.org/issues/immigration/news/2010/12/17/8845/the-dream-act-by-the-num-bers/. Note: The calculations in this report are based on the most recent House version of the DREAM Act, H.R. 1842 112th Congress.
2 See, for example: Stephanie Valencia, “10 Reasons We Need The DREAM Act,” The White House Blog, December 3, 2010, available at http://www.whitehouse.gov/blog/2010/12/03/10-reasons-we-need-dream-act; America’s Voice, “5 Reasons to Support the DREAM ACT,” September 15, 2010, available at: http://ameri-casvoiceonline.org/research/reasons_to_support_the_dream_act/; Prerna Lal, “10 Reasons to Pass the DREAM Act Now,” Buzzfeed, 2010, available at: http://www.buzzfeed.com/prernal/10-reasons-to-pass-the-dream-act-now-s6q; and Marshall Fitz, “Myth vs. Fact: The DREAM Act: No More Excuses on This Bill” (Washington: Center for American Progress, 2010), available at: http://www.americanprogress.org/wp-content/uploads/is-sues/2010/12/pdf/mythfactdream.pdf.
3 Because the DREAM Act has occupied a position in the national immigration debate for so long, this is not the first study to provide an estimate of the economic impact its passage would have. In 2010, Raul Hinojosa-Ojeda and Paule Cruz Takash at the University of California, Los Angeles, published a paper examining likely gains in education among potential DREAM Act beneficiaries (DREAMers) and the lifetime earnings those DREAMers would attain with the new educational outlook. While a useful starting point, their calculations do not take into account the range of demographic and economic factors necessary to pre-dict the full benefits of the DREAM Act, and projected the benefits too far into the future. The present report represents an attempt to create a more robust model for studying the DREAM Act’s potential. See: Raúl Hinojosa-Ojeda and Paule Cruz Takash, “No DREAMers Left Behind: The Economic Potential of DREAM Act Beneficiaries,” (Los Angeles: North American Integration and Development Center, University of California, Los Angeles, 2010), available at http://naid.ucla.edu/uploads/4/2/1/9/4219226/no_dreamers_left_behind.pdf.
4 We use earnings instead of income because it reflects the conditions that eligible people would face in the labor market. Income includes other moneys derived from sources such as property, investments, and other pre-existing assets that are unlikely to be affected by the DREAM Act. We assume the Act’s primary economic effects will be on the education attainment and earn-ings of eligible individuals.
5 Luis A. Crouch, “A simplified linear programming approach to the estimation of enrollment transition rates: estimating rates with minimal data availability,” Economic Certification Review 10(3) (1991): 259-269.
6 For previous economic-projection studies using IMPLAN, see, for example: Raúl Hinojosa-Ojeda, “The Consequences of Legalization Versus Mass Deporta-tion” (Washington: Center for American Progress, 2012), available at http://www.americanprogress.org/issues/immigration/report/2012/08/30/35215/the-conse-quences-of-legalization-versus-mass-deportation/; and Randy Capps, Kristen McCabe, and Michael Fix, “Profile
of Immigrants in Napa County” (Washington: Migration Policy Institute, 2012), available at http://www.migra-tionpolicy.org/pubs/Napa-Profile.pdf. In this study we calculate the direct and induced effects of passing the DREAM Act, i.e. the increased earnings of DREAMers, as well as the increased economic activity that results from DREAMers spending these increased earnings. IMPLAN analyses often include a measure of indirect impact, which is the economic activity generated from industries acting on other industries without taking into account consumer spending (the induced effect). Indirect impact can only be calculated by examining changes in the production of specific industries. Since we do not measure direct changes in industries, there is no indirect impact to report.
7 For a list of organizations utilizing IMPLAN, see: http://implan.com/v4/index.php?option=com_content&view=article&id=64&Itemid=52#10cnp.
8 Direct effects refer to the immediate gains made by people earning higher earnings, in this case from legal status and higher education. Induced effects refer to the multiplier effect of these direct earnings moving through the economy. So for example, if a worker’s salary is raised by $1, that is a direct effect. When that worker spends the extra $1 in the economy, the money supports businesses that expand to meet increased demand for their products, which in turn generates demand for more employment and generates greater tax revenue, known as induced effects.
9 The Migration Policy Institute, for example, in its study of the demographic profile of eligible DREAMers assumes that only 5 percent of the eligible population will take advantage of the military service path to complete the requirements for legal status, based on past low rates of enlistment among eligible Latinos. See: Jeanne Batalova and Margie McHugh, “DREAM vs. Reality: An Analysis of Potential DREAM Act Beneficia-ries” (Washington: Migration Policy Institute, 2010), p. 15, available at http://www.migrationpolicy.org/pubs/DREAM-Insight-July2010.pdf.
10 We have not chosen to separate out educational wage gains from legal status ones. Thus our model considers the two together.
11 Note: Our model cannot calculate the direct tax effects of passing the DREAM Act, only the induced tax ef-fects through the IMPLAN model. Thus our results are inherently conservative, and passage of the DREAM Act would likely raise even more revenue.
12 See, for example: Jack Martin and Eric A. Ruark, “The Fiscal Burden of Illegal Immigration on United States Taxpayers (Washington: Federation for American Immi-gration Reform, 2010 [revised 2011]), available at http://www.fairus.org/site/DocServer/USCostStudy_2010.pdf?docID=4921.
13 For a more detailed explanation of the pitfalls of taking a snapshot approach to the economics of immigration, see: Dowell Myers and John Pitkin, “Assimilation Tomor-row: How America’s Immigrants Will Integrate by 2030” (Washington: Center for American Progress, 2011), available at http://www.americanprogress.org/issues/immigration/report/2011/11/14/10583/assimilation-tomorrow/.

23 Center for American Progress | The Economic Benefits of Passing the DREAM Act
14 And the costs of inaction could be even higher. Barring this population from access to health insurance and standard primary and preventive care services, (as most undocumented immigrants are,) means that costly emergency room care is often the only option. See: American College of Emergency Physicians, “Il-legal Immigrant Care in the Emergency Department” (2012) available at: http://www.acep.org/content.aspx?id=25206.
15 See, for example, Immigration Policy Center, “Dispelling DREAM Act Myths” (2010), available at http://www.immigrationpolicy.org/just-facts/dispelling-dream-act-myths. Note: We are referring to the most recent House version of the DREAM Act, H.R. 1842 112th Congress.
16 See, for example: Paul Krugman, “The Austerity Agenda,” The New York Times, May 31, 2012, available at http://www.nytimes.com/2012/06/01/opinion/krugman-the-austerity-agenda.html?_r=0.
17 For a good roundup of evidence on the complimenting of American workers by immigrants, see footnote 11 and Immigration Policy Center, “Not In Competition: Data Underscores Differences Between Immigrant and Native-Born Workers” (2010), available at http://www.immigrationpolicy.org/sites/default/files/docs/Not_In_Competition_3.pdf. See also: Daniel Griswold, “Immigration Doesn’t Hurt Native-Born Workers” The Daily Caller, April 9, 2011.
18 Jennifer Hunt and Marjolaine Gauthier-Loiselle, “How much does immigration boost innovation” (Bonn, Ger-many: Institute for the Study of Labor, 2009), available at http://ftp.iza.org/dp3921.pdf.
19 Batalova and McHugh, “DREAM vs. Reality.”
20 S.952 and H.R.1842 respectively.
21 Batalova and McHugh, “DREAM vs. Reality,” p. 2.
22 On deferred action, see: Center for American Progress Immigration Team, “6 Things You Need to Know About Deferred Action and DREAM Act Students” (2012), available at http://www.americanprogress.org/issues/immigration/news/2012/06/15/11694/6-things-you-need-to-know-about-deferred-action-and-dream-act-students/.
23 Educational attainment is the highest degree a person can attain. In determining which DREAMers who achieve permanent legal status through the DREAM Act, our analysis cannot distinguish those who com-plete one year of college versus those who complete two or more years of college without achieving a degree. This limitation is due to the fact that the ACS does not track the number of years a person spent in college before dropping out. We do include those who achieve a 2-year associate’s degrees in our analysis, and we do include some college as a category in our earn-ings model.
24 We use a modification of a method developed by Census Researchers wherein the population’s average earnings by age, sex, race, educational attainment are summed for an individual as they are “aged” throughout their working life. We modify the method by including legal status as a variable, and by only “aging” our population through 2030, instead of their entire expected working life. See: Jennifer Cheeseman Day and Eric C. Newburger “The Big Payoff: Educational Attainment and Synthetic Estimates of Work-Life Earn-ings” (Washington: Current Population Reports, July 2002), available at www.census.gov/prod/2002pubs/p23-210.pdf.
25 Jeffrey S. Passel, Jennifer Van Hook, and Frank D. Bean, “Narrative Profile with Adjoining Tables of Unauthor-ized Migrants and Other Immigrants, Based on Census 2000: Characteristics and Methods” (Sabre Systems, 2006) available at http://sabresystems.com/whitepa-pers/EMS_Deliverable_2-3_022706.pdf. For a more detailed explanation, please see the appendix.
26 Jeffrey Passel and D’Vera Cohn, “Unauthorized Im-migrant Population: National and State Trends, 2010” (Washington: The Pew Hispanic Center, 2011), available at http://www.pewhispanic.org/files/reports/133.pdf. Jeffrey Passel and D’Vera Cohn “U.S. Unauthorized Im-migration Flows Are Down Sharply Since Mid-Decade” (Washington: The Pew Hispanic Center, 2010), available at http://www.pewhispanic.org/files/reports/126.pdf. Jeffrey Passel and D’Vera Cohn “A Portrait of Unauthor-ized Immigrants in the United States” (Washington: The Pew Hispanic Center, 2009), available at: http://www.pewhispanic.org/files/reports/107.pdf. Jeffrey Passel and D’Vera Cohn “Trends in Unauthorized Immigration: Undocumented Inflow Now Trails Legal Inflow” (The Pew Hispanic Center, 2008), available at http://www.pewhispanic.org/files/reports/94.pdf; Jeffrey Passel “Size and Characteristics of the Unauthorized Migrant Population in the U.S.” (Washington: The Pew Hispanic Center, 2006), available at: http://www.pewhispanic.org/files/reports/61.pdf.
27 Batalova and McHugh, “DREAM vs. Reality.”
28 Batalova and McHugh, “DREAM vs. Reality.”
29 On the economic benefits of higher levels of educa-tion, see, for example: Sandy Baum, Jennifer Ma, and Kathleen Payea, “Education Pays 2010: The Benefits of Higher Education for Individuals and Society,” (New York: CollegeBoard Advocacy & Policy Center, 2010), available at http://trends.collegeboard.org/downloads/Education_Pays_2010.pdf.
30 In general undocumented DREAMers behave more like the 1.5 generation than undocumented immigrants as a whole, with better educational trajectories. Thus we take an average or the overall documented and undocumented foreign born population to make an ac-curate baseline for the DREAM Act eligible population.
31 This method of estimating educational trajectories of course has its limitations, especially for older DREAM-ers. But the model has a built in safeguard in that older DREAMers that still lack a high school diploma after the five year waiting period will have stunted future educa-tional trajectories in line with the U.S. born as well.
32 Defined as those working at least 40 hours a week for 50 weeks a year.
33 Note: In this calculation we assume that the earnings obtained by DREAM-eligible individuals will be spent in the U.S. economy.
34 Labor Income represents the aggregate total of the increase in earnings combined with earnings from new jobs generated we estimate will result from passage of the DREAM Act.
35 Value added is the total earnings, profits, and business taxes that will be added to the economy as a result of the DREAM Act. This total also represents the amount by which the nation’s Gross Domestic Product (GDP) will increase.
36 Total Production represents the total increase in economic activity that will result from passage of the DREAM Act.
24 Center for American Progress | The Economic Benefits of Passing the DREAM Act
37 Federal business taxes are made up primarily of income taxes of corporations and proprietary business, but also include indirect taxes at the Federal level, such as the excise tax.
38 Crouch, “A simplified linear programming approach.”
39 Day and Newburger, “The Big Payoff.”
40 See footnote 6.
41 Jeffrey S. Passel and D’Vera Cohn, “A Portrait of Unau-thorized Immigrants in the United States” (Washington: Pew Hispanic Center, 2009).
42 Ibid; Passel, Van Hook, and Bean, “Narrative Profile with Adjoining Tables.”
43 Batalova and McHugh, “DREAM vs. Reality.”
44 Passel, Van Hook, and Bean, “Narrative Profile with Adjoining Tables.”

About the Center for American Progress
The Center for American Progress is a nonpartisan research and educational institute dedicated to promot-
ing a strong, just, and free America that ensures opportunity for all. We believe that Americans are bound
together by a common commitment to these values and we aspire to ensure that our national policies
reflect these values. We work to find progressive and pragmatic solutions to significant domestic and in-
ternational problems and develop policy proposals that foster a government that is “of the people, by the
people, and for the people.”
1333 H STREET, NW, 10TH FLOOR, WASHINGTON, DC 20005 • TEL: 202-682-1611 • FAX: 202-682-1867 • WWW.AMERICANPROGRESS.ORG
About the Partnership for a New American Economy
The Partnership for a New American Economy brings together more than 500 Republican, Democratic, and
independent mayors and business leaders who support immigration reforms that will help create jobs for
Americans today. The Partnership’s members include mayors of more than 35 million people nationwide
and business leaders of companies that generate more than $1.5 trillion and employ more than 4 million
people across all sectors of the economy, from agriculture to aerospace, hospitality to high tech, and media
to manufacturing. Partnership members understand that immigration is essential to maintaining the produc-
tive, diverse, and flexible workforce that America needs to ensure prosperity over the coming generations.
The Partnership’s education efforts are supported by the Partnership for a New American Economy Research
Fund, and its advocacy efforts are supported by the Partnership for a New American Economy Action Fund.
www.renewoureconomy.org