
The Economic History of Byzantium - International Institute of Social


THE ECONOMIC AND SOCIAL RESEARCH INSTITUTE
COUNCIL 1976-77
"X’T. K. WHITAKER, M.SC. (ECON.), D.ECON. SC., President of the Institute.
*j. F. MEENAN, ~.A., n.L., Chairman of the Council.
’r. j. BARR~NOTON, Director, Institute of Public Administration.
R. D. C. ~LACK, PH.D., Professor, Department of Economics, The Queen’s Univer-sity, Belfast.
"’D. S. A. CARROLL, F.C.A., LL.D., Chairman, P. J. Carroll and Co. Ltd.*F. B. CHUBB, M.A., D.PmL., Pro/essor, Department o/ Political Science, Trinity
College, Dublin.
w.:Rr m,,v. D. CRV.OaN, C.M., President, St. Patrick’s Training College, Drumcondra,Dublin.
c,. DEAN, M.D., F.R.C.P., Director, Medico-Social Research Board.
N. j. GIBSON, I~.SC. (ECON.), I"I-1.3., Professor, Department of Economics, The NewUniversity of Ulster, Coleraine.
"YEW. A. HONOHAN~ M.A., F.I.A.
"rile MOST REv. JAMES KAVANAOH, M.A., S.T.L., Bishop of Zerta.
’~KIERAN A. KENNEDY~ M.EGON.SG.~ B.PttIL.~ PH.D.~ Director of the Institute.
IVOR K~NNV, M.A., Director General, lrish Management Institute.
,~HCrIAI.:L J. KmLEEN, 13.A. (MOD.), B.COMM., D.P.A., Managing Director5 IndustrialDevelopment Authority.
T. P. LINESMAN, n.E., B.SC., Director, Central Statistics Office.
*v. LYNCH, M.A., M.R.LA., Professor of Political Economy, University College, Dublin.
C.ttAI&I.F~S MCCARTHY, B.L., Chairman, Human Sciences Committee.
%t. D. MCCARTHY, M.A., I"H.D., D. SC., President, University College, Cork.
G. A. MEAGHER, B.GOMM.~ D.P.A.~ ,Secretary, Department of Local Government.
MIGHAEL N. MURPHY, Secretary, Department of Finance.
~C. It. MURRAY, Governor, Central Bank.
J. C. NAGLE~ M.GOMM.
D. NF, VIN, Assistant General Secretary, Irish Congress of Trade Unions.
’rile MOST a~v. J. N~WMAN, M.A., D.PH., Bishop of Limerick.
TADHO 6 CEARBHAILL, Secretary, Department of Labour.
t~,v. E. ~. O’DOHERTY, M.A., B.D., PH.D., Professor, Department of Logic and Psycho-logy, University College, Dublin.
1~. v. O’~mHONY, M.A., PH.D., I~.L., Professor, Department of Economics, UniversityCollege, Cork.
I.ABHRAS 6 NUALLAIN, D.E.GON.SG., Professor of Economics, University College,Galway.
*%v. j. L. RYAN, M.A., PH.D., Professor of Political Economy, Trinity College, Dublin.
RV, V. L. RYAN, M.A., D.D., L.PH., Professor, St. Patrick’s College, Maynooth.
T. WAI, SH, D.SG., Director, An Foras Tah’~ntais.
*REV. C. g. WARD, n.A., S.T.L., PH.D., Professor, Department of Social Science, Uni-versity College, Dublin.
*Members of Executive Committee.

The Income Sensitivity of the Personal
Base in Ireland, I947-I972
Income Tax
Copies o[ this paper may be obtained [rom The Economic and Social ResearchInstitute (Limited Company No. I8269). Registered Office: 4 Burlington Road,
Dublin 4
Price £2.00
(Special rate for students £I.oo)

Brendan R. Dowling ,is a Research Officer with TheEconomic and Social Research Institute. At present
he is on leave of absence and is serving as Research
Officer to the Minister for Foreign Affairs in Dublin.
This paper has been accepted for publication ’by The
Economic and Social Research Institute but respon-sibility for its content rests solely with the author.

The Income
Income Tax
Sensitivity of the Personal
Base in Ireland, i947-I972
BRENDAN R. DOWLIN, G
© THE ECONOMIC AND SOCIAL RESEARCH I’NSTITUTEDUBLIN, i977
ISBN o 707° 0004 I

Acknowledgements
This paper has been greatly improved ’by comments and ideas fromcolleagues who read earlier drafts. In particular, a debt of gratitude is owed
to the participants at a Dublin Economics Workshop Seminar, where this paperhad an early a’Mng; to Peter Neal~/ of Nuffield College, Oxford, and Liam
Ebrill of Harvard University, for their incisive refereeing of an early draft;
to those in the Central Bank, the Revenue Commissioners and the Dept. ofFinance who prepared comments on a second draft; to Dr. R. C. Geary for
his helpful advice on Appendix 2; and to ESRI colleagues Joe Durkan, and
Barry Murphy, whose assistance helped to clarify the exposition of some
passages of the study. A special thanks is due to the Secretarial staff of theESRI whose abilities included the smooth preparation of successive drafts from,
at times, undecipherable manuscripts. In spite of the best efforts of friends
and colleagues errors may remain in this work. As ever, the author alone is
responsible.

Chapter I
CONTENTS
General Summary
Introduction
Reasons for the Study
Previous Studies in Ireland
Page
II
Chapter 2
Chapter 3
Chapter 4
Chapter 5
The Model Outlined
Taxable Income and the Tax Base
The Tax Base in Ireland
The Structure of the Model
Specification of Tax Relationships
Data Adjustments
The Measuremem of Personal Income
Adjustment of Income to a Tax Year Basis
Data on Taxable Income and Personal Taxation
Construction of an Aggregate Measure for Personal
Al,lowances
Empirical Estimation of Tax Relationships
Results for i947 to i972
Out of Sample Forecasts
Tax Code Revisions in I974/75
Further Extensions
Inflation and Indexation
Taxation of Farmers
Conclusions
Appendices
I9
33
43
58
63
67

General Summary
(This summary was prepared to aid the non-technical reader. Interested readersare re[erred to the detailed text for a [utler and more technically precise discussiono[ the issues.)
TalS paper is about the relationship between the amount of in’come that issubject to income tax i.e., taxable income and the .level of personal income.
It tries to answer the question: What have Ibeen the important influences onthe growth of income taxation in the post-war period ?
The first section ’of the paper examines why we might be interested inobtahaing an answer to this question. Clearly, we would tike to know whatdetermines the level of income taxation for budgetary reasons in order toforecast Government .revenues a year ahead, or to cos.t some change in the taxcode. We might also want to know the determinants of income taxation forlonger-run planning reasons--it would be difficult to plan the public sectorwithout some longer-term projections of revenue. Finally, those who mightwant to evaluate past fiscal policy would require a model of the relationshipbetween income and income taxation in .order to disentangle the effects ofchanges in income on tax revenues from changes in the structure of taxationor tax rates.
In the first section we also analyse a previous study ,for ’Ireland and suggestthat the methodology adopted, which has also been used to analyse tax relation-ships in other countries, was theoretically unsound and that the results obtainedwere therefore unlikely to be accurate.
In the second part of the paper we examine the basic structure of the Irishincome tax system as it appfies to persons. We distinguish between tax receiptsand taxable income. The latter, when multiplied by the appropriate tax rate,yields the former. In order to remove the effects of the .changes in ~he standardtax rate which took place at various times in the post-war period we concen-trated on the income tax base or the level of taxable income. We did not .dealwith surtax mainly because of .the difficulty of modelling that part of taxationin the face of many changes in the le’gisla~tion affecting liability under the taxin the post-war period.
We showed that just as the level of personal allowances granted in ’the taxcode is crucial in determining whether .an individual .’is in the tax net or not sothe aggregate value of personal allowances granted to the non-agriculturalp’opul~tion is an important determinant of the amount of income in the tax net.Of course the main influence on the amount of ’income in the tax net wouldbe the overall ’level of non-agricultural income. Similarly, the aggregate levelof personal allowances, when considered ’in relation to the amount of incomethat enters the tax net, would be an important factor in determining the level
8 THE ECONOMIC AND SOCIAL RESEARCH INSTITUTE
of personal allowances actually claimed. The amount of income entering thetax net and the rate of earned income relief were suggested as the importantfactors determining .the amount of earned income relief claimed.
In specifying the way in which the Various factors influenced the tax variableswe paid close attention to the expected tong-run behaviour of the relationships.For example, if everyone was in the tax net--and that would only occur whenincomes were very high then the amount of personal allowances claimedshould be equal to the amount of personal allowances allowed by the taxauthorities. There would be no unused allowances. Accordingly, in indicatingthe way in which personal allowances claimed Were influenced by personalallowances allowed by the tax code, and by the level of income in .the tax net,we took account of the fact that in the long run when income gets very highallowances claimed would equal allowances permitted.
Before estimating the rela.tionships we had set ’out in theoretical form wehad first to adjust the data availa’ble to us. The main sources of data were theReports of the Revenue Commissioners and the National Income and Expendi-ture accounts. However, the tax data refer to tax years while the income andexpenditure data refer to calendar years. Th’is discrepancy ted to an adjustmentof the income figure. Similarly, non-PAYE incomes are assessed for income taxabout a year in arrears and so the income measure had to be adjusted tocorrespond to the .tinting used by the Revenue Commissioners in assessingIncome.
Most important of all, certain personal incomes were not taxed and so didnot come under the scrutiny of the Revenue Commissioners. For the periodwe were examining profits arising from agriculture were not taxable. Thereforewe had to remove these incomes from the measure of, personal income whic.hwas to be the main influence on vhe tax base. Similarly, most personal transferpayments--including emigrants remittances, unemployment benefit and assist-ance etc.--were not taxable and these had also to ’be removed from the measureof personal income. That gave us a level of non-agricultural personal incomewhich would be !mportant in determining the amount of ’income that ultimatelybore tax.
We had a/so to construct a measure of personal allowances which could,potentially, be claimed by the population. What we did was multiply eachcategoly of the non-agricultural population by its respective tax allowance. T’husthe num’ber of married men was multiplied ,by the married allowance to givethe aggregate amount of allowances which maimed men could :claim and,similarly, for single persons and children. We confined our attention to thenon-agricultural population since farm incomes were not subject to tax. We alsodealt only with the non-agricultural population in the l~bour force, and childdependents of that population, ’because we had eliminated alnaost all pens!onincomes from the personal income measure.
Armed with our theoretical model of the tax system and adjusted data forthe period i947/48 to i97.i/72 we applied certain econometric (statistical)

GENERAL SUMMARY 9"
techniques in order to estimate the way in which income and personal allowancesaffected taxable income. The results indicated ~:hat the theoretical model wasquite plausible and that the relationship between income and the tax base hadaltered significantly over time.
On average throughou.t the period I947/48 to I97I/7~ a £I million changein the level of personal allowances granted would cause a fall of 2o.4 millionin the level of taxable income. However, in I971/72 a £i naillion rise inpersonal allowances would cause a fall in taxable income of £o.8 millioncompared to £o.2 r million in I962/63.
Similarly, a rise of £i million in personal non-agricultural income would,on average, throughout the period from i947 to I972 have resulted in a rise intaxable income of £o.45 million. However, in I971/72 a £I million rise in’income would lead to £o.67 million increase in taxable income compared ,toonly £o.i7 million in I9~6o/’6I.
Thus the sensitivity of the inconae tax system to changes in income andallowances was increasing throughout the period especially after the I96o/6,Ichange-over to PAYE. This was almost certainly due to the fact that ’income,at current money .prices, was increasing rapidly wh’ile the overall level of allow-ances stayed frozen. Real incomes were, of course, rising and .the combinationof higher prices and higher incomes meant that more and more people were inthe tax net and so each extra pound earned was increas’ingly likely to enter thetax net rather than reduce the amount of unclaimed allowances.
Our results indicate that in I97r/72 an extra £~ million of personal non-agricultural income would have resulted in an extra £o.239 million poundsincome tax for the Government. Since the average rate of income tax was wellbelow this level in i971/72 this implies that the growth in Government incometax receipts would tend to exceed, by a si~fificant amount, the growth in per-sonal incomes.
We used the model we had estimated to see whether it would predict, witha reasonable degree of accuracy, the level of taxable income in I972/73 and1973/74. The results of the predictions were compared with the data shownin the Reports of the Revenue Commissioners. The performance of the modelfor i9,7,o/73 was remarkably good and the prediction error was well withinacceptable tolerances. The results for I973/74 were less good with a significanttendency to overpredict the level of taxable income. We examined whether thisoverprediction was due to factors unique to I973/74 or whether it indicatesa shift in the rela.tionships which would weaken the value of the model in future.There is evidence that certain alterations in t,he i974 National Accountstreatment of income, the introduction of significan.t phased increases in pay dueto National Wage Agreements, and the preliminary nature of the profits datafor i9,74 all tended to lead ,to an overestinaation of taxable income for i973/74.Only time will ultimately tell whether the model will need much adjustment inorder to forecast accurately the level of taxable income.

iIO THE ECONOMIC AND SOCIAL RESEARCH INSTITUTE
We also examined the new ,tax structure introduced in 1974 to seewhetherthe model we estimated is of any value after the changes or whether its use ismainly historical. The results suggest that the new code did not radically alterthe concept of taxable income although it did alter the relationship, betweentaxable income and tax revenue. Under the new code a range of tax ratesapply rather than a single rate in the old code. Therefore in order to movefrom taxable income to .tax revenue it is necessary .to know what factors influencethe average tax rate. Until we have more data on the distribution ’of taxableincome by tax rate slice, we will have to be content with making an approxima-tion to the average effective tax rate based on previous years experience.
In the final section we used the model developed in ’the context of the pre-I974 tax system to explore two controversial topics. These were indexation andthe ’taxation of farm incomes. In the pre-i974 tax code indexation would haveinvolved, mainly, the adjustment Of personal allowances for changes in prices.In the post-i97,4 code more attention would ’have to be paid to the width ofthe various tax bands as Well as the level of allowances. We ’compared I9,6o/~6:iallowances with those prevailing in 1971/’72 and showed that if the level ofallowances had kept pace with inflation then taxable income would have been£146 million lower. Thus in 1971/7.2 about 4.2 per cent of adjusted n’on-agricultural personal income was taken in taxation solely due to the failure ofallowances to keep pace with ’inflation from i96o/,6~i. If there ’had been noinflation and allowances ’had stayed a’t the i9t6o/6,i tevd :the saving in taxes,as a per cent of personal income would have been virtually the same. Thereforethe adjustment of the allowances for inflation ’between ,i96o~/i0i and 197’1/’72would have nearly fully compensated for the impact of the rise in prices onincome taxation. Of course, i9’.6o/6’i was a .year :in which the ratio of taxesto personal income was low because of the sharp rise in allowances with theintroduction of PAYE. If we had compared the 1971/72 out-turn with theallowance levels of 1959/,6o adjusted for inflation the rise in taxation due torising prices would have been much smaller.
We examined farm taxation in the same way as we had examined the taxationof non-farmers. We estimated the total amount ’of allowances that might beclaimed ’by farmers and assumed that the relationships that were obtained in thenon-agricultural sector also applied in the agricultural sector. If farm incomesin 197,3/,74 had ’been taxed as other incomes then the revenue yield would havebeen £34.2 million or 9.5 per cent Of total farm incomes. If rates were treatedas an income tax ra, ther than an indirect tax then .farmers would still have hadto pay an additional £21.5 million in 197’3/74 if they had been taxed as thenon-agricultural sector. There is evidence that this estimate might well be toolow since ,the distribution of income ’in farming is less equitable than amongthe non-’farm sector and no allowance was made tfor surtax for which some farmincomes would have been liable in i973/74.

Chapter I
Introduction
The Reasons [or the Study
THERE are a number of reasons why we might be concerned with the relation-ship between aggregate ’income and ’income taxation. In the first place, we
might wish to estimate for the year ahead the level of personal taxation. Thisis done each year in the Budget ’but no details of ,the n~odel used have ever ’beenpublished and so commentators have no basis on which :to examine the plausi-bility of the estimates presented.
Apart from this budgetary forecasting reason we might wish to know therelationship between personal income and income taxati’on for the purposes oflonger-term planning. Although we might be able to devise a simple and fairlyaccurate model .for short-term forecasting purposes by adjusting the observedresponse of tax revenues to income of the previous year this will not work inthe longer-:ternl context. The importance of the .tax structure, which is oftenhidden in the emphasis on short-term forecasting, becomes clear when attemptsare made to project ,tax revenues several years ahead. Therefore a model ’ofthe tax system which ’hopes to be usable in a planning context should contMnan explicit delineation of the structure of the tax system as well as its relationshipwith income. This will enable policy makers to evaluate the consequences ofchanges in ,policy ’over a number of years. In the short-term forecasting area amodel which contains explicit policy variables (i.e., variables which representpolicy measures adopted by the authorities) is desirable if only because of theneed to forecast the impact of policy changes.
Even if we were not interested in longer-term projections we might wish tohave a model Of the relationship between income and income taxation in orderto assist us in analysing past fiscal policy. It is well known t.hat changes in taxesand/or Government spending can affect economic activity and hence :total taxreceipts. Thus an o%served fall in income tax receipts may be due ,to a cut intax rates or a fall in incomes. In order to disentangle the effects we need amodel of the tax system which will allow us to evaluate the ,t’hrust of taxationpolicy and the impact on tax receipts of changes in economic activity.
In recent years in Ireland there has been considerable interest in, anddiscussion of, the public sector ’borrowing requ’irement as a measure of fiscalstimulus. {See, for example, Kennedy and Dowling (I97,5), Chapter I2 andTussing (i975).) Yet this aggregate is dependent on the level of economicactivity in ,that a fall in income could result in a rise in pu~btie borrowing. Thuschanges in the borrowing requirement per se .cannot tell us anything about thedirection of fiscal policy. Only when the induced effects of variations ineconomic activity on ~the revenue (and expenditure) totals have been removed
II

I2 THE ECONOMIC AND SOCIAL RESEARCH INSTITUTI~
can we consider using an aggregate like public sector borrowing as an indicatorof fiscal policy. Thus we need an estimate of the relationship between taxrevenues and income if we are to make estimates of the ’full employment’ or’ constant utilisation ’ budget balance. The relationship ’between personal ~comeand income taxation is an important part of the overall relationship betweenaggregate income and total taxation.
In a more general context a model of the income tax system is an importantcomponent of an overall econometric model of the economy. Even the simplestmodel would have to contain some relationship between income and ,taxation.Without empirical estimates of the relationship between income and taxationit is unlikely that more sophisticated and complex econometric models wouldyield useful policy predictions.
These then are some of the reasons for studying the relationship ,betweenpe1~onal income and income taxation. Of course, the way in which one mightspecify the relationship could depend on ,the purposes for which the investigationwas undertaken. For example, those interested in forecasting might want astructure that contained easily forecastable independent variables and might bewilling to sacrifice a good deal of inaportant detail ’in order to obtain usableshort-term forecasts. The longer-‘term planner might wish to ensure that themodel was specified so that projections several years ahead could ’be handled.He might, therefore, want a model which reflected the existing tax structureclosely and incorporated the constraints that the system Imposed." This wouldensure that future projections were unlikely to be too far out ’of line with bothcurrent ’behaviour and actual future behaviour. The fiscal analyst, while in-terested in both the forecasting abilities and correct structure of the model, wouldwish to have an explicit specification of policy variables. T.hen he would be ~blewithin the context of the model to examine the ’impact of policy changes thathave ,taken place.
The approach here is mainly a cona’bination of the fiscal analyst and theplanner. We have not attempted to develop a model that will produce short-term forecasts without adaptation. Indeed, it will ,be clear as our investigationproceeds that some of the independent variables we ’have used in our analysisare as difficult to forecast as tax revenue themselves. However, our work doesallow an examination of the consistency of any set of short-term forecastsincorporating tax revenue forecasts and ’income forecasts.1
Given the preference for a tax model which will reflect as closely as possiblethe nature of the tax code even at the expense of short-term forecasting use westill .have a choice to make between a time series approach and a cross-section
1 One ought not to over-emph.asise ,the ’ long-run ’ character of the model estima.ted in. ,thisstudy. Clearly, a correctly specified and e~’fimated model ought to be usable for both long-termand short-term forecasting purposes~ ,However, the short-term forecaster may be willing to
"sacrifice asymptotic constraints and data refinements in order to obtain usable short~term fore-casts which can be integrated into a larger short-term forecasting model.

SENSITIVITY OF INCOME TAX BASI~ 13
approach. Tlie use of a time series approach allows us to examine tax relation-ships by using aggregate measures which change over ’time. In general thevariables used are similar to those used in most general macro-econometricmodels of the economy which are based on time series. Thus a time seriesapproach is generally easier to integrate into a wider model, can be easily usedin conjunction with other aggregates and is probably the most extensively usedapproach. In file US for example, results have been reported by Cohen (1959),Clement (i9,6o), Brown and Kruizenga (1959), Lewis (i962), Ando and Brown(I9~63), Goode (19’.64), Ando and Goldfeld (i9~68), and, more recently, byPechman (i9’7.3). Time series results for the UK have been reported Iby Prest(1962) which were later modified by Morawetz (i 971), Musgrave and Musgrave(1968) and Hansen (I9~69). A time series approach was also adopted by Ander-sen (1973) in examining Danish data and by Choudhry (1975) in a study of theWest Malaysian income tax system.
A times series approach would probably be preferable to the fiscal analyst whowas attempting to construct, for example, a constant utilisation budget balance.The longer-term planner might, however, .have no strong preferences ’betweenthe time series approach and the cross-section approach. The latter may yieldmore information a,bou.t the structure of taxation but be difficult to integrateinto a larger framework which contains macro-economic varia’b]es on a timeseries ~basis.
The cross-section approach examines cross-section data on income distributionand tax payments for a particular year and derives the implicit relationshipsbetween national income and aggregate income tax payments from the disaggre-gated data. This has been done for the US by Pechman (i973) and for the UKby Pearse (i9,62), Balopoulos (1967) and Dorrington (i974). The advantage ofthe cross-section approach is that it makes it less difficult to examine the impactof changes in the tax code, e.g., increases in individual allowances or changesin the structure of tax rates, on the relationship between aggregate income andtax payments. Since personal income taxes are p~id by ’ households’ it is clearthat till information about the income and tax status of each household, whichwould depend inter alia on the demographic characteristics of the household,the structure of individual allowances, and the progressiVky of tax rates, wouldallow exact calculation of the effects of a change in allowances or rates or a unitrise in the incomes ’of each household. The main drawback to the disaggregatedapproach is that insufficient account is taken ’of the income distri~bution effectsof cyclical variations in aggregate income. Also, detailed distribution data arenot always available for every economy on a sufficiently comprehensive andup-to-date scale to permit short-run forecasts of changes in tax revenues.
Thus, for Ireland, the only pu,blished data on income distribution and taxpayments relate to I954 (See Reason i959/6o) and the more recent unpublisheddata which are available provide details of only a proportion of all taxpayers.Thls paper, therefore, attempts to estimate the relationship between personalincome and the tax base using annual aggregate data from i947 to I9’7~.

I4 THE ECONOM.IC AND SOCIAL RESEARCH INSTITUTE
However, in the specification of the equations to be estimated and the construc-tion of some of the variables used, an attempt is made to take accoun:t ofimportant changes in the tax legislation over the twenty-five year ,period?
Previous Studies in Ireland
The only published work on the relationship between taxes on personalincome and personal income in Ireland is that of Lennan (i97~). He ’concludedthat the nmrginal rate of persona1 taxation (i.e., the proportion of a givenincrease in personal income that ’is absorbed by personal income taxes) waso:o97 at I9’67/68 rates and o.I2O at I954/5.5 rates.
Lennan’s approach was identical to that of Prest (I96’2). The main problemfor both authors was to Obtain a series which represented personal :tax yield ata constant tax structure. This was achieved .by adopting the following methodo-logy ¯ the estimates by the revenue authorities of the consequences of any changein the tax code were assumed to be accurate. Thus if, in I959 say, personalallowances were increased and the authorities claimed that this would reduceexchequer revenue by £X million, then that amount was added to actual taxreceipts for i959 in order to obtain I959 receipts at the rates and allowanceswhich would have pertained if no changes had been made, i.e., at I958 ratesand allowances. In this way a series of tax yields at the rates and allowances forthe previous year was constructed. This can be represented as follows :
T°, Tb T~, T~ .... T~-~ (1)
where T° represents the tax yield in the base year and T~-~ represents the taxyield in the nth year at the rates and allowances in force £or year n--i.
A series at the rates of a single year is derived by assuming that the percentagechange in revenues at the ’base year rates and allowances ’is ~he same as thepercentage change in revenues between any two years at constant rates andallowances. Thus :
T° Tnn-1 (2)
T°_ -
fi’om whicho ro=
and ’by performing the same ’operation for To_1 ....... T~ we obtain
(3)
m ¯ __ .TOo TI ....
2 Appendix 3 provides ,the interested reader with a brief summary of the major changes in
the Irish personal tax code from 1947.

SENSITIVITY OF INCOME TAX BASE
Thus a series To° ... T° can be derived and this series forms the dependentvariable in the work of Prest and Lennan. Of course it is possible to derive, irt asimilar manner, a series at any year’s tax structure and ’both Prest and Lennanderive series based on the ,tax structure of the beginning of the period--~i95,4 inthe case of Lennan--and on the tax structure at the end of the period--i9,68for Lennan. In this way, the effect on the marginal rate of taxation of changesin the tax code between the two years can be examined.
The important question is, however, whether ’the methodology adopted byPrest and Lennan can validly reconstruct tax series at a given year’s tax structure.In the first place, is it possible ,to derive, in the absence of any information aboutmarginal tax rates, a series shown in (I)? In general, if the tax authorities areto estimate adequately the consequences for revenue of a change in the taxstructure in the next period, they will have to have some information aboutthe sensitivity of the income tax base to changes in income. Suppose, forexample, the relationship between taxable income and personal income takesthe form suggested for the US by Ando and Brown. Thus
TI = Y-A Y~ Ep (5)where TI is taxable income, Y personal income and E per cgpita exemptions.[’For this example population is assumed contant and its effects are subsumedinto the constant term A.] If the level of exemptions is changed (which wouldbe similar to a change in personal allowances in t;he Irish tax code) but incomeis held constant, then the effect of the changes in exemptions on taxable incomeis given by
arI* = A [e,#-Eg] (6)where the subscripts refer to periods I and 2 respectively. We note that toestimate ~xTI~, the change in taxable income due to a change in allowancesalone, we need information about A, a, fl". But it is clear that these are theparameters which any study of the responsiveness of income taxation to changesin income is trying to estimate. If they are kn,own to the tax aut, horities thena simple procedure would ,be to ask them for the information rather than tryingto estimate it ’by econometric met.hods] However, the problem for the revenueauthorities, even when armed with knowledge about ~e parameters of (5), ismore complex than this. If there are no changes in exemptions but incomeohanges between periods i and 2 then the change in taxable income is
ATX** = (r,- Y,) + AE,P (7)If ’both income and exemptions change between the two periods and the
total change in taxable income can be neatly divided into the change due toincome and the change due to exemptions, we would expect the total change
a If, however, the functional form of (5) is correctly specified ~then we can see that
A TI */Y1-TII= 1-(EE---2t)~
which depends on /~ alone. Thus, by knowing fl we could find ATI* providing we also knowcorrect speoifieation for TI.

16 THE; ECONOMIC AND SOCIAL RESEARCH INSTITUTE,
in taxable income to be equal to (6) plus (7). In fact, this, is, n’ot the case. Thetotal change in taxa’ble income when both income and exemptions change is
ATI = (Y2- Y~)-AY~E~ + AY~ E{ (8)
so that
ATI-ATI* = (r2- Y1) + AE~ [Y~- Y~] (9)
which for Eo, # E1 differs from (7) above. Even if the tax authorities were ableto calculate ATI~ this would not mean that ATI~, the change in taxable incomewhich would occur at unchanged exemption levels, could be calculated bysubtracting ,~TI~ from the actuM observed ch,’mge in taxa~ble income ATI. Thisis because the observed change cannot be simply divided into two independentchanges duc to tax law changes ,and income changes respectively.
Of course, there are no compelling reasons to suppose that the Irish. or UKtax systems can ’be represented by an equation with the form of (5). Equallythere are no strong a priori reasons why such a form is inapp’lic~ble. In generalit seems reasonable to suppose that the estimates made by the tax authoritiesin order to cost any change in the tax code are approximate and are based, inpart, on t;heir own estimates of the ’income elasticity of the income tax base andlikely changes in income. This is recognised, to some extent, by Prest since he(a) attributes all differences between predicted and actual tax yield to failureby the authorit’ies to predict income correctly and (b) subsequen,tly alters theestimate of the change in the yield due to the change in the tax rate by ’afurther small adjustment’. This :further adjustment would only be necessaryif the authorities’ estimates of the cost of a change in the tax structure werenot independent of the level of income. Of course, it is fair to point out thatthe size of the required adjustment may be quite small in most tax years.
However, even if we suppose that the adjustment process carried ou.t by therevenue authorities (as amended ’by Prest) is correct .there is still the problemof showing that equation (2) above is correct. Thus is it likely for the Irish orUK tax code that
TO/TO_l = T~-l/Tg:~ ?
In Appendix o we show that this reladonship holds if incomes are inidaliyPareto-distributed and if income growth preserves the distribution. However,the appendix also assumed that there was only one level of personal allowancesper taxpayer so that the demographic characteristics of the taxable populationwere ignored. The appendix also indicates that for ’incomes which are log-normally distributed the relationship does not hold. It is frequently assertedthat Pareto distributions provide a good fit only at the upper range of .incomesand ,that the distr’ibution of most incomes can be better approximated ,by alog-normal distribution.4
" See, for example Pen (I97x). We note also that Stark (i972)found that the Pareto-curvedid not provide a good statistical approximation to the distribution of incomes in ~he UK,

SENSITIVITY OF INCOME TAX BASE 17
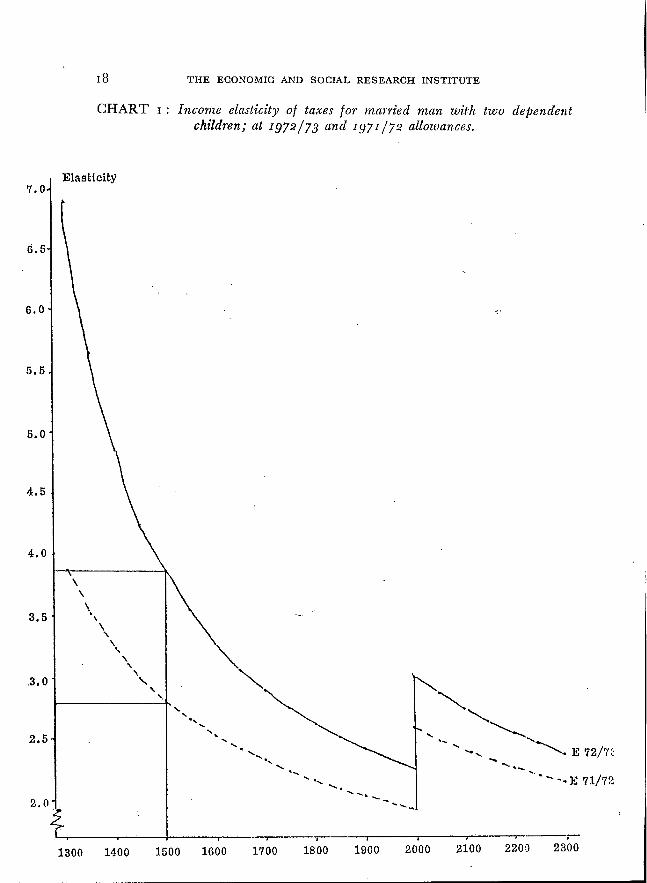
We can see from Chart I that for any individual in the Irish tax system thePrest relationship does not hold at I971/72 and I972/73 rates and allowances.Although we have drawn the curves for a married man wi.th two dependentchildren (both over i i) the shape is ’broadly similar for almost all types ofhouseholds. At i972/73 rates and allowances we can see that the income elasti-city of income taxation for an individual on £I,5oo p.a. was 3-9. Thus ifincome rose by Io% to £I,65o the increase in tax paid would be approximately39°/0. For the I97-0/73 tax structure we see that
T~_~ - 1.387
where n-I is I97-0/73 and n the following year in which income rose by io%.However under the I97I/7-0 structure of rates and allowances a IO% rise inincome from £I,5oo p.a. would result in a smaller increase in tax paid--28%.So
r~-2= 1.28
If we take 1971/7-0 tax rates as the base year structure we can see that
70 T -IT~°- 1 =fi" T~--I
mad that the percentage change in tax receipts duc to a given percentage changein income is not independent of the tax structure for individuals. I.t ~s difficultto see how the process of aggregating individual tax liabilities, other than underthe conditions outlined in the Appendix, would lead to a situation where theincome elasticity of aggregate tax liabilities was independent of the tax structure.
Even if the Prest/Lennan methodology did not give rise to problems thereare other difficulties in accepting the Lennan estimates for Ireland. In particularhis model made tax receipts dependent on the level of personal income. As weshall see later the level of personal income ’is not an appropriate measure ofincome to use in connection with income taxes in Ireland. This is becauseagricultural incomes and most personal transfer payments are exempt fromincome taxes in Ireland and these components have changed as a share ofincome over time.
THE ECONOMIC AND SOCIAL RESEARCH INSTITUTE
CHART i : Income elasticity o/ taxes for married man with two dependentchildren; at 1972/73 and i97r/72 allowances.
1300 1400b J ~ i i
1500 1000 1700 1800 1900 2000 2100 2200 2300

Chapter 2
The Model Outli’ned
Taxable Income and the Tax Base
I: a study of the relationship between income ’taxation and personal incomenumber of approaches are possible. We might, for instance, be ’interested
in the relationship between income tax receipts and the aggregate level ofincome. This is likely to be ’the case if our objective is to obtain estimates whichwill be of use :in forecasting Government revenue from income taxation.However, we might also be interested in determining the relationship betweenthe tax base and aggregate income. This relationship will depend, in general,on the provisions of the tax code, the distribution of income and the changesin that distribution which may occur over time. If we can determine therelationship between tax receipts and income directly, then there may not beany need to estimate the relationship between income and the tax base. Thisis because tax receipts depend on the interaction of the tax rate (or structure oftax rates) ,and the tax ,base, which, in turn, depends on the ’interaction ofaggregate income and the provisions of the tax code. For some tax systems itmakes more sense to estimate the relutionship between tax receipts and incomewhile .for other systems the logical approach would ’be to determine the relation-ship between the tax base and income first and then the relationship betweenthe tax base and tax receipts. Indeed the latter approach is more comprehensivein that it all’ows the investigator to separate out the influences of changes in thetax code, which affect the tax base and thence receipts, from changes in thestructure o1" level of tax rates which affect receipts directly.
Suppose that T equals tax receipts, Y equals income, B the tax base, or thatportion of income which is taxable, and t equals the tax rate. Then
T = tB = tf(Y) (10)
where f(Y)expresses the functional relationship between the tax base and income.I{ we differentiate this expression with respect to Y we obtain
5T 6B (11)8y-t ~-’~=tfy
where ~T/~Y is the marginal tax rate and [~ is the marginal response of the taxbase to a change in income. Now in any economy where t was a fixed constantover time it would make little difference whet, her one attempted to discover~T/SY or fu. The former would simply be a constant multiple of the latter.Bu.t suppose that the tax rate, t, was not constant over time either because offrequent changes by the Government .or because the tax rate depended on thelevel of taxable income. This latter situation could occur i,f instead ’of a standard

00 THE EGONOMIG AND SOGIAL RESEARGH INSTITUTE
rate of tax there were a series of tax rates which changed according as thelevel of taxable income rose--as Js the case in the US, UK and Ireland (afterApril 1974). In that case we would have to specify the tax rate as
t=g(B) (12)
so that
6T/fr=f,[f gB+g] (13)
Thus the marginal response of tax receipts to changes in iiacome depends onthc relationship between income and the tax base and the relationship betweenthc tax rate and the tax base. In this study we will be concerned with exploringthe relationship between the income tax base and aggregate income. Thus wewill not attempt to specify and estimate a model which would explain thedeterminants of incometax receipts from i947 to 1970. There are a number ofreasons why this study concentrates on the tax base rather than receipts.
For the period under review income tax revenue depended on the applicationof a standard tax rate to a tax base, as in equation (Io) above. A,t several timesduring the 05-year period from 1947 to 197° this standard rate of tax was variedas part of general fiscal policy. Thus tax revenue depended on the size of thetax base and a given standard tax rate. As long as the standard rate is knownit naakes little difference whether one attempts to estimate the revenue or thetax base.
From i974. the concept of a ’standard’ r~te of tax on personal taxableincome has been abolished and l’eplaced with a tax structure which makes therate of tax dependent on the level of taxable income. If the model developed inthis study was :to be usable in the new tax structure it was essential to concen-trate on the tax base wlfich is still an important determinant of tax revenuesunder the new code. However to get from the tax base to tax receipts wouldrequire further work on an explanation of the relationship between the tax rateand the tax base, i.e. an empirical estimate of the relation in equation (I2).Unfortunately no data are available at present on the 1974/75 tax code and soour attention has been wholly concentrated on the tax .base.
A further important reason for concentrating on the tax base rather thanon tax receipts is the lag between assessment ’of tax liabilities and revenuecollection. There are lags between the time when income ’is earned and whenit is assessed for tax. These lags depend on the type of income, with little orno lag between earnings and assessment for PAYE income (since 19’6o/61) andquite long lags in the case of self-employed persons. However, there are evenfurther lags between assessment and collection ’of income taxes. Thus, prior tothe introduction of PAYE, taxpayers (excluding Civil Secants and others witha statutory deduction scheme) who were assessed for a certain amount of taxin respect of, say, I950/53 would be required to pay half the tax in JanuaryI954 and the balance in July 1954. Thus receipts ’in the tax year r953/54would reflect assessments for I952/53 and 1951/52. The data provided bythe Revenue Commissioners do not relate receipts in any tax year to the

SENSITIVITY OF INCOME TAX BASE 2 I
corresponding assessment year. Therefore it is not possible to say what propor-tion of revenue in 19.53/54 was in respect of assessment for 1952/53.
The introduction ,of PAYE, where assessment and collection is virtuallywithout a lag, altered the nature of the lag structure and made the assumptionof a constant lag structure over the whole period untenable. The failure ofsome taxpayers to pay on time can also interfere with the lag between assessmentand payment.
The Tax Base in Ireland
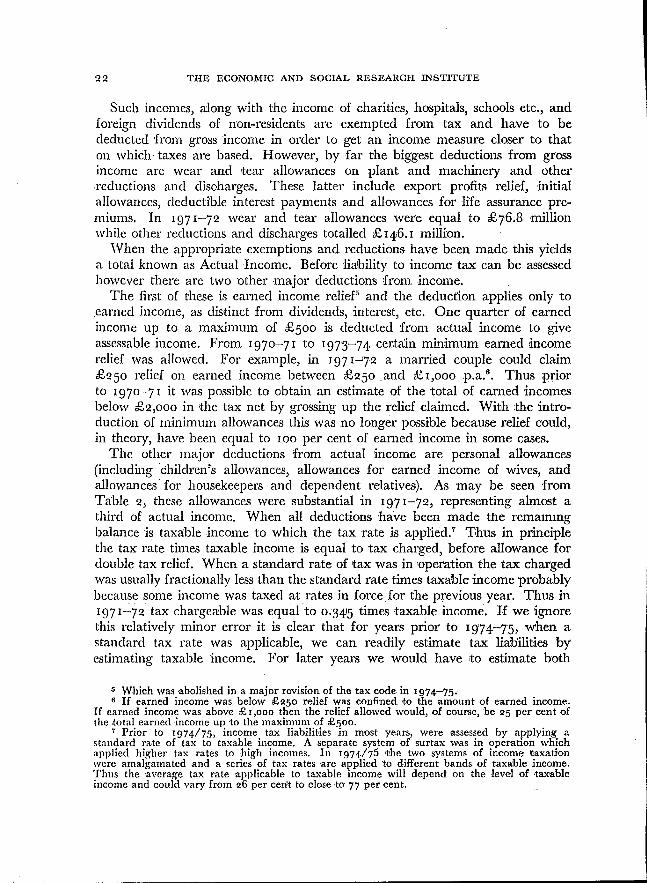
Before outlining the structure of the model .of the personal tax system inIreland which we intend to estimate it would be helpful to set out the mannerin which data are available from the tax authorities on the income tax base.In the annual reports of the Revenue Commissioners details of assessments foreach tax year are available. A slightly condensed version of the income taxassessments for 1971/72 are shown in Table i below.
TABLE I : Income tax assessments made in I97x/72
.
Gross Incomeless Exemptions and Reductions
Actual Incomeless Earned Income Allowances
Assessable Incomeless Personal Allowances and Deductions
million
I,I66.I228.4
937"7I92.8
744’9309 "4
4" Taxable Income 435.5
5. Tax Ghargea’ble I5O.2
Source: 5oth Annual Report of the Revenue Commissioners
Gross Income represents the total anaount of income that comes to theattention of the Revenue Commissioners. It thus includes company profits,incomes of traders, professional earnings, and wage and salary incomes beforeany allowance for expenses. Incomes which are below the exemption limit(i.e., incomes on which no tax liability would arise either because income wasbelow the minimum effective exemption limit of £399 in 1971/72 or becauseincome was below the personal allowances available in the tax code) areexcluded from gross income except for some small amounts of income whichfor one reason or another happens to come under the scrutiny of the RevenueCommissioners.
THE ECONOMIC AND SOCIAL RESEARCH INSTITUTE,
Such incomes, along with the income of charities, hospitals, schools etc., andforeign dividends of non-residents are exempted from tax and have to bededucted from gross income in order to get an income measure closer to thaton which taxes are based. However, by far the biggest deductions from grossincome arc wear and .tear allowances on plant and machinery and otherreductions and discharges. These latter include export profits relief, initialallowances, deductible interest payments and allowances for life assurance pre-miums. In I971-72 wear and tear allowances were equal to 276.8 millionwhile other reductions and discharges totalled 2146.i million.
When the appropriate exemptions and reductions have been made this yieldsa total known as Actual Income. Before liability to income tax can be assessedhowever there are two ’other major deductions from income.
The first of these is earned income relief5 and the deduct’ion applies only tocarned income, as distinct from dividends, ’interest, etc. One quarter of earnedincome up to a maximum of 25oo is deducted from actual income to giveassessable income. From 197o-71 to 197’3-74 cel:t~in minimum earned incomerelief was allowed. For example, in i97i~7;2 a married couple could claim2.o50 relief on earned income between 225o and 21,ooo p.a2. Thus priorto i97o-71 it was possiblc to obtain an estimate of the total of earned ’incomesbelow 22,000 in .the tax net by grossing up the relief claimed. W.it.h :the intro-duction of minimum allowances this was no longer possible because relief could,in theory, have been equal to IOO per cent of earned income in some cases.
The other major deductions from actual income are personal allowances(including children’s allowances, allowances for earned income of wives, andallowances for housekeepers and dependent relatives). As may be seen fromTable 2, these allowances were substantial in I971-72, representing almost athird of actual income. When all deductions have been made tile remammgbalance is taxable income to which the tax rate is apptied7 T, hus in principlethe tax rate times taxable income is equal to tax charged, before allowance fordouble tax relief. When a standard rate of ,tax was in ,operation the tax chargedwas usually fractionally less than the standard rate times taxable income probablybecause some income was taxed at rates in force for the p1"evious year. Thus in197 IL72 tax chargeable was equal to 0.34)5 times taxable income. If we ’ignorethis relatively minor error it is clear that for years prior to i9’74-75, when astandard tax rate was applicable, we can readily estimate tax liab’ilities byestimating taxable income. For later years we would have ~o estimate both
5 Which was abolished in a major revision of :the tax cod~ in x974-75.’6 If earned income was below £~5o relief was confined .to the amount of earned income.
If earned income was above £I,ooo then the relief allowed would, of course, be ~5 per cent ofthe ,total earned .income up to the maximum of £5o0.
Prior to 1974/75, income tax liabilit.ies in most years, were .assessed by applying astandard rate of tax to taxable income. A separate system of surtax w.as in opera2tion whlchapplied higher tax rates to high incomes. In 1974/75 �he two systems of income ~axadonwere amalgamated and a series of tax rates .are applied ’to different bands of taxable income.Thus the average tax rate applicable to taxable income will depend on the level of ,ta~ableincome and could vary from 26 per cer/t to close ,to 77 per cent.

SENSITIVITY OF INOOME TAX BASE 23
taxable income and the average effective tax rate, which would depend ort thelevel of taxable income as well as the graduated structure of tax rates.
We noted earlier that there was a lag between the assessment of income taxand its collection. This lag arises in part from the fact that, for the periodunder review, some income tax was not payable in the tax year of assessment.Part ’o~ the lag is due to the failure of taxpayers to pay taxes promptly. Forexample in June 1973 some £ 13.9 million of taxes assessed in respect of 1971"272(or 9.3 per cent of the total) were still outstanding due to appeals, delays due tobankruptcy or death, or non-payment.
The lags greatly reduce the value of a secoltd source of data on personaltaxation which are available in the National Accounts. There we can obtain anestimate of personal income ,tax receipts which is Ibased on an apportionmentof total income tax receipts between the company and personal sectors.
In the past, particularly during the I9,5os, there have ,been occasions whena reduced rate of tax was payable on the first and second £IOO of taxableincome--in fact a structured system somewhat like the pre-i974-75 tax code.For those periods tax receipts would be affected ~by alterations in the ,tax ratewhelxas taxable income would not. Thus if we concentrate on taxable incomerather than receipts we can avoid the complications that arise due to variationsin the standard rate of tax, changes in the structure of tax rates and alterationsin the nature and length of lags between assessments and payments of taxcaused by the introduction of PAYE.
It might also be argued that the macro economic implications for saving andconsumption of personal income taxation should be examined in the contextof tax lia~bilities rather than payments and this would suggest that we mightbest concentrate on the determinants of liaJbilities {or income tax rather thanreceipts.8
The Structure of the ModelOur interest is to estimate the determinants of the income tax base, i.e.,
taxable income. As we have seen, taxable income depends on actual incomeand the level of earned income relief and personal ~dlowances claimed. Nowit would be possible to try and esthnz~te an equation for taxable income whichincluded, as independent variables, personal income and other variables relatingto the tax code. However, it would seem more appropriate to estimate thedeterminants of taxable income by following the logic of the tax assessmentprocedures adopted in Ireland.
If all individual incomes were sufficiently .high, and if all forms of incomewere taxable, we would expect that actual income, as measured by the RevenueCommissioners, would be close to personal income as measured by the NationalIncome estimates. Of course, even at high levels of individual incomes, differencesbetween the: two aggregate income measures would occur. These differences
8 See ,Dowling (i972).

THE ECONOMIC AND SOCIAL RESEARCH INSTITUT]~
would be due to differences" betweert the Revenue Authorities and the NationalIncome compilers in the treatment of depreciation, interest deductions and otherexpenses. However, we would expect any discrepancies to ,be relatively smallat least compared to the gap between the qcwo measures that exist at present.
The main reasons {or the discrepancy between Actual Income and PersonalIncome are the exclusion of certain forms of income from the tax net and theexclusion from the measure of Actual Income of almost all incomes which arebelow the tax threshold set by personal and other allowances. The exclusion ofcertain forms of income from the tax net affects the measure of personal incomewhich is appropriate for use in tax analysis. This aspect will be discussed laterin .the section oll the data used in the study.
But the key aspect of this study--and of many studies carried out for othereconomies--is that the tax base is greatly influenced by the level of personalallowances granted in the tax code. If personal allowances are high relative toincome levels, then file tax base will be quite small in relation to income; onthe other hand, when personal allowances are low relative to income, the pro-portion of income falling into the tax net will be large. For a given distributionof income and a given level of personal allowances, it is likely that as incomeincreases, more and more income will come ’into the tax net and the coverageof the tax system will rise until eventually all income is included in the measureof actual income. Thus we would expect Actual Income to approach PersonalIncome (adjusted to exclude tax-exempt income) as the level of personal incomerises. Also changes in the level of personal allowances will affect the proportionof personal income that comes within the tax net.
Changes in personal allowances will also affect the size of personal allowancesclaimed. In general, we would expect that ’if the tax code increased the levelof personal allowances, the amount of allowances actually claimed would rise.However, there are exceptions to this general rule in that a very large rise inpersonal allowances could remove a substantial amount of income from the taxnet and so reduce the amount of personal allowances claimed even thoughindividual rates of allowance had risen. This possibility is a result of the exclusionfrom the tax net of almost all .those whose incomes are :below the minimumamount set by the level of personal allowances. We would also expect that asincome rises, even with unchanged individual personal allowances, the levelof personal allowances claimed would rise. T’h’is is because the increasing level ¯of income Brings persons, who were previously bdlow the tax threshold, intothe tax net and so they claim personal allowances.
Thus the level of Actual Income, and the level of personal allowances actuallyclaimed, will be influenced by the level of personal income and the rate ofpersonal allowances granted in the tax code. Since we are dealing with fairlyaggregate measures we need some aggregate va1’iable to account for the levelof personal allowances granted in the tax code. The most Obvious; choice is anaggregate measure of personal allowances claimable by the .population. Thusif everyone was in the tax net then a certain aggregate amount of allowances
SENSITIVITY OF INCOME TAX BASE 25
would be clain~ed. This ao-gregate would depend on the structure of the popula-tion and the rate of individual tax allowances. In general the amount ofallowances actually claimed would be below this measure but as incomes rosewe would expect the two aggregates to converge.
The other major deduction clainmble in the tax code is earned income relief.Prior to 1974/75, and for the entire period to which this study relates, individualswere allowed to deduct a certain fraction of their earned income, up to a fixedlimit, from their actual income in order to determine their liability to incometax. This, in effect, gave a lower rate of tax on certain portions of taxableincome and the introduction of a structured tax rate in 1974/75 gave anopportunity to abolish this type of relief. However, while it was in operationthe only changes ’in the rules for earned income relief concerned the rate of reliefand the maximum amount of earned income which qualified for relief. Thuswe require relatively few additional variables, along with actual income, inorder to specify the determinants of the amount of earned income claimed.
Of course there have been many other modifications to the tax code duringt.he post-war period but these have tended to be of particular importance forcompany rather than personal taxation or else have been of minor importancein the likely impact on the personal tax base. In any event it is not possibleto deal with the consequences for personal income taxation of changes in therules on the depreciation of fixed assets, dou~ble tax relief, etc., because of thelack of available data. Thus we have constructed a relatively simple model inwhich the tax code can be represented by ml aggregate measure of personalallowances available and by variables relating to the rate of earned incomerelief. We would expect that most of the other minutia~ of the tax code wouldbe captured in the relationship between personal income and Actual Incomeand that the tax code provisions as they affect personal income taxation havenot changed so dramatically as to affect this relationship in a serious manner.
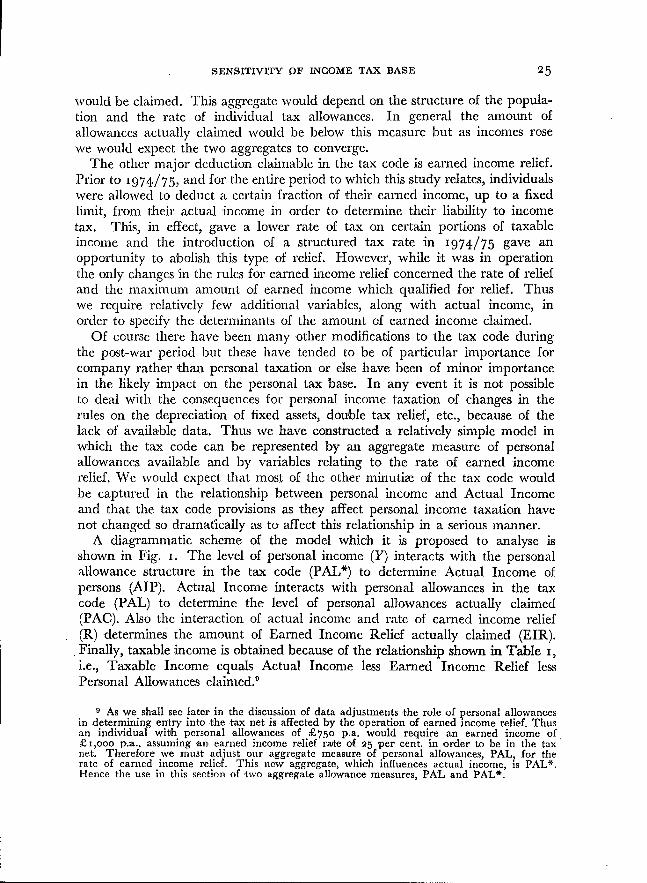
A diagrammatic scheme of the model which it is proposed to analyse isshown in Fig. I. The level of personal income (Y) interacts with the personalallowance structure in the tax code (PAL*) to determine Actual Income ofpersons (AIP). Actual Income interacts with personal allowances in the taxcode (PAL) to determine the level of personal allowances actually claimed(PAC). Also the interaction of actual income and rate of earned income relief(R) determines the amount of Earned Income Relief actually claimed (EIR).Finally, taxable income is obtained because of the relationship shown in Table i,i.e., Taxable Income equals Actual Income less Earned Income Relief lessPersonal Allowances claimed2
9 As we shall see later in the discussion of data adjustments .the role of personal allowancesin determining entry into t,he tax net is affected by thc operation of earned income relief. Thusan individual with personal allowances of £750 p,a. would require an earned income of£i,ooo p.a., assuming an earned income relief ra~te of 05 per cent, in order to be in the taxnet. Therefore we must adjust our aggreNate measure of personal allowances, PAL, for theratc of earned income relief. This new aggregate, which influences actual income, is PAL%Hence the use in this section of two aggregate allowance measures, PAL and PAL*.

06 THE ECONOMIC AND SOCIAL RESEARCH INSTITUTE
Within the general framework outlined above we can examine some a priorihypotheses about the likely effects of the independent variables. We wouldexpect that as potential allowances claimable rise relative to personal incomethe amount of income in the tax base (/kiP) would fall..Similarly a rise inpersonal income for an unchanged level of allowances would cause the tax baseto widen since some individuals would cross the threshold into ,the tax net.More formally we would expect the relationship to be
AlP --- f(Y, PAL*) withf~ > O, f2 -< 0 04)
where [1 and [2 are the derivatives with respect to .the first and second arguments.The assumption that f2 might be zero is based on the view that at some relativelyhigh level of income when all taxpayers are in the tax net a change in the levelof allowances will not result in any less income being brought into considerationby the Revenue Commissioners. However, in this case it is clear that a changein PAL would lead to a change in allowances claimed and would thus affectTaxable Income,
Indeed the effect or a change in the level of allowances granted on theamount of allowances claimed may be less clear-cut for many levels of income.When the rate of allowances in the tax code is raised this may tend to reducet.he numbers within the tax net, since some individuals will now have allowancesin excess of their income. This reduction in the numbers in the tax net mayoffset the rise in allowances claimed by those still in the tax net so that allowancesclaimed actually fall. However as the number in the tax net increases and asincome rises relative to the level of allowances it is likely that a rise in allowancesgranted will cause a rise in allowances claimed. ~Phus at the upper limit a givenchange in PAL cannot cause a greater change in Mlowances claimed (PAC).
A change in Actual Income caused, say, by a change in Personal Income Willtend to lead to a change in the level of allowances claimed. However, if allindividuals are in the tax net then a small fall in Actual Income due to areduction in personal income would .probably not ’have any effect on the levelof allowances claimed. "Phus when income is very large relative to allowancespermitted in the tax code (so that PAG is close to PAL) a change .in income isunlikely to lead to any change in the level of allowances claimed. Again, moreformally, we would expect the relationship between allowances claimed, incomeand ,’fllowances available under the tax laws to be
PAC = g(AIP, PAL) with gl > 0, -PAC>g2< 1 (15)
w.here gl and g2 are the derivatives with respect ~o the first and second argu-ments. While the lower limit of g~ is --P~G, which indicates that no changesin PAL can do more than remove all ’individuals {rom the tax net, it is tanHkelythat this limit will be approached; for at that point income taxes cease to ~be paidsince no income is within the tax net.

SENSITIVITY OF INCOME TAX BASE
FIOURE I : Structure of personal income tax mo,ctel
Y
(Personal Income)
,,,, , ° t
iI i
, ,i,,, J ~,,
Rrna×! Rmln PALt PAL~
(Rate oF Earned (Personal Allowances in Tax Code)Income RelieO

08 THE ECONOMIC AND SOCIAL RESEARCH INSTITUTE
A change in ActualIncome is likely to give rise to a change in earned incomerelief. However, this would only be the case if the rise in Actual Income wasdue to a rise in earned income within the tax net which accrued to individualswho were not previously claiming the maximum allowance. Thus it is possiblethat a l"ise in Actual Income would not generate any change in Earned IncomeRelief claimed. Similarly a fall in Actual Income might have no effect onEarned Income Relief if ,the fall was due tO a reduction in the income of thosewhose eaxned income already well exceeded the maximum limit for relief. Onthe other hand, a change in the rate of earned income relief would almostcertainly cause a change in the mn’ount of relief claimed and the directionshould be unambiguous; however,in the rate of earned income reliefIncome Relief claimed. For thesuggest that we would expect
EIR = I(AIP, R) with ll > 0,/2 > 0 -
where R is .the rate of earned-income" relief.
Specification of Tax Relationships
we shall see that it is possible ’th‘4t _an .increasecould reduce Actual Income and thus Earnedmoment we will ignore this possibility and
(16)
\,
We have now set out in general form our expectations about the relationshipsbetween personal income, the tax code and personal income. We now turn tothe task of specifying" the exact form of the relationships between personal income,income tax allowances, the rate of earned income relief, and taxable income.
In our specification we ought to take account ....... of the general constraintsimposect by the logic of the ,tax system. Thus, for example, we would expectthe response of Actual Income to a change in personal income to approachsome asymptotic level. When most ’individuals are excluded from the tax netbecause of high personal allowances a rise in personal income will be only partlyreflected in ,4 rise in actual income. The balance will simply reduce,the amountof excess allowances. However, for a given level of allowances each increase inpersonal iiicome tends to exhaust some individuals’ allowances and push theminto the tax net. Eventually everyone is in the tax net and any further increasein persona! income will be reflected in actual income although the exactrelation-
ship will depend on the effect of other factors in the tax code, such as interestrelief, special treatment of dividends of Irish companies etc. In general wewould not expect the asynaptotic marginal response of actual income to achange in personal income to exceed unity; indeed we would expect it to beless than unity since it is likely that the tax code is more generous in its conceptof income (from the taxpayers standpoint) than the authors of the n~tionataccounts?°
a0 However, this does not mean that at any poin,t less ~han the asymptotic level the marginalresponse of actual income to a change in personal income must be less than un,iW. Suppose

SENSITIVITY OF INCOME TAX BASE 29
Similarly we must take into account in our specification the fact thatasymptotically the marginal response .of actual income to a change in the levelof personal allowances that could be granted is zero. Presumably a~ some pointa rise in personal allowances granted will only have an effect on allowancesclaimed and not on actual income.
Because the process of moving into the tax net for any individual is discrete--one is either in the net or not--we would expect that the aggregation ofmany individuals within the economy would lead to a highly non-linear relation-ship between actual income, personal income and personal allowances. Tosome extent the non-linearity will reflect the distribu.tion of income since aperfectly equal distribution of personal incomes would mean that either everyonewas in the tax net or nobody was--Mth’ough this does ignore the consequenceson different family size and different interest and other deductible paymentsmade by individuals.
In order to meet as far as possible the constraints which can be imposeda priori we suggest the following specification.11
AIP = f(Y, PAL, Rmax)
PAL* PAL.2
=ao+al Y+a2 ~+ a3 y (17)
The introduction of a squared term was to capture better the expected non-linearities. Admittedly, we might have allowed a more general specificationso that the estimation procedure would have determined the degree of non-!inearity. However, such non-linear estimates pose considerable problems whichdid not seem justified in the light of our subsequent empirical findings on theestimation of equation (i 7). We note that the derivatives with respect to Y andPALm are
1fy = �$AIP/SY = as - ~-(a2 PAL* + a3 PAL.2) (17a)
fPAL = 5AIPfl5PAL = 1 (a2 + 2a3 PAL*)1
(17b)1 - Rm,x
that Personal Income of 24oo million is distributed as follows:
£ millionIncome > 21ooo t7~.o£990 < Incomes < 21000 2.4Incomes ~ £990 225.6
where only incomes above 2I,ooo are included in the tax net. Thus Actual Income wouldbe 2x72.o million. Suppose a rise of 1 per cent in all incomes, i.e., a rise in Personal Incomeof 24 million. Those incomes in the range 99o-iooo would now enter the tax net. ThusActual Income would be I.ox (ITU.O + u.4) or 2176.I4 million so that the rise in ActualIncome of 24.14 million would be I.o36 times the rise in personal income. We note *hat thisexample only required o.6 per cent of total income to be within I per cen, t of the vhresholdwhich is well within the range of possibilities.
xl For ease of exposition we omit ~the error .term in this and subsequent equations. How-ever, the model is assumed to be stochastic.

3O THE ECONOMIC AND SOCIAL RESEARCH INSTITUTE
6AIPIn the case of--~- it is clear that it will approach at asymptotically. Whether
it will do so from above al or below it will depend on the signs and relative sizesof ao. and aa. Similarly it is clear that 8AIP/3PAL will asymptotically approachzero and its sign will depend on the sign and relative size of as and as. If oura priori expectations are to be fulfilled and if the estimates are to be at allrealistic it is clear that (a2 + 2a3 PALe’)/Y will have to ’be negative.
In the case of personal allowances claimed we also have a pr/ori expectationsxbout the asymptotic values Of the derivatives. As actual income gets verylarge for a given tax code we would expect that the amount of allowancesclaimed would approach the amount of allowances potentially clalm~ble. Atthat point a change in actual income would have no effect on the level ofallowances claimed. Similarly in the limit we would expect a change inallowauces granted in the tax code to be fully reflected in the amount ofallowances claimed. Thus the following specification was indicated.
PAC = g(AIP, PAL)= h(Y, PAL, R max)(18)
=exp [bI +b2 I/AIP+ba PAL/AIP+In PAL]
In theory bl ought to be zero, since PAC/PAL should asymptotically approachunity, but because of the appro~mate method of our calculation of PAL itmay not be zero when estimated. However, we would be seriously concernedif bl differed substantially from zero, since this would suggest su’bstantial errorin our estimation of PAL or ’our specification of PAC.
A change in AIP, perhaps due to a change in Y, will have a direct effecton PAC. Thus
6PAC PAC
6AIP = gA,,p = - (b2 + b3 PAL)AIp2 (18a)
On the other hand, a change in PAL will have both direct and indirect effectson PAC--the latter effect due to the influence of PAL on AIP. So
PAC PAC PAC= PA---E + b3 Xig - f~’AL (b2 +b3 PAL)
which can be evaluated using (x7b) ~bove.
It is clear that 8PAC/SAIP will approach zero for any given level of PALas income increases. Similarly ~’PAC/~PAL will approach PAC/PAL as incomerises; since PAC/PAL approaches unity (given bl equal to zero) this meetsour a priori expectations. The sign of b2 + b~ PAL will determine the sign of8PAC/~A’IP. The sign of SPAC/SAIP will depend also on the sign of f, PALand on b3 and .the relative magnitudes of the coefficients.
The specification of the equation for Earned Income Relief gives rise to someproblems. In the first place the rate at which relief can ’be claimed has varied

SENSITIVITY OF INCOME TAX BASE ~ I
over the period and so an explicit varigble for the rate must be included.Similarly, the maximum amount of income which is eligible for earned incomerelief ’has also varied over the period. However, we have not been able to takethis into account in our specification, since information on the size distribut’ionof actual income was not available. However, the upper limit has remainedunchanged since I96I, when it rose from £I,8OO to £2,000, and so the likeli-hood of serious error in the estimates since then is small. Indeed it would seemthat changes in the maximum allowable income eligible for eanaed income reliefhave not, in the past, had much effect on the amount of earned income reliefclaimed. However, this may be due to the fact that for the period up to I9!6ithe upper limit was high relative to incomes in the tax net; thus we cannotconclude that a change in the upper limit in i97,2/73 would not have ’had asubstantial effect on the amount of earned income claimed nor will we be ableto give any estimate of the likely magnitude of any such effect.
It is clear that in the limit the ratio of earned income relief claimed to actualincome cannot exceed the rate of earned income relief. If all incomes in the taxnet were below the limit for earned income relief and all income was earned,then the maximum amount of relief would be claimed. In general, since allincome in the tax net is not earned and since some incomes are above �he limit,the ratio of earned income relief claimed to actual income is less than the ratefor earned income relief. Indeed, we would expect that as income rose moreindividuals would be pushed ’over the limit for earned income relief so that theratio would at some point start to decline; the point at which the decline wouldoccur wonld depend on the level of income. Similarly, for some levels ’of incomethe ratio would rise as income increases. Such a scenario is plausi’ble when it isacknowledged ’that a substantial part of the rise in actual ’income may be dueto new entrants to the tax net who would "be claiming relief at the full rate.Thus we specified the equation for the determination of Earned Income Reliefas follows :
EIR = 1 (AIP, R.,~x R,,,,,, )
o,, A,P + ]The third term in the equation is an attenlpt to adjust for two rates of reliefwhich were in operation during the I95OS. For example, in I957/58 earnedincome relief was .granted on ~5 per cent of the first £8oo and ~o per cent ofthe next £i,ooo. In this case it is conceivable that the ratio of earned incomerelief claimed to actual income could be 2,5 per cent but it ’is more likely thatthe ratio would be lower than if relief was granted at a rate of 25 per cent forall incomes up to £i,8oo. Thus our specification with R,,,~. the higher rateand R.a,, the lower rate attempts to take account of such a possibility albeitin a rather crude .manner. We note that the derivative of EIR with respect toAIP is
l~i~ = - c~ EIR/AIP2 + % EIR/AIP (19a)

THE ECONOMIC AND SOCIAL RESEARCH INSTITUTE
so that if c~ is less than unity then .the ratio of earned income relief to actualincome will decline as income increases unless cl is negative in which case it ispossible that EIR/AIP will at first rise as income increases and then fall. Give~nthat our main concern, iswith taxable’ income rather than the components ofthe Revenue Commissioners data, we can combine equations (17), (18) and (19)because
TI = AIP--PAC-EIR
Tiros we see that
(20)
(21)~TI=5 - - ta,,/.,= L(l-gaze- law)
and from (I7a), (I8a) and (I91) we obtain
E ’18TI PAL* PAC EIR - ct ~ (21a)
6Y - a~ - ~ (a2 + 13 PAL*) 1 +A--T~-(b2 +ba PAL)-~i-~c2
Similarly we can derive
~TI-- ft",~L -- g~m’fexz --gt"aL -- lalPfl"XZ,
¯ 6PAL ’
= feXL (I -- gate -- law) - gear., (21b)
From (I 7b) and (I 8b) we can obtain values for [V,~L g l’aL while the contents ofthe bracketed expression can be evahmted from (2 I a).

Chapter 3
Data Adjustmenes
THIS far we have constructed a formal model of the tax system which wewish to estimate. But before turning to any empirical work it is necessary
to examine the quality of the availa, ble data and see what adjustments have tobe made in order .to ensure that the model can be properly estimated. Furtherwe shall have to construct a variable to account for the aggregate level ofallowances permitted under the tax code.
The main data adjustments involve the construction of a personM incomeseries appropriate for tax analysis, the adjustment of calendar year data to atax year basis, and the removal of the effects of company income taxation onthe Revenue Commissioners’ data on taxable income.
The Measurement o[ Personal Income
We have noted earlier that not M1 forms of personal income are potentiallyliable to income tax. In particular two important components of personalincome, income of independent traders ’in agriculture and personal transfersby the public authorities, give rise to prol3tems. Prior to I9,T4/75 profits arisingfrom agriculture were not liable to income taxa.tion,a2
Thus if, in a given year, personal income rose by £x million because agri-cultural income rose by £x million the marginal rate of tax on the incrementwould have been zero. If agricultural income remained a constant proportionof personal income throughout the period under examination no great errorwould be introduced ~by using total personM income as a variable to measureincome likely to come under review by the tax authorities:is Iffowever, we can
12 Under schedules A and B taxation (which was abolished from I969/7o) profits fromfarming were taxed on a notional basis--the base being the rateable valuation in the case ofschedule B and 7/8 valuation for sohedule A. Since personal allowances could be offset againstthis notion.al assessment few incomes .arising from agriculture were taxed and .the base was, ofcourse, insensitive to changes in agricultural income from year to year. The inclusion ofcertain farm profits into the category of .taxable profits from 1974/75 does not, as yet, meanthat ~taxable income is. sensitive to the level of farm ,income. To date farmers can use thenotional income basis for assessment (i.:e. a notional income of £4o per £ valuation isassumed) if ,they wish and preliminary evidence suggests ,that almost all garmers are optin.gfor this system which is invariant to the level of farm income. Since rates, wages and depreci-ation of pl.ant and machinery can be deducted from the low notional multiplier the notionalsystem also results in very low revenue yield.
18 T~he resulting marginal rate would of course be dependent on the assumption that allchanges in personal income were divided between Agricultural and non-Agricultural incomein constant proportion. The maximum possible ratio of ,taxable income ’to personal incomewould be equal to .the share of non-Agricultural income in personal income.

34 THE ECONOMIC AND SOC~L RESEARCH INSTITUTE
~ee from Table 2 that, for ~the years shown, there is no evidence of agriculturalincome maintaining a constant share of personal income. In general since 1947the share of agricultural income in personal income has declined although inthe period to 196o the downward .movement was less dramatic and was at timesarrested (or accelerated) by large fluctuations in agricultural income relative toother incomes. Given th’is behaviour in a component ’of personal income which
is tax exempt, it is clear that a strong possibility of mis-specification arises whentotal personal income (including agricultural income) is used as an explanatoryvariable for personal income taxes.
TABLE 2 : Share o[ agricultural and transfer income in person el in,come
as c~ per cent of personal incomeAgricu~uralincome Trans[erincome1
1947 22.2 8N1952 24.1 9.0I957 22.4 IO.O1962 I8.7 9.I19,67 15.2 Io.1Iff7~ 14.5 i,~.2
1 Includes emigrants’ remittances but excludes pensions and allowances from abroad. Doesnot include national debt interest.
Source: Nation.al Income and Expenditure various issues.
The other major discrepancy ’between personal .income as estimated in theNational Accounts and ’income as estimated by the tax anthorides is due to thetreatment of personal transfers payments. Broadly speaking personal transferpayments can be divided into three categories: public authorities transfers tonon-profit bodies, public authorities transfers to persons and ’households, andemigrants’ remittances.~ Transfers to non-profit making bodies are mainly .tocducational institutions, hospitals and certain quasi-state ~rgencies. In so .far asthe transfers are used to pay the wage and salary bills of the institutions thisaggregate is included already in the wage and salary component of personalincome?~ The balance, which would be nsed for purchases of goods andscrvices, would not be taxable. Thus these transfers, like agricultural income,represent a non-taxable component of personal income and their inclusion inan income mcasure used as an explanatory varia’bte for personal .taxation maygive rise to specification errors.
~’~ Since 197~ ,transfers as measured in the NI,E estimates include pensions and allowancesfrom abroad. Formerly these were treated as factor income from abroad.
a5 This double counting indicates .that ~the absorption of the educational and healthsystems into the public sector would reduce personal ,income as measured in, NI, E.

SENSITIVITY OF INCOME TAX BASE 35
The position with regard to transfers to persons and households is less clearcut. These transfers are mainly social welfare transfers such as unemploymentbenefit and assistance, old age pensions etc. The tax treatment of such transfersdepends on the nature of the transfer. In general ’ long-term benefits ’ such asold age pensions and widows’ pensions are taxable whereas ’ short-term benefits’such as unemployment benefit and assistance are not. However, of the ’long-term benefits’ only contributory pens’ions are payable without a means test and,in .general, the means test provisions combined with ~:he relatively low rate ’ofbenefit for non-contributory recipients meant that the bulk of personal transfers,whether long-term or short-term, were untaxable. Although in theory contribu-tory pensions were taxable, the level of such pensions throughout the post-warperiod was such that ’individuals in receipt of a pension done would not be]i,~ble to tax. I.t was felt that the vast bulk of recipients would fall in thiscategory and, even i£ this were not the case, income apart @ore the pensionreceived would, presumably, be included in other components of personal income.Although contributory- pensions accounted for only I’7 per cent of personaltransfers in i97i--around 2 per cent of totM personal income--it was felt that
treating them as non-taxable was likely to give rise to smaller errors thanincluding them in an income measure suitable £or tax purposes.
A third category of transfers which has become a less important componen.tof personal income over time is emigrants’ remittances. Since t.hese transfers
are unrequited gifts, no liability to income .tax arises from them. Even if aliability did arise, it ~s extremely unlikely that such ren’/ittances would easilycome under the purview of the tax authorities.
The sum of these items equals total personal transfer income which, as we seefrom Table I, has not maintained a stable share in :personal income. In generalthe ratio has tended to rise in the ’sixties and fluctuations in the ratio have beendue in part to the state of the ecolmmy.16. Thus when the economy declinespersonal income is less affected due to a rise in transfers. If these transfers arenon, taxable (as ’in ,the case of unemployment benefits) then personal incometaxes will fall by more than would be implied by the fall in the level of personalincome. This is because personal income net of personal transfers~7, on whichpersonal income taxes depend, falls by more than total personal income. Theconverse is the case in an upturn where personal income taxes will tend to riseby more than would be implied by the rise in total personal income sincetransfers as a proportion of personal income tend to fall in an upturn. Thisrelationship between transfers and the level of income is well known but,strangely, it has not affected the use by many authors of personal income as
16 See Walsh (1974) for an examination of the relationship between income maintenancepayments and the level of GNP.
~7 Wh.ieh, when added to retained company profits, is close to National Income orOutput

36 THE ECONOMIC AND SOCIAL RESEARCH INSTITUTE
an explanatory variable for personal income taxation even when transfers arenon-taxable,is
Social Welfare contributions by enlployers are also included in �he NIEmeasure of personal income yet these are n’ot included as income of individualsfor tax purposes.19 Thus, in order to achieve a closer correspondence betweenNIE personal income and tax authorities’ concept of ’income, farmers’ incomes,transfer income and social welfare contri’butions ,by employers were deducted.The results of these adjustments are shown ’in Col. 2 in Appendix T~ble i.Of course as we noted earlier there are likely to be other differences ’betweenpersonal income as measured by NIE and the tax measure even when all incomeis in t.he tax net. Expenses incurred in a trade or business may ’be treateddifferently for tax purposes than for measuring national income. Certain interestpayments are wh’olly deductible for tax purposes (during the period underreview) whereas interest payments in NIE are netted out except in the case ofbanks and financial institutions where profits include net ’interest receipts.(The NIE measure also excludes, presumably, interest payments which are notdeductible from the :tax standpoint.) Finally, the NIE. personal income measureis net of depreciation but it is unlikely ,that its depreciation estimates are identicalto those allowed .for tax purposes.
However, if it is accepted that the relative importance of these discrepanciesis unlikely to have changed appreciably over the post-war period, then .the useof the adjusted personal income measure as an explanatory variable for personalincome taxation is acceptable.
Adjustment of Income to a Tax Year Basis
In Ireland the tax year commences on April 6th and runs to April 5th ofthe following year. On the other hand the N~IE income data refers, in theory,to the calendar year although in practice it is a combination of calendar andtax year data. Thus there is a need to adjust one or other ’of the series to acomparable basis. The approach adopted here was to adjust she income measureto a tax year ’basis. The adjustment procedure was rather crude in the absenceof quarterly personal income data~° and simply added three-quarters of income
18 However Pechman (1973) does derive a measure of personal income, which excludes non-
taxable welfare transfers, for use in estimating the responsiveness of income tax receipts tochanges in personal income.
~o That part of social welfare contributions by employees which is notionally attributed topension contributions is deductible for tax purposes. The allowable amount has varied con-siderably since 1947 and owing to the difficulties in getting a consistent series for the post-warperiod no adjustment was made. Thus all social welfare contributions by employees were treatedas income throughout the period.
20 Lennon adjusted income using quarterly GNP estimates suggested by McAleese (1970).These estimates were however based on industrial production and it is not certain that thequarterly behaviour of industrial production mirrors closely the behaviour of personal incomes.In any event it was felt that the likely gain from using such an adjustment procedure was notworth the effort involved in extending McAleese’s series to fit the sample period.

SENSITIVITY OF INCOME TAX BASE 37
in year t to a quarter of income in year t + I to get income for the tax yeartit + I. If the quarterly fluctuations in personal income were not very large,then it is unlikely that serious error would occur by using this type of crudeadjustment. However, it must ,be pointed out that in recent years NationalWage Agreements have tended to concentrate wage and salary increases in aparticular quarter. Thus it may be important in future ,for prediction purposesto adopt a more realistic weighting system--at least for wages and salaries.
It was not necessary to weight all the components of our adjusted personalincome measure in order to put them on a tax year basis. Information isavailable from 19’53 on the wage and salary expenditure of the Central Govern-ment and as this was on a tax-year basis it did not have to be further adjusted.(This does assume that NIE wages and salaries includes Central Governmentwages and salaries on a tax-year basis. Since, in general, no correction is made toNIE estimates for the difference in the relevant time period for Government andother expenditures it was felt .that this was a reasonable assumption.) Prior toI95.3 wage and salary payments by the Central Government had to be treatedon a par with other wage and salary payments since separate data wereunavailable.
Even after adjusting for the differences between the calendar and tax yearthere is still the problem of adjusting the income measure to reflect the taxtreatment of income. This is ,because of the lags between the period whenincome accrues and when it is liable to enter the .tax net. Prior to 19,6o/,61,when PAYE was introduced, assessments in a given tax year were, broadly,based on the income accruing ’in the preceding year. Thus income assessed fortax purposes in I958~/59 would in general have accrued to individuals inI9,57/58. After I96O/6,I most of Schedule E income--wages and salaries inthe main--was assessed as it accrued due to the operation ’of PAYE. Certainpublic departments, wage and salary earnings {roan overseas, and some otherwage and salary payments (such as directors’ fees) continued to be treated asunder the pre-PAYE system. The treatment of other non wage and salaryincome was unaffected by the introduction of PAYE. Thus prior to 19.6o/61personal income, adjusted to a tax-year basis, was lagged one year in order tomake it comparable to income for assessment purposes. After I9t6o/,6I allincome, other than non-Central Government21 wage and salary payments, was
21 It might be noted t~hat wage and salary payments by the t3entral Government, as reportedin NIE, differ from the Revenue Commissioners’ estimate of gross income accruing to thosewho pay tax under statutory deduction schemes. Thus in 1970/71 the Revenue Commissioners’figure was £91.9 million while the NIE wage and salary payments for 1969/70 (the year towhich 1970/71 assessments related) were only £79.8 million. The discrepancy between the twosets of figures can be explained in a number of ways. The Revenue Commissioners’ datainclude income other than wage and salary payment, include income earned by persons liable undera statutory deduction scheme other than Central Government employees, exclude certain incomethat does not reach the tax threshold levels. If the relationship between the two measures isreasonably stable then no great error arises on using the NIE figure as a proxy for incomeliable to taxation under statutory deduction schemes. However towards the end of the periodunder review there were signs that the relationship between the two aggregates was changing

38 THE ECONOMIC AND SOCIAL RESEARCH INSTITUTE
lagged one year; private wage and salary payments in the year of accrual wereadded back to ,this lagged series. The error involved in treating all private NI’Ewage and salary payments as coming within the PAYE, system was consideredslight. The results of the calculations are shown in Appendix Table i. Thefinal result is a series called Tax Adjusted Personal Income which is shown inCol. (5). This series is used throughout our subsequent analysis as a measureof personal income; it is the level of income which, if atl incomes were in thetax net under the tax codes in force for the period under review, would ’be closeto actual income assessed by the Revenue Commissioners.
Data on Taxable Income and Personal Taxation
So £ar we ’have concentrated on the data problems involved in constructinga personal income measure compatible, broadly speaking, with the RevenueCommissioners treatment of income. We .have n’ot, however, dealt adequatelywith the question ’of the availability and quality of data on personal income taxliabilities. Tile Revenue Comlrdssioners’ data which we discussed earlier referto all incomes and not just personal income. Therefore we must attempt toremove the influence of undistributed company profits~2 £rom the tax data.To do this we make use of the dzuta on tax receipts that are available in theNational Accounts. There we can obtain1 an estimated breakdown of taxreceipts into a component attributed to conapanies in respect of retained profitsand personal income tax payments. If we remove from the company taxationtotal the receipts from corporations profits tax we have a measure ’of income taxpaid by companies in respect of retained profits. Companies, unlike individuals,have to pay their income tax liabilities in a single payment in January of theyear of assessment. Thus the receipts for, say, I9’7r/7.o ’from companies shouldrefer .to income assessed for i9’7~/7~. The taxable income assessed is derived’by grossing up the tax receipts data by the standard rate of tax. This aggregate,Adjusted Company Taxable Income, can be subtracted grom total TaxableIncome series given by the Revenue Conamissioners to yield the Tax~Cble Incomeof persons. Since the difference between Actual ’Income and Taxable Income’is due to reliefs in respect of earned income and personal allowance which applyonly to persons, we can obtain a measure of Actual Income of persons bysubtracting our Adjusted Company Taxable Income measure from the Actual
and the relative gap between the two widening. If, by using the NIE figures, we understate thelevel of income liable under statutory schemes then we will, for any given tax year, tend tooverstate the level of personal income when nominal income is rising. An increasing ratio ofincome liable under statutory schemes to income as reported in the NIE would exacerbate thetendency to overstate personal income in conditions of growing income. However, it wouldnot be appropriate to use the Revenue Commissioners’ data since this would create the realrisk of using information on the dependent variable to adiust independent variables.
-°2 These profits include the undistributed earnings of State companies as well as privatecompanies.

SENSITIVITY OF INCOME TAX BAS~. 39
Income series produced ,by the Revenue Commissioners.2" Adjusted CompanyTaxable Income series is showrL in Appendix T~ble i while the revised personaltaxation data are in Appendix Table 2 along with breakdown of the componentsof personal income tax assessnlents. The data refer to the period i9’47/48 toI97I/7~.
Construction o/ an Aggregate Measure for Personal Allowanves
In our outline of the structure of the proposed model we indi’cated that oneway in which to take account of the many changes in the level ’of personalallowances in the tax code since 194’7 would be to construct an aggregate variablewhich would measure the total value of all allowances it all eligible (i.e. non-farmers) persons were ’in the tax net.
Of course it is not a simple matter to take account of changes in the level ofpersonal allowances in ,the post-war period. In the first place there are differentrates of allowances for single and married persons, for children of different agesand for dependent relatives, etc. "l~hus in any given year some of the rates ofallowmace may be changed more than others so that differential effects dependenton the demographic structure would occur. Further the individual allowancescannot be related directly to the aggregate of allowances claimed although itmight be possible to relate them to the subcomponen.ts of this aggregate.However, given the demograp’hic structure of the potential taxpaying populationwe can construct a measure Of the potential worth of the allowances set out inthe tax code. Clearly, we would expect the allowances actually claimed in theRevenue Commissioners’ report to approach this total as more and more personsentered the tax net. We define this aggregate measure of personal allowancesclaimable (PAL) as
PALt = 2: wit Nfti
where w’~t represents the income tax allowance for category i and time t andN~t is the number of persons in category i at time t. The potential taxablepopulation Pc was defined as the total non-agricultural labour force excludingmarried women but including dependent children of the non-agriculturalpopulation. Thus
Pt = Z Niti
This restriction of the total potential population to the non-agricultural labourforce and dependent children was due to the absence of any annual data on
2a The NIE tax figure is only an estimate, although presumably derived in consultationwith the Revenue Commissioners~ and the grossing up of the tax paid figure could result inthe amplification of errors in the initial estimates. A significant source of error could be thetendency of companies to delay payment of taxes as long as possible. If the delay exceededthree months then taxes paid in 1972/73 would be in respect of income assessed for 1971/72.When company income was changing rapidly this lag in payment could result in under or overestimation of company tax assessments for any given tax year.

4° THE ECONOMIC AND SOCIAL RESEARCH INSTITUTE,
any other non-agricultural component of the total population. The exclusion ofmarried women w.ho were working was justified on the grounds that the numberof working wives claiming allowances as indicated by the Revenue Commis-sioners’ data is considerably in excess of the number of working wives shownin the Census of Population. This is due in large measure to the incidence ’ofpart-time working for many wives which is excluded from consideration in theCensus. It seemed unrealistic to measure the potential allowances that could beclaimed by workh~g wives by multiplying the number of wives ’in the non-agricultural sector ,by the allowances since it is highly unlikely that the participa-tion rates for this category of persons would ever reach ioo per cent. Thereforewe have treated the amounts claimed in respect of allowances for working wiveseach year as exogenous and as having little effect on ,the determination of therelative size of the tax ,base. Similarly we have had to exclude consideration efallowances for housekeepers and dependent relatives on tlle grounds of insufficientdata. However, these exclusions account for only a small proportion of allow-antes actually claimed--£I4.5 million out of a total cff £,3o9.4 million in197I/7o.
Of course by confining our potential taxable population to the non-agricul-tural labour force we are excluding those individuals who are not in the labourforce but may be in receipt of taxable income--persons with retirement pensions,farmers with substfintial dividend income etc. However, it was felt that a smallererror was committed by their exclusion than would occur if the whole .populationwas considered as potentially liable ,to income taxation. The exclusion of retiredpersons in the non-agriculturM sector might be further justified on the groundsthat we have excluded old-age pensi’ons from our measure of personal income.2’j
Our potential taxable population P was divided in.to three categories: single,married and children. However, where appropriate, the dependent childrencategory was further subdivided to correspond with variations in the rates ofallowance for children of different ages or differences in .the number of dependentchildren per family. Each "of ~hese categories was multiplied ,by the appropriateallowance and the totals aggregated. The details of the derival~ion of this variableare set out in Appendix i. Becanse Of the rather crude esthnation involved, theaggregate can only be considered an approximate measure of the total personalallowances which could be claimed if all persons were in the tax net. Forexample, we ’have treated widows as equivalent to single persons gor the purposesof this exercise although personal allowances for widows are slightly higher thanthose for single persons. However, data did not permit .the separate treatmentof widows although their dependent children are included in the measure.
Although .the PAL measure ’is intended to approxinlate the amount ofallowances that might be claimed if all potentially liable persons were in the
~-’~ It might be added that, even allowing for the farm sector, Ireland has a relatively highproportion of persons over 67 in the labour force. Thus the exclusion of those not in the labourforce does not exclude all those past normal pensionable age.

SENSITIVITY OF INCOME TAX BASE 41
tax net, it has a second interpretation. It could also represent .t.he aggregatelevel of income which could be earned, without any aggregate liability to tax,if personal incomes were distribu.ted in line with personal income tax allowances.Thus the PAL variable is likely to be a useful aggregate variable in the equationrelating personal income and actual income as defined ’by the Revenue C’ommis-sioners. However before this second interpretation of the PAL me~ure can bejustified we nmst take into account the interaction of the rate of earned incomerelief and individual personal allowances in determining whether an hadividualis in the tax net or not. I;f an individual had 21ooo ’of tax allowances inrespect of .himself, his wife and children he would require earned income of atleast £i,33.3.4 ,before entering the tax net. With an income of £1,2oo hewould be eligible for earned income relief of 25 per cent o1" £3oo so that only£9oo would be considered as income against which personal allowances mustbe set off. Thus he would have £Ioo unused personal allowances and so wouldnot, except in special circumstances, be in the tax net. However, if his ’incomewas £i,4oo he would be in the tax net, since earned income relief would be only .£35o ,and the balance is greater than the personal allowances available. Ingeneral if an individual has a personal allowance of £X then he would needearned income o.f £X (I/I-R) where R is the rate of earned income relief,providing only that
does not exceed the upper income limit for earned relief. For most of thepost-war period only married men With quite large families would be in theposition where
would exceed the upper income limit; although when a dual rate of relief wasin operation25 it was possi,ble tha~t married men with five dependent childrenwould have allowances part of which would have to be grossed up at the lowerrate of relief. In these cases the limit before entering the tax net would beslightly lower than X/I-R if R was the higher rate.
Since our discussion of the likely factors influencing the level of AIP was.’b~ed on the assumption that the main factor which determines whether one isin the tax net or not is .the level of personal allowances it seems appropriate tomake some adjustment for earned income relief. If the rate ’of relief had beenkept constant throughout the period then it would not be necessary .to make anyamendments to the measure set out earlier. However, the maximum allowable
~ From 1952/53 to 1959/60 a 25 per cent rate of earned income relief applied to the first£800 of earned income and a 20 per cent rate to the next £I,000. The rates of relief appliedfrom 1947/48 are shown in Appendix Table 5.

42 THE ECONOMIC AND SOCIAL RESEARCH INSTITUTE
rate for earued income relief did change during the period and so we willredefine PAL as
PALt* = Z wit Nlt/1-R,naxi t
where Rtn~, is the maxinmm rate of earned income relief. PAL~ represents theaggregate level of personal income which could ’be earned before any tax liabilityarose i[ incomes were distributed according to the tax allowance structure. AfterI97o/71 minimum earned income relief was available and for subsequent yearsa slightly different adjustment procedure had to be adopted. In .I97O/7X allsingle pel~ons and all married men with less than three dependent childrenwould have had tohave earned income approximately equal to their personalallowances plus .the mininmm earned income relief before they entered the taxnet. Married men with t.hree or more dependent children would, in general,required income I/I-R times their personal allowances ’before being in the taxnet. Thus for I97i PAL~’:" was constructed by adding ,the minimum earnedinconae relief to the allowances for single and married men and grossing up bythe factor I/I-I( only those dependent children who were third or greater infamilies of three or more children. A similar approach was adopted forsubsequent years.
Of course if individuals had incomes which were unearned and were in excessof t.he level of personal allowances ~but less than the level of ’ grossed up’ allow-ances, a liability to income tax would arise. In our construction of PAL~ noaccount was taken of this possibility and such an omission might be justified onthe grounds that most ’individuals in such a p’osition would have an incentiveto form a close investment company and pay themselves directors’ fees whichwould qualify for earned income reliefY~
We should note that for years prior to i97o/7i we have
6PAL*/6PAL = 1/1-R,,,x
but for years after i97o/7i the relationship between PAL~" and P~L is Iessclearcut--the derivative of PAL~" with respect to PAL will vary .from .i toI/I-R,,,~, depending on whether :the ’increase in allowances is due to an increasein children’s tax allowances in respect of ~he third or greater child or not. Ingeneral the derivative will be close to unity since the bulk of personal allowancesclaimable are in respect of single and married persons and the first two dependentchildren.
20 Such an incen¢ive would be strengthened by ~he fact that liability ’to surtax commencedat a lower threshold for unearned income for some of ,the period under review.

Chapter 4
Empirical Estimation of Tax Relationship
Results [or x947 to 1972
EQUATIONS (I7), (I8) and (I9) were estimated by ordinary least squares ondata for the periods i948/49 to i97.i/72, a total of 24 observations. The
recursive nature of the system outlined earlier allowed us to use OLS in spiteof the s’imultaneous structure. The results of the regressions are shown inTable 3. The values of the Durbin-Watson statistic and the Geary .tau are alsogiven for each equation. The figures in parentheses are the relevant t-statistics.
The regression results for equations (i7), (I8) and (i9) are set out in Table 3.The estimated coefficients appear plausible in the light of our a priori expecta-tions. We can see from equation (i7) that the estimated asymptotic marginalresponse of actual income to a change in personal income of o.94~4. Thus evenwhen incomes are very high relative to tax thresholds some 5.’6 per cent ofadjusted personal incomes w~l not be in t.he tax net. This may appear ratherlow given the popular’ view fllat a sizeable proportion of income escapes taxationthrough evasion and avoidance. However, it must be remembered that thepersonal income measure is net of many untaxed incomes--such as farmincomes--and excludes to a considerable extent certain items which are alsoexcluded from the tax net--interest payments for example.27 Also the personalincome measure produced in the National Accounts is an, estimate and it is notaltogether certain that income on which tax was evaded would become knownto .the Central Statistics Office and not to the .tax authorities?s Finally, we mightnote that if personal income was three and a half times the level estimated forI971/72 while personal allowances were unchanged, then the value of AIP/Yderived from equation (i7) would be o.9o; thus even with very considerableincreases in personal incomes the anaount of income outside ~he tax net wouldbe fairly high.
While the value of R~ is high for all equations this is hardly surprising giventhe strongly trending nature of all the data series. In equation (i7) it will benoted that the Din’bin-Watson statistic is on the low side--in fact in theindeterminate region. Although ,an attempt was made to correct for any auto-correlation using t’he two-stage approach suggested by Durbin (i9’06), no signifi-cant improvement was obtained. Thus the results are rep’orted without any
27 The tax treatment of interest payments is broadly similar to the NIE treatment in thatinterest paid is deducted as an expense but interest received is treated as income. This avoidsdouble-counting and makes income net of interest payments substantially tess than grossincome.
2s Of course, the National Accounts income estimates are derived from very aggregateinformation and so it is possible that incomes on which tax was evaded would be includedin the aggregate although details of such incomes would not be available.
43

TABLE 3: Results of Estimation of Taxation Equations
~q
C)O
~. d~’O.
(I7)
¯(x8)
(~9)
\
- r~*_o.568 (?~*)~AIP= - 175.863 +o.944Y + 199.722 T(2.94) (24.94) (3.67) " (8.8i) Y
/n/PAC) -28.243--~-/-o.7255.EAL\~//= (I.74)AIP (io.97) AIP
zn(~I~=o 986 in AIP -2o,o6 z__-o IsOfR-ox-~-,.l~R,..x,](663.6x) (,2.04) AIP (3.3o) L R"*x ]
i~.-2
o.996
o.952
o.999
DW(z)
1.26(7)
1-77(II)
1.72(9)
P
0%07
~ZO
1>:Z
o’/OC)r-t"
r/}
p,-XtC~
,.-]
,-1

SENSITIVITY OF INGOME TAX BASE 45
corrections. However, for equation (,I8’) where a similar problem arose, theDu~bin corrections markedly improved the DW statistic. The estimated auto-correlation coefficient was 0.60,7. It will also be noted that equation (I8) hasa zero intercept; when a version of the equation was estimated without con-straining the intercept to zero the estimated ’intercept was not significantlydifferent from zero and the fit disimproved slightly. Thus asymptoticallyPAC/PAL approaches unity.
Although the results for equation (i9) are satisfactory with no sign of auto-correlation the specification is not ideal. As we noted earlier we would expectEIR/R,,,,, AIP to rise as more earned income enters the tax net but eventuallyto decline as earned incomes exceed the maximum level for which relief isgranted. However, throughout the period the ratio did not begin to declinealthough there were signs of a levelling off towards the end of the period. Thusit was extremely difficult to fit a specification which would allow for an eventualdecline in the ratio on data which showed no such decline. However, the resultsshown in equation (i9) do allow for an eventual gradual fall in EIR/Rma, AIPas income increases since the coefficient on AIP is less than unity.
One possible test of the plausibility of the coefficients estimated in Table 3is an examination of the implied marginal rates. In Table 4 below we haveset out the estimated reduced form multipliers evaluated at the mean values ofthe variables for the period. We have also included the relevant elasticities alsoevaluated at the mean.
TABLE 4: Reduced form multipliers and elasticities evaluated at mean
(i)6AIP6PAI]
Multipliers-o.6o
Elasticities--O.6I
(2) (3) (4) (5) (6) (7)5PAC 5TI 6AIP 6PAC 6BIR ~TI6PAL 6PAL 6Y 6AIP" 6AIti 6"Y"
- 0.07 - 0.40 0.96 o.32 o.2 x 0.45
-o. 19 - i.o8 1.7o 0.58 0.97 2.o8
The main interest centres on CoB. (’3) and (7) where the marginal responsesof taxable income to changes in personal allowances and personal income areset out. Col. (3) suggests that on average throughout the period a rise in personalallowances of £I million would result in a fall of £o.4 million in taxable incomewhen personal income is unchanged. Th’is response is the result of a fall inactual income of £o.6 million (which in turn leads to a fall in earned incomerelief claimed of £o.I3 million) and a .fall in personal allowances claimed of£o.o7 million. It is interesting ,to note that a fall of £o.,6 million in AIP couldresult in a maximum fall in allowances claimed ,by those now falling out of the

46 THE ECONOMIC AND SOCIAL RESEARCH INSTITUTE
tax net of £0.4,7 n~llion--since ElK will have fallen by £o.13 million ,becauseof the decline in kiP. The actual mean estimated .fall was only £0.0’7 million.This would be consistent with a rise of £o.4 million in allowances claimed bythose staying in the tax net combined with the maximum possible decline ofallowances of £o.47 million by those falling out of the net. On averagethroughout the period the ratio of PAC/PAL was o.4o, which suggests that4o per cent of any allowances granted would be claimed. Thus the impliedmean marginal response of taxable income to a change in PAL ’is consistentwith the observed average behaviour of the ratio PAC/PAL throughout thesample period?"
From Col. ~7) we can see that evaluated at the mean a rise in personal incomeof £r million would result in rise in taxable ’income ’of £0.45 million atunchanged levels of personal allowances. This is .’because A IP rises by £o.96million in response to the personal income rise ’but PAC rises by £o.31 millionand EIR by £o.eo million because of the rise in AIP. This estimated responseof taxable income to changes in personal income was well in excess of theaverage rate of taxable to personal income for the sample period which was o.2mHowever, the ratio r~e from o.,I9 in 19~8/49 to o.34 .in I97I/72 in spite ofsubstantial changes ha personal allowances, so that a marginal rate substantiallyabove the average rate throughout the period ’is not particularly surprising.
We should also note the relevant elasticities. Thus the elasticity of ¢axableincome with respect to personal income was, on average, very high at ~.o’8.A io per cent rise in income would have generated a 2o.,8 per cent rise in taxable’inconae and ,tax revenues. However a lO per cent change in the level of personalallowances would have resulted in an almost proportional fall in taxable income.Thus, on average for the period I947 to I97~, a policy of indexation of taxallowances to the rate of inflation would still have yielded tax increases evenwith no real income growth.8° Th’is is, presumably, a reflection of the unequaldistribution of income, so that much of the value ’of the increased personalallowances would go unclaimed, and the influence of earned income relief whichhas a maximum allowance.
There are inherent disadvantages in using the reduced form multipliers m~delasticities evaluated at the mean in order to examine the plausibility of theestimated coefficients in a highly non-linear structure such as ours. These tendto change quite substantially over time and while results evaluated at the mean
2o It is unlikely that the fall in allowances claimed by those leaving the tax net would equal£0.47 million for a rise in PAL of £1 million. Some income in excess of allowances and earnedincome relief would have been lost but for a small change in PAL the amount of such incomemight be relatively small.
a0 When there is a single ’ standard ’ rate of income tax it should be possible to compensate
for inflation by indexing the level of personal allowances. The existence of a fixed upper limiton earned income relief for the period under review meant that full inflation adjustment wouldhave required indexing this limit also.

TABLE 5: Evaluation of derivatives of taxation equations
(x) (2) (3) (4) (5) (6) (7) (8) (9)6AIP 6PAC 6TI 6AIP 6PAC 6EIR 6TI Standard Marginal
Tax Year 6PAL 6PAL 6PAL 6Y 6AIP 6AIP 6""Y Tax Rate1 Tax Rate
I948/49 -o.357 -o.342 o.o49 o.555 o.7x4 o.179 o.o6o o.3o[ o.oi8
I949/5o -o.346 -o.32I o.o39 o.6o6 o.7o3 o.i86 o.o68 o.279 o.ox9I95o/5I -o.34I -o.277 -o.oo2 o.645 o.643 o.i83 o.ii2 o.278 o.o3iI951/52 -o.46I -0.369 -o.oio o.716 0.657 o.i79 o.ii7 0.280 0.033
I952/53 -0.568 -0.368 -0.078 0.773 0.578 o.215 o.i6o o.3oi 0.0481953/54 - o.53° - o.317 - o.o97 o.784 o.553 o.2 i8 o. 18o o.3o8 o.o55i954/55 -0.670 -0.465 -0.057 0.852 0.598 0.220 o.i56 o.3o3 o.o47I955/56 -o.69o -o.463 -o.o77 o.875 o.584 o.217 o.I74 o.3o3 o.o53i956/57 - o.662 - 0.431 - 0.082 0.879 0.575 0.225 o. 176 0.297 0.052i957/58 -o.63i --0.368 -o.i24 o.88I o.53I o.~2i o.219 o.3oI 0.066I958/59 -0.593 -0.333 -o.x27 0.876 0.522 o.~25 o.2~I o.296 0.065
I959/6o -o.563 -o.253 -o.I87 o.88I o.46o o.2I9 o.283 o.28I o.o8oI96O/6I -o.9o5 -o.628 -o.o76 I.o35 o.6I4 o.222 o.i7o o.3I7 o.o54x961/62 -o.84i --o.538 -o.Ixo I.o~4 o.578 o.229 o.I98 o.317 o.o63I96~/63 -o.79I -o.39I -o.~I9 I.oI9 0.483 o.23o o.292 o.317 0.093I963/64 -o.753 -o.288 -o.294 i.oi6 o.418 o.327 o.36I o.317 o.II4I964/65 -o.695 -o.ii6 -o.4I7 ~.oo8 o.33~ o.333 o.439 o.3~7 o.~39965166 -o.657 -o.o34 -o.484 ~.oo4 o.~88 o.~6 o.488 o-3~ 7 o.~55
~966/67 -0.630 0.064 -0.554 ~.oo~ o.~58 o.~33 o.5~ 0.35 o.~82I967/68 -o.6~9 o.~ ~4 -o.598 L°°5 °-339 °.~9 o-545 °-35 °-~9~x968/69 -o.577 o.~77 -o.6~2 o.999 o.o~9 o.~3o o.55x o.35 o.~93~969/7o -o.54~ o.~5x -0.667 0-994 o.~88 o.~3~ 0.577
o.35~0.302
;t97o]7~ -o.43~ o.3°8 -o.65~ o.995 o.~4~ o.~33 o.6~3 o.35 o.2~8~~97~/72 -0.394 0.485 -0.795 0.990 o.~io o.~4 0.669 0.35 0.039
Prior to ~96o/6~ reduced rates of tax were payable on certain portions of taxable income. The ’standard’ rate applicable to total taxableincome of persons was derived by weiffhting the various rates for each year. Thus the derived marginal tax rate is only approximate since the’standard’ rate, prior to ~96o/6L could change even in. the absence of changes in legislation. However CoL (5) shows that ~he variation in.the effective standard rate, for any given tax structure (where changes in the structure of tax ra.tes are marked by horizontal lines), were quitesmall. Thus in spite of the possibility of shifting weights the marginal rates in. Col. (6) are reasonably close to .the actual position.
ZIn ~97o/7~ a reduced .rate of tax of o.~33 was applicable to the first £~oo of taxable income. However separate details of the amountof ,taxable income to which the reduced rate applied are not available. By comparing the tax chargeable figure with ac~jaeent years it wouldappear that dae reduced rate caused a fall in t~he effective rate of about x percentage point.

48 THE ECONOMIC AND SOCIAL RESEARCH INSTITUTE
Blight appear plausible the implied annual rates might be less acceptable. T.here-fore we have set out in Table 5 the multipliers applicable {or each year. I,t willbe noted that some of our broad hypotheses are strengthened by these results.Thus the response of taxable income to personal income (STI/8’Y) has tendedto rise throughout the period especially gince ig6o/6I when the new PAYEcode and allowances were introduced. Similarly the impact of personal allow-ances granted on personal allowances claimed has risen quite sharply andchanged sign since I966/~67. From that year any change in allowances wouldresult in an absolute increase ’in aUowances claimed.
However, we should note certain results which are at variance with oura priori expectations. In particular, the derivatives 3TI/3PAL for Ig48/49 and1949/5o are positive and this is clearly absurd. It is not possible .that a rise inthe level of personal tax free allowances granted could increase the level oftaxable income and so the coefficient should always be negative?~ Similarly, inthe early years (prior to I953/54 for example),the marginal rate, 3TI/3Y, wasless than the average rate, TI/Y, and this seems unlikely ,although it is theoreti-cally possible since 8TI/~Y will depend on the distribution of income as wellas the level. The problem arises in both cases because of .the high degree ofnon-linearity in the structure of the model. Thus a small change in some ofthe estimated coefficient would ’have a significant effect on the derived marginalrates for i948/49 ’bu’t very little on the rates for I971/712.
Because of the non-linear nature of ’the equations it is ’difficult to derive exactstandard errors. However, it is possible to make some approximation and theresults for i94.8/49 and I97I/72 are shown in Table ,6.
TABLE 6 : Approximate standard errors of reduced form multipliers for 1948/49and I971/7~
6AIP 6PAC 6EIR 6AIP6Y 6AIP 6AIP ’6PAL
1948/49 o.4i7 o.I26 .oo3 o.5IOi97i/72 o.o35 o.oi5 .ooI o.114
It is clear that for early years the possible errors in the estimated reducedform mnltipliers are quite large. The complex non-linearity make it evenmore difficult to give even approximate standard errors for 8TI/SY and3TI/8PAL. However, if the coefficients varied within one standard error of theestimates shown in Table 3 t.hen STI/SY for 1948/49 could vary from --o.o2to o.23o compared to the value shown in T~ble 5 of o.o’6o. Thus a marginalrate in excess of .the average ratio .for i948/49 is well within the ~o’ounds estab-lished by t.he estimates of equations (17), (I8) and (19). For i97I/7~2 the range
31 In common with virtually all other tax models we have ignored the feedback effects ofchanges in the tax structure on the economy. A reduction in the level of personal taxationcould expand demand~ stimulate income increases and generate higher income tax revenueswhich could more than offset the initial tax concessions. I-Iowever, the perverse slgns in 1948/49and 1949/50 are unlikely to be a result of such feedbacks.
SENSITIVITY OF INCOME TAX BASE 49
for 8TI/8Y would only be from 0..630 to o.7Io which is far narrower andsymmetrical about the estimate shown in Table 5 of o.,67.
Similarly 8TI/SPAL could vary if the estimated coefficien.ts varied by astandard error from --o.79 to o.98 in 1948/49 which is very large in relationto the estimated value of o.o5. On the other hand, the possible range in I971/72was only from --o..67 to --o.93, which while somewhat large, is symmetricabout the estimate shown of --o.8o.
Thus while we would prefer to have all estimated marginal i"ates consistentwith a priori expectations we should n’ot be unduly concerned if some valuesfor early years in the smnple period are implausible. Overall, the results seemreasonable and movements in the marginal rates conform to expectations.
By applying the standard tax shown in Cot. (8) of Table 4 {o 8TI/8Y wecan obtain the marginal tax rate. This has risen quite sharply; from o.o,6 in196o/’61 to o.239 in I9’71/72 due to the considerable rise in incomes in a periodwhen the level of personal allowances remained virtually unchanged. Thus in1971/7° our estimate suggests that almost 24p. in every £I rise in personalincome (as defined)would be absorbed in personal income taxation. Since ourdefinition of personal income was only about 7° per cent of total personalincome as measured by the National Accounts for 1971/72 the marginal taxOla total personal incomes was somewhat lower--perhaps around o. r7.s~
A further stringent test of the estimates is provided ’by an examination ofdleir ability to track fairly closely the level of taxaable income when onlyinformation on the exogenous variables (and lagged values of AIP and PAC)is provided. In equations (18) and (19) AIP is replaced by an estimate derivedfrom equation (17). In Chart ~ we have set out the reduced form Within samplepredicted values of taxable income and the actual values. It will be noted Chatthe model Captures quite well the sharp upswing in the level of taxableincome since I9~O/,6I as well as the relatively slow growth prior to then. Thechart also shows that there was a tendency to underprediction ’from 19.62/,63to 1967/68 and .to overprediction thereafter. Overall, the tracking a’bility ofthe model estimated seems reasonable given the fairly dramatic rise in thetaxable income series in the last decade.
Out of Sample Forecasts
Since the model was estimated further infornaation on taxable income forI97~/73 and i973/7.4 has .become available. Rather than incorporate the newdata into the model it was decided to examine whether our forecasts of taxableincome based on the estimated model correspond closely wieh the actual
x~ In order to derive an exact measure of the marginal tax rate with respect to totalpersonal income we would need. to know the exact relationship between total personal incomeand our adjusted measure. In the absence of a measure of BY/BY* where Y* is total personalincome the average ratio Y/Y* might be used as an approximation. A simple regression ofY on Y* would not seem to be appropriate since a large part of the difference between Y and Y*is due to agricultural income which, presumably, would not vary systematically with Y* (or Y).

5° THE ECON01~{IC AND SOCIAL RESEARCH INSTITUTE
CHART 2 : Comparison o[ Actual and Predicted Taxable Income x948/49 to
x97r/72Taxable Income
ACTUAL
PREDICTED

SENSITIVITY OF INCOME TAX BASE 5 1
out-turn. Although only provisional information on incomes is available forI973/74 we have compared t, he actual and estimated taxable income for thatyear as well as for i972/7,3.
In order to derive out of sample forecasts of taxable income we requireinfon-nation on Y, PAL~ and PAL. Using NIE data (and preliminary NIEvalues ~or i974) and estimates of the non-agricultural labour force, values forthese variables in I972/73 and I9’73/74 were obtained. The measure Of incomefor i97.3/74 may be liable to significant change when earlier estimates arerevised in later National Accounts. Similarly, it is possible that the estimatesof PAL and PAL"x" would have to be adjusted in the fight of information in thenext Census of Population. However, these latter estimates are likely to bereasonably close to ,the eventual outcome since it would require fairly substantialdemographic shifts to alter significantly the aggregate value of PAL and PAL"~.
In Table 7 we have set out the value of the exogenous variables used inthe forecast as well as the out of sample estimates of AIP, EIR and PAC. Itwill be noted ’that for i972/73 the estimated taxable income is some £I9.7miUion higher than the actual level. This was substan,fially due to an over-prediction of actual income of £9 million and an underprediction of earnedincome relief of £9.4 million in that year. In this regard it is interesting tonote that the preliminary returns of the Revenue Commissioners for i972/73underestimated earned income relief by £22.I million. Since actual income roseby only £I48.5 million, while earned income relief rose by £57.2 million (or
TABLE 7: Out-of-sample forecasts of taxable income i972/73and I973/74
I97~/73 I973/74
Act. Est. Act.Y per 1,377.3 1,66oPAL* 637.9 648PAL 459. I 467
Est.
AIP I,o72.o i,o8I.O 1,23o.o 1,3~4.iEIR 250.0 240.6 275.7 296.oPAC 36o.3 359.o 378.4 386.oTI 461.7 481.4 576.3 64~.o
3’8.5 per cent of the rise in 2kiP) it seems certain that the increase in EIR wasdue to a substantial rise in the numbers in the tax net claiming minimum earnedincome relief. Personal allowances were underpredicted by £ 1.3 million. Overall,the results of the out-of-sample forecast are quite encouraging and would haveresulted in an overprediction of the ultimate yield ~)f personal income taxationof about £7 million--this compares with an underprediction ’of current incometax receipts (part of which represent .the second part of taxes already assessed)of £5.3 million for i972/7,3.

52 THE ECONOMIC AND SOCIAL RESEARCH INSTITUTE
Tile forecasts for 1973/74 peKorm less well relative to the preliminaryestimates of the Revenue Commissioners. Actual Income is substantially over-estimated by £94 million and taxable income is over-estimated by g~65.7 million.This error, which is almost entirely due to the overprediction of AIP by 7.6per cent, is larger than those experienced within t.he sample. This would seemto indicate that ill 1973/74 ,the explanatory power of the model .broke down.However, before considering whether the tax system underwent some structuralshift in 1973/74, it is important .to examine some special :factors which influencedthe I973/74 estimates ....
In 1973 and I974 the National Wage Agreements led to a significant phasingof increases in income. Thus t;he income in 1973/74 of PAYE taxpayers wasnot three-quarters of I973 income plus a quarter of I974 income. If the wagepattern shown in the quarterly series for transportable goods industries wereapplied, the income measure for 197.3/74 would have been £io million tessthan we estimated.
In I974 the Exchequer moved to calendar year accounting. The NIEestinaate of Central Government wage and salary payments was in respect ofI974 and not for I974/75 as might have been expected. Since adjustments forprevious years were based on the Central Government tax year ,income measure,it would have been more appropriate to adjust I974 income ’;.’y the I974/7:5Central Govermnent wage and salary payments. T.his wouM ’have reduced theestilnated income measure for 1973/74 by about £5 mill[’0n.
As we noted earlier the discrepancy between the NIE figure for CentralGovernment wage and salary payments and the Revenue Commissioners estimateof ,,,age and salary payments coming. under statutory deduction schemes in-
creased in I971/72 and i972/73. This led t0 an overstatemen’t of ndii-piabli�departments, income in 197:2/73 of about £1,5 million and if the discrepancywas maintained in respect of N,I.E estimates for 19.73/74 an overstatement: ofincome of about £2o million would occur.
Finally, the estimated company taxable income figure is .based on NIE datawhich are preliminaryii_and usually subject to ,substantial later revMon,. Ini973/74 the receipts from Corporation Profits tax showed little increase abovethe I972/,73 level. Yet the NIE estimate of company income ,taxes wouldindicate ~t rise in company taxable income in I973/74 to £59.3 million, fr0nl£28.i million in i972/7’3. A reduction inthe NIE esfimate 0f.c0mpany taxpaid by £ I million Would result in an increase in our personal taxable incomemeasure of £2.9" million. Given past patterns in NIE revisions it is not. unlikelytllat the NIE company income tax figure will be reduced by up to £5 millionw.hich would increase both AIP and Taxable Income by £14 million Or so.
"Hence, factors special to 1973/74, or the provisional nature of the data onsome aggregates, can account for about £4° million of ,the gap between theestimated value of taxable income and the out-turn. This would still leave a gapof £;-’5 million, which is still rather high. It is possible that ,the sharp rise ininterest rates in 197,3 and 1974 resulted in an increase in interest relief dimmed

SENSITIVITY OF INCOME TAX BASE 53
and so reduced taxable income below expectations. If the relationship betweengross income, as reported to the Revenue Commissioners, and actual incomehad been the same in I9’7,3/74 as in the average for the previous five years,taxable income would have been about £20 million higher. The main differencebetween gross ,’rod actual ’income is due ,to special reliefs such as interest relief,capital allowances, depreciation etc. The subsequent restriction on the amountof interest relief claimable to £%000 p.a. may have ,been a response to theexperience ’of I973/74.
At this stage it is not possible to determine whether, w.hen allowance is madefor appropriate adjustments to the data, the model we have developed willneed further revision in order to project with greater accuracy the trend intaxable income. Changes in ,the treatment of certain public service wage andsalary payments along with the eventual recasting of the tax year to a calendaryear basis should help to remove many of the difficulties that arise in connectionwith the use of NIE data for tax purposes.
We might note also that the estimated marginal tax rates for 1972/73 andI973/’74 were 0.245 and 0.25’3 respectively. Thus the rise in the marginal taxrate appears to be levelling off--which is what one would expect as the rateapproaches the maximum marginal tax rate of 0.3,5 for ordinary income taxationalthough the rise in personal allowances in 1972/73 probably helped lower themarginal rate.
Tax-Code Revisions 1974/75
Major changes in the tax code were introduced for 1974/75. The surtaxcode was amalgamated with the income tax code so that the n’otion of astandard tax rate disappeared. Also earned income relief was ffbolished andreplaced by a lower rate of 2~6 per cent on the first £ 1,5t5o of taxable income.The former standard rate of 35 per cent was applied on the next £2,800 ofincome aud higher rates applied thereafter. The benefits to the individualtaxpayer of such a revision were two-fold. When combined with the higherpersonal allowances the new code tended to reduce the average tax rate for agiven income level. More important perhaps it tended to reduce the marginaltax rate especially for taxpayers with large families. Some impression of therevision may be obtained from Table 8 where we have set out the tax thresholds(i.e., the level of income required before any tax is payable), the thresholds atwhich the 35 per cent marginal rate becomes payable and .the average tax ratesfor incomes of £2,000 p.a. for 1973/74 and 1974/75. We assumed that allincome was earned income.We c,’ul see that for single persons the revision yielded only a slight benefit--a saving of £3° on incomes of £’2,o00 p.a. and an increase in the thresholdat which the 35 per cent tax rate becomes operative of only £5o. Thus a riseof over 2.5 per cent in income ’of those single persons earning £2,000 p.a. wouldpush them into the 35 per cent bracket. However, for a married

TABLE 8: Comparison of tax codes for I973/74 and1974/75
t~
o
o
Average tax rate onTax threshold 35 % threshold income of £2,ooo p.a. O~
~973/74 ~974/75 ~973/74 I974/75 ~973/74 ~974/75 o
Single Persons 449 5oo 2,ooo 2,o5o .2Io .I95h/iariied Men (MM) 744 8oo 2,ooo 2,35o .176 .156 ~
MM plus I dependent Ct~ild1 899 i,ooo 3,000 3,550 . I49 .13°MM + 2 I,o52 1,2oo 2,ooo 2,75° ¯ I24 . i o4MM + 3 1,228 1,4oo 2,ooo 2,95o . i o I .o78MM+4 ~,4o4 1,6oo 2,ooo 3,I5° .o78 .o521VIM+5 1,58o 1,8oo 2,000 3,35° .055 .026
1 All dependent children assumed under 11 years of ,age.
SENSITIVITY OF INCOME TAX BASE 55
man with five children earning £2,000 p.a. an increase of 67.5 per cent (or£I,35o) would be required to push him into the 35 per cent tax ’bracket underthe I974/75 code: Previously any increase would have been taxed at the 35per cent rate. The actual tax savings on an income of £2,000 p.a. for amarried man with five children was only £58. Thus the revision of the taxcode prob~bty had a greater impact on the expected future growth of taxrevenues .than on the current receipts. It would seem likely that the ultimatecost of the revision will be far greater than the cost included in the Budgetsince the stream ’of tax receipts in ‘future years will be lower because of theadjustments3~
However, the important question for us is whether we can suitably amendthe model estimated earlier to take account of the new code. There ought, in.theory, to be little difficulty in estimating AIP and PAC under the new structureof personal allowances. The real problem is the estimation of the marginaltax rate which will be betweert 0.26 and 0.:80 (the upper rate ’of tax in 1974/75).~ As yet no in‘formation has ,been published on the average effective taxra’te or oll the distribution of taxable income by taxable slice on the basis ofthe new tax code. Thus although we now require some framework within whichto analyse the determinants of the effective tax rate we ’have n’o data base onwhich to work. Presumably this information will ,be published soon and thensome attempt can be made to predict the tax rate as well as taxable income.However, it will be some time before such predictions can be expected to beaccurate because a single observation is unlikely to yield sufficient information.By and large, we would expect an upward movement in the average tax rateas more incomes come into the tax net and as incomes cross new thresholds.
In theory we might approach the problem in a manner similar to that adoptedin the case of personal allowance thresholds. In that case we need an aggregatemeasure of allowances as a variable in determining ,the amount of income abovewhich other thresholds might be estimated. However, such a procedure wouldhave to wait on the availability of an adequate series of data which would takesome time.
Another alternative would ~be to estimate the effective tax rate by examiningthe share of taxable income in each tax ’bracket. By making assumptions aboutthe likely movement of each share as income increases, an estimate ’of the effec-tive rate might be obtained.
Until such time as information on the revised tax code is available it is notpossible to make extended projections of tax revenue using the model developedearlier. It is, however, possible to make some attempt to project taxable incomeon the basis of the estimated model. In Table 9 we have set out projected
as The same is true for any increase in personal allowances. However, when earned income
relief was confined to a maximum of £500 the effect of a change in personal allowances on themarginal tax rate was smaller.
84 Further changes since 1974 have resulted in a lowering of the maximum tax rate to77 per cent but an increase in the ’ standard’ tax rate to 38~ per cent from 35 per cent.

THE ECONOMIC AND SOOIAL RESEAROH INSTITUTE
values of taxable income for I974/75 under the new system and under the oldsystem. A value of £i,94:5 million was taken for Y and this must be regarded
TABLE 9: Predicted values of taxable income etc. 1974/75
£ million
i974/75 at tax code for 1974/75 !974/75 at tax code for I973/74
Y i 945 1945
PAL 730 47°PAL* 73° 655
AIP 1579 16o3EIR -- 357PAC 551 399TI 1028 847TI (Adj) ~ 998 827
1 To get the appropriate measure of taxable income we had to subtract the estimated valueof workifig wives~ dependent relatives etc. allowance. This was estimated at £30 million for1974:/75 tax code and £20 million for 1973/74 tax code.
as a very preliminary figure. Similarly, we ,have estimated the value of PAL(wh’ich is identical to PALe’’) under the new set of allowances established in theI974/’7,5 tax reform. It can be seen-that the value of PAL is some 89 per centhigher than the highest Observed value in the sample period (although it is onlyabout 3o per cent above the peak value foi" PAL~). It should ’be noted thatfrom 1948/49 to 1971/7-0 .the value of PAL 0nly rose by 11-0 per cent and therise h’om I951/5-0 to 1971/7-0 was proportionately tess than the one year riseh’om 19’73/74 to 1974/7.5.
If there had been no change in the tax code then taxable income would havebeen £807 million. Under the new allowance structure, which excludes earnedincome relief, the taxable income level for i97.~/75 would have been £998million, an increase of .0o.7 per cent. Unless the tax rate fell by an equivalentamount individuals would be worse off under the new code. But, as we haveseen,.the new code made nobody worse Off and many people a lot better off.This would imply that the’ effective tax rate comparable to ’the old standardrate of tax i.e., excluding incomes taxed above 35 per cent through surtaxwould be not more than -09.o-0 per cent. In turn this would imply tha~t no lesstllaii 66. per cent of all income was taxable at the -0i6 per cent rate and in allprobability an even greater proportion would be in the tax. band.
From an examination of surtax receipts we found that ~4’5.4 million of thetaxable income of. surtax payers in 1973/74. was above the -0.6 per cent.taxthresholdi.e., above the revised 1974/75 le/,el ’of personal. allowances plus
~I,5.5o per tax payer. This represented some io per cent of personM taxableincome when tlm lattei: ’is adjusted to take into account the lagged natm’e of_ ,.. . ., .... ¯ L
’.

SENSITIVITY O1~ INCOME TAX BASE 57
surtax liabilities. Thus the upper bands almost certainly account for over Ioper cent of taxable income in I974/75 and ought to account for less than 33per cent.
Until the data are published we cannot know whether our taxable incomeestimate for 1974/75 is reliable. It is possible given the rise in PAL, that thelevel of PAC is underpredicted and as a consequence taxable income is over-predicted. Our prediction for PAC for 1974/75 was only £551 million.However, in :973/74 personal allowances claimed were £378 million whichcould represent, if earned income relief were available in all cases, up to totalincome of £5o4 million. Since earned income relief was hlcorporated into theallowance structure we would expect that allowances claimed in I974/75 wouldbe close to this figure i[ no other improvements in allowances had been available.But, as a comparison of PAL:x" under the I973/74 code and PAL for 1974/75indicates, increased allowances worth £7’5 million in aggregate were availableeven after incorporating the earned income relief rate. Therefore a predictedvalue of £551 million for PAC may be too low.
However, we might be able to adjust the model to take account of the sharprise in PAL if data on the 1974/75 tax :base were available. Until then,however, we shall have to be content with the knowledge that the changes inthe tax code from i974/75 do not require a major recasting of the structure ofthe model although some problems may arise in attempting forecasts of incometax liabilities without some method of estimating the future effective tax rate.

()hapter 5
Further Extensions
W s have specified and estimated a model of the income ,tax code which
includes the important policy variable, the level of personal allowances.We have seen that the model performs quite well within sample and in out-of-sample projections. It is also adaptable, in theory, to the revised tax structureannounced in the 1974 Budget.
Inflation and IndexationAs the model is b~ed on ,time series data and contains an aggregate measure
of personal allowances we can explore the question of indexation of personalallowances as a means of reducing inflation-induced ’fiscal drag ’. If incomesincrease in money terms then, with fixed values for the level of personalallowances, ’income tax receipts will increase even when no real income increasehas occurred. This rate of increase in tax receipts will, in general, exceed therate of increase of money incomes and so attempts to increase money incomesfor changes in prices will be partially offset by higher real tax burdens. If atax system is progressive, so that the income elasticity of tax receipts is greaterthan unity, .then inflation in incomes will result in a transfer of real resourcesto the Government through increased real taxation. For many Governments this’fiscal drag’ is an important method of raising the real burden of taxationwithout causing undue resentment among taxpayers. However, in recent yearsthe rate of inflation in money incomes has ’been so high that substantialincreases in the real burden of taxation have occurred. This has given rise toarguments that income tax allowances and thresholds ought to be indexed, thatis increased in line witll the cost ’of riving. (See, for example, Petrel, (I975) andreferences cited therein.) This would help to offset ,the effect of inflation on taxpayments but would still allow tax revenues to rise when real incomes rose.
It is possible, within the model developed above, to explore the consequencesof indexation of allowances for ¢ax revenues in Ireland. Similarly, it is possibleto explore the consequences of a zero level of inflation in money incomes. Ingeneral, indexation of allowances for inflation from, say, I9’6o/6I would notfully offset the consequences of inflation because certain exemptions (such asinterest, life assurance premia etc.) may not have moved in line with the rateof ’inflation and so the real tax burden would have risen even with indexedpersonal allowances. Also, earned income relief in Ireland during this periodwas applicable only up to some maximum and this limit would have to beindexed ’if the effects of inflation were .to be properly offset. In our model wewere unable to include a variable .for the upper limit on earned income relief and
58

SENSITIVITY OF INCOME TAX BASE 59
so we cannot take account of the effect of increasing that limit in line with theincrease in the cost of living from I96O/,6I to I9’71/72.
Howcvel; we can deflate the 1971/72 level of income ,by the rise in consumerprices between 196o/,61 and i971/72--the increase in prices being ’7’5.9 per centover the period. The ),ear I96O/.6I was selected as a starting period for ouranalysis mainly because in that year the level of allowances had been sharplyincreased above previous levels and PAYE was introduced. Between 19,6o/61and 19’71/7.o the value of individual allowances did not alter greatly. We cansee from T~ble IO that the aggregate value of allowances at 196o/61 allowanceslevels was £367.2 million and this compares with an aggregate value for I971/72allowances of £3’84.3 million?~
TABLE IO: Values of exogenous variables for estimation of effects of i~ation ontaxes
£- million
At I96O/6I prices and At i97i/72 prices and196o/6Iallowance levels allowance levels
Y 683.9 1203. IPAL 367.2 633.4PAL* 489.5 844. I
In 197o/7i the value of tax adjusted personal income at 196o/61 prices wasonly £68,3.9 million compared to a value, at current prices, of £1,2o.3.1 million.If we supp’ose that income was at £683.9 miUion and PAL at £3,67.2 millionwe can, by applying the estimated relationships outlined earlier, derive a valuefor implied taxable income. Thus with these levels of income and allowancestotal taxable income would have been £I43.o million. Therefore if nominalincome had only increased :by the amount of the real increase between 1971/72and 196o/61 and if personal allowances had stayed at 196o/.61 nominal levelstaxable income would have risen from £,64.1 million (the actual value forI9.6o/,61) to £143.o million. Thus a real income rise of 70.8 per cent would havegenerated a rise in real .taxable income ’of 123.1 per cent--an implied elasticityof 1.69 over the period from 19.6o/61 to 1971/72. Even if there had been noinflation there would have .’been substan.tial real growth in taxable incomebecause of progressivity. In actual fact taxable income rose to £4o5.5 millionwhich, in real tenns, represents a rise of 257.4 per cent over the 19’6o/61 levelor an implied reM elasticity of about 3.57 over the period. Thus inflation inmoney incomes imposed considerable increased burdens of taxation in theeleven years from 19’6o/6i. In Table i i l%re can see that the value in 1971/72
a5 Strictly speaking, the two aggrega, tes are not comparable in that the I971/72 allowancesinclude the estimated effects of the ’ claw back’ provisions relating to children’s tax allowances.The effects represent a ’ policy’ change rather than a change due to adiustments for inflation.

60’ THE ECONOMIC AND SOCIAL RESEARCH INSTITUTE
:prices of the zero inflation estimated real tax burden is £2,5 I.,6 million. Thereforethe 1971/72 taxable income of £4o5,5 million was some £ 1,5,3.9 million higher
TABLE I I : Estimated taxable income under zero inflation and indexed allowances atI96O[6I and I97I[72 prices
Taxable income estimated on data atI96O]6I prices and I971/72 prices and I96O/6I
allowance levels allowance levels
£ million £ millionAt 196o/61 Prices
143.o.I47.7
At I971/72 Prices 351.6 ~59;8
Note: Taxable ,income estimated under the assumption of zero inflation would of coursebe at 1960/61 prices, Therefore to compare it with actual taxable income in 1971/72 it isnecessary to express it at 1971/72 prices by multiplying it by the price deflator. Similarlytaxable income estimated under the assump:tion, of indexation of personal allowances would beat 1971/72 prices. To compare that with the taxable income estimated at zero inflation we tandeflate the 1971/72 estimate to 1960/61 prices.
than would have occurred if the real tax burden rose only because of realincome increases. At a standard rate of tax of 35 per cent this represents taxpayments of about £’5’4 million or ~bout 4.5 per cent of adjusted personalincome.
An alternative approach to the question of the impact of inflation on realtaXrevenues is to examine the effect on taxable income of adjusting the level 9fpersonal allowances in line with inflation. Thus £rom T~ble Io we can seethat if the I9’6o/6i allowances had been adjusted for inflation they would havebeen worth £.63’3.i million in ’r97I/7.o.a~ With personal income of £I,2o’3.1million in that year tiiis would have yielded a taxable income of £259.8 million--compared to the £405.5 million actually raised. What is interesting is thatthis method of dealing wit, h the effects of inflation gives results very similar tothat of deflating personal income. Thus if allowances had been indexed in linewith inflation from i96o/6i to i971/72 then taxable income would have been£I45.7 million lower than it was in i97I/72 and £8.3 million higher than itwould have been had there been no price inflation?7 This discrepancy is almostcertainly due .to t.he fact that the earned income relief threshold remained fixedin nominal terms and certain tax deductions from income would not necessarilyrise in line with inflation. The discrepancy is small ,however so that in I971/72individuals were paying, assuming a 35 per cent standard tax rate, £’5 i.o millionor 4.o~ per cent of adjusted personal income in additional tax because of thefailure to adjust the I96o/61 level of allowances in llne with inflation.
36 We have ignored the ’claw back’ arrangements for 1971/72 and also theoperation ofminimum earned income relief. These can be considered either as policy changes or as adiust-ments similar to those that might be made due to inflation.
s~ Strictly speaking, indexation would have yielded £4.7 million (at 1960/61 prices) more
in taxable income than the zero inflation assumption. The ¯£8.3 milliori increase is at.!971/7:2prlceF and thus includes the effects of infla~tion on nominal taxable income. ...... - ¯ "

SENSITIVITY OF INCOME TAX BAS]~ 6I
Taxation of Farmers
We n’oted earlier, in our discussion of income eligible for taxation, thatfarmers’ income from agriculture was excluded from the tax net for the periodunder review. This exemption gave rise to considerable controversy and manyin the non-agricultural sector objected at this tax-exempt status for farm incomes.On the other hand, farm organisations argued that incomes were so low inagriculture that few would pay tax and the revenue gain would be small fromthe inclusion of farm incomes in the tax net. Also it was argued that farmerspay rates and that this tax exceeded, or in some way was equivalent to, theamount that might be due under income taxation. Although some farm incomeshave now ,been brought into the tax net the number involved is very small andat present these farmers can opt for a notional system of taxation based on verylow estimated returns per £ rateable valuation of holdings so that revenue yieldshave been tiny.
Thus ’it might be of interest to examine, at a very aggregate level, what ourmodel would imply for .the liability of the farming community ,for income tax.First we derived an aggregate measure of PAL and PAL# for the agriculturalsector. Thiswas based on demographic data contained in the I97i Censusadjusted for subsequent trends in employment. The income level for i973/74was obtained by weighting the i973 income by o.75 and the i974 income by0.2’5*. The data are shown in Table i2. By applying our estimated model tothese Values we obtained a value of taxable income of £97.7 million which atthe ~973/74 standard rate of tax would have been given a revenue yield of
£34.2 million. Thus ff farm incomes in i973/74 had been taxed as PAYEincome then, under certain assumptions, the revenue yield would have been£34.2 million. If we allow ,for payment of rates then income levels will behigher in agriculture and taxable income rises to £io5.4 million. This gives riseto a tax liability of £36.9 million of which £i.5.i million is paid via rates.Therefore if rates were treated as a deduction from income tax liabilities (ratherthan as a deduction from income) the agricultural sector would still have paidan additional £2i.5 million in taxation--equivalent to 5.8 per cent of income--in I973/74.
TABLE Io: gstimated potential tax liabilities of farm sector, I973/74
Rates as expense Rates as income tax£ million £ million
Farm Income (Y) 354.IFarm Personal Allowances
(PAL)(PAL*)
Taxable Income in FarmSector (TI) 97.7Tax Liabilities 34.2
369.5
*This is a very crude weighting system since far less than a quarter of farm incomes islikely to arise in the first quarter of the year.

THE ECONOB~IC AND SOCIAL RESEARCH INSTITUTE
These estimates do, however, assume that the distribution of income in theagricultural sector is broadly similar to that in the non-agricultural sector. Ifagricultural incomes were far more equitably distributed than in the non-agricultural sector then tax liabilities for a given aggregate level ’of incomewould probably be .far lower. However, ff agricultural incomes were tess equit-ably distributed then revenues could be higher than estimated. The evidencefrom the Household Budget Inquiry, I973, indicates that, if anything, rtfi:alfarm household incomes are less equitably distributed than non-farm householdincomes. Thus, for example, the bottom 29.’3 per cent of persons (with incomesbetween £7 and £8o per week) have 22.9 per cent of total income in the caseof non,farm households whereas the bottom 29.6 per cent of persons have .onlyi I.9 per cent of total income in farm households. Similarly, 39.2 per cent oftotal income is available to the top 22.9 per cent of non-farm householdswhereas 38.9 per cent of total income ’is available to the top 2o.6 per cent offal’m households. These figures are a crude indication that farm incomes areless rather than more equitably distributed than non-farm incomes. Thereforeit is possible that our tax estimates are lower rather than upper bounds. Ofcourse we have implicitly assumed the same degree .of evasion and avoidancein the ,two sectors and this may not ’be realistic--farm incomes are notoriouslydifficult to estimate at an individual level and few farmers would have sizeabledeductions in respect of mortgage interest payments;
However, the model does project, even if somewhat crudely, ,that in i973/74exemption from income tax was worth 5.8 per cent of total income (or £2 ~.5million) to the farm sector if rates are treated as a direct tax, and worth ~34.2million (or 9.5 per cent ’of income) if rates are treated as a business expense.Of course given the progressivity of the income tax system and the rapid risein nominal farm incomes which are expectedto be 5o per cent above the 2973level in’ 29’76 It is likely that the 29715 yield from the .full taxation ~f farmerswould be above the £34 million estimated for 2973/74. This is in spite of thechanges to the income tax code in 2974 which effectively lowered average taxlevels. The income tax estimate for 2973/74 did not include arty estimate forsurtax although it is virtually certain that ,had farm incomes been liable fortaxation some surtax revenues would have been received in r973/74.

Gondusion
WE have developed a model of the personal income tax system in Irelandwhich imposes certain a priori asymptotic constraints on the behaviour
of tax relationships. We have managed to develop art aggregate measure totake account of variations in personal allowances over the period. The modelwas estimated over a period from 194.8/49 to 1971/72 and the fit was good:.Out-of-sample forecasts for I972/’73 and 197.3/74 proved successful. The revi-sions to the tax code in 1974 may cause problems mainly because of the largeincrease in the relative size of the measure of aggregate allowances. However,the structure of the model should permit us to analyse the new tax code quitereadily.
The model can also be used to examine the impact of inflation on tax receiptsand, with somewhat more uncertainty, to examine the potential tax liabilitiesof the farm sector.
What we have developed is a model that can ’be used both for the analysisof past fiscal policy and for planning projections. The structure of the modelensures that unrealistic revenue projections will not result from attempts toproject nominal incomes some years ahead. The model has not been designedto project tax revenues in the short-term. In the first place the model was basedon tax liabilities which differ from receipts due to lags and leads in collectionand payment. Also the variables used are not necessarily available in a short-term forecasting context--for example, it might ’be quite difficult to ’obtainreasonably accurate forecasts of personal income, and its components, for usein a tax forecasting model. However, it is interesting to note that in a recentunpublished paper Kelleher (i97,6) has managed to adapt the model developedearlier, and in particular the concept of aggregate personal allowances, to short-term forecasting purposes.
In our study we have been concerned with the specification and estimationof the model rather than possible uses. Therefore we have not analysed fiscalpolicy, as conducted through income tax changes, throughout the period forwhich the model was estimated. That would have been a study in itself. Whatwe hope we have achieved is a usable model of the income .tax system whichincludes important policy varia‘bles and known ct priori restrictions.

TABLE AI: Composition of private and personal income I947-1972
(i)Privateincome
million
(2) (3) (4) (5)Adjusted Tax adjusted Tax adjusted To,,: adjusted
private wage and other personalincome salary income income income
(6)Undistributed
companyprofits
(7)Adjustedcompa19,taxableincome
1947 308.81948 334.3I949 358.3195o 373.51951 4Ol.5I952 431.41953 466.4I954 471.4r955 497.I1956 499.21957 517.o1958 522.61959 554-4196o 595.2196I 646.81962 696.11963 74o.21964 844.61965 899.91966 946.8I967 IO38.I1968 1185.21969 1347.4197o 1511.31971 1723.o1972 2o43.o
218.I233.6 i42.6 60.8246.9 156.6 6I.O265.7 I67.5 62.8285.7 I81.1 66.2
293.9 194-8 69"3314.5 2o5.8 7o.4328.0 218.7 75.I34o.4 227.9 77.8352.2 237.8 79.9353-3 246-3 82.8369.6 247-3 89.o39o.o 256.9 96.5425.7 293.1 lO2.7464.5 32o.1 lO8.35o6.6 35o.9 II7.6546.2 383.9’ I24.o619.5 431.3 132.2
667.9 468.o 143.7711.5 508.5 I56.1778.o 551.4 167.7879:3 616.9 182.3
lOI2.5 17o8.3 209.41131.6 814.o 237.o1288.1 949.7 253.41495.4
~o3.4217.6230.3247.3264.I276.2293.8305.7317.7329.1336.3353.4395.8428.4468.55o7.9563.561I.7664.6719.1799.2917.7
lO51.o12o3.1
18.519.o20.723.224.022.723.325.425.424.420.620.721.431.634.636.643.245,451.0
44.662.476.285.680.1
88.7Io6.o
II.915.717.518.320.520.818.7I9.I20.820.620.718.217.o18.426.330.232 .438.739-435-922.935.844.14o.o3o.o
00
o
0
r/l
N
r/l
Source: National Income and Expenditure, various issues.

SENSITIVITY OF INCOME TAX BASE
Notes to Table Az
65
Col. (I) Private Income is taken directly .from the Na,tional Income Accounts.It equals total personal income plus undistributed company profits.
Col. (2) Adjusted Private Income is ,derived from total private income given inthe National Income Accoun.ts. It equals private income less the following items(a) income of independent traders in agriculture (’b) employers’ contributions tosocial,~ insuran.ce (c) transfer income (excluding pensions and allowances from abroadbut including emigrants’ remittances).
¯ Col. (3) Tax Adjusted Wage and Salary Income is based on the NationalAccounts entry for wages, salaries, pensions, etc. I,t does not include wages, salaries,pensions from abroad. From 1953/54 onwards wage and salary payments by Cen-tral Government were excluded from the total wage and salary figure. This privatewage and salary total was adjusted for .tax purposes by applying weights of o.75and o.,25 respectively. Thus ,the private wage and salary income for 195.3/54 wasassumed to .be equal to o.76 times the total for 1953 plus o.25 the total for 1954.Prior to 196o/6I this total was lagged one year a,nd added .to the Central Govern-ment wage and salary bill also lagged one ’year. After 196o/6i the total for privatewage and salary payments was not lagged but the Central Government wage andsalary total continued ’to ’be lagged.
Since no data were available for Central Government wage and salary paymentsprior to 1953 the total wage and salary payments, as shown in the National Ac-counts, were adjusted for the tax year ,by applying the weigh.ts o.75 and o.25 andlagging the total one period. Entries refer to tax year, thus entry for I97,1 refersto 1971/72.
Col. (4) Tax Adjusted Other Income. Other income was defined as adjustedpersonal income less total wage and salary payments and undistvlbuted companyprofits. ,It was adjusted to a tax year basis by using the weights o.75 and o.25 as inthe case of private wage and salary payments. This total was lagged one period.Entries refer.to taxable year. Thus 1971 entry refers to I971/72.
Col. (5) Tax Adjusted Personal Income equals Col. (3) plus Col. (4).
Col. (6) Undistributed Company Profits is taken from the National Accounts.
Col. (7) Adjusted Company Taxable Income was derived as follows. Corporationprofits tax payments were subtracted from total company tax paymen.ts as given inthe National Accoun.ts. The residual was thus equal to company income taxes paidin respect of retained earnings. This was grossed up a.t the standard ,tax rate to givethe data for taxable company income. The total was .then lagged one 5,ear. Therationale for such a procedure is as follows. ~Company income taxes are payable inthe January of the year of assessment. Thus taxatioaa assessed for 197’1/72 wouldbe payable in January 1972. Thus company income tax receipts in the tax yearI97I/7~2 would ’be in respect of taxable income assessed for 1971/7,2. ~(This doesassume that cornpan,les do not .delay more than 3 months in paying assessed taxes.)By grossing up receipts for I97I/7,2 at a standard rate applicable for 197I/72 wecan derive company taxable income (and actual income) for 1971/72.

T.~d3z~z A2 : Breakdown of income tax assessments I947/48 to I971/72
£ miUion(I) (2) (5) (4)
Perkonal1 ff, arned PerSonalActu’ai actual iiic6mi allowa’ficesihcome inc6me relidf ( a~sied) ~
z 94714g 9 i.6 79-7 i 1.4 33-6
948149 i09’8 94. ~ ~.0 39:5i949/5t~ i 17.8 Io0.3 15--7 43-9i95o/5i I28.2 z09.9 17,2 47,8i95115~ i38;5 .I i8.o I8:3 51 ;7z952/5g I56.6 I2§.8 ~4:5 54’8
953154 ~ 55.2 z 36.5 ~6.3 5’8.4i954/55 z48,3 i29.2 a4.9 ~i.31955/56 156.6 135.8 ~6.o ~4.oi956/5~ z62.6 z42.o 28’:3 ~8.2i957/58 I71,6 I56.9 29.8 6o.91958/59 172:7 I54-5 3 i;2 .63.8I959/66 I87.4 ~7o.4 33"8 68,4I96o/6I I89.o I76.6 34.3 7o.8i961/62 2i3:I ~86.8 39.~ ~9.6~96~/63 252.5 ~22-3 47.5 §’~.§
963[64’ 286. ~ ~53"7 5"~" ~ z o3:61964/65: 365-7 3~.7.o 72. 7 ~ 34’ ~
965/66 4~4.7 375-3 81:7 ~5 ~-2
966/67 469.7 433,8 93.4 ~ 77.21967168 565¯. 8 48d_ -9 I 9~ ;o 196.0968/69 568,~ 53~.4 z 19.4 2 ~ 4.9
i969/7° 663. ~ 6 ~ 9.0 ~ 40.4 ~ 38:897o17~ 76~.9 7~.9 ~65"7 ~°’4
~97I/7~ 937"7 907"7 I9~,8 ~94.9
(5) (6) (7) ~Wife’s eariigdiiicomi~ houie~
keefie?s anddepetideni Personalrelatives Taxable taxable
alloioancgs incortiO incdmea~q
~. i 45.5 33"6¯ 3 54-9 39,~ .~
~.o 56.~ 38.7 o¯ 4 60.8 42.5
~.4 66.0 45.5~-7 68.6 47.82.§ 67.5 48,82-5 69-6 5°’5~.5 74-i 53’3 o3.0 73.~, 52.:53.g 77.6 561.9 ~:3.3 74.4 56‘~3.5 at.) 64,,)3.~ 8~/.8 6~.43.B 96,.8 64.5 ~~.~ ~o8.6 77,84-7 ~.3 9!.96"3 z5~/’6 ~3-97.0 ~7~.8 ~35;48.5 ~90.6 ~54:79.0 ~97.8 i74,9~.~ ~5.3 ~8~-S9.9 ~7~.° ~9.9
~.9 34~.8 3~.8~4.5 435-5 4o5:5
Equals Col. (1) less Col. (7) of Table A1.
-~Total Personal Allowances claimed less Col. (5).Equals Col. (6) less Col. (7) of Table A1.
Source: Annual Reports o[ the Revenue Commissioners, va.rious issues.

Appendix I
The Construction of an Aggregate Me~ure of Claimable Personal Allowances
I N order to construct a series which would represent the total amount ofallowances which would be claimable by the population if all non-agricultural
income earners were in the tax net it was first necessasry to obtain basic demo-graphic information. From the Census of Population for the years 1946, 195I,
i96I, Ig66 and i97I it was possible to obtain the following information
(a) the number of married men gainfully occupied in the n’on-agricultural sector(b) the number of single and widowed persons gainfully occupied in the
non-agricultural sector8s
(c) the number of children under 14 dependent oll the non-agricultural sector(d) the number of persons at full-time educational institutions and the
number of persons aged 14 and 15 neither at work nor at full-time education.It was necessary to apportion the groups in (d)into the agricultural and non-
agricultural sector. When this is done the sum of (c) plus the non-agriculturalportion of (d) equals the number of children in the non-agricultural sector inrespect of whom tax allowances could be claimed. The sum of (a) and(b) equals the total non-agricultural l~bour force (including the unemployed
TABLE A3: Sectoral distribution of gainfully occupied persons and dependent childrenfor various years
a. Married Men (GO) (ooo’s)Agriculture I38.5 i34.5 I2i.i ii5.7 io3.6Non-agriculture 253.2 279.0 29°.6 315.o 359.3
b. Single & Widowed(GO)
Agriculture 3o9.7 268.3 i95.5 i66.8 i3o.oNon-agriculture 574.3 568.2 476.6 494.9 487.4
c. Children Under 14Agriculture 22 x .9 2o8.7 197. i 17o.8Non-ag.r, ieulture 771.8 58o. ~ 61 i. i 648.o 7o2. I
d. Children I4-i5(NGO) and
children overi6 atschool etc. 94.4 95.7 I23.5 14o.6 I86.I
Notes:
Sourcg;
GO = gainfully occupied. NGO = not gain¢ully occupled.. ;Agricul-ture is defined as family ~ama workers and excludes farm employees.These are included in the non-Agricul, tural sectors.Census o/Population, various issues.
as Hereafter we shall treat widows and widowers as single persons.
67
68 THE ECONOMIC AND SOCIAL RESEARCH INSTITUTE
but excluding married women). The data available from the Census of Popu-lation for both agriculture and non-agriculture are set out in Table A3.
For our purposes we need annual data on the total number of single personsand married men gainfully occupied in the non-agricultural sector and depen-dent children (defined as those not gainfully occupied under I6 years of ageand those at full-time education aged I6 years and over). To obtain theseannual figures we had to make some adjustments and interpolations to publisheddata.
The non-agricultural labour force was defined to include employed farmlabourers but to exclude family farm workers. Thus the annual CSO figuresfor the agricultural labour force had to be adjusted to exclude farm employeesand the movements in the number of male employees on farms each year, asshown in the Trends of Employment and Unemployment (TEU), were usedto make the adjustment?D
Married women in employment were excluded from the total non-agriculturallabour force measure. Since the annum CSO labour force estimates are basedon Census of Population conventions it was necessary to interpolate the marriedwomen total for inter-censal’ years. M’ovements in the total for married womenwere based on movements in the total non-agriculture l~bour force (includingmarried women).
Given ,the estimated total non-agricultural labour force for each year--derivedby subtracting the estimated number of married women and family farmworkers from the CSO labour force estimates--it was necessary to subdivide thistotal into single persons and married men. The total for single persons wasinterpolated for inter-censal years by examining movements in the ratio of singlepersons to the total ’between census years. Thus, for example, the fall in thenon-agricultural labour force (excluding married women) between I951 andi96i was 80 thousand which was due to a fall of 91.6 thousand in single personsemployed and a rise ’of I 1,6 thousand married men. The ratio of single personsin the total fell from o.67I ,to o..62I an average annual rate of decline in theratio of --0.77 per cent. For interpolation purposes this annual average declinewas applied in each year and the total of single persons derived. The marriedmen total was thus obtained residually. This interpolation method can only beconsidered approximate since it is likely that movements in the ratio of singlepersons .to the total were not taking place at a constant rate but were associatedwith movements in the total. Thus it seems probable that, for example, the fallin the total non-agricultural labour force of I9.9 thousand between I957 andi958 led to a larger fall in the ratio of single persons to the total than the annualaverage decline over the whole 195 I-61 period.
~0 ’I~he TEU figures for farm employees differ from Census of Population data. Thus wehad to estimate the farm employee numbers on the ’basis of Census of Population conventionsand timing for each year rather ~h,an use the TEU data. It was assumed tha:t movementsin the TEU data would be reflected in Census data if the latter were available for each year.

SENSITIVITY OF INCOME TAX BASE 69
The inter-censal interpolation of non-agricultural dependent children wasbased on movements in the interpolated values of married men in the non-agricultural sector. In fact the ratio of dependent children to married men wasrelatively stable in census years so that assumed movements in the year-to-yearratio were quite small.4°
The results of these interpolations are set out in Table A4 Col. (i) plus Col.(6) is the total non-agricultural labour force. When Col. (5) is added to this totalthis yields the total labour force as estimated by the CSO.
To obtain the aggregate amount of exemptions which might be claimed ifthe total non-agricultural population was in the tax net it was necessary to applyto :the annual disaggregated population estimates the relevant tax allowances.The amounts allowable for single persons, married men and for children are setout in Ta‘ble A5. N’o account was taken of the fact that our estimates of singlepersons in the non-agricultural labour force include widows/widowers andslightly higher tax allowances are granted for this category of persons. Thus thePAL measure in Col. (5) of Table A5 slightly understates the total amountpotentially claimable ’by the non-agricultural labour force.
A problem arose in connection with the appropriate level of children’s taxallowance to use. Between i954/55 and I96,5/66 a single rate of allowancewas in force for all eligible children. Prior to i954/55 a higher allowance wasgranted in respect of the first and second child than for subsequent children.After 1965/66 a higher allowance was granted for children over i I years thanfor younger children. Thus for the years prior to 1954/55 the figures for chil-dren’s tax allowances are based on a weighted average of the two allowancerates in force; the weights were based on Social Welfare data which allow usto obtain the ratio of children, who are first and second children in a family,to total children in respect of whom children’s allowances are being claimed.While these data include the dependent children in the agricultural sector wehad no evidence to indicate marked discrepancies in family structure betweensectors.
For years after 19.65/66 the prop~ortion of dependent children under I I wasestimated on the basis of Vital Statistics’ returns which permit us to estimatethe proportion of children under I I to children under 1.6 in the population.Admittedly, this raises the same problem as in the pre-i954/55 adjustment sinceseparate data on the age distribution of dependent children in the non-agricul-tural sector are not available.
A further problem arises from 19.69/7o due to the introduction of ’claw-back’arrangements in respect of children’s allowances. In that year, and subsequently,
40 The ra4:io of dependent children to married men in the non-agricultural sector forcensus years was as follows:
I95I : o.34I96I : ~.4I1966 : ~.4o197I : ~.42

TAULE A4: Estimated annual distn’bution of gainfully occupied persons and dependent children I948 - I97r-,ao
(i) (2) (3) (4) (5)Total
gainful& Married Single Dependent Family farm workersoccupied1 men persons2 children male female
(6)Married
womgn (non-
agricultural) "O00~S)
1948 835-9 263.6 572.3 625.9 358. i 74.o t 7-4i949 839.4 268.6 57o.8 634.2 35r’6 71.4 17.4I95o 844-3 274. ~ 57°.2 643.6 347-3 69.7 17-4I95 x 847.2 279.o 568.2 65 z .5 34o-5 66-9 ~ 7.41952 845.0 282.6 562.4 661.9 328.8 62. I 18. Ir953 838.2 284.6 553.6 668.6 317.o 57-3 I8"51954 846.3 291.6 554-7 687. I 3o8.9 54.o 18.81955 828.3 289-5 538.8 684-2 3o7.2 53-3 19.21956 81 o.6 287-3 523" 3 68 I. I 3o5¯ 3 52 "5 19.6I957 8oo.6 287.7 512.9 684. I 293.7 47.8 I9.9i958 78o.7 284.4 496.3 678.3 292.6 47.4 2o-3I959 773.7 285-6 488. I 683.2 288.8 45-9 2o.6I96o 769.9 287.9 482.o 69o.8 283.4 43-7 21 .oi961 767.2 29o.6 476.6 699.4 278.3 41.6 2Loi962 778.3 296.5 48I .8 713.5 274. I 4o.2 o 1.41963 79°.6 3o2.9 487"7 728.8 27o.6 39.o 21.8i964 8oo.o 3o8.2 491.8 741-4 264"8 37.o 22.oI965 8I°-9 3 I4" I 496.8 755-5 253.8 33.o 22.3i966 8r 1.4 3I6-° 495-4 759-9 251.3 32-4 23-I1967 8I 7.2 324. I 493. I 78o.2 242.7 3o.7 25.4I968 827.9 334.2 493"7 8o5"4 236. I 29-4 °9.61969 833.2 342.2 491 .o 825.5 229.2 28.o 31.6197° 842. I 35 I. 7 49o-4 849"3 217"2 25.6 35. II971 846.7 359-3 487"4 868.6 211.5 24.6 36.8
1 Excludes married women and family farm workers.Includes ~ridow(er)s.
Source: Trends in Employment and Unemployment, Census of Population, v~rlous ,issues.

Tm3L~ A5: Personal tax allowances, earned income relief rate and estimated aggregate personal allowances claimable 1947/48 to z 971/72
Married men Single person Weighted child Earned income relief rate~ Personal allow-allowance1 ances potentially
claimable (PAL)3
£ £ £ max min £ million
1947/48 26o 14° 52.6 .2o 18o. II948/49 26o 14o 52.6 .2o i8z.61949/5o 260 I4o 52 .6 .20 183. zi95o/51 260 I4o 52.6 .20 I85.oi95 z/52 280 z4o 72.6 .20 205.0z952/53 280 I4o 72-6 .25 .20 205.9z 953/54 28o 14° 72 .6 .25 .2o 2o4. Ix 954/55 3oo z 5° 85.o .25 .2o 229. I1955[56 3oo 15° i oo. o .25 .2o 236. zi956157 3z° I5° zoo.o .25 .20 235.7i957/58 3so i5o Ioo.o .25 .20 234.5I958/59 3Io i5° ioo.o .95 .20 23o.41959/6o 3 z o 15° i oo.o .25 .20 23o. i196o/61 394 234 12o.o .25 3o9. iI96z[62 394 234 I2o.o .25 3Io.oi962/63 394 234 i2o.o .25 315.21963/64 394 234 12o.o .25 32o.91964/65 394 234 12o.o .25 325.5I965/66 394 234 i2o.o .25 33o-7
1966/67 394 234 129. 7 .25 339.o1967/68 394 234 139-9 .25 352.2
I968/69 394 234 I4°’° "25 36o’oz 969/7° 424 249 133.6 .25 377.6197o/71 424 249 128.8 .25 38o.6I97Z/72 424 249 I27.3 .25 384.3
(536-5)(562 -5)
Sources: Annual Reports of the Revenue Goraraisffoners, various issues.1 Allowances are weighted to allow for .the feet that from 1947/48 to 1953/54 a lower rate of allowanee was granted in respeo~ of third
~or greater) dependent ehildren .in a family. Similarly, from 1965/66 a lower rate of allowance was granted for children under 11. From1969/70 the aUo~,anees are further adjusted to take account of the ’elawbaek’ provisions in respect of Social Welfare Allowances.
2From 1952/53 to 1959/60 the minimum 20 per cent earned income rate applied .to earned income b~tweer~ £800 and £1,800 p.a.s Derived by multiplylng the population estimates in Appendix Table A4 by the appropriate tax allowances.
7O THE ECONOMIC AND SOCIAL RESEARCH INSTITUTE
tax allowances for the second or subsequent child eligible for children’s allow-ances under the Social Welfare Acts were reduced: in these years the SocialWelfare data on children’s allowances were used to ascertain the proportion oftotal allowances paid in respect of the second or subsequen*t children. Theseweights were used to obtain a weighted average ’claw-back’ which was thendeducted from the average children’s tax allowance derived from the use ofVital Statistics weights. These averages are set out in Col. (3) of Table A5.
When the numbers of married men, single persons and dependent childrenin the non-agricultural sector are multiplied .by the appropriate rates of allow-ance, the aggregate me~ure of personal allowances which could be claimed bythe non-agricultural sector (PAL) is ’obtained. As may be seen from Col. (5) ofTable A5 this aggregate has more .than doubled ,between I94J7/48 and I97I/72due mainly to increases in the rates of allowance but also to growth inthe eligible population.
As we noted in the main text, the operation of earned income relief metalsthat in general the mmximum amount of income which could ’be earned by thenon-agricultural population before entering the tax net can be ’obtained bymultiplying the PAL measure by i/i--R where R is the rate of earned incomerelief. The values for R. are set out in Col. (4) of Table A5. However, fromI97O/71 a min’inmm earned income allowance was introduced. Thus a marriedman with earned income only would have to have income exceeding £’649 p.a.befoi’e entering the tax net instead of £5,65 under previous regulations. ForI97o/71 a married man would have required earned income in excess of £90obefore he would have claimed earned income relief at 25 per cent rather thanthe minfimun allowance; for i971/72 and subsequent years the amount wouldhave been £I,ooo earned income. Thus any married man with total personalallowances equal to or less than £675 in i97o/7I and £7.5° in i971/72 wouldneed income equal to his personal allowances plus the minimum earned incomerelief before entel~ing the tax net.4~ In i97o/7i and I971/72 a married manwith two children (both qualified for Social Welfare Children’s Allowances)would be entitled to personal tax allowances between £679 and £709 depend-ing on the ages of the children. We assumed for both years that ~he 25 per centearned income rate would apply only to the third ’or subsequent child. Therefore:in order to derive a measure of PAL~ (which for years prior to I97O/.7I wasdefined as (PAL) I/I-R ) we added the appropriate minimum earned incomerelief to both single and married tax allowances.
We then obtained the number of children who were the first and second childin a fancily and multiplied this total by ’the relevant weighted child tax allow-ance. The number of children who represented third or subsequent dependentswas multiplied by the appropriate .tax allowance and this aggregate was grossedup by the factor I/I-R. The sum of the aggregates derived, equals, in theory,
-11 Assuming, of course, that he had earned .income of at least £225 in 197o/7i and £25°
in. x971/72.

SENSITIVITY OF INCOME TAX BASE 73
the maximum income which could be earned by ,the non-agricultural popula-tion before any tax liability would arise. The results of these calculations areset out in Table A6 below.
TABLE A6 : Adjusted measure of aggregate allowances claimable, 197o/71 and 1971/72
I97o/71 I971/72Married Men1 228.3 242.2Single Persons2 183.4 i94.5ISt and 2nd Child3 69.2 7o.83rd and 4th Child4 55.6 55.I
TOTAL ( = PAL*) 536.5 562.6
£ million
Notes(i) Married men’s allowance plus minimum earned income relief (£225 in I9.7o/
7 I, £25° in I971/72) multiplied by estimated number of married men.@) Single allowance plus minimum earned income relief (£125 in I97O/71, £15o
in 1971/72) muttipl, ied by estimated number of single persons.(3) Weighted allowance for children multiplied by estimated number of children
who are first or second children in families.
(4) i/I-R ,times weighted allowance for children multiplied by estimated num-ber of children who are third or greater in families.
The aggregate derived for i97o/71 of £536.5 million compares with £5o7.4million--which is I/i-I( times £38o.6 million--for the same year using the oldbasis for deriving PAL~’:’. Thus the introduction of a minimum earned incomerelief led to art increase of about £3o million in the maximum amount thatcould be earned by the taxable population before liability to tax need arise.
We might also note that the value of 8PAL~/$PAL is no longer i/1-R forthis adjusted measure of PAL’~’. For a unit change in PAL, caused, say, by arise in married men’s allowances, will only lead to a unit rise in the new PAL%However, if a rise in PAL is due to a rise in the allowances for third or greaterchildren in families, then the rise in PAL~ would have to be grossed upby I/1-R. It can be seen in Table A6, that the value of allowances for thirdchildren represents only about 8 per cent of total allowances [note that in TableA6 the data for third or greater children are grossed up by i/I-R]. Thus onaverage we might say that a unit rise in PAL causes a rise of I.O3 in PAL~’, i.e.,
5PAL* , . 5PAL* I5PAL = 1"°3 (since ~ = (1)(.92) + (.o8) ~)
= I.o3Of course this can only be viewed as an approximation since a very large changein single or married men’s allowances could mean that earned income reliefwould ,be claimed at .the 25 per cent rate rather than the minimum allowance.For example, if the single person’s allowance had exceeded £45° in i971/72then the entry threshold to the tax net would have been I/I-R times the allow-ance rather than the allowance plus £ 15o minimum earned income relief.

Appendix 2
Income Elasticity of Income Taxation and the Dist~qbution of Income
SuPposE incomes are distributed according to Pareto’s law. This asserts thatincomes are distributed according to the frequency distribution Z ---- A/x "+
(A mid a positive constants) where Z is the number of persons with income £x.The number of persons, N, with incomes above £x is then defined as
fx°X____ A+ i A I
N= dx=-- x--F (I)~z
while the average income of these persons is defined as
. =~ Xx-7-gTdX=~l --Zi x--g=-7_l-- ~ x (2)
Thus the average income over £x is equal to a constant nmltiple of £x.Suppose we assume that the threshold level, £x, is the basic personal allow-
ance for tax purposes. Thus only incomes in excess of £x will be in the tax net.[We should note that personal allowances for tax purposes will vary with thecharacteristics of the household, e.g., mm’ital status, number ’of dependent chil-dren, etc.] Then taxable income will be defined as
T = N(y--x) (3)which will vary as x varies. Eq. 3 is based on the fact that taxable incomeequals gross income, Ny, less personal allowances claimed, Nx.
We will assume that income grows at a rate, r per cent, between periods o andI and I and 2. We will further assume .that income growth is such that thePareto distribution is maintained. Thus all individuals in ,the economy experi-ence a growth in their incomes equal to r per cent in each period.
We will further assume that personal allowances are r,’dsed ’by z per centbetween period o and period i. Thus ,taxa’ble income in period I depends onboth increasedincome and increased tax allowances.
For our purposes we are interested in 4 taxable income yields; the actualtaxable income in period I, the taxable income in period i at period o’s personalallowances, the taxable income in period o at period I’s personal allowancesand the taxable income in period o at period o’s personal allowances. Thesecan be defined as
,T’, = N’I (y’l--E’)
,’r% = N% ,(y°~-E°),
,T’~ .= N’~ (y’fE~)
’T% = NO. ,(y%--E°)
74

SENSITIVITY OF INCOME TAX BASE 75
Thus, fox" example, T°2 refers to the taxable income in period 2 at the allowancerates of period o while T’2 refers to taxable income in period 2 at the allowancerates of period I. Similarly N% refers to the numbers in the tax net at the in-come of period 2 and the allowances of period o while y % is the average incomein period 2 at period o personal allowances. E° is the level of personal allow-ances for period o and E’ the allowance level for period i.
To proceed with the analysis we must determine the values for y’,, N’, etc.This can be done by using the Pareto distribution. A rise in income of r per centwith allowances unchanged will bring into the tax net those individuals withincomes within r per cent of the threshold. Thus a rise in income can be viewedas a lowering of the threshold to include more incomes. Thus if
a XY°o =(~--ZS) 0 (4)
Xothen Y° 1 = ( ~Z"~)(’~’-~)(I + r) = (~_ i) Xo (5)
Where the first two terms represent the average income in period o of thosea’bove the income level X0/i-kr. Since all incomes have risen by r per centbetween period o and i we have to multiply the average income of thosewith incomes above X0/I+r in period o by I+r to get the average income ofthose on the tax net in period i. We note that the Pareto distribution impliesthat the average income of those above a fixed threshold is independent of in-come growth when suoh growth preserves the distribution.
We can handle the question ’of the change in the level of personal allowancesill a similar manner. Thus if allowances 6se ,by z per cent then the tax net willonly include those with incomes above X0(i +z) where X0 was the level of per-sonal allowances before the increase. Thus increases in allowances can betreated as an increase in the threshold level of income while increases in incomecan be treated as reductions in the threshold. If the level of allowances rises byz per cent between period o and period I we can see that
Y’t=(~-xXX°~)(I+r)=~-1X°(I+Z) (6)
where y’l is the average income included in the tax net in period i with theallowance rate for period i.
We can defineE° = Xo and E’ = xo(I+Z)
as the level of allowances in periods o and I respectively. Thus
1T’t=N’I (y’I-E’)=N’~ ~ Xo (I +z) - (I +z) xo
=N’,Xo(~+z) ~ (7)

so that
76 THE ECONOMIC AND SOCIAL RESEARCH INSTITUTE
In a similar manner we can define T’2, .the taxable income in period 2 at periodi’s allowance rate as
T’2=N’2Xo(I+z) ~ (8}
T’2/T’I = N’2/N’I.
If we hold allowances at the base level so that
E° = E’ = Xot.hen we cart see that
so thatT%/T% = N%/N%.
The methodology adopted by Prest assumed that
T%/T% = T~’2/Tt1
The question is whether this is true for the Pareto distribution outlined above.To answer .that we have to examine N’~/N’I and N%/N°a.In general
N=A x~- ,~ from eq. (i) earlier
ThusA i A i
N ’2= a FX0(I +z)TandN’l =a i-x0(1 +z).]~ (i0)
L ~¥-~)"J L (’ Jso thatSimilarly
N’2/N’~ = (l+r)"
A i A iN°2= ceF Xo Tand N°’=Zr Xo T (II)
L(~ +~)~J L (’ +r)jso that N%/N% = .(l+r) ~
Thus N%/.N% = N’2/N’I so that T°2/T% = T’2/T’x which was the assumptionmade by Prest.
The intuitive explanation of this finding is that, given a Pareto distributionof income, the responsiveness of total income above a certain threshold level toa proportionate change in the threshold is independent of the threshold. Thusthe responsiveness of income in the tax net to a fall in the threshold from Xxto X1/(l+r) is the sanae as the responsiveness to a fall {rom X0 to Xo/(l+r).

SENSITIVITY OF INCOMtg TAX BASE 77
Since any income change which preserves the distribution can be viewed as aproportionate change in the threshold it is clear that it is sufficient to calculatethe proportionate increase in taxable income due to a rise in total incomes atany constant exemption revel in order to find the proportionate increase at abase year exemption level.
It may be objected that the analysis so far has been conducted in .terms oftaxable income rather than tax yield. Thus it is useful to know whether undera progressive tax system, where incomes are distributed according to the Paretodistribution, the Prest assumptions hold. A simple progressive tax system can berepresented as follows
R = tN(y--x)+t*V(w--u) ~ (12)
where y equals average income above the threshold x and w the average incomeabove a higher threshold u. N is the total number of taxpayers liable at thestandard tax rate t, while V is the number of taxpayers, with ’incomes above u,liable at the additional surtax rate of t÷:’.
Thus tax yield in period I at period i’s allowances can be represented as
R’I = tN’l (y’~-- nl)+ t~:’V’l (wq- u) (I 3)
and similarly for other periods income and allowances.Using the methodology outlined earlier it can be shown that
, R0R___2 = (~ +r)~_ ~(~4)
R,1- Ro-"~
so that the Prest assumption is valid under a progressive tax system ifincomes are Pareto distributed.
However, if incon~es are log normally distributed then the income elasticityof taxable income will not, in general, be independent of the thresh’old or exemp-tion level. Thus if, for example, incomes are log normally distributed with avariance of 0.3642 and average per capita income in the community is £i,oooin period I and £I,mO in period 2 (i.e., a growth of income per capita of Ioper cent) while the base period exemption level is £5oo and the exemption levelin period i is £6oo, then it can be derived that
TO ,2 I.I78 while~=I.198T-~I~ ’l’ 1
Thus the income elasticity of taxable income at a threshold of £6oo (I.98) isgreater than the elasticity at an exemption level of £500 (I.78).
42 Stark (1972) estimates values for the standard deviation of the log of income in theregion of o.6 for the UK.

Appendix 3
The Irish Income Tax System
(This Appendix is designed to outline the basic elements o[ the Irish incometax system /rom x949 to 197~ ]or the non-Irish reader. It is not intended to be acomprehensive summary o[ the system.)
Personal and Company Taxation
For the period with which this study deals income tax was payable on allincome arising within Ireland regardless of whether it accrued to individualsor companies. Thus there was no separate personal income tax although, as weshall see, the tax was modified by the operatior~ of personal allowances or reliefs.
Income Tax Schedules
For much of the period under review income had to be reported to the taxauthorities under a number of Schedules. These ’Schedules were a form of classi-fication of income by source for tax purposes. There were five Schedules andfor some of the period individual returns in respect of income under eachSchedule had to be returned by a taxpayer. The Schedules were A, B, C, Dand E. Schedule A income was income accruing from ownership of land andproperty. For the most part income under this category was notional since itwas based on the fixed nineteenth century valuation of land and property.Schedule B taxation was based on income arising from the occupation of lando1" property. As with Schedule A it was basically a notional tax system and wasalso based on the nineteenth century valuations of property. Farmers were, ingeneral, liable to tax only under these Schedules and this meant that virtuallyall were free from any tax on their actual income from farming. The revenueraised under the Schedules "was small and the categories were abolished in
I969/7o.Schedule C income is based on income from securities while Schedule D in-
come refers to income or profits arising from a business, tradeOr profession. Itis this latter Schedule which encompasses the ’bulk of the incomes of the self-employed, partnerships and companies.
Schedule E income refers to’ incomes from employment and covers virtuallyall incomes obtained through wages and salaries.
In general it made little difference to the taxpayer whether his income was,assessed under one Schedule or another since total tax liability would depend onthe aggregate of income falling under the different schedules.
Timing o[ Liabilities and Pt~yments
Prior to the introduction of PAYE in 196o the .following timing structure ofassessments and payment ’of tax liabilities was in force. Income accruing in the
78

SENSIVITY OF INCOME TAX BASE 79
tax year from April 1955 to April 195.6, say, would be assessed for income taxin the tax year 1956/57. The first instalment of tax would be payable in January1957, i.e., in the tax year 1956/57 and the balance would be paid in July 1957,in the tax year 1957/58. Thus there was a considerable lag between the timewhen income was earned and when tax actually became payable. There weretwo exceptions to the general scheme. Company income tax became payablein January in full. In the case of many civil servants, and certain quasi-civilservants, income tax was payable through more regular deductions. Thus thisgroup paid the i956/57 tax liability in instalments throughout the tax yearI95’6/57 by regular deductions from pay. This scheme of statutory deductionsdiffered from PAYE (Pay As You Earn) in that income tax was paid in arrearsi.e., the tax in 195.6/57 was in respect of 1955/5.6 income.
When PAY’E was introduced in 196o virtually all Schedule E income--ex-cluding those wh’o were covered by statutory deduction schemes which continuedunaltered-was taxed as it was earned. Thus income tax liabilities in respectof a tax year such as i962/63 would be based on income earned in that yearand the tax liabilities would be paid in the year also. Income under otherSchedules was taxed as before.
Reductions and DeductionsIn common with most income tax systems the Irish tax code gave allowances
and reductions from income for certain expenses. The main items were depre-ciation and wear and tear allowances, special investment allowances, interest inrespect of business or other borrowing including mortgages on private housesand consumer loans. Profits arising from export activities of companies were,from 1957, exempt from income tax and a company could deduct this portionof its income for the purposes of assessing income tax.
Personal AllowancesFor individual taxpayers a system of reliefs ’or deductions was in operation
throughout the period. These allowances were based on the marital status andfamily size of the taxpayer and could be deducted from income before liabilityto income tax arose. The allowances in respect of children depended at somestages ’on the age of the children while at other times the allowances for childrenwas at a flat rate for all children. Table A.5 earlier sets out the level of allow-ances during the-period for a number of relevant categories.
Earned Income ReliefEarned income, up to a certain maximum, was taxable at a reduced rate for
the period I949 to i97’2. For most of that time the rate of relief was 25 percent. Thus 25 per cent ’of a taxpayer’s earned income, up to a certain limit,was exempt from tax. Thus a taxpayer with income ’of, say, £ 16oo could claimearned income relief of 24oo before beginning to deduct his personal allowances

THE ~,CONOMIC AND SOCIAL RESEARCH ~STITUTE
and so assess his liability to tax. Table A.5 sets out the rate of ea~aaed incomerelief for the period under considerati’on. As that table notes there were periodswherL the rate of earned income relief was higher for the first fraction of earnedincome and was reduced for larger income.s.
The Income Tax Rate
After an individual had claimed all deductions in respect of expenses, interestetc., personal allowances and earned income relief, an income tax rate wasapplied to this balance (which was known as taxable income). In general, thisrate was a single rate of tax although for much of the 195os a lower rate of taxwas applied to the first fraction of taxable income and the ’standard’ rate oftax to the balance. A separate system of taxing higher personal incomes (butnot higher company incomes) known as surtax was also in operation during theperiod with which this study deals. Owing to the paucity of relevant data andthe frequent changes in the rules governing the calculation of this tax ouranalysis did not include tax liabilities arising under the surtax code.
Table 5 sets out the income tax rate in force for various years (a weightedrate is used in cases where a lower rate on a fraction of taxable income was inoperation).
Tax Reforms in I973/74
In I973/74 the rate of earned income relief was abolished and its effects wereconsolidated into the level of personal allowances and the rate of income tax.The distinction between earned mad unearned income was abolished and thetax and surtax codes anaalgamated. Thus the concept of a ’standard’ rate oftax for individuals disappeared and was replaced by a range of rates applicableat different slices o£ taxable income. The changes are discussed in more detailin Chapter 4.

Re[erences
ANDERSEN, P. S., I973. "Built in Flexibility and Sensitivi’ty of the Personal IncomeTax in D~nmark" Swedish Journal of Economics, Vol. 75, No. I, /March.
ANDO, h., and E. C. BROWN, I963. "Lags in Fiscal and Monetary Policy" in Com-mission on Money and Credit. Stabilization Policies, New Jersey : Prentice Hall.
ANDO, A., and s. GOLDFELD, ,196.8. "An Econome’tric Model for Evaluating Stabiliza-tion Policies" in A. Ando, E..C. ~Brown and A. F. Friedlander i(eds.). Studies inEconomic Stabilization, Washington D.C : The .Brookings Institution.
BALOPOULOS, ~. W., 1967. Fiscal Policy Models o[ the British Economy, Amsterdam:North-~Iolland.
BROWN, E. C. and R. J. KRUIZENOA, 1959. "Income Sensitivity of a Simple PersonalIncome Tax" Review o[ Economics and Statistics, Vol. ~I, August.
CIHOUDHRY, N. N., 1975. "A Study of the Elasticity of the West Malaysian IncomeTax System, i96I-I97o’’, International Monetary Fund. Staff Papers. Vol.XX.II, No..2, July.
CLEMENT~ 1~. O., I960. "The Quantitative Impact of Automatic Stabilizers" Reviewo[ Economics and Statistics, Vol. 42, February.
COHEN, L., 19’59. "An Empirical Measurement of the built-in flexibility of the Indi-vidual Income .Tax" American Economic Review, Vol. 49, May.
DORRINGTON, 3", 1974" "A Structural .Approach to Estimating the Built-in Flexibilityof United Kingdom .Taxes on Personal ’Income." Economic Journal, Vol. 84.September.
DOWLINO, B. R., I972. "A Note on the Effect of Income Growth and Changes inthe .Tax Rate on Consumption and Savings Ratios." The Economic and SocialReview, Vc~I. 4, No. I, October.
OOOD~, R., 1964. The Individual Income Tax, Washington I).C: The BrookingsInstitution.
HANSEN, B., I969. Fiscal Policy hz Seven Countries, 1955-1965, Paris : OECD.INTERNATIONAL MONF.TARY FUND, 1975. Staff Papers. Vol. XX,II, No. 2, July.KF, LLEH~R, R., I976. Tax Relationships in Ireland, 1953 to 1973, Dublin: Central
Bank of Ireland Research Paper ,(unpublished).KENNEDY, K. A., and B. m DOWLINO, 1975. Economic Growth in Ireland: The Ex-
perience Since x947. Dublin : Gill and MacMillan.LENNAN, L. K., I9,72. "The Flexibility of Irish Taxes on :I.ncome" in A. A. Talt and
J. A. Bdstow ,(eds.) Ireland: some problems o[ a Developing Economy, Dublin :Gill a~d MacMillan, and New York : Barnes & Noble.
LEWIS, W., 1962. Federal Fiscal Policies in the Post War Recessions, WashingtonDC : The Brookings Institution.
MCALEES~, D., I970. A Study of Demand Elasticities for Irish Imports Dublin:T̄he Economic and Social Research Institute, Paper ~o. 53.
MORAW~TZ, D., 197I. "The Yield of Personal Income Tax," Economic Journal,8i, September.
81

THE ECONOMIC AND SOCIAL RESEARCH INSTITUTE
References--continued
,~IUSORAVE, R. A., and 1,. 9. MUS.ORAVE, I95.8. "Fiscal Policy" ’in R.. ,E. iCaves (ed.)Britain’s Economic Prospects. ~Washington T)C : tThe Brookings Institution.
1,EARSE, P. H., 1962. "~_u’tomatic Stabilization and ;British Taxes on .Income." Re-view o[ Economic Studies, Vol. 29, No. 2.
1,ECIIMAN, J., "I973. "Responsiveness of the ,Federal tIncome .Tax .to Changes inIncome" Brookings Papers on Economic Activity, 2.
t’EN, J., I97I. Income Distribution, London: tA,11en Lane, The Penguin Press.i, wraEI, A. H., 1975. "Inflation ,Adjustment Schemes under the .Personal Income
Tax" International/Monetary ,Fund, Staff Papers, Vol. XX.H, No./2, July.PREST, A. R., I962. ".The Sensitivity of the Y, ield of Personal Income Tax in the¯ - m"United Klngdo Economic Journal, 62, Sept.iu~:xso~, L., 1960/61. ",Estimates of the .Distribution of Non-Agricultural .Incomes
and tim .Incidence of Certain Taxes" Journal of the Statistical and Social InquirySociety, Vol. XX, pt. IV.
s’rAI~K, W., .1972.. The Distribution of Personal lncome in the United Kingdom,r949-x964, London : ,Cambridge University ,Press.
"russlNG, A. D., .1976. ’~The ’CU:B’ ,Budget as a measure of Fiscal ~Policy" QuarterlyEconomic Commentary. The Economic and Social ,Research Institute, January.
WALSH, n. ~., ’1974" ’~Income Maintenance .Payments in Ireland, 195,3~I971:Cyolical Variations and ,Long Term Growth" The Economic and Social Review,Vol. 5, No. 2, January.