Characterization of the Rocky Intertidal Ecological Communities ...
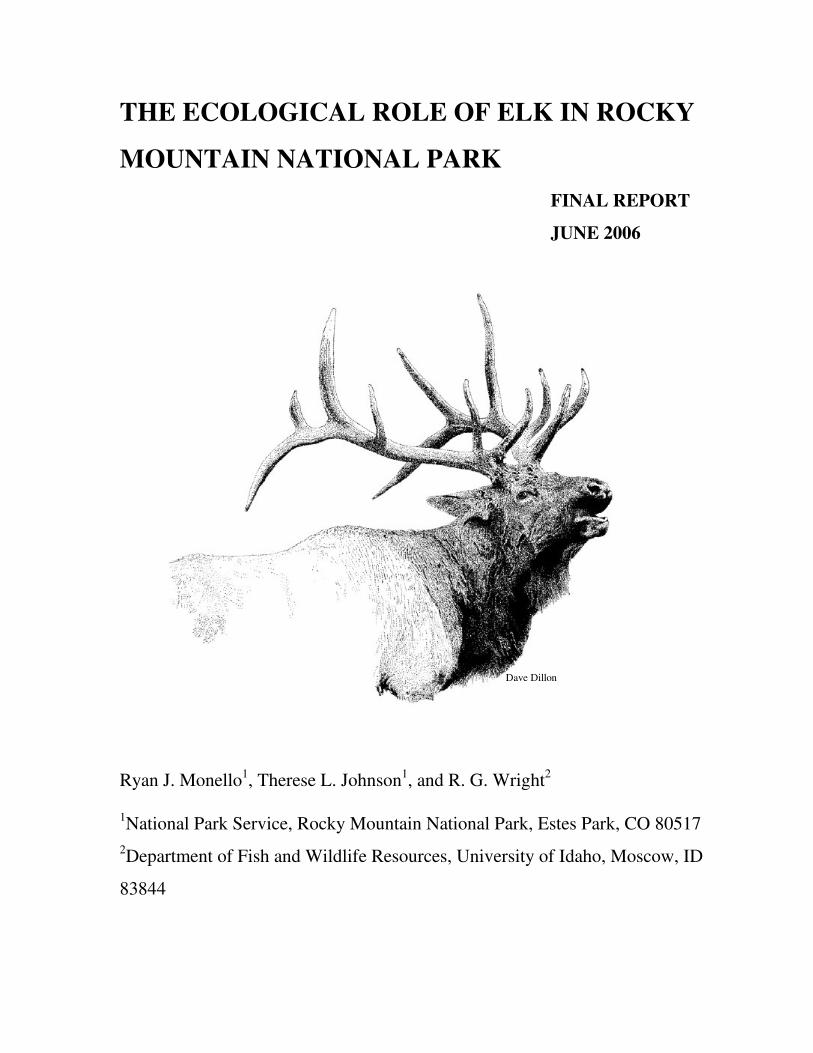
THE ECOLOGICAL ROLE OF ELK IN ROCKY
MOUNTAIN NATIONAL PARK
FINAL REPORT
JUNE 2006
Ryan J. Monello1, Therese L. Johnson
1, and R. G. Wright
2
1National Park Service, Rocky Mountain National Park, Estes Park, CO 80517
2Department of Fish and Wildlife Resources, University of Idaho, Moscow, ID
83844
Dave Dillon
i
TABLE OF CONTENTS
Introduction........................................................................................................................... 1
Physical and Biological Characteristics of the Park ............................................................. 2
Human History of the Region ............................................................................................... 7
Summary ........................................................................................................................... 9
The Elk Population: Historical Information and Contemporary Research ......................... 10
Introduction – Elk Population Indices and Models......................................................... 10
Ecological Carrying Capacity (K)............................................................................... 10
Ecosystem Simulation Model (SAVANNA) .............................................................. 10
Statistical Differences ................................................................................................. 11
Pre-Settlement Conditions .............................................................................................. 11
Early Management (1915 – 1968)................................................................................... 12
Natural Regulation .......................................................................................................... 17
Science-Based Management ........................................................................................... 18
Elk Research (1968 – present) ........................................................................................ 19
Elk Distribution and Movements ................................................................................ 19
Elk Population Dynamics............................................................................................ 23
Elk Densities ............................................................................................................... 26
Elk Survival ................................................................................................................ 27
Chronic Wasting Disease............................................................................................ 27
Summary ......................................................................................................................... 28
Focal Plant Communities.................................................................................................... 28
Aspen .............................................................................................................................. 28
Aspen Ecology ............................................................................................................ 28
Aspen in RMNP.......................................................................................................... 29
Willow ............................................................................................................................ 32
Willow Ecology .......................................................................................................... 32
Willow in RMNP........................................................................................................ 32
Willow Distribution in RMNP.................................................................................... 34
Willow Growth and Size in RMNP ............................................................................ 35
ii
TABLE OF CONTENTS
Willow Reproduction in RMNP ................................................................................. 36
Bitterbrush and Sagebrush .............................................................................................. 37
Bitterbrush and Sagebrush Ecology............................................................................ 37
Bitterbrush and Sagebrush in RMNP.......................................................................... 38
Herbaceous Communities on the Winter Range............................................................. 38
Coniferous Forest Communities in RMNP..................................................................... 40
Alpine Tundra ................................................................................................................. 41
Summary ......................................................................................................................... 41
Ungulate Interactions .......................................................................................................... 43
Mule Deer ....................................................................................................................... 43
Competition with Elk.................................................................................................. 45
Chronic Wasting Disease............................................................................................ 45
Bighorn Sheep................................................................................................................. 46
Competition with Elk.................................................................................................. 46
Moose.............................................................................................................................. 47
Summary ......................................................................................................................... 47
Effects of Elk on Biodiversity............................................................................................. 48
Birds................................................................................................................................ 48
Ptarmigan .................................................................................................................... 48
Songbirds .................................................................................................................... 49
Butterflies........................................................................................................................ 50
Beaver ............................................................................................................................. 50
Beaver Ecology ........................................................................................................... 50
Beaver in RMNP......................................................................................................... 51
Summary ......................................................................................................................... 52
Nutrient Cycles ................................................................................................................... 52
Conclusions......................................................................................................................... 53
Literature Cited ................................................................................................................... 56
iii
LIST OF FIGURES
Figure 1. Land ownership adjacent to and near Rocky Mountain 3
National Park.
Figure 2. Elevation (in feet) and major vegetation covertypes of 4
Rocky Mountain National Park.
Figure 3. Elk ranges in Rocky Mountain National Park and vicinity. 5
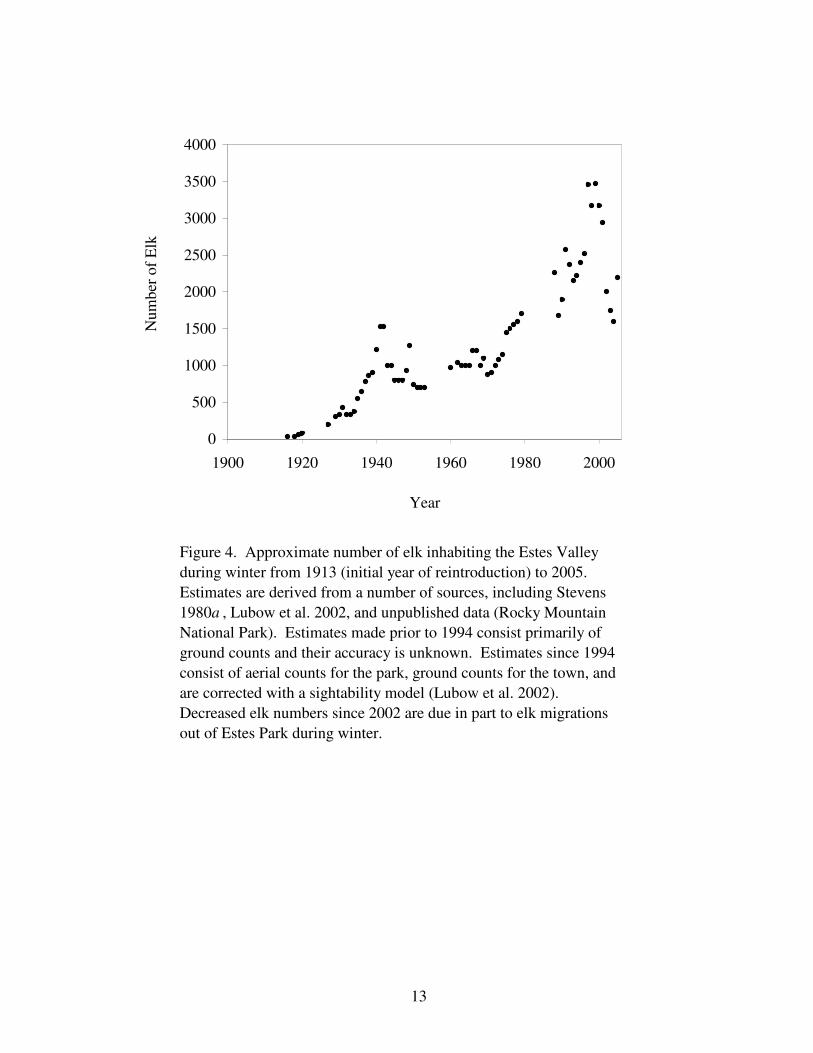
Figure 4. Approximate number of elk inhabiting the Estes Valley 13
during winter from 1913 (initial year of reintroduction)
To 2005.
Figure 5. Approximate deer population size in the Estes Valley 15
during winter from 1915 to 2003.
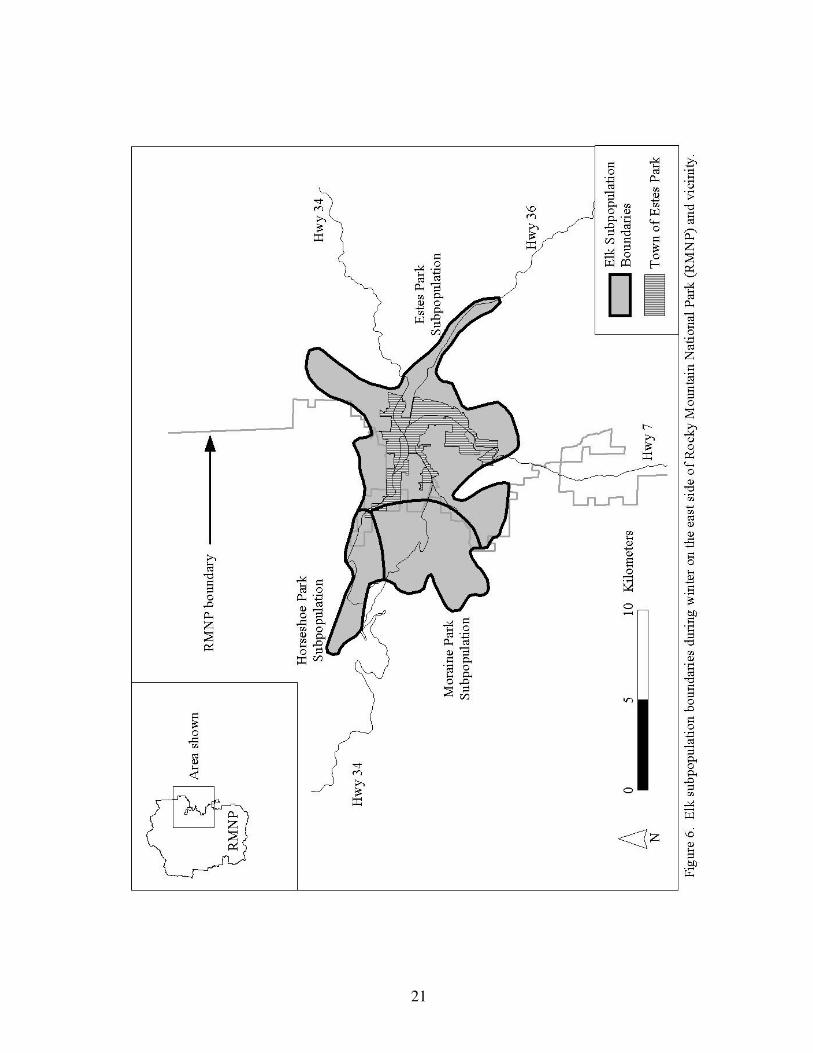
Figure 6. Elk subpopulation boundaries during winter on the east 21
side of Rocky Mountain National Park and vicinity.
Figure 7. Elk migration routes and major stream drainages in the 22
Rocky Mountain National Park area.
Figure 8. Elk population dynamics (five-year moving average) in 24
Rocky Mountain National Park and the Town
of Estes Park.
Figure 9. Woody shrub distribution on the elk winter range in 33
Rocky Mountain National Park.
Figure 10. Primary areas of use for moose, bighorn sheep, and mule 44
deer in Rocky Mountain National Park.
APPENDIX
Appendix 1. Common plant species found in Rocky Mountain National 72
Park covertypes.
1
INTRODUCTION
Many national parks and equivalent protected areas in North America have experienced
substantial increases in the numbers of several species of large grazing and browsing
herbivores in the past several decades - numbers that are now considered by many managers
and scientists to exceed levels that have existed at any time since the arrival of European
colonists (Wright 1992). There is a great deal of scientific debate over the extent of this
increase, in part because there is still considerable argument on how to obtain accurate counts
of existing herbivore populations let alone how to ascertain the validity of historic counts
(Buckland et al. 1993). The reasons for the increases in species such as Rocky Mountain elk
(Cervus elaphus), white-tailed deer (Odocoileus virginianus), and to a lesser extent bison
(Bison bison) are varied but largely come down to two causes; the almost complete
elimination of a major herbivore predator the gray wolf (Canus lupus) and the prohibition of
human harvest of wildlife in protected areas. Concerns about increased numbers of large
herbivores have primarily evolved around the potential adverse effects that the high densities
of these animals could be having on native vegetation, other animal species, and ecosystem
properties in general. We refer to densities of animals perceived to be at numbers or densities
that may be detrimental to the components of the natural system as overabundant,
recognizing, as McShea et al. (1997) point out, that this concept is a value judgement having
a clear meaning only when used in a specific context.
Caughley (1981) discussed four situations where the term overabundance could be applied to
animal populations and all have been used in North America to support the argument that
populations of certain herbivore species were overabundant. These situations are: 1) when
animals threaten human life and livelihood; 2) when the animals depress the densities of
favored species; 3) when the animals are considered to be too numerous for their own good;
and 4) when their high numbers are deemed to cause ecosystem dysfunction. For many years,
the National Park Service (NPS) culled large ungulates, primarily antelope (Antilocapra
americana), bison, elk, and mule deer (Odocoileus hemionus) in several western parks and
more recently white-tailed deer in an eastern area, largely because of concerns associated
with reason number three (Robish and Wright 1995, Frost et al.1997). In general, the typical
stated concern was that animals would destroy their food supply and starve. In reality there
was also a concern that visitors would see starving or dying animals and react negatively
(Wright 1992). In recent years the scientists within and working with the NPS have begun to
appreciate Caughley’s fourth point with particular attention given to the decline of
ecologically important vegetation communities such as aspen and willow in the case of elk
use, and rare plants and breeding bird species in the case of white-tailed deer.
This report originated because of the long-term concerns about whether the population of elk
in Rocky Mountain National Park (RMNP) is overabundant. We recognize that this is not the
first time this issue has been raised at RMNP. In fact, concerns about elk numbers in the park
have existed since the 1930s and have been addressed by many - albeit short term -
management programs over the intervening years. However, this is the first time a
comprehensive review of this issue has been conducted. The objectives of this report are to:
1) present the great wealth of information, both historical and contemporary, that has been
2
gathered on the elk population in the park and Estes Park area in the past 70+ years; 2)
summarize the research that has been conducted on the effects of elk on plant communities
and other animal populations in and around the park; and 3) determine if elk population
dynamics and their effects deviate from that expected under natural conditions.
PHYSICAL AND BIOLOGICAL CHARACTERISTICS OF THE PARK
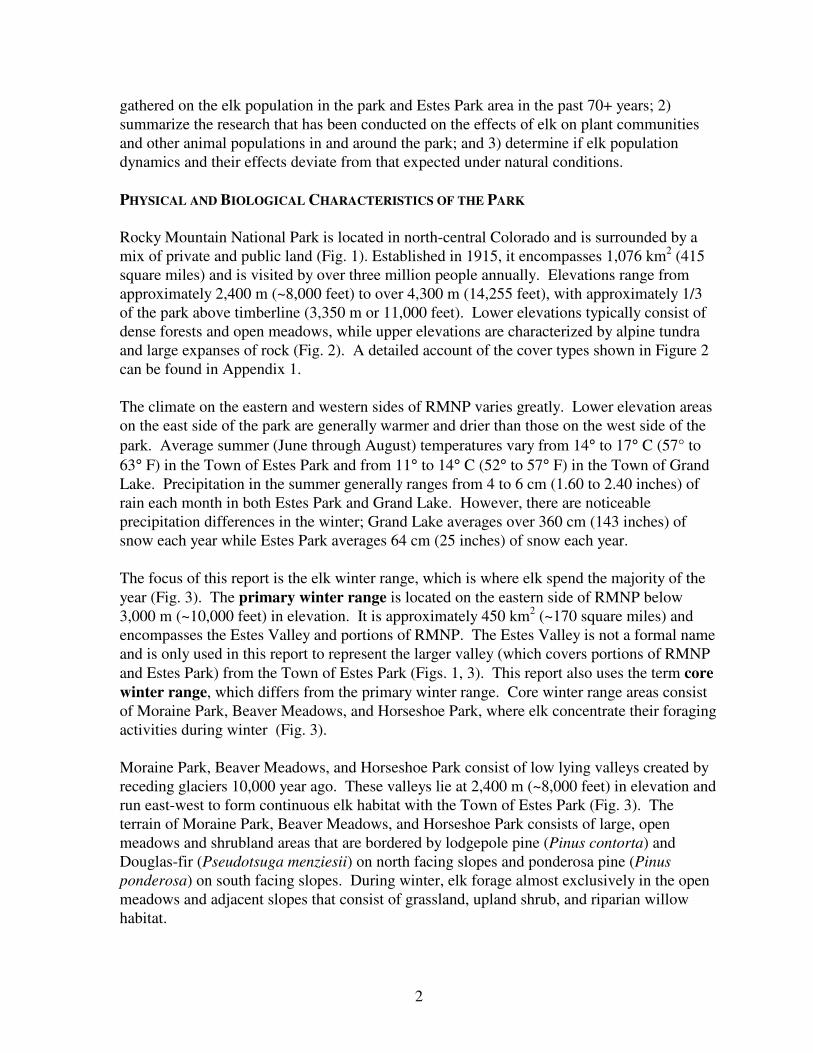
Rocky Mountain National Park is located in north-central Colorado and is surrounded by a
mix of private and public land (Fig. 1). Established in 1915, it encompasses 1,076 km2 (415
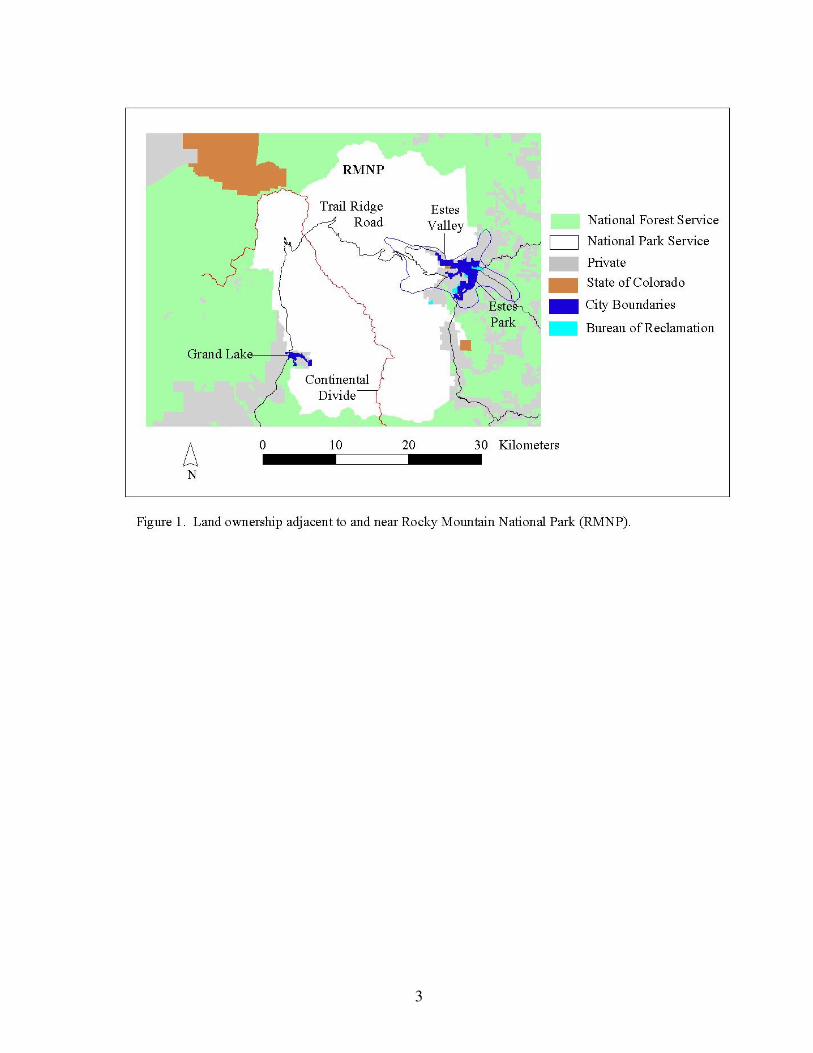
square miles) and is visited by over three million people annually. Elevations range from
approximately 2,400 m (~8,000 feet) to over 4,300 m (14,255 feet), with approximately 1/3
of the park above timberline (3,350 m or 11,000 feet). Lower elevations typically consist of
dense forests and open meadows, while upper elevations are characterized by alpine tundra
and large expanses of rock (Fig. 2). A detailed account of the cover types shown in Figure 2
can be found in Appendix 1.
The climate on the eastern and western sides of RMNP varies greatly. Lower elevation areas
on the east side of the park are generally warmer and drier than those on the west side of the
park. Average summer (June through August) temperatures vary from 14° to 17° C (57° to
63° F) in the Town of Estes Park and from 11° to 14° C (52° to 57° F) in the Town of Grand
Lake. Precipitation in the summer generally ranges from 4 to 6 cm (1.60 to 2.40 inches) of
rain each month in both Estes Park and Grand Lake. However, there are noticeable
precipitation differences in the winter; Grand Lake averages over 360 cm (143 inches) of
snow each year while Estes Park averages 64 cm (25 inches) of snow each year.
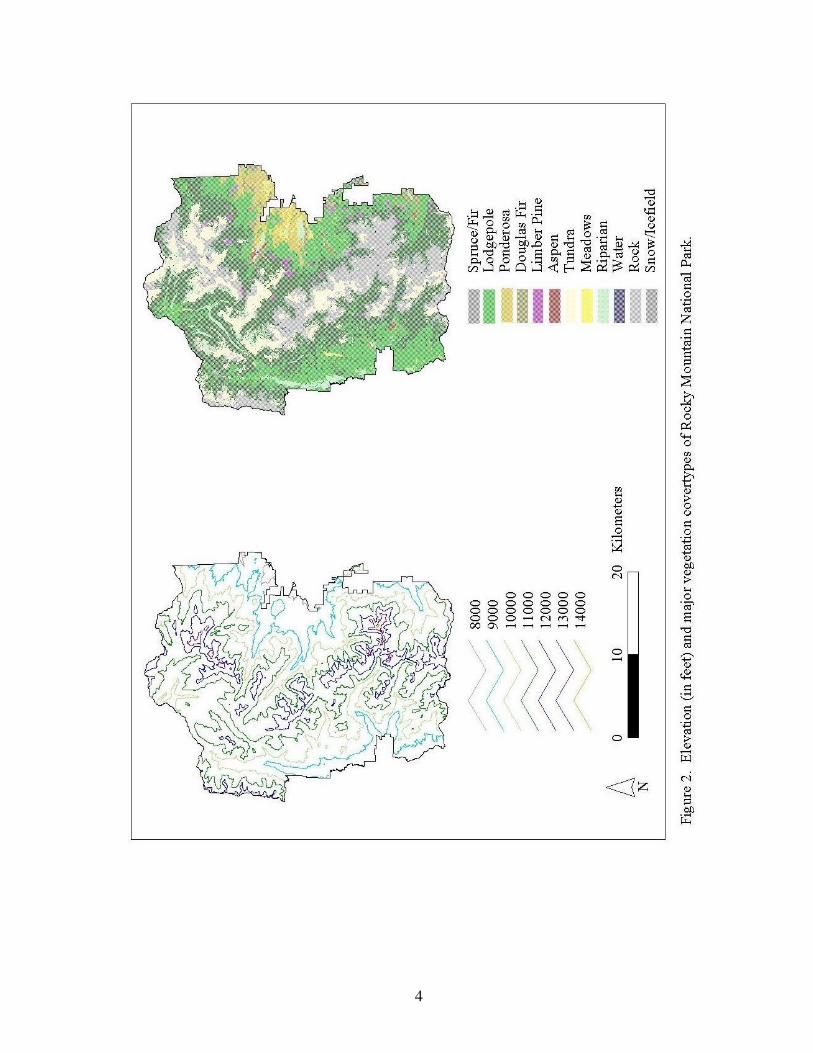
The focus of this report is the elk winter range, which is where elk spend the majority of the
year (Fig. 3). The primary winter range is located on the eastern side of RMNP below
3,000 m (~10,000 feet) in elevation. It is approximately 450 km2 (~170 square miles) and
encompasses the Estes Valley and portions of RMNP. The Estes Valley is not a formal name
and is only used in this report to represent the larger valley (which covers portions of RMNP
and Estes Park) from the Town of Estes Park (Figs. 1, 3). This report also uses the term core
winter range, which differs from the primary winter range. Core winter range areas consist
of Moraine Park, Beaver Meadows, and Horseshoe Park, where elk concentrate their foraging
activities during winter (Fig. 3).
Moraine Park, Beaver Meadows, and Horseshoe Park consist of low lying valleys created by
receding glaciers 10,000 year ago. These valleys lie at 2,400 m (~8,000 feet) in elevation and
run east-west to form continuous elk habitat with the Town of Estes Park (Fig. 3). The
terrain of Moraine Park, Beaver Meadows, and Horseshoe Park consists of large, open
meadows and shrubland areas that are bordered by lodgepole pine (Pinus contorta) and
Douglas-fir (Pseudotsuga menziesii) on north facing slopes and ponderosa pine (Pinus
ponderosa) on south facing slopes. During winter, elk forage almost exclusively in the open
meadows and adjacent slopes that consist of grassland, upland shrub, and riparian willow
habitat.
3
4
5
6
The morphology and vegetation in and around the valley floors of Moraine Park, Beaver
Meadows, and Horseshoe Park is very similar. Each has a branching river that runs through
the valley floor and is bordered by riparian shrubs and mesic grasslands. Dry grasslands
occur on the valley floors away from the rivers, where water tables are typically lower. On
south facing slopes with <40% canopy cover of Ponderosa pine, upland shrubs tend to
dominate. Scattered stands of aspen (Populus tremuloides Michx.) are found throughout the
dry grassland and upland shrub areas. The valley floors and upland shrub areas make up
almost 1,300 ha (3,200 acres) of winter range within the park. Of this, approximately 36%
can be classified as riparian shrubs and mesic grasslands, 32% as dry or upland grasslands,
and 11% as upland shrub areas.
Common riparian shrub species found in these areas include mountain willow (Salix
monticola), flat-leaved willow (S. planifolia), Geyer willow (S. Geyeriana), mountain birch
(Betula occidentalis), and alder (Alnus tenuifolia). Mesic grasslands and the understory of
willow and birch communities consist of Canadian reed grass (Calamagrostis canadensis),
sedges (Carex spp.), smooth brome (Bromus inermis), Kentucky bluegrass (Poa pratensis),
timothy (Phleum pratense), cow parsnip (Heracleum sphondylium), and golden banner
(Thermopsis divaricarpa). Dry grasslands are made up of a variety of grasses (Agropyron
spp.) and sedges (Carex spp.), timber oatgrass (Danthonia intermedia), Parry’s oatgrass
(Danthonia parryi), and long-haired needlegrass (Stipa comata). Upland shrub areas consist
of antelope bitterbrush (Purshia tridentata), big sagebrush (Artemisia tridentata), rabbitbrush
(Chrysothamnus viscidiflorus), blue grama (Bouteloua gracilis), and mountain muhly
(Muhlenbergia montana) (Stevens 1980a). Elk diets on the park winter range from fall to
spring primarily consist of graminoids (58-76%), willows (8-16%), upland shrubs (0-13%),
pine trees (0-12%%), forbs (0-7%), and aspen (0-7%) (Singer et al. 2002; see also Hobbs et
al. 1981).
The Town of Estes Park lies within the primary winter range and has similar plant species as
found in the park, but has more extensive grasslands, two golf-courses that are fertilized and
irrigated, and is slightly lower in elevation. Elk are able to freely use these winter range areas
because they have habituated to human activities. Elk diets during winter have not been
investigated in the town area.
The majority of elk (75-90%) spend summer and early fall on the western side of the
Continental Divide (in the Kawuneeche Valley) or the higher elevations in RMNP (Figs. 2,
3). The Kawuneeche Valley is centered around the Colorado River and has extensive wet
meadow areas surrounded by lodgepole pine. Vegetation in the Kawuneeche Valley is
similar to Moraine Park and Horseshoe Park; however, winter use by elk is minimal in
comparison to the east side, due to greater snowfall.
Alpine tundra provides the other principal summer range for elk. There are over 134 km2 (50
square miles) of alpine tundra in the park and elk use ~39% of it from June until October
(Figs. 2, 3). Tundra vegetation has been described by Kiener (1939), Griggs (1956), and
Willard (1963), which Stevens (1980b) summarizes into the following types: fellfields
covered by cushion plants (e.g., mosses); alpine turf and alpine marsh, both primarily
7
composed of sedges and wildflowers; snowbed, characterized by rushes, grasses, and
wildflowers; and riparian willow areas. The distribution of these plant associations is
primarily determined by physiography, snow accumulation, moisture availability, exposure,
temperature, and substrate (Kiener 1939, Griggs 1956, Willard 1963, Stevens 1980b). A
detailed list of plant species and communities found in the alpine tundra and other vegetation
communities of RMNP can be found in Appendix 1.
HUMAN HISTORY OF THE REGION
Humans have played a role in the RMNP area for thousands of years by harvesting plants and
animals, and more recently by development, fire suppression, haying, logging, market
hunting, predator control, ranching, recreational activities, and water diversions. The effects
of many of these past and current human activities are just now being fully realized by
researchers and cannot be discounted when considering such issues as elk and vegetation
interactions.
Little is known about the first humans to spend time in RMNP. Clovis spear points indicate
prehistoric people were in the area immediately after the last glaciers receded about 10,000
years ago (Butler 1997). The Ute Indians have been the most consistent users of the park and
probably have been in Colorado for at least 7,000 years. Although moved to reservations in
Utah and southwestern Colorado in 1868, they continued to use the park on a sporadic basis
until the late 1800s. Archeological evidence also indicates that the Apache were in the park
and surrounding mountains by about 1500, and were known to be in the area in the early
1800s (Toll 1962, Brunswig 2001, Brunswig and Doerner 2001). The Arapaho arrived in the
area in the late 1700s or early 1800s and numerous battles are recorded between them and the
Apache and Ute for the plants and animal resources in the park (Toll 1962). Due to the harsh
winter conditions of the mountains, hunters and gatherers from prehistoric and early historic
times only used RMNP seasonally from late spring to early fall (Benedict 1992, Butler 1997).
The only known ethnographic account of Native American use of the park prior to European
American settlement in 1860 is Arapaho Names and Trails: A Report of a 1914 Pack Trip
(Toll 1962). The Arapaho indicate that the area was a “game bag” where bison, elk, and deer
were hunted, but little information exists to indicate how consistent their use was or what
their effect on animal populations might have been. Information on Ute or Apache use of the
area is non-existent except for the archeological record. Unfortunately, the highly acidic and
basic soils (depending on parent rock origin) in the area do not allow for the long-term
preservation (>200 years) of animal bone in archeological sites through which quantification
by species can be made (B. Butler personal communication).
Some of the earliest evidence of consistent seasonal use of the park are rock game drives and
associated ambush pits. These drives and pits date from about 7,000 years ago until the
Native Americans acquired horses in the late 1700s. Game drives were typically built above
treeline and consisted of rock walls arranged as a funnel that allowed humans on foot to herd
animals towards hunters hiding behind rock blinds or in ambush pits (Benedict 1996). It is
unknown how effective game drives were, but it is clear that they were used almost
8
exclusively for elk, and that some of the largest game drive systems in the southern Rocky
Mountains are located in the park (Benedict 1996). Benedict (1996) estimates that the largest
complex in the park would have required about 50 people to operate, indicating that a
substantial amount of elk may have been harvested from these drives. However, it is
impossible to determine a numerical range or frequency of such harvests. There are at least
six rock game drives in the park, and 51 have been recorded just south of the park in the
Indian Peaks Wilderness (Cassells 1995).
High altitude game drives are only one source of obtaining meat, and it is worth noting that
the atlatal and bow and arrow were used for thousands of years throughout the area,
especially in the trees and meadows at lower elevations. Thus, although many animals might
be acquired in a single game drive, the animals obtained via bow and arrow may have
accounted for the majority of animals harvested throughout an entire season (B. Butler
personal communication).
Bison were present in RMNP during the 18th and 19th centuries, but there is no evidence to
indicate if they were present prior to these times. Toll (1962) notes that by the time the area
was settled the Arapaho had moved north to hunt bison because none were left in the RMNP
area. Fryxell (1928) documents numerous accounts of bison remains in and around the park,
such as a large cache of bison skulls found along the current day Devil’s Gulch Road.
Fryxell (1928) also recounts Oliver Toll’s 1913 trip with two Arapaho elders, during which
the Arapaho described numerous bison hunting grounds they used in the mid-1800s. These
areas included locations in Estes Park (e.g., near Mount Olympus), RMNP (e.g., Thatchtop
Mountain), and Grand Lake. However, it is unknown how many bison inhabited the RMNP
area or what their migration patterns were like.
The first permanent settlers in Estes Park was the Estes Family, who moved to the area in
1860. Initially, the Estes family and other settlers made a living by market hunting and
ranching. These activities resulted in the extirpation of elk by 1880 (Sprague 1925,
Buchholtz 1983) and likely resulted in large changes to current elk winter range areas. Gray
wolves and grizzly bears (Ursus arctos horribilis), once commonly observed in the area,
were noted to be gone by the early 1900s (Sprague 1925, Estes 1939, Stevens 1980a,
Buchholtz 1983). All of the core winter range areas on the east side of the park (Moraine
Park, Beaver Meadows, and Horseshoe Park) were intensively grazed by livestock, hayed,
and developed by the late 1800s (Estes 1939, Buchholtz 1983). With the loss of elk,
difficulties associated with ranching in the area, and eventual creation of RMNP in 1915, the
primary source of income for the area turned from hunting and ranching to tourism related
activities. Ranchers began operating lodges and opportunities such as climbing Longs Peak
attracted visitors from around the world. Settlement of the area resulted in groups such as the
Estes Park Protective and Improvement Association who, in conjunction with the U.S. Forest
Service, reintroduced 28 elk to Estes Park in 1913-14.
Settlement on the west side of the park in the Kawuneeche Valley paralleled that on the east
with unsuccessful mining (1879-1884) and ranching operations giving way to tourism and
resorts by the time the park was established. Although the Kawuneeche Valley today
9
contains some relatively large riparian areas, it is unknown what conditions were like prior to
European American settlement. The Grand Ditch (created in 1895) diverts 30% (10 m3/s or
360 cfs) of the total annual runoff from the upper Colorado River watershed and has likely
contributed to a much drier meadow-like environment than that which historically occurred
in the valley (Cooper et al. 2000). An oral history interview indicates that much of the area
from Grand Lake north to the Holzwarth Never Summer Ranch was cleared of trees in the
late 1800s to produce open areas to raise grass for cattle and horses. Areas to the west of the
park, in particular Middle Park and North Park, seem to have been preferred by Native
Americans for hunting over the Kawuneeche Valley due to the numerous large herds of
bison, antelope, and elk found throughout these areas (B. Butler personal communication).
Settlement of the RMNP area appears to have also caused an increase in fire frequency during
the 1800s, followed by a large decrease during the 20th
century. Veblen et al. (2000),
working in areas adjacent to the park, found fire frequency increased dramatically during the
19th
century due to a dry climate and settlement activities such as mining. Since the early
1900s, however, fire suppression efforts in the area have been widespread, with varying
levels of effectiveness (e.g., Veblen et al. 2000, Sherrif et al. 2001). Historic photos from
RMNP and the surrounding area indicate lower elevation forests, consisting primarily of
ponderosa pine (Pinus ponderosa), were much more sparse in the 1800s compared to current
day conditions (Veblen and Lorenz 1991).
Today, tourism related activities remain the primary source of income in the towns of Estes
Park and Grand Lake (U.S. Census Bureau 2001). Development has also increased
dramatically during the last 20 years, and there are now over 10,000 residents in and around
Estes Park. Current zoning indicates Estes Park is 45% developed (year 2000 estimate), and
building projections indicate build-out will be reached in approximately 40 years (Hobbs et
al. 2003). Likewise, considerable development can be found just outside the park’s
boundaries in the Grand Lake area.
Summary
There is little information to indicate what conditions might have been like when Native
Americans inhabited the park or when settlers arrived. Elk were noted to be plentiful and
wolves and grizzly bears were often seen in the area, but there is no specific information on
animal abundance or vegetation conditions. It is clear, however, that humans have
historically and will continue to play a large role in the RMNP ecosystem. Native Americans
used the area seasonally and hunted elk extensively, but the size or consistency of their
harvests are unknown. Settlement had a dramatic influence on the area by eliminating the
major predators and elk from the RMNP area, and later reintroducing elk and developing
homes and ranches on the east and west sides of the park.
10
THE ELK POPULATION: HISTORICAL INFORMATION AND CONTEMPORARY RESEARCH
Introduction – Elk Population Indices and Models
This report uses various indices and models to describe elk population dynamics and their
effects on vegetation. This section provides definitions for terms and a summary of an
ecosystem simulation model frequently referred to in this report.
Ecological Carrying Capacity (K) – Various definitions of carrying capacity exist in the
scientific literature. This report uses the concept and definition of ecological carrying
capacity (also referred to as K), defined as the level at which the elk population is limited by
the forage base of a given area (Caughley 1976). The elk population is considered to be at K
when there is a long-term stability of elk numbers and vegetation biomass on the winter
range. Ecological carrying capacity can also be thought of to represent the largest number of
elk that can be supported by the winter range and it does not consider the potential effect of
predators that have been extirpated. Wolves may or may not limit elk at some level below K.
Estimates of K for winter range areas in RMNP and the Estes Valley have been made using
several methods. These include 1) measuring annual forage biomass and energy
requirements of herbivores to calculate the number of elk that can be supported by the winter
range; 2) fitting a population model to elk survey data to determine if the elk numbers exhibit
long-term stability (>10 years); and 3) using an ecosystem simulation model that incorporates
plant and soil responses to herbivory, elk population dynamics, and weather to estimate the
total number of elk that can be supported over a long-term time frame. Results from all of
these methods are presented and discussed below.
Estimates of K vary annually and over longer time frames because the winter range forage
base is largely dependent on annual precipitation. Elk numbers do not correspond exactly to
such estimates because they are long lived animals and their population responses can be
delayed and are also affected by winter severity, human harvest, and predation. Despite such
variations, elk population dynamics and estimates of K are valuable tools for managers
because they provide benchmarks to describe research results and management goals.
Ecosystem Simulation Model (SAVANNA) – Numerous results in this report refer to an
ecosystem simulation model called SAVANNA (Coughenour 2002). This model was
originally developed for studies of African grasslands and has been used in western U.S. and
Canadian national parks as an ecosystem management tool where ungulates and their
interactions with plants are a principal concern. The model is unique because it represents
linkages between plant production and population processes, as well as between ungulate
energy balance and their population processes. SAVANNA was parameterized for RMNP to
provide an objective tool to evaluate historic, current, and future elk and vegetation
conditions under different management scenarios. The following is a description of the
model taken from Coughenour (2002):
11
SAVANNA is a spatially explicit, process-oriented model of grassland, shrubland,
savanna, and forested ecosystems developed originally for studies in East Africa. The
model has been applied to Elk Island National Park in Alberta, the Pryor Mountain
Wild Horse Range, northern Australia, South Africa, and Tanzania. SAVANNA
simulates processes at landscape through regional spatial scales over annual to
decadal time scales. The model is composed of site water balance, plant biomass
production, plant population dynamics, litter decomposition and nitrogen cycling,
ungulate herbivory, ungulate spatial distribution, ungulate energy balance, and
ungulate population dynamics submodels. A wolf predation and wolf population
dynamics submodel were derived from a model used to assess wolf reintroduction
into Yellowstone National Park.
The model was used to represent plant and soil responses to varying levels of herbivory, food
limitation of the herbivore population, and predation. The model was based on a single
vegetation map that included RMNP, Estes Park, and Arapahoe-Roosevelt National Forest.
Simulated elk populations took into consideration the number of elk removed by hunter
harvest. SAVANNA evaluated elk dynamics and vegetation conditions under a variety of
ecological and management scenarios, most notably:
Undisturbed model simulations – includes wolves, undisturbed vegetation and water
table levels (both estimated with historic photos), and weather data from 1775-1909.
Current model simulations – current vegetation and water table levels and weather
values from 1949-1998. These simulations were done with and without elk
management reductions and/or wolves to evaluate interactions between elk dynamics,
vegetation conditions, and predators.
Future model simulations – current vegetation and water table levels and stochastic
(random) weather patterns from 1949-1998. Future model simulations were done
with and without elk management reductions, wolves, and/or fencing on the winter
range to estimate the effects of various management options.
Statistical Differences – This report often refers to significant differences due to elk
herbivory (e.g., vegetation production inside versus outside exclosures) or other factors.
Unless otherwise noted, all differences reported in this report are statistically different using
an alpha value of 0.05.
Pre-Settlement Conditions
It is clear that elk were numerous in the Estes Valley prior to settlement by European
colonists, but there is no information on the magnitude of the population. The first permanent
settlers in the Estes Valley were the Estes family, who arrived in 1860 and noted an
abundance of elk and deer, but did not provide any population estimates. Estes (1939) wrote:
“One fall and winter the writer killed one hundred head of elk, besides other game, such as
mountain sheep, deer, and antelope. By this time [1863] we had made a trail to Denver,
where we sold many dressed skins and many hindquarters of deer, elk and sheep”. Market
12
hunting in the Estes Valley did not end until the late 1870s when elk had been eliminated, or
nearly so, from the area. Abner Sprague, one of the first settlers in Moraine Park, described
the decline: “Our [elk] only lasted about three years. They came down from their high range
just before Christmas, 1875, by the thousands and were met by hunters with repeating rifles
and four horse teams; hauled to Denver for three or four cents per pound. In 1876 fewer
came down; in [18]77 very few were seen on [the east] side of the divide. In 1878 I killed my
last elk, and to get him had to go over Flat Top [Mountain]” (Sprague 1925). This was the
last recorded kill of an elk during the 1800s, but it is impossible to determine the accuracy of
Sprague’s statement that there were of “thousands of elk”. It is clear, however, when Estes’s
first-hand accounts are also considered, that elk were indeed abundant but were extirpated (or
nearly so) from the Estes Valley by 1880. No viable population existed again until elk were
reintroduced in 1913-14.
SAVANNA simulated pre-settlement scenarios with and without wolves. When wolves were
present, the total elk population size fluctuated between 1,500 and 3,500 animals.
Fluctuations in elk numbers were due to a tri-trophic equilibrium between elk, plants, and
wolves (Coughenour 2002). In time periods with more plant biomass there were more elk,
but the population was still limited by wolves.
A pre-settlement scenario without wolves was also examined to determine the role of wolves
in elk population dynamics. Without wolves, elk were found to increase to approximately
3,800 animals and then exhibit a long-term decline in numbers due to deteriorating forage
conditions. With no wolves present the elk population size was only limited by available
food resources. This can also be thought of as a bi-trophic equilibrium between elk and
plants (versus the tri-trophic equilibrium above). Coughenour (2002) concluded that wolves
limited the elk population size to 15-40% below their food limited carrying capacity. Elk in
the presence of wolves also maintained a higher body condition than those without wolves.
Although it has been suggested that elk from the park migrated to the plains during winter
(Clarke et al. 1994), there is no evidence for this assertion. Estes (1939), referring to animal
migrations during the 1860s, stated “winter drove all the game down to the foothills, except
the elk, they would remain in the park [referring to the Estes Valley] until summer, then they
went up over the range or mountains”. Within RMNP, the comparison of historic game
drives and current elk migration patterns suggests elk use the same routes today as they did
historically (Benedict 1996, Larkins 1997).
Early Management (1915 – 1968)
Twenty-eight elk were reintroduced into the Estes Valley in 1913-14 by the U.S. Forest
Service and Estes Valley Improvement Association. No hunting was allowed in or near the
Estes Valley until 1939 and, along with the creation of RMNP in 1915, the population
quickly grew from 30 animals in 1915 to approximately 350 animals by 1930 (Stevens
1980a; Fig. 4). Concern about the size of the population first arose in the early 1930s
because elk started eating the bark of live aspen trees (McLaughlin 1931 cited in Guse 1966).
Wright et al. (1933) concluded this was an indication that “the elk herd was reaching the limit
13
0
500
1000
1500
2000
2500
3000
3500
4000
1900 1920 1940 1960 1980 2000
Year
Nu
mb
er o
f E
lk
Figure 4. Approximate number of elk inhabiting the Estes Valley
during winter from 1913 (initial year of reintroduction) to 2005.
Estimates are derived from a number of sources, including Stevens
1980a , Lubow et al. 2002, and unpublished data (Rocky Mountain
National Park). Estimates made prior to 1994 consist primarily of
ground counts and their accuracy is unknown. Estimates since 1994
consist of aerial counts for the park, ground counts for the town, and
are corrected with a sightability model (Lubow et al. 2002).
Decreased elk numbers since 2002 are due in part to elk migrations
out of Estes Park during winter.
14
of its food supply and that range abuse and starvation were in the offing”. Wright et al.
(1933) suggested that a major cause of such effects was that the most important elk winter
range areas were privately owned (e.g., Beaver Meadows). These areas were heavily grazed
by cattle and horses during the summer, leaving little forage for elk in the winter. To remedy
the situation, the park purchased over 12 km2 (~5 square miles) of private land in core elk
winter range areas (i.e., low lying areas of Moraine Park, Beaver Meadows, and Horseshoe
Park) in 1932 (Ratcliff 1941a).1 No other immediate actions were recommended in favor of
studying the effect of these new areas on range conditions.
Subsequent studies through the 1930s and 1940s indicated grass cover and production had
stabilized or was increasing, but shrubs and aspen on the elk winter range were still heavily
browsed (Dixon 1939, Ratcliff 1941a, Packard 1947). Ratcliff (1941a) observed heavy use
and mortality of mountain sagebrush (A. tridentata ssp. vaseyana) and willow (Salix spp.)
throughout Mill Creek, Moraine Park, Beaver Meadows, and the Deer Mountain area. Aspen
stands located on grassland areas of the elk winter range (e.g., Moraine Park) were not able to
reproduce because all of the young trees were being eaten each year (Dixon 1939, Ratcliff
1941a). Ratcliff (1941a) estimated there were 1,100 elk and 1,400 mule deer in RMNP
during the winter of 1940 (Figs. 4, 5) and recommended the numbers of both species be
reduced.
It is difficult to determine the relative effects of elk and deer in the early 1940s. Elk and deer
were beginning to rebound by the 1940s. The winter diet of mule deer consists largely of
upland shrubs, such as sagebrush and bitterbrush, but summer diets are more variable (Kufeld
et al. 1973). The reports of numerous deer present in 1940 and apparent heavy sagebrush
mortality implies deer were affecting upland shrub communities. The deer population
appeared to peak in the 1930s and was well in decline by the 1940s (Fig. 5). Subsequent
declines throughout the 20th
century were most likely due to increasing competition with elk
or a deteriorating forage base caused by the high numbers of deer in previous years.
The complete mortality of young aspen trees and high utilization of willow suggests elk were
affecting these vegetation types in certain areas (Dixon 1939, Ratcliff 1941a). It is also likely
that the effects of previous cattle grazing activities were still contributing to range conditions
(as predicted by Wright et al. 1933). Elk may have still avoided areas in the park during the
early 1940s (e.g., Moraine Park still had two large, private ranches), as they were observed to
concentrate in Mill Creek and Beaver Meadows (Dixon 1939, Ratcliff 1941a).
Because the elk population was still increasing and range conditions were considered to be
deteriorating (Dixon 1939, Ratcliff 1941a), an elk and deer management plan was written for
RMNP in 1943 (Condon 1943 cited in Guse 1966). The plan stated “300 elk and 200 deer
should be removed from the actual herds of 705 elk and 717 deer counted in April 1943”.
The goal of the reductions was to reduce the grazing and browsing effects on native
vegetation.
1 Despite the purchase, there were still significant tracts of core winter range areas that remained private. These
were not purchased until the 1960s (Dixon 1931, cited in Guse 1966).
15
0
500
1000
1500
2000
2500
3000
3500
4000
4500
1915 1935 1955 1975 1995
Year
Nu
mb
er o
f D
eer
Figure 5. Approximate deer population size in the Estes Valley during
winter from 1915 to 2003 (Stevens 1980a , Colorado Division of Wildlife
1999, Conner 2004). There is no way to determine the accuracy of
estimates made prior to 1960. Recent counts (2001-2003) were
conducted using mark-resight methods (Conner 2004).
?
16
Direct reductions were carried out for the first time in December 1944 and January 1945, and
removed 301 elk and 113 deer from the park winter range areas. Shortly thereafter, Grater
(1945) suggested that the reductions were not necessary, stating that the grasses on the winter
range were in fair to good condition and browse plants (such as willow) were not seriously
damaged except in localized areas where elk concentrated to feed. Hillary A. Tolson,
Assistant Director of the National Park Service, also wrote to RMNP in January 1946 and
stated that the Director’s office had a “strong dislike” for reduction programs either inside or
adjacent to National Park Service units. As a result, further reductions were halted until
1949.
The park’s 1945-47 annual reports generally remained optimistic about range conditions.
However, in a 1949 report, the park was again focused on reducing the number of elk and
deer to improve range conditions: “The major wildlife problem at this time is the overused
condition of winter range by deer and elk, it is anticipated that a reduction of elk and deer
will be effected during the winter of 1949-50”. Such conclusions were generally based on
personal, subjective observations; quantitative data on range conditions were not collected
again until 1954 by Buttery (1955).2
Direct reductions resumed in 1949-50 and removed 340 elk and 100 deer in RMNP. Annual
reductions of approximately 60 elk and 40 deer continued until 1962. Stevens (1980a)
provides a summary of population estimates that indicate approximately 350 to 800 elk and
300 to 700 deer remained in the park during the winters between 1950 and 1962. Direct
reductions in the park were terminated in 1962 for a variety of reasons. Buttery (1955)
concluded upland shrubs and willow were displaying signs of recovery and overall winter
range conditions were improving. Regional biologist Jim Cole also considered the range in
good enough condition in 1955 to end the reduction program (Wright 1992). However, the
primary reason the control program ended was because RMNP, the Colorado Department of
Game and Fish, and U.S. Forest Service signed a Memorandum of Understanding (1962) that
agreed to undertake a cooperative elk study program that would determine the distribution
and migration routes of elk in and around RMNP.3 The state also experimented with a pre-
season (now referred to as a late season) hunt in January and February 1963. The goal of
these research efforts was to determine if there was any time of year when sufficiently large
numbers of elk from the park were located outside park boundaries to allow hunters (versus
park rangers) to harvest park herd surpluses (Denney et al. 1967).4
Large numbers of elk were only documented to move east of the park boundary (towards
Estes Park) once during the five-year study ending in 1967 (Denney et al. 1967). Two
reasons likely contributed to this elk migration out of the park. First, the only significant
2 A report by Fred Packard, the park’s full time wildlife technician, was published in 1947, but it was based on
work done prior to the initial reduction programs in 1944-45 (Packard 1947). 3 The Colorado Department of Game and Fish is now known as the Colorado Division of Wildlife.
4 The agencies had good motivation to find an alternative to the elk control program within the park. At the
time, the Colorado Department of Game and Fish had suspended any assistance with the reduction program
because the state wanted the park opened to public hunting, and the National Park Service was under increasing
pressure to end control programs in RMNP and Yellowstone (Wright 1992).
17
snowfall during the study occurred in the park at this time (January to March 1963). Large
snowfall in the park causes elk to move to lower elevations outside the park (Lubow et al.
2002). Second, elk had likely developed a tendency to avoid the park during this time of
winter because this is when rangers had lethally controlled animals during the previous 10-15
winters. The single large migration also coincided with the first pre-season 1963 hunt which
removed more elk (>500) than any previous NPS control effort (Stevens 1980a). However,
many of these animals were located over 30 km (>20 miles) from the park border and a NPS
trapping report (1967-68) suggested they were not part of the RMNP elk herd. Harvests
throughout the rest of the Denney et al. (1967) study were markedly reduced, averaging less
than 75 animals per year (Stevens 1980a). Nevertheless, the agencies moved ahead with a
long-term management plan to control elk numbers with public harvests outside RMNP
boundaries.5
The long-term management plan (1967 supplement to the 1962 Memorandum of
Understanding) agreed to 1) dispose of surplus elk by public hunting outside of the park, 2)
establish a pre-season (i.e., late season) hunt in January and February adjacent to park
boundaries, and 3) trap and transplant animals if the public hunt is not effective. When the
state was not able to hold a January and February hunt in 1967, the park trapped and
transplanted 55 animals during the winter of 1966-67. By the summer of 1967, the park and
state believed they could keep the population size stable if the park population was initially
brought down to approximately 400 animals (National Park Service trapping report 1967-68).
In an effort to lower the population to 400 and hold it steady, the park trapped 175 elk and the
state conducted a January and February hunt in 1968. Initial results were encouraging as 268
animals were harvested during this hunt; but these animals were either not from the park
population or the park population had been underestimated in previous years because elk
numbers appeared to more than double in size during the following years (Fig. 4; Stevens
1980a). Late season hunts outside the park continued today, but the 1967-68 transplants
were the last time RMNP directly reduced the herd. This marked the beginning of a
management era that has become widely known as “natural regulation” (Huff and Varley
1999).
Natural Regulation
As it did for NPS natural resource management policies for the first six decades of the 20th
Century, Yellowstone provided the model and testing ground for a profound change in the
way natural resources, particularly animal populations, would be managed in national parks
in the remaining portion of the century. These changes came about because of increased
public scrutiny to Yellowstone’s existing elk management policy, which like RMNP,
involved routinely culling animals to keep the population at a prescribed level. Following
contentious congressional hearings regarding culling activities in Yellowstone (U.S. Senate
5 Note: Denney et al. (1967) suggested that the marked elk in the study did not routinely move out of the park
because they were captured in the wrong area (i.e., Moraine and Horseshoe Park). They suggested that
additional summer trapping efforts in the northeast corner of the park would show elk moving out of RMNP
during the winter. However, this is largely inconsequential because the issue at hand was elk population size in
Moraine Park and Horseshoe Park, not simply finding animals to harvest outside RMNP.
18
1967), it became clear to the NPS that a politically more appealing alterative was needed. The
alternative adopted was to allow the ungulate populations in the park to reach levels that
would be limited only by range potential and other ecological factors such as winter severity
and hunting outside the park. This paradigm would test the idea that 1) ungulate populations
might be limited by food or weather (i.e., naturally regulated) rather than held to an arbitrary
level by culling and 2) this would not result in deteriorated or undesirable range conditions.
This management era (1968-present), marked by little to no management interventions with
ungulate populations, has become widely known in the media and scientific literature as
“natural regulation” (Huff and Varley 1999). For the sake of clarity, we too use the term
natural regulation.
When natural regulation was postulated it was set up as a hypothesis to be modified as more
knowledge was gained. Yellowstone’s Chief Biologist in fact termed the effort
“experimental management”, an approach very much akin to what is today referred to as
adaptive management (Cole 1971). In keeping with this approach, a long-term monitoring
program was to be included and the hypothesis was to be modified as information dictated.
However, a monitoring plan was never undertaken and the experimental management became
existing management. If it had been, a series of alternative hypotheses would have been
undoubtedly formulated. One of these probably would have been that predation limits
populations below some level that would be dictated by range potential and a weather-forage
interaction (J. Peek personal communication). As it was, the initial hypothesis was aimed at
determining whether or not the relatively protected Yellowstone elk population would
actually over-graze its range, or if density-dependent population control factors - primarily
the interaction of food and climate on reproduction and survival - would act to reduce the
population growth rate and stabilize the population before there were undesirable changes in
the forage base.
Implicit in the initial natural regulation management scenario was the fact that there would be
little or no management intervention with the dynamics of the elk population (Peterson
1999). The Yellowstone natural regulation model was adopted by RMNP in 1968 although it
was recognized that conditions at RMNP were considerably different than at Yellowstone.
Rocky Mountain National Park never completely advocated natural regulation because
winters are mild and the majority of historic winter range areas for elk are outside the park
and largely influenced by humans (e.g., Estes Park). The concept of natural regulation as
practiced in RMNP always included the understanding that hunting adjacent to the park or
some other type of control was necessary to help control the elk population to fulfill the role
of extirpated predators (Stevens 1980a).
Science-Based Management
National Park Service Management Policies (NPS 2001) state:
“The Service will adopt park resource preservation, development, and use
management strategies that are intended to maintain the natural population
fluctuations and processes that influence the dynamics of individual plant and animal
19
populations, groups of plant and animal populations, and migratory animal
populations in parks…Biological or physical processes altered in the past by human
activities may need to be actively managed to restore them to a natural condition or to
maintain the closest approximation of the natural condition in situations in which a
truly natural system is no longer attainable. Prescribed burning and the control of
ungulates when predators have been extirpated are two examples. The extent and
degree of management actions taken to protect or restore park ecosystems or their
components will be based on clearly articulated, well-supported management
objectives and the best scientific information available.”
The following section summarizes research that has been conducted on elk population
dynamics in the Estes Valley area since the onset of natural regulation. These results allow
for an opportunity to evaluate if elk population dynamics and vegetation conditions are
within their natural range of variability. This report defines the natural range of variability as
elk population processes and vegetation conditions that would exist in the absence of human
dominance over the landscape and a viable wolf population in the RMNP area. Wolves are
the major predator of elk and have the potential to directly alter ungulate abundance and
foraging behavior through predation (Orians et al. 1997, Kunkel and Pletscher 1999, Peterson
1999, Hebblewhite et al. 2002).
We recognize that the natural range of variability as described here is not entirely complete.
Historic records and the existence of large, pre-settlement game drives for elk in RMNP
indicate Native Americans hunted in the area (reviewed above). The effect of a completely
intact predator base – including wolves, grizzly bears, and humans – would likely be greater
than wolves alone (e.g., Orians et al. 1997). Thus, the results presented here should be
considered conservative, representing the maximum number of elk that would occur in the
RMNP area.
The predicted effect of wolves on elk population dynamics in the RMNP area was
determined below with the SAVANNA ecosystem model (Coughenour 2002, description
above). Elk and vegetation conditions were simulated using the current amount of available
habitat in the presence of wolves. Weather was selected randomly using local data from
1949-1998.
Elk Research (1968 – present)
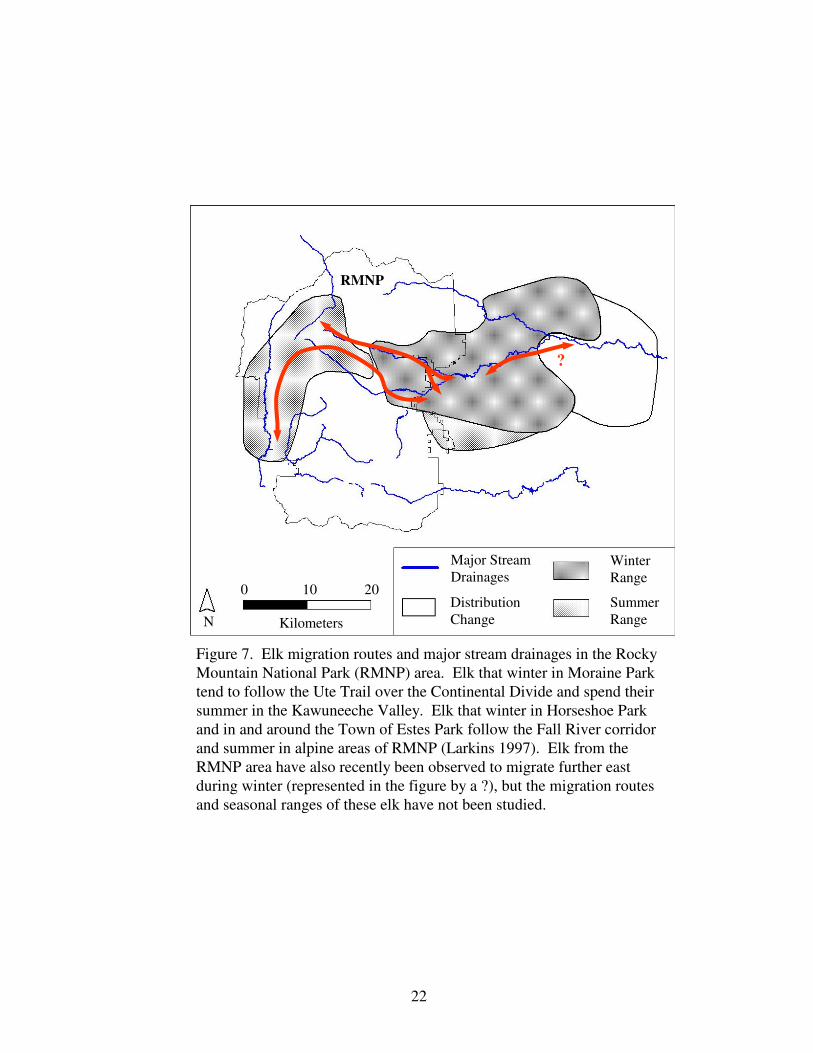
Elk Distribution and Movements – Elk in the RMNP area spend approximately seven months
per year on the core and primary winter range (November to May) and three months on
summer range (mid June to September). The remaining two months are spent on or in
transition between these two ranges (Fig. 3). Within their seasonal ranges, elk move in
response to various factors, including weather and hunting (Larkins 1997). Elk respond to
hunting by moving from areas that are open to hunting to areas where hunting is prohibited.
The elk population includes three winter subpopulations that exhibit different population
dynamics and migration patterns: 1) Moraine Park and Beaver Meadows (referred to as the
20
Moraine Park subpopulation), 2) Horseshoe Park, and 3) the Town of Estes Park and adjacent
National Forest Service areas (referred to as the Estes Park subpopulation) (Fig. 6; Larkins
1997, Lubow et al. 2002). Elk tend to stay within these areas, although 15% (400 to 500 elk)
regularly move between subpopulations. The population dynamics of the Moraine Park and
Horseshoe Park subpopulations do not differ and will be collectively referred to here as the
park subpopulation. Elk population dynamics are different between the park and town
subpopulations. There is also a small group of elk that spend winter on the alpine tundra in
RMNP (100-200 animals; years 1980 and 2000 estimates), but they are not considered in this
report as little is known about their migration patterns or population dynamics.
The elk population exhibits large, seasonal migrations between winter and summer ranges
(Fig. 7). The timing of migration depends on weather, in particular snow depth, which
determines when forage on the summer range will become available. Generally 75-90% of
the population migrate to higher elevations or the Kawuneeche Valley for the summer
(Larkins 1997, RMNP unpublished data). Elk from the three major winter range areas
exhibit distinct migration routes to and from their summer ranges (Larkins 1997). Elk in the
Moraine Park subpopulation migrate over the Ute Trail and to the Kawuneeche Valley, where
they calve, and most remain for the summer, although some migrate back to alpine areas for
the summer. Elk from Horseshoe Park and Estes Park migrate up the Fall River drainage and
spend summer in alpine areas of the park. However, the timing of the migrations of the two
subpopulations is different, with Horseshoe Park elk migrating to higher elevations in the
Cache la Poudre and Fall River areas to calve, while elk from town calve in Horseshoe Park
before proceeding to higher elevations for summer.
Approximately 20% of the primary winter range falls within park boundaries (Fig. 3),
extending from Cow Creek on the north to Hollowell Park on the south and east to Hidden
Valley. Approximately one-third of elk in the area winter in the park (Lubow et al. 2002);
however, park subpopulations make temporary cross-boundary movements out of the park to
lower elevations, especially during snowfall events.
Most of the winter range is outside the park in the Town of Estes Park and on adjacent
private and U.S. Forest Service Lands (Fig. 3). The Town of Estes Park provides continuous
elk winter range with Moraine Park and Horseshoe Park. Elk are attracted to the town area
for several reasons, including extensive grasslands, some of which are nutritionally enhanced
by fertilization (e.g., golf courses); little to no animal predation; and lack of hunting. In
addition, the town lies at a lower elevation than winter range areas in the park, and
consequently has lower snow depths and more favorable winter temperatures for elk (Singer
et al. 2002). During winter, elk also range east of the Estes valley, with elk numbers and time
periods varying depending on habitat conditions, snowfall, and hunting. Elk range north to
Crosier Mountain and Glen Haven and east to Drake and Bobcat Gulch and the vicinity of the
Meadowdale Ranch (Bear 1989, Larkins 1997). Elk also use Storm Mountain, Jug Gulch,
Bear Gulch, and the Pole Hill-Nixon Park areas. Other elk populations use areas east of the
Estes Valley (Bear 1989); the extent to which elk from the RMNP area mix with these
populations is not known, but it is estimated that up to 1,000 elk from the RMNP population
spend several months per winter in these areas (R. Spowart personal communication).
21
22
Kilometers
0 10 20
N
Major Stream
Drainages
Distribution
Change
Summer
Range
Winter
Range
Figure 7. Elk migration routes and major stream drainages in the Rocky
Mountain National Park (RMNP) area. Elk that winter in Moraine Park
tend to follow the Ute Trail over the Continental Divide and spend their
summer in the Kawuneeche Valley. Elk that winter in Horseshoe Park
and in and around the Town of Estes Park follow the Fall River corridor
and summer in alpine areas of RMNP (Larkins 1997). Elk from the
RMNP area have also recently been observed to migrate further east
during winter (represented in the figure by a ?), but the migration routes
and seasonal ranges of these elk have not been studied.
?
RMNP
23
Primary summer range areas in the park are at higher elevations in alpine and subalpine
and alpine habitat, and in the Kawuneeche Valley on the west side of the park (Figs. 2, 3).
Outside the park, elk summer in the Twin Sisters, Lion Gulch, Pierson Park, Lake
Pasture, Big Elk Park, and Big Elk Meadows areas (Larkins 1997, J. George personal
communication). At least 10-15% of elk in the RMNP area have been documented to spend
summer on the winter range. Recent park surveys indicate that during summer, at least 100
to 200 animals stay on the park winter range areas, and as many as 550 animals stay on town
winter range areas (RMNP unpublished data). The only large group of elk (>300 animals)
that summer on the winter range generally uses the Meadowdale Ranch and 18-hole golf
course on the east end of Estes Park. This group has been in this area since at least the 1970s
(Stevens 1980a).
In the fall of 2002, three elk that were radio-collared in the park during summer were
observed just west of the town of Loveland, along with a much larger group of elk than the
resident population in that area (Figs. 3, 7). This coincided with much smaller population
estimates in the Estes Valley than previous years, suggesting that at least 200 to 300 elk that
normally wintered in the Estes Valley moved eastward. Following the 2002-2003 winter,
two of the radio-collared elk returned to summer in the park, while the third remained with
the resident population near Loveland. Since that time, the size of the population in
Loveland has remained higher than it was prior to 2001, while population estimates in the
RMNP area have been lower, particularly for the town subpopulation. The cause of any
potential shift eastward is unknown, although suggestions have included drought, several
significant snowfall events, and limited forage due to high elk densities in the Estes Valley.
It is unknown whether some or all of these elk still summer in the park and whether these
shifts are temporary or long term in nature.
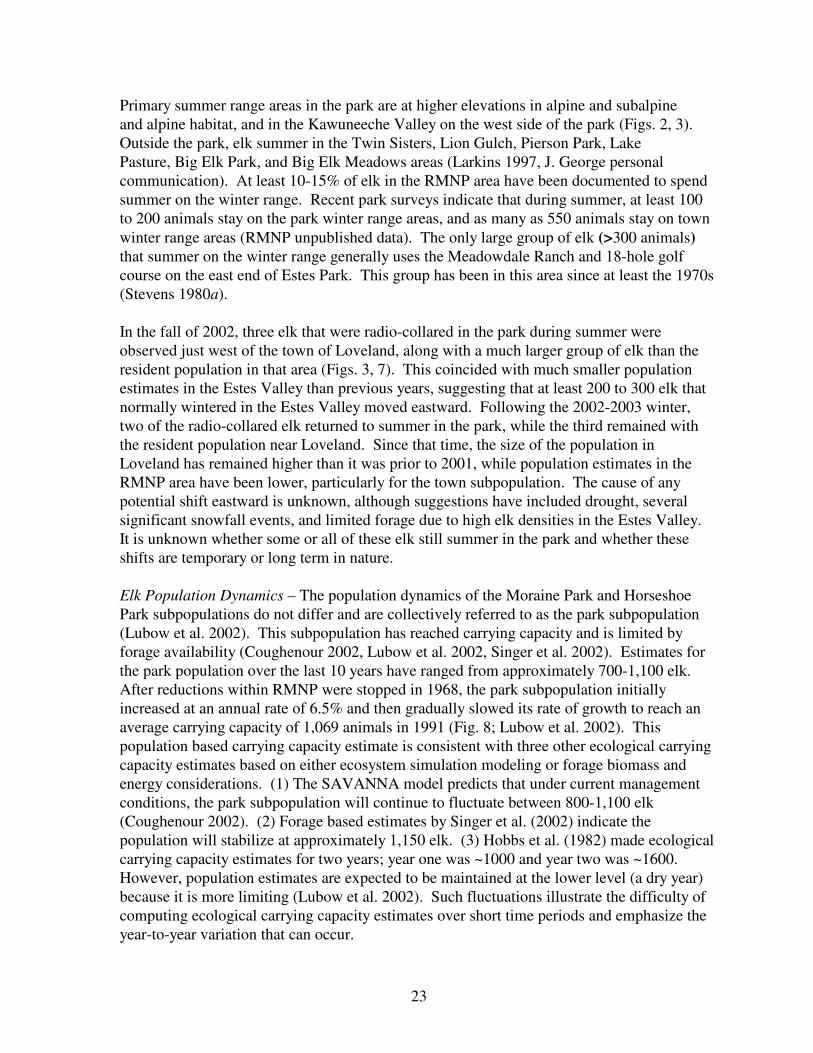
Elk Population Dynamics – The population dynamics of the Moraine Park and Horseshoe
Park subpopulations do not differ and are collectively referred to as the park subpopulation
(Lubow et al. 2002). This subpopulation has reached carrying capacity and is limited by
forage availability (Coughenour 2002, Lubow et al. 2002, Singer et al. 2002). Estimates for
the park population over the last 10 years have ranged from approximately 700-1,100 elk.
After reductions within RMNP were stopped in 1968, the park subpopulation initially
increased at an annual rate of 6.5% and then gradually slowed its rate of growth to reach an
average carrying capacity of 1,069 animals in 1991 (Fig. 8; Lubow et al. 2002). This
population based carrying capacity estimate is consistent with three other ecological carrying
capacity estimates based on either ecosystem simulation modeling or forage biomass and
energy considerations. (1) The SAVANNA model predicts that under current management
conditions, the park subpopulation will continue to fluctuate between 800-1,100 elk
(Coughenour 2002). (2) Forage based estimates by Singer et al. (2002) indicate the
population will stabilize at approximately 1,150 elk. (3) Hobbs et al. (1982) made ecological
carrying capacity estimates for two years; year one was ~1000 and year two was ~1600.
However, population estimates are expected to be maintained at the lower level (a dry year)
because it is more limiting (Lubow et al. 2002). Such fluctuations illustrate the difficulty of
computing ecological carrying capacity estimates over short time periods and emphasize the
year-to-year variation that can occur.
24
0
500
1000
1500
2000
2500
3000
1965 1970 1975 1980 1985 1990 1995 2000 2005
Year
Num
ber
of
Elk
Figure 8. Elk population dynamics (five-year moving average) in
Rocky Mountain National Park (RMNP) and the Town of Estes Park
(Lubow et al. 2002, RMNP unpublished data). The park subpopulation
primarily resides in Moraine Park, Beaver Meadows, and Horseshoe
Park. The town subpopulation resides in the Town of Estes Park and on
U.S. Forest Service lands to the east. Decreased elk numbers since
2002 are due in part to elk migrations out of Estes Park during winter.
Town of Estes Park
RMNP
25
Elk did not winter in the Town of Estes Park in noticeable numbers until the late 1970s (N. T.
Hobbs personal communication, cited in Lubow et al. 2002). The town subpopulation
increased at annual rates of 11% from 1979 to 1983 and 5.2% from 1991 to 2001. Although
the origin of the town population was likely emigration from the park, the subsequent growth
of the town subpopulation appeared to be independent of the park subpopulation (Lubow et
al. 2002). Population estimates reached a high between 1997 and 2000, with annual
estimates ranging from 2,000-2,500 elk. Estimates from 2001 to 2005 have ranged between
1,000-1,400 elk in the Estes Valley area (Fig. 8). These lower estimates coincided with
increased numbers in the park in 2001 and increased observations of elk from the Estes
Valley near Loveland in years 2002 and 2003 (Fig. 7, see above).
Three carrying capacity estimates have recently been made for the town elk herd. (1) A
population based estimate projects an eventual population size of 2869 elk, but has a wide
margin of error (i.e., standard error ± 415) which predicts the estimate could fall between
2,454 and 3,284 elk (Lubow et al. 2002). (2) A forage based estimate predicts 3,082 elk will
eventually occupy the town sector (Singer et al. 2002). (3) A SAVANNA estimate of the
carrying capacity in town to be 1,400-2,000 elk, with an initial overshoot to a population size
of 2,400 elk before the stabilization occurs (Coughenour 2002). It is important to note that
the latter two estimates were based on vegetation maps from 1996, so development in town
may have already changed their current values. The population based estimate (2,869 ± 415)
will also continue to change as future development removes or enhances elk habitat. Recent
results suggest the elk subpopulation in town is stabilizing (as in Coughenour 2002).
Carrying capacity in the town area in 1996 was estimated to be only 5% less than if the area
was still in pristine, natural condition (Coughenour 2002, Singer et al. 2002). Development
and the creation of Lake Estes has reduced the land area available for elk foraging, but the
creation of golf courses and other irrigated and fertilized areas has enhanced the productivity
of remaining lands.
If wolves were still present, elk numbers in the park during winter would be expected to
fluctuate between 300-500 elk (Coughenour 2002). Elk numbers in the town area during
winter would be expected to fluctuate between 900-1600 elk (Coughenour 2002).
SAVANNA indicates that a total of 1,200-2,100 elk would inhabit the primary winter range
under current conditions and in the presence of wolves. This is considerably lower than the
fluctuations observed over the last 10 years, which ranged from 1,700-3,500 elk in the Estes
Valley. Limitation of elk populations by wolves has been observed or predicted in several
North American ecosystems (Garton et al. 1990, Boyce 1993, Mack and Singer 1993, Kunkel
and Pletscher 1999, Hebblewhite et al. 2002, Singer et al. 2003); and limitation of ungulate
populations below K by their major predators has been observed throughout the world
(Sinclair 1985, Messier and Crete 1985, Bergerud and Elliot 1986, Gasaway et al. 1992,
Orians et al. 1997, Peterson 1999). Although some studies have found ungulate numbers to
be limited by forage in the presence of an intact predator community (Sinclair et al. 1985,
Skogland 1985, Fryxell 1987, Mduma et al. 1999), we know of no research that indicates elk
population size in the RMNP area or other similar ecosystems would be stable at K in the
26
presence of wolves. Further, as mentioned above, the effect of a completely intact predator
base that includes wolves, grizzly bears, and humans would likely be greater than wolves
alone (e.g., Orians et al. 1997).
Elk Densities – Elk group sizes during winter can range from a single individual to over 600
animals in Moraine Park and the golf course areas in Estes Park (Larkins 1997). Elk
densities on the winter range were estimated from 1994 to 1999 by Singer et al. (2002).
Densities reported here represent the average values of 44 aerial surveys conducted in winter
during the early morning and afternoon. Elk densities are variable in the park, with high (30
to 65 elk/km2) to very high (66 to 110 elk/km
2) concentrations on about 7% of the winter
range, centered in Moraine Park (Singer et al. 2002). The remainder of the winter range
generally has moderate (10 to 29 elk/km2 on 11% of the winter range) to low (<10 elk/km
2 on
82% of the winter range) densities (Singer et al. 2002). Although elk use lower-density areas
of the winter range to rest or as they move between areas, the majority of their time spent
foraging is highly concentrated on a small percentage of the winter range. Elk densities on
core winter range areas that are greater than 100 elk/km2 are the highest concentrations ever
documented for a free-ranging population that is not artificially fed.
The average density in Estes Park is 28.5 elk/km2. Site-specific density information is not
available for Estes Park, but a similar pattern exists with very high concentrations in areas
with excellent foraging conditions (e.g. golf courses) and lower concentrations in other areas
(e.g. downtown). Elk use essentially all parts of the Estes Valley, with concentrations
occurring in the area between Dry Gulch and Devil’s Gulch Road, along U.S. Highway 34,
the Crocker Ranch area, on both golf courses, and between Fish Creek and Colorado
Highway 7 (Larkins 1997). Elk are generally less concentrated on summer range areas.
It is difficult to determine what density of elk is appropriate, but research elsewhere indicates
densities of elk in RMNP during winter are outside their natural range of variation. For
example, elk densities in willow and grassland habitats of the core winter range (10 to 110
elk/km2) are high compared to other free-ranging populations in North America, where they
range from 1 to 36 elk/km2 (Houston 1982, Singer et al. 1994, Smith and Anderson 1996,
Hebblewhite et al. 2002, Nietvelt 2001). Because there are no major predators of elk in the
RMNP area (Singer et al. 2002), elk behavior and distribution is altered because they can
optimize their foraging strategies by decreasing their vigilance of predators (e.g., Laundré et
al. 2001, Wolff and Van Horn 2003). Elk in Yellowstone, Banff National Park, and Montana
have recently been shown to exist at lower densities, increase use of forested areas, and
decrease use of grassland habitats when wolves are present (Nietvelt 2001, Ripple et al. 2001,
Ripple and Beschta 2004, Wolff and Van Horn 2003, Hebblewhite et al. 2005, Creel et al.
2005). Similar predator avoidance behaviors have also been found in other ungulate species
(e.g., Edwards 1983, Ferguson et al. 1988, Dekker et al. 1996, Schmitz et al. 1997, White et
al. 1998, White and Feller 2001). These findings strongly suggest that densities of elk on the
core winter range grasslands (which contain aspen and willow communities of concern, see
below) have exceeded natural values due to lack of a major predator.
27
Elk Survival – The largest source of mortality for adult elk in the population is hunting;
however, elk that spend winter in the park or Town of Estes Park are not affected by hunting
unless they leave to use adjacent U.S. Forest Service or private lands where landowners allow
hunting. This can occur, particularly in response to heavy snowstorms.
Lubow et al. (2002) estimated survival rates from 1965 to 2001 in the park and 1978 to 2001
in town. During these periods, bull survival increased from 52% to 79% in the park, but
remained constant at 42 % in town. Low but increasing male survival in the park indicate
that these individuals are also subject to harvest at some times, but vulnerability has declined
over time. Lubow et al. (2002) found that adult female survival was 91% for both park and
town and concluded that harvest did not appear to have a differential effect on cow survival
in the park versus town subpopulations. However, in the past several years, cow harvest has
increased, so this may no longer be the case.
A calf mortality study conducted in RMNP and the Estes Valley between 1979 and 1982
found that malnutrition was the most significant source of mortality (35%), followed by
hunting (23%), predation by coyotes (17%), and disease (12%) (Bear 1989). Most death
from malnutrition occurred in the first few weeks after birth, and was attributed to cows
being in poor condition due to weather or resource limitations. As population sizes and
densities increased from 1965 to 2001, calf survival to eight months of age declined in both
park and town (Lubow et al 2002). Calf survival to 20 months also declined strongly in the
park as elk density increased, and was present but less apparent in town. In 2001, calf
survival to eight months was 35% in the park and 88% in town. Survival to 20 months was
24% in the park and 73% in the town.
Chronic Wasting Disease – Elk and deer that winter on the east side of RMNP are infected
with chronic wasting disease (CWD). No other ungulates (e.g., moose (Alces alces), bighorn
sheep (Ovis canadensis canadensis)) or animals are known to be susceptible to CWD.
Chronic wasting disease is a transmissible spongiform encephalopathy that primarily occurs
in free ranging deer and elk in northeastern Colorado and southeastern Wyoming (Miller et
al. 2000). Cases in free ranging deer or elk have also been documented in South Dakota,
Wisconsin, Illinois, New Mexico, Utah, and Saskatchewan. Little is known about the
disease, which eventually causes behavioral changes, emaciation, excessive salivation,
weakness, and death in infected animals. The disease can remain latent (i.e., no symptoms
are apparent) for months and potentially years, and it is terminal in all cases. It is unknown if
the disease is native, and if not, how it originated; but it has been present in the area for at
least 30 years (Miller et al. 2000).
At present, CWD has only been diagnosed in elk from the RMNP area by examining brain
tissue after death. Prevalence estimates of elk inside RMNP have not been determined but
are believed to be comparable to surrounding areas. Past prevalence in elk in adjacent areas
was estimated to be less than 1% based on surveillance from mandatory elk head submission
from hunters (Miller et al. 2000); however, estimates in 2003 and 2004 range from 1% to 3%
(Colorado Division of Wildlife 2003, 2004).
28
There are many uncertainties associated with the disease; for example, it may be able to exist
and be transmitted via the environment (e.g., soils). To date, there is no evidence that
suggests CWD can affect the population dynamics of elk.
Summary
Elk that winter in the Estes Valley are referred to as park and town subpopulations due to the
areas they inhabit and differences in their population dynamics. The park subpopulation
reached ecological carrying capacity of approximately 1,000 elk in the early 1990s.
Estimates above or below this average carrying capacity estimate are due to annual variability
in forage conditions, temporary migrations, timing of park surveys, and weather.
SAVANNA estimates 300-500 elk would inhabit the park during winter if wolves were still
present.
The town population, which also uses surrounding U.S. Forest Service land, reached a high
between 1997 and 2000, with annual estimates ranging from 2,000-2,500 elk. Estimates
from 2001 to 2005 have ranged between 1,000-1,400 elk. Carrying capacity estimates for the
town herd vary depending on the method used, ranging from 1,400-3,300 elk. SAVANNA
estimates 900-1,600 elk would inhabit the town area during winter if wolves were still
present.
Thus, SAVANNA indicates 1,200-2,100 elk would inhabit the primary winter range in a tri-
trophic system where elk, food, and wolves freely interact. This is considerably lower than
the fluctuations observed in the current bi-trophic system, where elk are only limited by their
food base and population estimates have ranged from 1,700-3,500 elk over the last 10 years.
The ability of wolves to limit elk populations below ecological carrying capacity is supported
by research elsewhere in North America. No estimates are available for the natural range of
densities that would be expected to occur in the presence of wolves. However, densities on
the core winter range areas in the park are the highest concentrations ever documented for a
free-ranging elk population and it is highly unlikely such aggregations would occur in the
presence of wolves.
FOCAL PLANT COMMUNITIES
Aspen
Aspen Ecology – Aspen covers less than 5% of RMNP, but provides important habitat for a
large number of plant, butterfly, and bird species compared to other habitat types the park
(Mueggler 1985, Simonson et al. 2001, Turchi et al. 1994). Although some stands in the park
are relatively large (>0.4 km2 or 0.15 square miles), most are only a few hectares in size.
Aspen trees that are connected by their roots are referred to as a clone. Almost all aspen
stands that have been studied in the western U.S. are made up of a single clone or mosaic of
clones, and they are believed to almost always reproduce vegetatively (Shepperd and Engelby
1983, Schier 1985, Kay 1997a). Vegetative reproduction is when the interconnected roots
29
give rise to adventitious suckers that eventually become an aspen tree. Aspen establishment
can also occur through sexual propagation (seeds) when condition are suitable, but this is
considered a rare occurrence in the western U.S. (Shepperd and Engelby 1983, McDonough
1985, Kay 1997b). Few aspen trees live more than 200 years (Jones and Schier 1985), but
aspen clones are often hundreds or potentially thousands of years old (see also Kay 1997a).
The primary factors that affect the ability of aspen to regenerate are apical dominance,
disturbances such as fire, and ungulate browsing. Apical dominance is when auxin, a plant
hormone that inhibits shoot and tree growth, is transported from aerial parts of the tree to the
roots (Farmer 1962, Schier 1975a, Schier 1985). When the flow of auxin to the roots is cut
off, new suckers arise and the existing trees resume growth (Schier 1985). Deteriorating,
overmature aspen clones often fail to regenerate because apical dominance is maintained over
a shrinking root system (Schier 1975b).
Aspen is a shade intolerant tree that cannot reproduce in the presence of mature conifers.
Fire or other types of disturbance (e.g., an avalanche) are thus necessary to facilitate aspen
persistence in the landscape by opening up the forest canopy and preventing conifers from
overtaking aspen trees. Because aspen initially grow much faster than conifers, canopy
opening disturbances allow aspen to expand and maintain their clone until another
disturbance can occur. In RMNP, aspen on the core winter range grasslands are not
successional to conifers and do not require fire to regenerate in the absence of elk. However,
elk are a natural part of the system and fire may still play an integral role in aspen stand
establishment by altering elk feeding patterns, plant competition, and releasing nutrients that
increase aspen growth. Aspen throughout the rest of the park are largely dependent on fire
(or another type of disturbance) to sustain themselves.
Elk browsing can kill or stunt the growth of aspen suckers. When intense enough, this can
prevent all suckers within an aspen stand from reaching tree size. This could eventually
eliminate the aspen stand because photosynthesis will cease as the older trees die, and the
root systems will become malnourished and result in the loss of the clone. However, aspen
may also be able to persist for long periods of time in a shrub-like state (e.g., Dobkin et al.
2002) and it is very plausible that this allows aspen to persist until ecological conditions are
appropriate for trees to become established. Thus, the presence of aspen trees may be a
periodic event on the winter range made plausible by persistence in a shrub-like state when
trees cannot become established.
Elk also strip the bark off of live trees. The nutritional value of bark is unknown, but aspen
barking by elk is not believed to be related to food shortages (in RMNP, aspen were barked
when only 350 elk, ~10% of current numbers, were estimated to be on the winter range).
Bark stripping does not usually kill aspen, but it can create inoculation sites for pathogens
that lead to aspen mortality (Hinds 1985).
Aspen in RMNP – Concerns about the effects of elk on aspen in the park are specific to the
core winter range areas (e.g., Moraine Park, Beaver Meadows, and Horseshoe Park) and the
Kawuneeche Valley (Suzuki et al. 1999). These are the most visible stands in the park by
30
virtue of their proximity to the road system and park entrances, however they occupy less
than 2% of the winter range and make up less than 1% of the aspen in the park. The large
majority (>99%) of aspen in the park are not located on the primary winter range or
Kawuneeche Valley and are not adversely affected by elk browsing (Suzuki et al. 1999, Kaye
et al. 2005).
Research has shown that elk browsing on the winter range has prevented aspen suckers from
maturing into trees (i.e., a height >2.5 m or 8 feet in height) since at least 1970 (Baker et al.
1997, Olmsted 1997, Suzuki et al. 1999). Olmsted (1979) and Baker et al. (1997) found an
inverse correlation between aspen regeneration on the core winter range and elk population
size. The latter study concluded aspen stands only produced a new cohort of trees when there
was no town subpopulation and the park subpopulation was less than 600 animals.
The results of Olmsted (1979) and Baker et al. (1997) suggest that elk population size is the
primary factor controlling aspen regeneration and cohort establishment on the core elk winter
range. However, Stevens (1980a) did not find a correlation between aspen leader use and elk
population size, and suggested that elk distribution may be equally or even more important to
successful aspen regeneration than overall population size. Stevens (1980a) states: “Olmsted
[1979] utilized the regeneration of aspen in certain stands as an indication of a relief from
browsing during the 1950’s, [but] these stands were near roads where the maximum direct
reduction efforts on elk took place and therefore received little sustained use”. Baker et al.
(1997) worked in the same area as Olmsted (1979) and is subject to the same concern,
namely that it is impossible to determine if elk population size or density is a more important
predictor of aspen utilization rates. Weisberg and Coughenour (2003), who found densities
were a more accurate predictor of aspen regeneration and growth than overall population size,
give tacit support to the Stevens (1980a) hypothesis.
There are two 35-year-old aspen exclosures on the elk winter range, and both contain
multiple age classes of aspen. The ratio of live to dead trees is twice as high for stands inside
these exclosures versus outside. Average stocking rates inside exclosures was 245,000
suckers/km2 and outside exclosures was 47,300 suckers/km
2 (Baker et al. 1997).
Existing aspen trees on the park’s winter range are declining rapidly as they die of old age.
Between 1975-76 and 1995-96, Olmsted (1997) found large trees decreased by 42%. This
indicates that the existing aspen trees on the park’s core winter range are over-mature and in
danger of losing their largest aboveground component (i.e., trees). All research indicates that
if current elk densities persist on the core winter range, there may be a complete loss of aspen
trees (Baker et al. 1997, Olmsted 1997, Suzuki et al. 1999, Coughenour 2002, Weisberg and
Coughenour 2003).
The concern about the loss of aspen on the core winter range is largely due to the acceptance
that the aspen stands are clones that only regenerate vegetatively and have been present for
hundreds if not thousands of years. Another possibility is that the clones on the core winter
range were established from seed relatively recently. Such events (i.e., recent aspen
regeneration by seed) in the western U.S. have been associated with large fire events (e.g.,
31
Romme et al. 1995, Romme et al. 2001). However, elk herbivory killed all the suckers
before an aspen stand or clone could become established (Romme et al. 1995). Aspen trees
and stands may have been established in the absence of herbivory. The montane region of the
northern Colorado Front Range and RMNP experienced extensive fires during the 1800s
(Rowdabaugh 1978, Veblen and Lorenz 1991, Mast et al. 1998, Veblen et al. 2000). There
were also no elk present in RMNP by 1880, so it is plausible that aspen on core winter range
areas of RMNP are seedlings that persisted because of increased fire frequency and elk
extirpation.
Baker et al. (1997) cite limited photographic evidence from the early 1900s that show aspen
stands were present on the winter range prior to elk extirpation. However, the one photo they
provide is clearly not on the core elk winter range because it is in a dense stand of conifers;
Suzuki et al. (1999) found that many such stands on the primary winter range (in the conifers)
are still able to reproduce. There are also no elk scars on the bark, which likely would have
been present if the trees existed prior to elk extirpation. Baker et al. (1997) and Olmsted
(1979) also aged aspen trees on the elk winter range. None of the estimated dates were prior
to elk extirpation (1880), but this could also be a function of aspen longevity, which typically
does not extend beyond 100 to 150 years of age (Jones and Schier 1985).
The SAVANNA model was used to simulate aspen cover on the core elk winter range. In all
model runs with elk, aspen cover on the winter range was initiated at current levels and
declined. Even when wolves were present and limited the elk population, aspen declined
substantially. Only when elk were removed from the model was aspen able to persist or
increase on the core elk winter range (Coughenour 2002). However, neither elk densities nor
distribution was modeled in SAVANNA. This, along with the fact that aspen have
regenerated and established new cohorts of trees during the 20th
century, again suggests that
predation or some other factor (e.g., past park service shooting programs) that influences elk
distribution has played a key role in allowing aspen on the core winter range to recruit new
trees. For example, previous research has found that elk will decrease their use of areas that
are heavily hunted or has predators (Altmann 1956, Ripple et al. 2001). Such effects may
allow aspen to successfully regenerate on the winter range in RMNP, but it is unclear how
long elk avoidance of a given area may persist.
A separate SAVANNA modeling effort has been conducted to more intensively examine the
effects of elk density on aspen regeneration (Weisberg and Coughenour 2003). Although this
effort suggested similar results as Coughenour (2002), it did find that aspen were able to
produce new cohorts in the presence of lower elk densities, dependent on the amount of time
elk spent feeding in aspen stands. When elk used aspen for approximately eight months of
the year, aspen could regenerate when there were fewer than 5 elk/km2. If elk were assumed
to only use aspen for three months of the year, aspen could regenerate in the presence of as
many as 14 elk/km2.
Baker et al. (1997) and Singer et al. (1998a) cite successful aspen reproduction in ungulate
exclosures as evidence that recent changes in climate or fire absence are not responsible for
aspen declines in these locations. However, because herbivory is a natural component of the
32
RMNP ecosystem, the interaction of these effects with other natural components of the
ecosystem cannot be fully evaluated inside exclosures. For example, if it was found that even
a small number of elk at a low density prevented aspen from regenerating it would suggest
that the stands are either not a natural component of the system or other key factors to aspen
recruitment (e.g., fire regimes, climate) may have been altered. Until such hypotheses are
tested, it is not possible to completely eliminate the role of other factors such as fire, climate,
or altered foraging patterns due to the presence of predators.
Willow
Three woody shrubs that occur on the winter range in RMNP are of primary interest from the
viewpoint of elk herbivory: willow, bitterbrush, and sagebrush. The general distribution of
these shrubs on the winter range is shown in Figure 9.
Willow Ecology – Willow establishment occurs by sexual and asexual means. Sexual
propagation is by seed. Willow seeds are only viable for a few days and can only take root in
wet areas with unvegetated or disturbed soils with good light availability (Cottrell 1993,
Cottrell 1995). Willows in RMNP establish themselves on three principal landforms; point
bars, abandoned beaver ponds, and abandoned channels or ox-bows (Cooper et al. 2003,
Gage and Cooper 2004a). The latter two types are both associated with the presence of
beaver in an area, suggesting beaver are not only important for asexual propagation (see next
paragraph), but sexual propagation as well.
Asexual propagation (vegetative) occurs when existing willow roots or a willow stem cut by
beaver gives rise to new shoots to become a new plant. Shoots from the roots of a willow are
very important because they allow existing willow plants and root systems to maintain
themselves for long periods of time (i.e., 100 years or longer). Beaver cuttings also allow
willows to colonize areas that are suitable for willow growth but not seedling establishment,
and may be important on a landscape scale (Cottrell 1995, see also Gage and Cooper 2004b).
A potential long-term result of smaller beaver populations in the park is a decrease in willow
cover (Cottrell 1995).
Willow growth and height in the intermountain west is often determined by large ungulate
and beaver browsing (Singer et al. 1994), as well as site conditions such as soil type, length
of growing season, nutrient concentrations, and water table height (Cottrell 1995, Peinetti
2000). Willows have developed two primary defenses against the effects of browsing: first,
they exhibit rapid vertical growth rates that extend growth beyond the height of browsing
(Bryant et al. 1983); and second, willow can produce defense compounds that make them less
palatable to large ungulates (Singer et al. 1994). Neither defense is likely to be effective if
ungulate consumption levels are too great, especially if intense herbivory is combined with
beaver activity or poor site conditions.
Willow in RMNP – Willow is the dominant woody shrub on almost all wet meadow or
riparian areas in RMNP. It is an important food source for elk (Hobbs et al. 1981, Singer et
al. 2002) and beaver (Baker and Cade 1995), and supports a large number of bird and
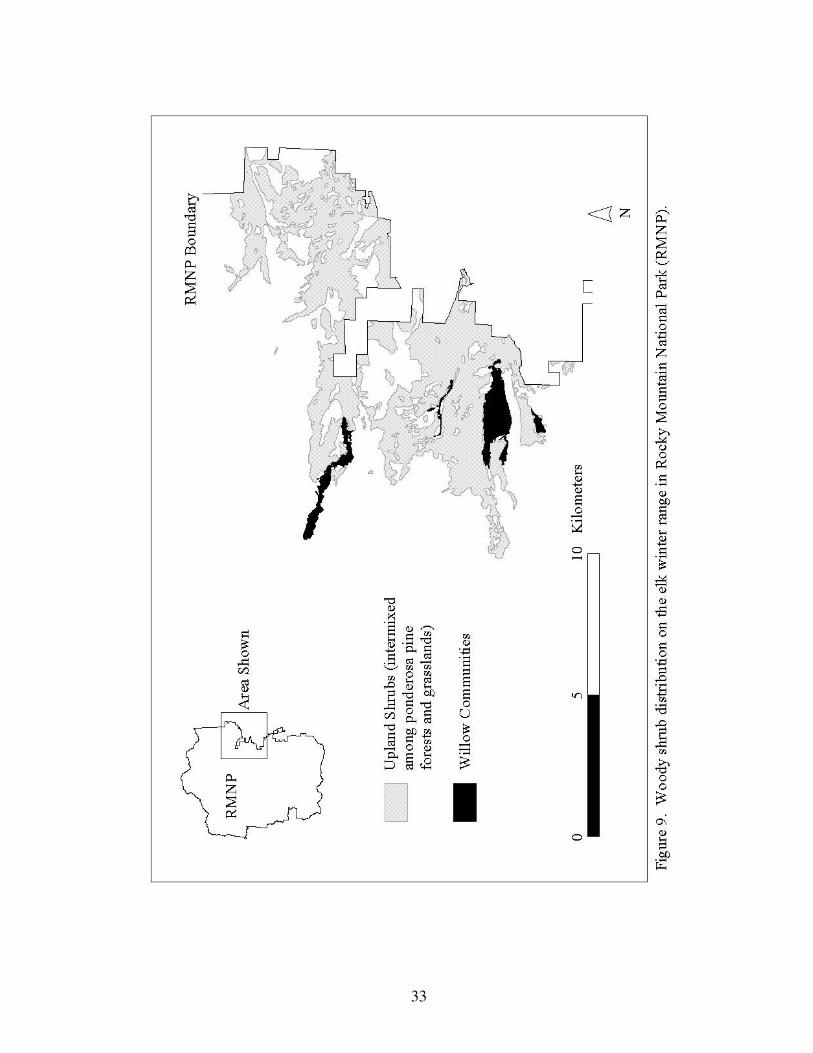
33
34
butterfly species on the core elk winter range relative to other habitat types (e.g., Connor
1993, Simonson et al. 2001). There are primarily three species of willow on the elk winter
range; Salix geyeriana, S. monticola, and S. planifolia (Zeigenfuss et al. 2002). Park-wide, S.
monticola and S. planifolia tend to be co-dominant below 2900 m (~9500 feet), while S.
planifolia dominates above this elevation (Cottrell 1995). The remainder of this section
covers what is currently known about willow and the effects of elk on the core winter range
in RMNP. Little is known about willow communities in the Kawuneeche Valley or alpine
tundra areas (see the “Alpine Tundra” section below). Willow in the Kawuneeche Valley
area appear to be heavily browsed by elk and moose, but widespread willow measures have
not been made and the relative effects of each ungulate cannot be determined at this time.
Willow Distribution in RMNP – Reports from the late 1800s suggest Moraine Park used to
have more extensive willow and riparian shrub cover than it did in the 1930s and 1940s; it
was apparently reduced by 1900 because many areas were drained and cut down for haying
purposes as the area was settled (Gysel 1960).6 There was also considerable development
(e.g., lodges, a golf course) in Moraine Park, Beaver Meadows, and Horseshoe Park as late as
the 1960s (Buchholtz 1983). However, these effects were not quantified, and only the recent
history of willow distribution is known for Moraine Park and Horseshoe Park.
Over the past 50 to 60 years, riparian shrub cover (assumed to primarily be willow) has
declined by approximately 20% in Moraine Park and Horseshoe Park. Willow declines in
Moraine Park are visibly correlated to a large reduction (69%) in surface water, caused by an
almost complete loss (>90% decline) of the area’s beaver population since 1940 (Packard
1947, Peinetti et al. 2002, Zeigenfuss et al. 2002). Beaver are highly effective at building
dams which create ponds and additional stream channels. Because willow growth and
survival in RMNP are primarily dependent on ground water from streams and snowmelt
instead of rainfall (Alstad et al. 1999), it is not surprising that large expanses of willow have
died where streams have become totally dry and water tables have undergone dramatic
decreases. Many stream channels in Moraine Park that were filled with water and bordered
by live willow in 1937 are now dry with large, dead willow on the old stream banks.
Willow declines in Horseshoe Park are largely due to the Lawn Lake Flood (Peinetti et al.
2002), an unnatural flood event that occurred when a man-made dam that was constructed in
1903 breached in 1982. This flood caused 831,000 m3 of water to cascade down Roaring
River and into Fall River, which runs through the middle of Horseshoe Park. The largest
flood-related effect in Horseshoe Park was the deposition of over 750,000 tons of rock at the
confluence of Roaring River and Fall River (Jarrett and Costa 1993). This resulted in an
alluvial fan which created a new lake directly upstream. Existing willow in these areas were
either destroyed by the alluvial fan or flooded out by the new lake (too much water can also
kill a willow due to anaerobic soil conditions). Downstream, the flood was dispersed into
meadow areas and was not large enough to significantly alter the hydrology of Fall River and
the Horseshoe Park area (Jarrett and Costa 1993). However, Peinetti et al. (2002) attribute
some loss of willow in downstream areas to direct removal by flood waters. Horseshoe Park
6 Moraine Park was originally named Willow Park (Buchholtz 1983).
35
has also experienced a large decrease (47%) in surface water, due in part to a 90% decline in
the beaver population (Zeigenfuss et al. 2002). This has also likely contributed to the decline
in willow, though not to the extent as in Moraine Park.
Willow Growth and Size in RMNP – Although surface water is correlated with willow
presence on the winter range (Peinetti et al. 2002), the size and morphology of existing
willow plants on the elk winter range in RMNP is primarily determined by elk browsing. Elk
browsing levels on the winter range were found to significantly reduce willow height
(Peinetti et al. 2001, Zeigenfuss et al. 2002), volume (Peinetti et al. 2001), and the number of
leaves per stem (Peinetti et al. 2001) when compared to willow inside ungulate exclosures.
Elk browsing was found to have a greater effect over the long-term: Schoenecker et al. (2004)
found willow volume and height to be 98% greater inside versus outside a 35 year-old
ungulate exclosure located in Beaver Meadows.
Areas once dominated by tall willows (at least two meters in height) on the core winter range
are now dominated by short willows (less than a meter). Peinetti et al. (2002) suggests the
decline in tall willows is due to the combined effects of a drastic decrease in surface water in
Moraine Park and the Lawn Lake Flood in Horseshoe Park followed by elk browsing levels
that are preventing small willow plants from growing beyond one meter (~3 feet). At least
two other factors are facilitating a further conversion to a short willow community. First, as
the few beaver that still exist in Moraine Park and Horseshoe Park select and cut down tall
and relatively unbrowsed willow for food (Baker et al. 2004), elk browse the plants and keep
them in a short stature (less than 30 cm). This creates a lack of food for beaver and results in
a feedback mechanism that reduces beaver and willow populations (Baker et al. 2005).
Second, antler rubbing during the fall can also tear down a tall willow plant. These shorter
willows are then suppressed by current elk browsing levels.
Singer et al. (2002) observed elk consumption and density to be strongly correlated to willow
growth, morphology, and size. Willow growth and size were optimized when elk consumed
approximately 21% of the biomass and was negatively effected when elk consumed more
than 37% of the biomass. Optimal willow growth refers to the maximum observed willow
production in the presence of elk herbivory, which was greater than ungrazed willows.
Negative willow growth represents a 40% decline in most components of willow growth
from maximum growth levels. Elk densities >32 elk/km2 generally resulted in a 40% decline
in willow size and growth parameters. However, the relationship between willow
consumption rates, elk densities, and willow growth varies greatly across the winter range
(e.g., Peinetti et al. 2002, Singer et al. 2002, Zeigenfuss et al. 2002) and meaningful increases
in willow growth may require elk densities lower than 15 elk/km2. Increases in willow
growth at or below 30 elk/km2 are not highly correlated and difficult to ascertain from Singer
et al. (2002) due to a lack of data for willow stands with 10-30 elk/km2. Willow growth is
also site specific; Peinetti et al. (2001) and Zeigenfuss et al. (2002) found differences in
willow growth rates between Moraine Park and Horseshoe Park.
The effects of elk on willow production (i.e., new biomass grown by the plant each year)
have not been clearly shown. Comparing browsed and unbrowsed plants in exclosures,
36
Zeigenfuss et al. (2002) found elk significantly reduced willow production after four years.
Peinetti et al. (2001) did not this; browsed plants were smaller, but similar in overall biomass
production because they produced longer, thicker shoots in the lower levels of the plant
canopy. The discrepancy between these studies are likely due to differences in the time of
study and methods utilized. More importantly, both studies clearly found elk herbivory to
greatly reduce willow size and vigor (Peinetti et al. 2001, Zeigenfuss et al. 2002).
Shallower water tables (i.e., closer to ground level and more beneficial to the roots of a plant)
were found to have a positive correlation to willow size, but the effect was minimal when
compared to elk browsing effects (Singer et al. 2002, Zeigenfuss et al. 2002).7 In general,
water tables near streams on the elk winter range do not fall below one meter during the
growing season (Zeigenfuss et al. 2002, Cooper et al. 2003). The roots of established willow
plants (at least 3-4 years old) should be able to easily reach these ground water depths.
However, Menezes et al. (2002) suggested that, in non stream-side plants, the level of elk
browsing during the mid to late 1990s was decreasing the ability of willow roots to reach
groundwater sources (note: this was based on isotopic differences between stream-side and
non stream-side water signatures that were considered significantly different by the author
based on P-value of 0.099). Menezes et al. (2002) and Peinetti et al. (2001) suggest that this
is due to willows on the winter range overcompensating C to their aboveground willow parts
(stems, leaves) in response to high levels of herbivory, resulting in less C allocation to the
belowground plant components (roots) and a decreased ability of the plants to reach deeper
water sources. Stream-side plants were still able to reach groundwater because they were
located in areas with more shallow water tables (Menezes et al. 2002). However, the relative
effects of elk and water are exhibited by the finding that many stream side plants with
excellent water availability are in poor condition due to the effects of elk browsing (Peinetti
et al. 2002, Zeigenfuss et al. 2002, Cooper et al. 2003).
Willow Reproduction in RMNP – Cooper et al. (2003) found that willow seeds are currently
the principal method of willow establishment on elk winter range areas in RMNP, with little
to no reproduction occurring via willow stem fragments. There are currently very few beaver
on the elk winter range and it is possible that greater population numbers could increase the
role of vegetative establishment. It is also notable that two of the three landforms that create
suitable seed sites in RMNP are created by beaver activity (abandoned beaver ponds and
abandoned channels or ox-bows). An increase in beaver would likely increase the
reproductive capabilities of willow either directly through vegetative propagation or
indirectly through creating appropriate sites for seedling establishment.
Even though seedling establishment is currently the principal method of willow reproduction
on the elk winter range, it is severely inhibited by a lack of seed rain and seedling survival,
primarily due to the effects of herbivory (Gage and Cooper 2005). Even when seedlings have
7 Note that the previous study by Peinetti et al. (2002), which suggested declines in surface water are correlated
with declines in willow distribution, examined the entire winter range. The studies in this section (Singer et al.
2002, Zeigenfuss et al. 2002) examined existing willow plants near streams. Thus, these areas have not been
largely affected by the decline in beaver because water tables remain elevated throughout the year (due to their
proximity to water sources).
37
been established in recent decades, few to no willow plants have grown beyond a meter (~3
feet) (Peinetti et al. 2002, Zeigenfuss et al. 2002, Cooper et al. 2003). Cooper et al. (2003)
found no relationship between willow age and height, and thus small, single willow stems
that appear to be newly established or young plants cannot be assumed to be recent
colonization (as suggested by Peinetti et al. 2002).
The SAVANNA model predicted willow cover on the winter range in the park to be almost
three times greater prior to European American settlement or undisturbed conditions (higher
water tables, with wolves) versus current conditions (lower water tables, no wolves, greater
levels of herbivory). Undisturbed willow cover was found to be similar to the maximum
amount of potential willow cover (no elk or deer). These results suggest willow cover did
not exhibit an increase when elk were extirpated, and that initial declines in willow likely
started when areas such as Moraine Park were developed (Gysel 1960). Willow declines
continued over the last 50-60 years due to greater foraging pressure from elk and loss of the
areas beaver population. These declines and complete losses of willow riparian areas on the
core winter range are expected to continue until elk population size or density is reduced in
willow riparian areas on the core winter range (Gage and Cooper 2005).
Willow cover has also been found to be highly dependent on water table levels. The model
assumed that, primarily due to the loss of beaver, current water table conditions are lower
than they were historically. Under such conditions, even if the elk population were reduced
and all willow riparian areas were fenced off, willow would only be able to regain half of its
(pre-1860) level of cover (Coughenour 2002). This indicates a need for a diversity of
management actions to attain an even partial recovery of willow on core winter range areas, a
conclusion supported by several empirical studies conducted in RMNP (Baker et al. 2004,
Baker et al. 2005, Gage and Cooper 2005).
Bitterbrush and Sagebrush
Bitterbrush and Sagebrush Ecology – Bitterbrush and sagebrush are found on arid plains and
slopes throughout the Rocky Mountains. Natural disturbances such as fire and browsing can
greatly affect the growth and reproduction of both shrubs. Bitterbrush has a greater tolerance
to fire because it can resprout from previously existing plants if the fire is not too intense
(Blaisdell and Mueggler 1956). Conversely, sagebrush plants are easily killed by fire and can
have trouble re-establishing themselves because they only reproduce by seed (Kershaw et al.
1998, Wambolt 1998, Wambolt et al. 2001). Recovery rates to previous levels for both
species following fire can range from just a few years resulting in a rejuvenated shrub
community to over 30 years (Bunting et al. 1985, Wambolt et al. 2001).
Bitterbrush is also more resistant to browsing than sagebrush due to plasticity in growth rates
and resource allocation traits (Bilbrough and Richards 1993). Both plant species are very
important diet components for deer in RMNP, and to a lesser extent elk (bitterbrush makes
up 3-6% of elk diet), because they maintain higher protein levels than grasses (Kufeld et al.
38
1973, Stevens 1980a, Hobbs et al. 1981).8 If large ungulate browsing follows fire events, it
can often result in long-term or permanent shrub loss (Wambolt et al. 2001). Small mammals
have also been found to feed extensively on bitterbrush seeds (Martin et al. 1951) and can
have a large, detrimental effect on bitterbrush recruitment (Clements and Young 1996).
Bitterbrush and Sagebrush in RMNP – The distribution of bitterbrush and sagebrush on the
winter range at the time of settlement is unknown. By the time shrub communities in RMNP
were first studied in the 1930s they had been significantly altered. Market hunting during the
1860s and 70s significantly reduced elk and deer numbers, likely allowing upland shrubs to
expand, but fires in ponderosa pine forests during the 19th
century (Veblen et al. 2000, Ehle
2001) and an expanding deer population in the early 1900s (Stevens 1980a) may have also
greatly decreased shrub abundance.
By the 1930s, managers in RMNP concluded that the deer population was having a large,
negative effect on upland shrubs (Grater 1945). Deer started to decline in the 1940s, and this
was further facilitated by National Park Service reduction programs. Gysel (1960) suggested
that sagebrush continued to decline even as deer were reduced. No quantitative data was ever
collected on upland shrubs so even less is know about any changes in bitterbrush production
or distribution.
Zeigenfuss et al. (2002) did not find herbivory by elk and mule deer to affect bitterbrush
production or size through four years of study. Resprouting of bitterbrush was observed in all
sites after prescribed fire treatments. Fire reduced bitterbrush size in the first and second year
after burning and production in the second year, suggesting additional plant mortality took
place during the first year after the fires (Zeigenfuss et al. 2002). Nesvacil and Olmsted
(2003) found that bitterbrush canopy area, volume, and estimated annual production
remained low six and seven years post-burn, while total shrub canopy area, volume and
annual production only differed due to grazing (P < 0.10). This suggests that bitterbrush can
resprout adequately after burning, but the current levels of herbivory in RMNP are impeding
regeneration and growth (Nesvacil and Olmsted 2003).
Schoenecker et al. (2002) found upland shrub production, primarily sagebrush, to be 67%
greater inside versus outside 35 year-old exclosures. Similarly, grass biomass was reduced
by 32% outside upland shrub exclosures.
Herbaceous Communities on the Winter Range
Up to 70% of an elk’s diet in RMNP during winter is graminoids (Hobbs et al. 1981, Singer
et al. 2002). However, the effects of elk on herbaceous production on the core winter range
are equivocal. Zeigenfuss et al. (2002) observed herbaceous production in willow
communities to be significantly reduced (18-29%) in 1998 (the last year of their study); but
they also observed herbaceous production was higher in grazed versus ungrazed sites in 1994,
1995, and 1996 (this was statistically significant in 1994 and 1995, P < 0.10). The difference
8 Upland shrubs are particularly important to deer because they are the majority (up to 75%) of their diet (Kufeld
1973). See the Ungulate section for more information.
39
between 1998 and the other years could be due to the fact that all other previous years had
above average precipitation. Studies in Yellowstone have found that elk only affect
herbaceous communities in years of drought (Singer et al. 1998b). Thus, elk may have
greater affects in RMNP when precipitation is average or below-average.
Annual herbaceous consumption rates averaged 55% in willow communities and 60% in
upland shrub communities on the core winter range. The majority of consumption occurred
during summer in willow areas and winter in upland areas (Singer et al. 2002)9. Singer et al.
(2002) reviewed herbaceous plant consumption rates for a variety of ecosystem types around
the world. Mountain bunchgrass steppe and mixed grass prairie communities, the most
comparative systems to RMNP, were able to withstand consumption rates of 40%, but not
60%. This indicates the consumption rates in RMNP may be large enough to alter
herbaceous communities in RMNP (Singer et al. 2002). Herbaceous plants in willow
communities are particularly vulnerable because the majority of grazing is occurring during
the growing season (Augustine and McNaughton 1998).
Recent experimental studies have documented a number of individual plant species that are
being affected by herbivory. In willow riparian areas, Zeigenfuss et al. (2002) found grazed
sites had more goldenrod species (Solidago spp.) and exclosed sites (ungrazed) had more
bluebell (Mertensia ciliata) after four years. There was also more bare ground (4.6% greater)
and grass cover (10.8% greater) on grazed versus ungrazed willow sites, but these differences
were not statistically significant (Singer et al. 2002). In upland bitterbrush sites, Zeigenfuss
et al. (2002) found ungrazed sites had a higher percent cover of prairie sage (Artemisia
ludoviciana) and sulphur buckwheat (Eriogonum umbellatum) after four years. In 35 year-
old exclosure sites, which covered a variety of habitat types, grazed areas had 6.4% more
bare ground than ungrazed areas, but differences were not statistically significant (Singer et
al. 2002).
Using David R. Steven’s long-term data set, Zeigenfuss et al. (1999) found the non-native
grass Phleum pratense (known as timothy) increased significantly (by 54%) in meadow areas
on the winter range from 1968-1992. Phleum commutatum is highly palatable to elk, very
productive, and has the ability to take over large areas of land because it is resilient to grazing
and other types of disturbance. Other significant changes over this time include an increase
in the coverage of forbs, Carex spp., lichens, and mosses, and bare ground in grassland areas.
There is little other evidence to suggest that non-native or invasive plant species are being
greatly facilitated by elk grazing. Studies by Singer et al. (2002) and Zeigenfuss et al. (2002)
found few significant differences in plant species composition due to herbivory in willow
riparian and upland bitterbrush habitat types. Schell and Stohlgren (1997) and Stohlgren et
al. (1999) examined plots inside and outside of several 35 year-old exclosures on the elk
winter range in RMNP (and other areas) and did not find grazing to accelerate the spread of
exotic plant species. They concluded soil quality, climate, and disturbance have much greater
9Note: During certain times of the year, especially the spring, deer also consume herbaceous plants.
However, they are primarily browsers (Kufeld et al. 1973) and are not likely having a large effect on
herbaceous communities.
40
effects on plant species composition than grazing. Stohlgren et al. (1999) found that elk,
even when present at a very high density, reduce non-native plant species coverage.
However, this study was conducted at a much larger scale than RMNP and it is difficult to
ascertain if such conclusions hold true for an elk population at extremely high densities (>100
elk/km2).
Coniferous Forest Communities in RMNP
There are three major forest communities in RMNP: 1) ponderosa pine, with some Douglas
fir and lodgepole pine, found only on the east side of the park ranging from approximately
2,450 to 2,800 m (~8,000 to 9,200 feet) in elevation; 2) lodgepole pine ranging from 2,500 to
3,100 m (8,200 to 10,200 feet); and 3) subalpine forests, consisting of Engelmann spruce
(Picea engelmanii) and/or subalpine fir (Abies lasiocarpa), ranging from 2,800 to 3,500 m
(~8,000 to 11,500 feet) (Fig. 2). The latter two, higher elevation forest types, are primarily
affected by fire and climate and are generally considered to be within their natural range of
variability (Sherriff et al. 2001). Elk populations have a minimal effect on these lodgepole
and subalpine forests as they are not an important food source in RMNP (Hobbs et al. 1981,
Larkins 1997, Singer et al. 2002).
Ponderosa pine forests make up a large proportion of the elk winter range in RMNP. Fire has
historically played a major role in the maintenance of healthy ponderosa pine forests
throughout the Rocky Mountains (Arno 1980). Periodic fires - both lightning caused and
those set by Native Americans - were believed to be the major factor underlying the mosaic
of forest ages and densities that were typical of ponderosa pine communities in RMNP prior
to the arrival of European Americans.
Fire return intervals for ponderosa pine forests in RMNP vary widely, averaging between 20
and 60 years but ranging from as little as one to as much as 300 years (Rowdabaugh 1978,
Mast et al. 1998, Ehle 2001). Ehle (2001) found small fires to occur every one to 120 years
and large fires to occur every 200 to 300 years. Large fire events have a longer time interval
because the trees must attain a certain size and density before they can support crown fires
that spread over a large area. Ehle (2001) concluded that ponderosa pine communities in
RMNP historically underwent large fire events that cause extensive tree mortality and led
(directly or indirectly) to regeneration, followed by small surface fires that caused small
patches of tree turnover and created a heterogeneous landscape over time. This is consistent
with the findings of Veblen et al. (2000), who examined upper elevation ponderosa pine
forests adjacent to RMNP. The fire regime suggested by Veblen et al. (2000) and Ehle
(2001) would have resulted in a wide variety of stand ages and densities in the ponderosa
pine forests in and around RMNP. This contrasts with low elevation ponderosa pine forests
along the Colorado Front Range and in the southwest U.S., where forests were maintained in
an open park-like forest structure due to frequent low-intensity surface fires that affect a large
proportion of the forest (Veblen et al. 2000).
Past fire scars from ponderosa pine forests in and adjacent to RMNP appear to show an
increase in fire activity in the 1800s largely due to logging activities and other human
41
ignitions (Rowdabaugh 1978, Mast et al. 1998). Because of these activities, we cannot be
sure that pictures taken at this time reflect the conditions that existed prior to European
American settlement (Clements 1910, Veblen and Lorenz 1991). Fire increases during the
19th
century followed by the fire suppression efforts of the 20th
century have generally worked
in combination to create many dense, single aged stands (Veblen et al. 2000). Ehle (2001)
concludes that a more heterogeneous forest would more closely resemble the forests found
prior to European American settlement. However, long periods of time without small or
large fires may also be possible in RMNP and dense stands are not necessarily unnatural
(Veblen et al. 2000, Ehle 2001).
Although ponderosa pine forests make up a large proportion of the elk winter range in
RMNP, dense even-aged stands provide little forage for elk (Hobbs et al. 1981, Singer et al.
2002) and likely have little effect on elk populations. More heterogeneous ponderosa pine
savannahs would likely produce additional forage for elk, but it is difficult to quantify the
effect they would have. It has been suggested that fire suppression is allowing ponderosa pine
trees to expand into and overtake some of the meadows that make up the core of the elk
winter range and their primary forage base. This could potentially lead to a significant
decrease in elk forage, but no formal research has been conducted on this subject. Historic
and current photos do show that stands of ponderosa pine are more dense, and it may appear
that they now occupy former meadows. However, the pure grassland areas (e.g., Moraine
Park, Horseshoe Park, Beaver Meadows) that make up the primary feeding areas for elk on
the winter range have not been encroached on by trees (Veblen and Lorenz 1991).
Alpine Tundra
A complete description of plant types found in alpine tundra areas can be found above and in
Appendix 1. Very little work has been done on the effects of elk on plant species
composition in alpine tundra areas. Zeigenfuss et al. (1999) found willow declined in height
and coverage from 1968 to 1992, but herbaceous coverage remained stable. Stevens (1980b)
reported that all the major cover species, except curly sedge (Carex rupestris), decreased in
cover and frequency in the 1970s. It cannot be determined if such changes are due to elk
because ungrazed areas were not available for comparison. However, Singer et al. (2002)
recently found that willow can constitute over 50% of an elk’s diet during the summer in the
alpine areas of RMNP, suggesting that the effects of elk in alpine areas need to be further
explored.
Summary
It is clear that elk do not affect the majority (>95%) of aspen in RMNP. Persistence of aspen
throughout the park is primarily dependent on fire or other disturbances that open up
coniferous forest canopy and allow aspen stands to recruit new trees. On the core winter
range, however, elk are the proximate factor preventing new aspen tree establishment. There
is no definitive evidence that aspen are a long-term feature of the core winter range, but
research conducted elsewhere indicates that aspen stands in the western U.S. have been
present for hundreds of years. Under current levels of herbivory, all of the research indicates
42
that aspen stands on the core winter range will be extirpated or reduced to a shrub-like state.
There remains uncertainty as to what population size or density of elk is compatible with
aspen regeneration and growth on the core winter range. At a minimum, the number of elk
on the core winter range will need to be less than 600. Modeling indicates the density of elk
will need to be reduced to <4-15elk/km2 to achieve any tree recruitment on the core winter
range.
Willow distribution on the core winter range of RMNP has been negatively affected since the
area was settled. Recent declines are attributed to reductions in surface water, due to a
continual decline of the area’s beaver population; and high levels of browsing by an elk
population at ecological carrying capacity. New willow are unable to be established due to
the limited distribution of mature seed producing plants, lack of suitable seed sites, and high
levels of elk herbivory. Vegetative reproduction is severely limited by too few beaver in the
area. Established willow plants cannot survive or grow to produce seeds due to the levels of
elk browsing. Thus, as the remaining tall, seed-producing plants are cut down by beaver, elk
suppress their growth and lead to further willow and beaver declines. At a minimum, elk
densities need to be reduced from current levels of over 100 elk/km2 in some areas to <15-30
elk/km2 to allow willow to grow beyond the reach of elk and become viable, seed producing
plants. This alone, however, is not enough to ensure willow reproduction or expansion on
the willow range; beaver activities and surface water flows also need to be restored to create
appropriate seed and vegetative reproduction sites and facilitate willow growth.
Herbivory by elk and deer has not been found to have a large, negative impact on mature,
existing bitterbrush and sagebrush plants. However, in combination with the current levels of
herbivory, fire can have severe, negative effects on both species. Sagebrush is intolerant of
fire regardless of subsequent browsing levels. Bitterbrush can adequately resprout following
a fire; however, fire will have a large, negative impact on bitterbrush until browsing pressures
are alleviated. The relative effects of elk and deer on upland shrubs on the winter range are
unknown.
Herbaceous consumption rates by elk on the winter range in RMNP are extremely high and
exceed many areas in North America. Research to date indicates that this has not led to a
widespread, increased incidence of invasive species in herbaceous communities on the winter
range. However, the large increase in the non-native timothy should be a concern to
managers. Several other trends have also been attributed to elk grazing: prairie sage, sulphur
buckwheat, and bluebell have decreased; and goldenrod species and bare ground have
increased.
Elk populations have a minimal effect on the coniferous forests of RMNP. None of the
trends in alpine tundra areas can be directly attributed to elk due to the lack of experimental
data; however, the high percentage of willow in the diet of elk during summer in alpine areas
and negative correlation between increased elk numbers and decreased willow height and
coverage is reason for concern and should be further studied.
43
UNGULATE INTERACTIONS
Mule deer, bighorn sheep, and moose also inhabit RMNP. These ungulates are spatially
segregated from each other for most of the year: moose primarily occur on the west side of
the park during the summer in the vicinity of the Kawuneeche Valley; mule deer occur
throughout the park in summer, but in winter are only found on the east side of the park near
or overlapping with elk winter range areas; and bighorn sheep are found in several mid to
high elevation areas throughout the course of the year (Fig. 10). Elk considerably outnumber
these ungulates in and near the park (at a ratio of 100 elk: 17 deer: 17 bighorn sheep: 1
moose) and overlap extensively with all of them due to their distribution, population size, and
large seasonal migrations (Figs. 3, 7). This section reviews the status of mule deer, bighorn
sheep, and moose in the park and discusses how elk interact and potentially compete with
these ungulates.
Ungulates may compete for forage if two species overlap in diet and range use, and if one or
both of their levels of consumption are large enough to limit available forage (e.g., Hobbs et
al. 1996a, Hobbs et al. 1996b). If competitive effects are strong enough and favor a
particular ungulate at the expense of another, this can affect the production, distribution, or
population size of another species (Hobbs et al. 1996a, Hobbs et al. 1996b, Forsyth and
Hickling 1997). Such interspecific competition for resources may be entirely natural and
appropriate in some ungulate grazing systems. However, if a competitively dominant species
becomes overabundant, it could lead to changes considered to be outside the natural range of
variation.
Mule Deer
The number of mule deer that inhabited the RMNP area before 1915 is not known, but it is
clear that mule deer were heavily hunted and suffered large declines throughout Colorado and
the RMNP area during the late 1800s and early 1900s (Stevens 1980a, Colorado Division of
Wildlife 1999). Colorado responded to these declines by closing the state to hunting in 1913.
With the creation of RMNP, which also instituted programs to control predators and stop
poaching, deer numbers in the park increased to as many as 1,400 in the winter of 1938 (Fig.
5; Stevens 1980a).10
The number of deer on the east side of RMNP appeared to start declining in 1939 or 1940,
declines that were further facilitated by the NPS deer and elk reduction program from 1943 to
1968. Deer were reduced by NPS to “improve range conditions” on the east side of the park.
Deer numbers appeared to continue to decline even after reductions were terminated in 1968
(Fig. 5). This is not unique to the RMNP area, as the entire western U.S. has observed a
continual decrease in mule deer numbers since at least the 1970s (Colorado Division of
Wildlife 1999). Estimates conducted from 2001 to 2003 during winter indicate the mule deer
10
Stevens (1980a) notes that there is no way to determine the accuracy of this estimate because there is no
documentation on how the surveys were conducted. However, it is clear there were many more deer during the
1930s than the late 1800s and early 1900s.
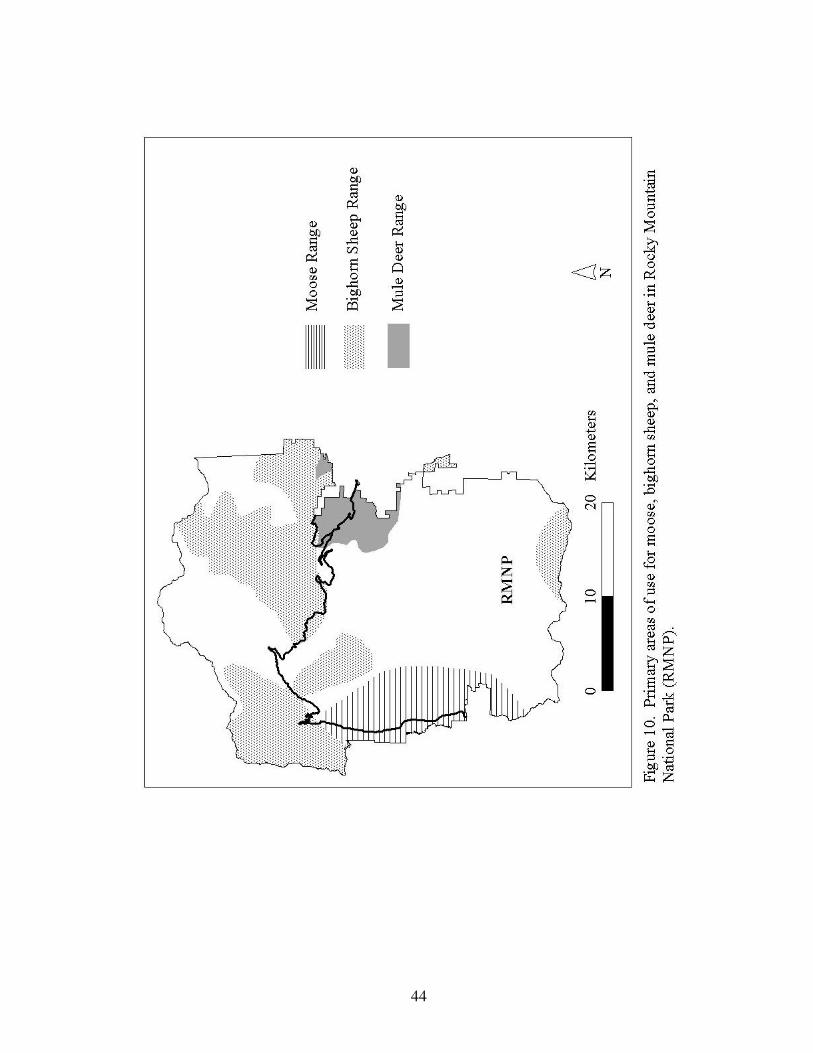
44
45
population in the Estes Valley decreased from 833 (95% C.I.; 659-1,048) to 561 (498-632)
(Fig. 5; Conner 2004). Recent population estimates from 2004 and 2005 indicate deer have
not declined further (M. Watry personal communication).
Competition with Elk – Kufeld et al. (1973) summarized the diet of mule deer in the Rocky
Mountains and found it is largely composed of browse (shrubs and trees) and forbs
throughout the year, with a low to moderate use (~20%) of graminoids (grasses) in the spring.
In the winter, deer must rely heavily on browse and cannot subsist on dry, senescent grasses
(Colorado Division of Wildlife 1999). Conversely, the diet of elk in RMNP can encompass a
wide variety of species in a wide variety of habitats, and they can greatly increase their intake
of browse species when grasses are unavailable or the nutritional content of grasses becomes
less than browse (Hobbs et al. 1981). Such conditions commonly occur during winter, a
drought, or when an ungulate reaches its food limited carrying capacity (Hobbs et al. 1981,
Forsyth and Hickling 1997). This is important because it is during these periods when deer
exhibit their greatest need for browse (Kufeld et al. 1973). Elk are also larger than deer and
can displace deer from preferred feeding areas (Colorado Division of Wildlife 1999).
Because elk are competitively dominant, at carrying capacity on the core winter range, and
overlap considerably with mule deer during winter (Figs. 3, 10), it is likely that elk are having
a negative impact on mule deer production and population size (Colorado Division of
Wildlife 1999; see also Hobbs et al. 1996a, Hobbs et al. 1996b, Forsyth and Hickling 1997).
This is supported by Coughenour (2002) and the observation that deer numbers and use
continued to decline while elk numbers and use increased in the best deer habitats (upland
shrub) after the RMNP control program was terminated (Zeigenfuss et al. 1999). In general,
elk and deer population estimates over the last 50-75 years from RMNP are inversely
correlated (Figs. 4, 5, 8).11
The SAVANNA model indicated that under natural conditions and with wolves present in
RMNP, deer populations on elk winter range areas would be limited to approximately 200
animals. The model also predicts that without wolves, deer would be limited to a similar
population size through competition with elk (Coughenour 2002). However, the latter
scenario (limitation by competition with elk) results in deer that are not as healthy as a
predator limited population.
Chronic Wasting Disease – Live deer can be tested for the disease by taking a tonsilar biopsy
in the field and analyzing the sample in a lab. This has allowed RMNP and the Colorado
Division of Wildlife to determine that prevalence of the disease inside and adjacent to the
park is 5.4% (Conner 2004).
Simulation modeling predicts CWD has the potential to cause drastic population reductions
in deer (Miller et al. 2000, Gross and Miller 2001). However, this does not mean the
11
It is important to note that the initial decline in the mule deer population size in the late 1930s and early 1940s
is believed to be due to an overpopulation of mule deer reducing their own forage base (Stevens 1980a).
However, continued declines throughout the 20th
century in conjunction with an increasing elk herd suggest that
elk may now be competing with and affecting mule deer.
46
population declines in mule deer over the last 50-70 years are due to CWD, as mule deer
have declined throughout Colorado and the western U.S., including areas where CWD have
not been documented (Colorado Division of Wildlife 1999).
Bighorn Sheep
Prior to 1880 bighorn sheep were reported to be abundant and occupy a much greater area in
RMNP than they currently do (Ratcliff 1941b, Packard 1939). Ratcliff (1941b) suggested
there may have been as many as 4000 sheep in the park during the early 1800s, but there is no
way to assess the accuracy of this estimate. Initial population declines began in the late
1800s due to market hunting and continued sporadically through the 1950s due to a number
of factors, including competition with livestock, disease, and development (Packard 1939,
Packard 1946, Goodson 1978).
Bighorn populations were apparently stable or increasing from the 1960s to the 1980s.
Bighorn population size on the west-side (Never Summer and Continental Divide areas) was
estimated to be 124 in 1975-76 and between 452-502 in the late 1980s. Population size on
the east-side (i.e., Mummy Range) was estimated to be 81 in 1975-76 and 200 in the late
1980s (Bailey 1990, Goodson and Stevens 1991).
There is anecdotal evidence of pneumonia induced dieoffs occurring in both herds during the
mid 1990s, and recent research and park observations support this assertion. West- and east-
side bighorn populations in 2003 were estimated to be 289 and 78, respectively, and both
herds tested positive for multiple pathogens believed to be related to sheep dieoffs due to
disease (McClintock 2004). In addition, a young ram from the Mummy Range herd was
observed coughing and later found dead due to pneumonia in summer 2001, and low lamb
counts have occurred since the mid 1990s (RMNP unpublished data). Such findings are
typical of herds undergoing or previously affected by pneumonia epizootics, which are
considered the greatest threat to bighorn sheep populations in North America (Bailey 1986;
Coggins 1988; Ryder et al. 1992; Cassirer et al. 1996; Jorgenson et al. 1997, Monello et al.
2001).
Competition with Elk – Bighorn sheep are primarily found at higher elevations in the park
(Figs. 2, 10) and elk only use these areas during the summer and fall (Figs. 3, 7). Capp
(1967) and Harrington (1978) examined summer range use by elk and bighorn sheep in alpine
areas of RMNP and found bighorns and elk were spatially segregated: bighorns tended to use
steep, rocky slopes while elk used open meadow areas. Capp (1967) and Singer et al. (2002)
found elk in alpine areas to primarily consume forb and browse (Salix spp.) species in the
summer, while bighorns primarily consume grasses (Capp 1968). Similarly, Singer and
Norland (1994) found no evidence that elk have had any effects on bighorn sheep populations
in Yellowstone since the onset of natural regulation.
Competition in RMNP cannot be completely ruled out as the population size and range use of
elk has increased considerably since the study periods of Capp (1967) and Harrington (1978),
sheep and elk diets overlap (Singer and Norland 1994), and elk are capable of displacing
47
sheep from preferred feeding areas (Goodson 1978). Other unevaluated factors, such as
increased forest density due to fire suppression, may also be contributing to loss of habitat
and lower bighorn numbers. However, competition with elk and other unevaluated factors
are likely of little importance compared to disease issues.
Moose
Moose in Colorado are at the southern limit of their distribution in the U.S. Historically,
moose were not common in Colorado or RMNP. There is only one recorded historic
occurrence of a moose in RMNP; Estes (1939) reported killing a moose in Moraine Park in
1860. In 1978-79, the Colorado Division of Wildlife introduced 24 moose to the North Park
area, located about 30 km west of RMNP, in order to establish a viable resident moose
population for hunting purposes. The estimated population size reached 100 by 1986, and a
moose was first observed in RMNP in 1980, two years after the first animals were released.
Since then, moose observations in RMNP have continued to increase, with the first winter
observations in 1985. Currently, the North Park population is estimated at 600 moose.
Moose primarily use RMNP and overlap with elk populations during summer, with an
estimated 100-120 animals using areas in or near the Kawuneeche Valley. Only about 60-70
of these moose stay all summer. Almost all moose leave the Kawuneeche Valley for North
Park (to the W of RMNP) by the end of September each year, although a few animals do
remain in the Kawuneeche Valley area during winter. Moose use the North Park area
because it is at a lower elevation, has warmer weather, and better forage conditions than the
Kawuneeche Valley area (J. Dungan personal communication).
While moose and elk may compete for forage in summer, most studies have found that
moose avoid competition via spatial separation. A study in the Gallatin River Valley in
Montana found moose distribution was primarily above and below the major elk distributions
and indicated that moose were not tolerant of large groups of elk (Peek and Lovaas 1968).
Jenkins and Wright (1987) found that winter moose and elk distribution was mediated in part
by snow depth, with moose being able to use areas with deeper snow than elk in Glacier
National Park, Montana.
Studies conducted in other areas suggest bears and wolves may limit the size and density of
moose populations and their localized effects on vegetation (Bergerud et al. 1983, Gasaway
et al. 1983, Ballard et al. 1987, Boutin 1992, McLaren and Peterson 1994, Peterson 1999; but
see Boutin 1992). The absence of wolves in RMNP could result in higher densities of moose
with greater effects on the plant community.
Summary
Mule deer numbers in the Estes Valley have declined dramatically since the 1940s. Currently
500-600 deer inhabit the area. Several lines of evidence suggest that elk are negatively
affecting deer through interspecific competition: elk are competitively dominant; at carrying
capacity and thus likely having an affect on winter browse species relied on by deer; and,
48
after ungulate reductions ended, deer numbers continued to decline while elk numbers
increased. SAVANNA also indicates deer populations in RMNP are suppressed by high elk
numbers via interspecific competition.
No research suggests that bighorn sheep and moose compete with elk at a level that has
population consequences. Disease is considered the most important factor influencing
bighorn sheep population dynamics in North America and RMNP. Moose primarily use the
Kawuneeche Valley area in summer and leave during winter. There is little evidence to
suggest they compete with elk in RMNP, but moose numbers would likely be lower if wolves
were present.
EFFECTS OF ELK ON BIODIVERSITY
This section outlines the most likely effects elk could be having on the diversity, distribution,
or population dynamics of animals or plants in the park. It focuses on birds, plants,
butterflies, and beaver because these groups and their interactions with elk have been studied
in RMNP. Effects on these species are usually indirect, in that elk may influence them
through competition for resources or alteration of habitat.
Birds
Over 250 bird species have been observed in the RMNP area. The large majority of these
birds are seasonal residents or migrants; only 26 species are considered to be common, year-
round inhabitants of the park. The most common birds observed in the park can generally be
split into four categories; ptarmigan (a grouse species), songbirds and neotropical migrants,
raptors, and waterfowl. This report only address the first two groups because data is
available to evaluate potential relationships with elk and they are most likely to be affected by
elk herbivory effects.
Ptarmigan – White-tailed ptarmigan (Lagopus leucurus) are a member of the grouse family
(Tetraonidae) and are known for their seasonal changes in plumage which vary from pure
white in the winter to a mottled brown in the summer. White-tailed ptarmigan (hereafter
ptarmigan) in Colorado primarily inhabit elevations above treeline and during the winter are
only found in areas where willow is a dominant or co-dominant plant species. Their diet is
dominated by willow buds, leaves, and twigs from October to June, but is more diverse
during the summer and includes herbaceous and browse species (May and Braun 1972). It
has been suggested that the population size of grouse species inhabiting arctic or subarctic
regions fluctuate in a cyclic fashion over the course of 7-10 years (Williams 1954), but this
has not been definitively shown for white-tailed ptarmigan (Choate 1963, Braun et al. 1991).
White-tailed ptarmigans have been studied since 1965 at two alpine study sites adjacent to
Trail Ridge Road in RMNP. During the 1970s, combined population numbers for these areas
fluctuated but remained above 100 birds. Since the early-to-mid 1980s yearly fluctuations
have continued, but the overall population declined to approximately 50-60 birds by 1999
(Braun et al. 1991, K. Giesen and C. Braun unpublished data). This decline was concurrent
49
with a decline in willow cover and an increase in elk population size, prompting Braun et al.
(1991) to suggest “heavy use of willow by elk in early winter and early spring constrains
ptarmigan breeding densities by reducing [the] amount of food (willow buds) available to
ptarmigan in late winter during the early breeding period when ptarmigan establish [breeding]
territories”. Conversely, Wang et al. (2002) found no relationship between elk population
size and ptarmigan population growth rates. They did find a significant relationship between
weather and ptarmigan, suggesting periodic increases in winter temperature over the last two
decades have been negatively associated with ptarmigan population growth rate. However,
the data presented in Braun et al. (1991) and Wang et al. (2002) is correlational and cannot be
used to infer cause and effect relationships between elk, willow, and ptarmigan. More
research is needed to determine if elk, climate, or both factors are influencing ptarmigan
populations.
Songbirds – At least 150 songbirds have been observed in the park. About 1/3 of these are
neotropical migrants, defined as birds that spend their winter south of the United States or
Tropic of Cancer. This classification and definition is taken from Connor (1993), who
included the neotropical migrant lists of both Colorado Partners in Flight and Cunningham
(1988). Neither list includes raptors such as the peregrine falcon (Falco peregrinus), even
though they winter in the tropics. Many neotropical migrants and songbirds also breed in
RMNP (Johnsgard 1986).
Songbirds and neotropical migrant diversity is greatest in aspen, riparian willow, and
ponderosa pine habitat in RMNP (Connor 1993, Turchi et al. 1994), which combined make
up 9% of the total park area. The core elk winter range areas in the park are very important
for songbirds because it contains the majority (55%) of these habitat types. Within RMNP,
the only other large, continuous portions of such habitat is in the Kawuneeche Valley, which
contains 9% of the park’s aspen and willow riparian habitat (source: RMNP GIS database).
Turchi et al. (1994) found bird species richness to be significantly higher in aspen than
conifer habitat, and percent shrub cover (0.5-2 m or 1.5 to 7 feet in height) within aspen
stands to be the single most important predictor variable for bird species richness in RMNP.
Lloyd (1997) surveyed bird species present in aspen stands on and off the winter range, and
found the mountain chickadee (Poecile gambeli) to be more abundant in stands located off
the winter range. He attributed this to the fact that mountain chickadees tend to inhabit
coniferous forests (Johnsgard 1986), which are much more abundant around aspen stands off
versus on the winter range. Zaninelli and Leukering (1998) and Duberstein (2001) suggested
live aspen trees are more important to cavity nesting birds than dead trees.
Several studies have suggested that different bird species use different sizes and densities of
willow and aspen; i.e., short and tall willow are both important (Zaninelli and Leukering
1998, Leukering and Carter 1999, Duberstein 2001). Anderson (2002) found a negative
relationship between elk use and understory volume of aspen stands and a positive
relationship between understory volume and bird abundance in the Jackson Hole area. In
willow stands, the abundance of several willow-dependent bird species was reduced in
willow stands that were proximate to elk feeding areas. Anderson (2002) attributed these
50
differences to the effects of elk herbivory. Willow-dependent bird species negatively affected
by proximity to elk herbivory included willow flycatchers (Empidonax traillii), yellow
warblers (Dendroica petechia), MacGillivray’s warblers (Oporornis tolmiei), fox sparrows
(Passerella iliaca), and song sparrows (Melospiza melodia). Thus, a localized conversion to
short willow in core winter range areas will likely result in localized decreases of bird
abundance and biodiversity.
The inability of upland shrubs to regenerate following fire due to elk herbivory has been
found to negatively affect green-tailed towhee (Pipilo chlorurus) nest survival (Jehle 2004).
Butterflies
Simonson et al. (2001) examined butterfly diversity in six different habitat types on the elk
winter range. They found butterfly diversity, richness, and uniqueness was highest in aspen
and wet meadow habitat types. The aspen habitat included two species listed as rare by the
state of Colorado. Other habitat types included in the study were dry meadow, ponderosa
pine, lodgepole pine, and burned ponderosa pine. Interestingly, Simonson et al. (2001) found
butterfly species richness exhibited a strong correlation to native as well as non-native plant
species richness. The decreased coverage of sulpherflower in grazed sites (Singer et al. 2002)
is a concern because it is an important host plant for a variety of butterfly species (R. Bray
personal communication).
Beaver
Beaver Ecology – Beaver are a keystone species that have profound effects on ecosystem
structure and function (Naiman et al. 1988). Beaver modify their environment by cutting
aspen and willow for food and construction material, and building dams that raise the water
table, trap sediment, and increase nitrogen availability to willow (Naiman et al. 1988, Baker
and Hill 2003). Beaver dams also slow current velocity, increase deposition and retention of
sediment and organic matter in their ponds, reduce downstream turbidity on floodplains,
increase the area of soil-water interface, elevate the water table, change the annual stream
discharge rate by retaining precipitation runoff during high flows and slowly releasing it
during low flows, alter stream gradients by creating a stair-step profile, and increase
resistance to disturbance (Naiman et al. 1988). Beaver foraging can alter species
composition, density, growth, and distribution of woody vegetation.
Willow species provide an important food source for beaver. Willow leaves are high in
protein content and are readily eaten during the summer. The bark of willow stems may be
the only source of winter food for beaver that live in locations where surface water freezes
during winter (Baker and Cade 1995). Beaver are central place foragers that cut and remove
entire stems at or near the ground surface. They often cut all stems from preferred shrubs
growing near their winter food caches, dams, and lodges, but become more selective as
foraging distances increase (Baker and Hill 2003).
51
Beaver cutting stimulates sprouting from below the cut. Beaver affect willow growth and
height in the intermountain west along with ungulate browsing (Singer et al. 1994) and site
conditions such as soil type, length of growing season, nutrient concentrations, and water
table height (Cottrell 1995, Peinetti 2000).
Beaver in RMNP – Beaver populations have declined dramatically in RMNP since 1940.
While multiple factors have likely contributed to beaver declines, the most significant cause
appears to be trapping that occurred in 1941 through 1949 (Baker et al. 2004). Along the Big
Thompson river in Moraine Park, populations steadily declined from an estimate of over 300
beavers in 1940 (Packard 1947) to 12 beavers in 1994 to 1998 (Zeigenfuss et al. 2002).
Beaver surveys and aerial photographs taken in 1999 revealed only one beaver colony in
Moraine Park. Declines or a complete absence of beaver has been observed throughout
drainages on the east side of the park. Most of the current beaver populations occur in areas
with low willow use by elk. Beaver are largely absent from areas with heavy use by elk, with
the east slope population in the park currently estimated to be ~40 beaver (Baker et al. 2004).
Similarly, in the Kawuneeche Valley, beaver numbers were estimated to be about 600 in
1949, and only 30 in 1999 (C. Westbrook unpublished data).
As mentioned previously, the >90% decline in beaver numbers in Moraine Park is correlated
with a large reduction (69%) in surface water and willow declines over the last 50 to 60 years
(Peinetti et al. 2002, Zeigenfuss et al. 2002). An estimated 90% decline in the beaver
population in Horseshoe Park has contributed to a large decrease (47%) in surface water that
has also likely contributed to the decline in willow (Zeigenfuss et al. 2002). The lack of
beaver is accelerating willow declines by inhibiting the development of appropriate sites for
willow seedling establishment and limiting recharge of the shallow aquifers in Moraine Park
and Horseshoe Park.
Baker et al. (2004) found that beaver in the park prefer relatively tall, unbrowsed willow and
select against short, hedged willow. The interaction of beaver cutting and elk browsing
strongly suppresses compensatory growth in willow, altering the structure and function of the
willow community and facilitating a conversion from tall willow to a short willow
community. As the few beaver that still exist in Moraine Park and Horseshoe Park cut down
the tall willow for food, elk browse the plants and keep them short (less than 30 cm; Baker et
al. 2005).
The decline in beaver has also reduced the reproductive capabilities of willow. Beaver are
important to willow reproduction in several ways. Two of the three landforms that provide
suitable sites for willow establishment by seed in the park — abandoned beaver ponds and
abandoned channels or ox-bows — are associated with the presence of beaver in an area
(Cooper et al. 2003). In addition, because there are currently very few beaver on the elk
winter range, little to no reproduction occurs via willow stem fragments. Beaver cuttings
allow willows to colonize areas that are suitable for willow growth but not seedling
establishment, and may be important on a landscape scale (Cottrell 1995). Existing willow
roots or stems cut by beaver can give rise to new shoots to become a new plant, which allows
willow to be maintained for long periods of time (100 years or longer).
52
Summary
There is little evidence that elk herbivory is negatively affecting white-tailed ptarmigan in
alpine tundra areas. However, several factors strongly suggest more research is needed
before the effects of elk can be discounted, including the negative correlation between elk
and ptarmigan numbers, high percentage of alpine willow in elk summer diets, and possible
declines in alpine willow coverages. Increased winter temperatures have also been suggested
to negatively affect ptarmigan population growth rates and must also be considered in any
future research.
Bird and butterfly diversity has been found to be highest in aspen, willow riparian, and
ponderosa pine habitat on the primary winter range. No studies have shown a direct effect of
elk on these animal species in RMNP, but the large impact of elk on these habitats on the
core winter range, which contains the majority of these habitats, should be a management
concern. In particular, these habitats support a distinct biological community at these
elevations that are not found elsewhere in the park because almost all other aspen and willow
stands are located at higher elevations in either coniferous forests or alpine tundra. The
mechanism by which elk are suggested to decrease bird abundance is via decreased live trees
in aspen stands and decreased structural complexity of shrubs in aspen and willow habitat. If
current trends continue it could lead to the local exclusion of several cavity nesting and
willow-dependent bird species.
Beaver declines in RMNP are believed to initially be due to trapping that began in the 1940s.
Beaver declines over the last 50-60 years contributed to a loss of water and willow on the
core winter range. Subsequent declines or lack-of-recovery of beaver is attributed to
competition with elk for food, in particular tall willow, which has a limited distribution on
the core winter range. As remaining tall willow on the core winter range are cut for food by
beaver, their subsequent regrowth is suppressed by elk. This is leading to further declines in
the beaver and willow populations.
NUTRIENT CYCLES
Nutrient cycles are considered important to ecosystem sustainability because depletion of
nitrogen (N) and soil organic matter reduces long-term plant productivity (Vitousek 1982)
and could result in a change in plant species composition (Schoenecker et al. 2004).
Schoenecker et al. (2002) used empirical measures and an ecosystem model (CENTURY) to
examine elk and their effect on the overall sustainability of winter range areas in RMNP.
They found N mineralization rates were lower in grazed versus ungrazed short willow sites
(P < 0.07), as were nitrate pools (P < 0.10). Schoenecker et al. (2004) also suggested elk are
transferring N away from aspen and at least some willow communities (e.g., short willow
communities). Nitrogen cycles in tall willow areas were not affected, and elk grazing did not
affect N cycles or pools in the upland shrub areas (Schoenecker et al. 2004).
53
CENTURY modeling indicated soil N concentrations on the winter range under the current
level of herbivory is expected to decline by less than 2% over the next 50 years (Schoenecker
et al. 2002). If the elk herd continues to increase, this could increase the loss of N to 2% or
slightly more, but it is unknown what effects such losses would have (if any) on the
biodiversity, abundance, or status of plant species on the core winter range.
Other empirical results have found little evidence of major effects of elk on nutrient cycles or
soil N concentrations on the core winter range in RMNP. Elk have been found to slightly
increase or decrease some soil and plant C and N concentrations, but no large, consistent
effects have been observed (Binkley et al. 2003, Menezes et al. 2001, Zeigenfuss et al. 2002).
The SAVANNA model predicted soil carbon (C) and N pools to remain relatively stable
under a wide range of grazing intensities and elk abundance. Coughenour (2002) states:
“There was a very slow, nearly imperceptible decline over long time periods (50-100
years)…the sizes of the soil organic matter C and N pools were also very large relative to
annual plant uptake and grazing offtake, which provided a large buffering capacity”.
However, Coughenour (2002) acknowledges that a more detailed analysis of grazing impacts
on soil fertility under different grazing conditions or spatial locations would be useful.
CONCLUSIONS
The limited historical, archeological, and ethnographic information that is available suggests
that ungulates, including elk, were historically abundant in the RMNP area, but actual
population sizes or densities from this time cannot be determined. Current research indicates
that elk population size and density in the Estes Valley has exceeded the natural range of
variability that would be expected in the presence of an intact predator community. There is
no single number of elk that should be considered natural. Instead, a range of elk numbers
that correspond to differences in annual food availability and predation by wolves is the
appropriate reference for natural conditions. This is referred to as a tri-trophic equilibrium
among elk, food, and wolves. Currently, a bi-trophic equilibrium exists among elk and their
food base. This has led to a winter subpopulation in RMNP that is at ecological carrying
capacity and a subpopulation in the town area that is at or approaching carrying capacity.
Under this bi-trophic system, elk population estimates for the Estes Valley over the last 10
years have ranged from 1,700-3,500 elk. Current research indicates 1,200-2,100 elk would
exist in the area under a tri-trophic system. This is supported by the literature and should be
considered a conservative estimate of the natural range of variability; i.e., the greatest number
of elk that would have been present. This is due to the fact that the above population
estimates for elk in a tri-trophic system did not consider the effects of two additional and
potentially major predators that were present in the RMNP ecosystem prior to European
settlement, humans and grizzly bears.
No estimates are available for what range of densities should be considered natural, but there
are several strong indications that densities in the current bi-trophic system are greater than
they would be under a tri-trophic system. To our knowledge, elk densities on the core winter
range are the highest concentrations ever documented for a free-ranging population that is not
54
artificially fed. There is also a growing body of evidence that indicates wolves can have a
large impact on elk distribution and group size. The lack of wolves in the RMNP area has
likely allowed for prolonged use and aggregation on the core winter range grasslands where
predation pressure by wolves and behavioral adaptations by elk would be greatest.
The population size and density of elk in the Estes Valley is directly affecting several
vegetation communities, most notably aspen and willow on the core winter range areas. It
cannot be established with certainty that aspen are a long-term natural feature of the core
winter range, but we consider it prudent to conserve the remaining stands until this can
determined through future research and monitoring efforts. Research indicates the best way
to ensure aspen persistence on the core winter range is to either drastically reduce elk
densities or exclude herbivory until new trees that are large enough to withstand herbivory
have been recruited into the population. Fencing is the most practical option because it may
be difficult to achieve the necessary elk densities (<4 to 15 elk/km2) while still allowing elk
populations to fluctuate within the natural range of variability.
The question of whether or not aspen are a natural feature of the winter range can be
answered in one of two ways. First, the effects of elk can be monitored after aspen stands on
the core winter range are restored via fencing and elk population dynamics are within their
natural range of variability. Second, genetic or carbon dating techniques may be able to be
used to determine how long the current aspen clones have been present on the winter range.
Aspen should be considered a long-term, natural feature of the core winter range if
rejuvenated aspen stands are able to persist in the presence of elk populations within their
natural range of variability or if it can be determined that aspen clones were present prior to
European settlement of the area.
Historical accounts and current research indicates willow distribution on the core winter
range is noticeably reduced from pre-European settlement times. Elk browsing is currently
the proximate factor preventing willow growth and reproduction. Recent declines and
management efforts needed to restore willow are confounded by a beaver population that has
declined significantly over the last 50 years and cannot become re-established due to the
effects of elk. The lack of beaver in the area has led to a loss of surface water and suitable
sites for willow reproduction in the area. Further, as beaver cut down tall willow for food,
elk suppress its regrowth and lead to additional declines in beaver and willow.
Full restoration of willow on the winter range will require not only a reduction in elk
browsing pressure but increased beaver activity as well. However, willow must be restored
before beaver can return to the area. Research indicates that the maximum density of elk on
core winter range areas will need to be reduced to <15-30 elk/km2 to allow willow to grow
beyond the height of herbivory, produce seeds, and provide suitable food for beaver.
Restoration efforts will need to be closely monitored for several reasons. First, maximum elk
densities may need to be lower than 15-30 elk/km2, as evidence for this range resulting in
increased willow growth is limited. Second, fencing to prevent elk browsing or possibly food
supplementation to reduce the effects of beaver foraging may be necessary to allow the
willow-elk-beaver interaction to achieve a sustainable level.
55
The above reasons for the restoration of elk dynamics and vegetation conditions are based on
the conclusion that elk and their associated effects are outside the natural range of variation.
The other major reason for restoration is to sustain or increase a variety of plant and animal
species that are directly or indirectly affected by elk. The current effects of elk herbivory and
subsequent reductions in the structural complexity of aspen and willow habitat is likely to
have adverse effects on mule deer, willow-dependent and cavity-nesting birds, butterflies,
and individual plant species such as sulphur buckwheat that inhabit the core winter range. It
also remains to be determined if elk are negatively affecting alpine willow and ptarmigan
populations, as no experimental research or studies on ptarmigan ecology or mortality have
been conducted.
We recognize that questions remain about the role of elk in the RMNP ecosystem. Research
and modeling efforts used to predict the specific effects of wolves on the population
dynamics and distribution of elk is relatively recent, with the majority of work being
conducted during the last 10-15 years. However, the best available research to date indicates
that elk population size and densities in the Estes Valley are outside their natural range of
variability and this is resulting in a number of adverse effects in the RMNP ecosystem. From
an ecological perspective, there are clear tradeoffs between continuing the current
management course of nonintervention and initiating active management to control elk
dynamics and restore vegetation communities of concern. Research indicates that
nonintervention will continue to result in an elk population at or near ecological carrying
capacity, declines of aspen and willow and few or no beaver on the core winter range, and a
localized decline or loss of plant and animal species. The effects of management intervention
depend on the population and density goals for the elk population and specific management
actions undertaken. Research indicates that if elk densities were low enough to allow willow
to escape the effects of elk browsing, it would result in a trophic cascade that would increase
willow distribution, beaver populations, and habitat for a variety of songbirds. Underscoring
the importance of timely management intervention is the fact that as conditions in aspen and
willow habitat on the winter range continue to deteriorate, restoration efforts will become
increasingly difficult or impossible to achieve.
ACKNOWLEDGEMENTS
We thank J. Peek and D. Houston for their very helpful and insightful reviews.
56
LITERATURE CITED
Anderson, E. M. 2002. Influences of elk on upland aspen, riparian willow, and associated
landbirds in and near Jackson Hole, Wyoming. M.S. Thesis. University of Wyoming,
Laramie.
Alstad, K. P., J. M. Welker, S. A. Williams, and M. J. Trlica. 1999. Carbon and water
relations of Salix monticola in response to winter browsing and changes in surface water
hydrology: an isotopic study using δ13
C and δ18
O. Oecologia 120:375-385.
Altmann, M. 1956. Patterns of herd behavior in free-ranging elk of Wyoming, Cervus
canadensis nelsoni. Zoologica 41:116-143.
Arno, S. F. 1980. Forest fire history of the northern Rockies. Journal of Forestry 78:460-465.
Augustine, D. J., and S. J. McNaughton. 1998. Ungulate effects on the functional species
composition of plant communities: herbivore selectivity and plant tolerance. Journal of
Wildlife Management 62:1165-1183.
Bailey, J. A. 1986. The increase and dieoff of Waterton Canyon bighorn sheep: biology,
management and dismanagement. Biennial Symposium of the Northern Wild Sheep and Goat
Council 5:325-340.
Bailey, J. A. 1990. Management of Rocky Mountain bighorn sheep herds in Colorado.
Colorado Division of Wildlife Special Report No. 66. Colorado Division of Wildlife. Fort
Collins, Colorado.
Baker, B. W., and B. S. Cade. 1995. Predicting biomass of beaver food from willow stem
diameters. Journal of Range Management 48:322-326.
Baker, B. W., and E. P. Hill. 2003. Beaver (Castor canadensis). Pages 288-310 in G. A.
Feldhamer, B. C. Thompson, and J. A. Chapman, eds. Wild mammals of North America:
Biology, Management, and Conservation. Johns Hopkins University Press, Baltimore, MD.
Baker, B. W., H. C. Ducharme, D. C. S. Mitchell, T. R. Stanley, and H. R. Peinetti. 2004.
Why aren’t there more beaver in Rocky Mountain National Park? Proceedings of the Annual
Conference of the Colorado Riparian Association 17:85-90.
Baker, B. W., H. C. Ducharme, D. C. S. Mitchell, T. R. Stanley, and H. R. Peinetti. 2005.
Interaction of beaver and elk herbivory reduces standing crop of willow. Ecological
Applications 15:110-118.
Baker, W. L., J. A. Munroe, and A. E. Hessel. 1997. The effects of elk on aspen in the winter
range of Rocky Mountain National Park. Ecography 20:155-165.
57
Ballard, W. B., J. S. Whitman, and C. L. Gardner. 1987. Ecology of an exploited wolf
population in south-central Alaska. Wildlife Monographs No. 98.
Bear, G. D. 1989. Seasonal distribution and population characteristics of elk in Estes Valley,
Colorado. Colorado Division of Wildlife Special Report No. 65.
Benedict, J. B. 1992. Footprints in the snow: high altitude cultural ecology of the Colorado
Front Range, U.S.A. Arctic and Alpine Research 24:1-16.
Benedict, J. B. 1996. The game drives of Rocky Mountain National Park. Center for
Mountain Archeology Research Report No. 7.
Bergerud, A. T., and J. P. Elliot. 1986. Dynamics of caribou and wolves in northern British
Columbia. Canadian Journal of Zoology 64:1515-1529.
Bergerud, A. T., W. Wyett, and J. B. Snider. 1983. The role of wolf predation in limiting a
moose population. Journal of Wildlife Management 47:977-988.
Bilbrough, C. J., and J. H. Richards. 1993. Growth of sagebrush and bitterbrush following
simulated winter browsing: mechanisms of tolerance. Ecology 74:481-492.
Binkley, D., F. Singer, M. Kaye, and R. Rochelle. 2003. Influence of elk grazing on soil
properties in Rocky Mountain National Park. Forest Ecology and Management 185:239-247.
Blaisdell, J. P., and W. F. Mueggler. 1956. Sprouting of bitterbrush (Purshia tridentata)
following burning or top removal. Ecology 37:365-377.
Boutin, S. 1992. Predation and moose population dynamics: a critique. Journal of Wildlife
Management 56:116-127.
Boyce, M. S. 1993. Predicting the consequences of wolf recovery to ungulates in
Yellowstone National Park. Pages 234-269 in R. S. Cook, ed. Ecological issues on
reintroducing wolves into Yellowstone National Park. National Park Service Scientific
Monographs 92/22.
Braun, C. E., D. R. Stevens, K. M. Giesen, and C. P. Melcher. 1991. Elk, white-tailed
ptarmigan and willow relationships: a management dilemma in Rocky Mountain National
Park. the North American Wildlife Conference Transactions:56:74-85.
Brunswig, R. H., Jr. 2001. Lawn Lake (5LR318): results of an archaeological mitigation
research project at a high altitude prehistoric site in Rocky Mountain National Park. Final
report to the National Park Service.
Brunswig, R. H., Jr., and J. Doerner. 2001. The Lawn Lake site (5LR318): new evidence for
high altitude late Paleoindian adaptations and Paleolandscapes of Colorado’s southern
58
Rockies in the early Holocene. Paper presented at the 5th Biennial Rocky Mountain
Anthropological Conference, Waterton Lakes National Park, Alberta, Canada, September 20-
23, 2001.
Bryant, J. P., F. S. Chapin, III, and D. R. Klein. 1983. Carbon/nutrient balance of boreal
plants in relation to vertebrate herbivory. Oikos 40:357-368.
Buchholtz, C. W. 1983. Rocky Mountain National Park: a history. Colorado Associated
University Press, Boulder.
Buckland, S., D. Anderson, K. Burnham, and J. Laake. 1993. Distance Sampling: Estimating
Abundance of Biological Populations. Chapman and Hall, New York, NY.
Bunting, S. C., L. F. Neuenschwander, and G. E. Gruell. 1985. Fire ecology of antelope
bitterbrush in the northern Rocky Mountains. Pages 48-57 in J. E. Lotan and J. K. Brown,
eds. Fire’s effects on wildlife habitat: symposium proceedings. USDA Forest Service General
Technical Report INT-186. Intermountain Research Station. Ogden, Utah.
Butler, W. B. 1997. Rocky Mountain National Park research design for archeology. Final
report to National Park Service and Colorado State Historic Preservation Office.
Buttery, R. 1955. Range conditions and trends resulting from winter concentrations of elk in
Rocky Mountain National Park, Colorado. M.S. Thesis. Colorado State University, Fort
Collins.
Capp, J. C. 1967. Competition among bighorn sheep, elk and deer in Rocky Mountain
National Park, Colorado. M.S. Thesis. Colorado State University, Fort Collins.
Capp, J. C. 1968. Bighorn sheep, elk, and mule deer range relationships. A review of the
literature. Final report to the Rocky Mountain Nature Association.
Cassells, E. S. 1995. Hunting the open high country: prehistoric game driving in the Colorado
alpine tundra. Ph.D. Dissertation, Department of Anthropology, University of Wisconsin,
Madison.
Cassirer, E. F., L. E. Oldenburg, V. L. Coggins, P. Fowler, K. Rudolph, D. L. Hunter, and W.
J. Foreyt. 1996. Overview and preliminary analysis of a bighorn sheep dieoff, Hells Canyon
1995-1996. Biennial Symposium of the Northern Wild Sheep and Goat Council 10:78-86.
Caughley, G. 1976. Wildlife management and the dynamics of ungulate populations. Pages
183-246 in T. H. Coaker, ed. Applied Biology. Academic Press, London, UK.
Caughley, G. 1981. Overpopulation. p. 7-19. In: P. A. Jewell, and S. Holt. eds. Problems in
management of locally abundant wild mammals. Academic Press, NY.
59
Choate, T. S. 1963. Habitat and population dynamics of white-tailed ptarmigan in Montana.
Journal of Wildlife Management 27:684-699.
Clarke, J. A., C. E. Olmsted, and K. Larkins. 1994. Patterns of habitat use, movement, and
distribution of elk adjacent to the eastern boundary of Rocky Mountain National Park. Final
report to the National Park Service.
Clements, C. D., and J. A. Young. 1996. Influence of rodent predation on antelope
bitterbrush seedlings. Journal of Range Management 49:31-34.
Clements, F. E. 1910. The life history of lodgepole burn forests. USDA Forest Service
Bulletin 79. Government Printing Office, Washington D. C.
Coggins, V. L. 1988. The Lostine Rocky Mountain bighorn sheep die-off and domestic
sheep. Biennial Symposium of the Northern Wild Sheep and Goat Council 6:57-64.
Cole, G. F. 1971. An ecological rationale for the natural or artificial regulation of native
ungulates in parks. North American Wildlife Conference Transactions: 36:417-425.
Colorado Division of Wildlife. 1999. Declining mule deer populations in Colorado: reasons
and responses. A report to the Colorado Legislature.
Colorado Division of Wildlife. 2003. Prevalence and distribution of chronic wasting disease
in Colorado, 2002-2003. Available on the internet at http://wildlife.state.co.us/CWD/pdf/
PrevalenceSummary8-031.pdf.
Colorado Division of Wildlife. 2004. Prevalence and distribution of chronic wasting disease
in Colorado, 2003-2004. Available on the internet at http://wildlife.state.co.us/CWD/pdf/
PrevalenceSummary_9-14-04.pdf.
Condon, D. D. 1943. Recommendations and an outline for the management of the elk and
deer population in Rocky Mountain National Park. National Park Service Report.
Connor, J. 1993. Neotropical migrant bird survey for Rocky Mountain National Park. Rocky
Mountain National Park Resource Management Series #17.
Conner, M. M. 2004. Estimation of mule deer population size, survival, and a description of
movements in Rocky Mountain National Park. Final report to the National Park Service.
Cooper, D. J., J. Dickens, and E. Gage. 2003. Constraints on, and opportunities for, riparian
willow establishment, Rocky Mountain National Park, Colorado. Final report to the National
Park Service.
60
Cooper, D. J., S. W. Woods, R. A Chimner, and L. H. MacDonald. 2000. Effects of the
Grand Ditch on wetlands of the Kawuneeche Valley, Rocky Mountain National Park,
Colorado. Final report to the National Park Service.
Cottrell, T. R. 1993. The comparative ecology of Salix planifolia and Salix monticola in
Rocky Mountain National Park. Ph.D. Dissertation, Colorado State University, Fort Collins.
Cottrell, T. R. 1995. Willow colonization of Rocky Mountain mires. Canadian Journal of
Forest Research 25:215-222.
Coughenour, M. B. 2002. Elk in the Rocky Mountain National Park ecosystem B a model
based assessment. Final report to the National Park Service.
Creel, S., J. Winnie, Jr., B. Maxwell, K. Hamlin, and M. Creel. 2005. Elk alter habitat
selection as an antipredator response to wolves. Ecology 86:3387-3397.
Cunningham, R. L. 1988. North American migratory birds and the National Park System.
Some interpretive thoughts. Final report to the National Park Service.
Dekker, D. G., W. Bradford, and J. R. Gunson. 1996. Elk and wolves in Jasper National Park,
Alberta from historical times to 1992. Pages 85-94 in L. N. Carbyn, S. H. Fritts, and D. R.
Scrip, eds. Ecology and conservation of wolves in a changing world. Canadian Circumpolar
Institute, University of Alberta, Edmonton.
Denney, R. N., R. J. Boyd, E. Bucknall, W. Schuett, P. F. Gilbert, J. Cooney, L. D. Hibbs, G.
D. Bear, and R. B. Gill. 1967. Research project segment: elk seasonal movements, Rocky
Mountain National Park. Job Completion Report (State of Colorado).
Dobkin, D. S., F. J. Singer, and W. S. Platts. 2002. Ecological condition and avian response
in willow, aspen, and cottonwood communities of the National Elk Refuge, Jackson,
Wyoming. Final report by High Desert Ecological Research Institute.
Dixon, J. S. 1939. Special report on the elk problem at Rocky Mountain National Park. Final
report to the National Park Service.
Duberstein, J. N. 2001. The effects of elk on nest site selection in cavity-nesting birds in
Rocky Mountain National Park. Final report to the National Park Service.
Edwards, J. 1983. Diet shifts in moose due to predator avoidance. Oecologia 60:185-189.
Ehle, D. S. 2001. Spatial and temporal patterns of disturbance and ponderosa pine forest
structure in Rocky Mountain National Park. M.S. Thesis. University of Wyoming, Laramie.
Estes, M. 1939. The memoirs of Estes Park. Reprint of 1939 Colorado Magazine article.
61
Farmer, R. E., Jr. 1962. Aspen root sucker formation and apical dominance. Forest Science
8:403-410.
Ferguson, J. W., A. T. Bergerud, and R. Ferguson. 1988. Predation risk and habitat selection
in the persistence of a remnant caribou population. Oecologia 76:236-245.
Forsyth, D. M., and G. J. Hickling. 1998. Increasing Himalayan tahr and decreasing chamois
densities in the eastern Southern Alps, New Zealand: evidence for interspecific competition.
Oecologia 113:377-382.
Frost, H., G. Storm, M. Batcheller, and M. Lovallo. 1997. White-tailed deer management at
Gettysburg National Military Park and Eisenhower National Historic Site. Wildlife Society
Bulletin 25:462-469.
Fryxell, F. M. 1928. The former range of the bison in the Rocky Mountains. Journal of
Mammalogy 9:129-139.
Fryxell, J. M. 1987. Food limitation and demography of a migratory antelope, the white-eared
kob. Oecologia 72:83-91.
Gage, E. A., and D. J. Cooper 2004a. Constraints on willow seedling survival in a Rocky
Mountain floodplain. Wetlands 24:908-911.
Gage, E. A., and D. J. Cooper 2004b. Controls on willow cutting survival in a montane
riparian area. Journal of Range Management 57:597-600.
Gage, E. A., and D. J. Cooper, 2005. Patterns of willow seed dispersal, seed entrapment, and
seedling establishment in a heavily browsed montane riparian ecosystem. Canadian Journal
of Botany 83:678-687.
Garton, E. O., R. L. Crabtree, B. B. Ackerman, and G. Wright. 1990. The potential impact of
a reintroduced wolf population on the northern Yellowstone elk population. Pages 3-59 to 3-
91 in J. D. Varley and W. G. Brewster, eds. Wolves for Yellowstone? A report to the United
States Congress, vol. 2, research and analysis. National Park Service, Yellowstone National
Park.
Gasaway, W. C., K. T. Gasaway, and H. H. Berry. 1983. Persistent low densities of
plains ungulates in Etosha National Park, Namibia: testing the food-regulating hypothesis.
Canadian Journal of Zoology 74: 1556-1572.
Gasaway, W. C., R. D. Boertje, D. V. Grangaard, D. G. Kelleyhouse, R. O. Stephenson, and
D. G. Larsen. 1992. The role of predation in limiting moose at low densities in Alaska and
Yukon and implications for conservation. Wildlife Monographs No. 120.
62
Goodson, N. J. 1978. Status of bighorn sheep in Rocky Mountain National Park. M.S. Thesis.
Colorado State University, Fort Collins.
Goodson, N. J., and D. R. Stevens. 1991. Population dynamics, home ranges, and habitat use
of bighorn sheep on the Continental Divide and in the Never Summer Mountains. Final
report to the National Park Service.
Grater, R. K. 1945. Report on the elk-deer reduction program of 1944-1945 at Rocky
Mountain National Park. National Park Service Report.
Griggs, R. F. 1956. Competition and succession on a Rocky Mountain fellfield. Ecology
37:8-20.
Gross, J. E., and M. W. Miller. 2001. Chronic wasting disease in mule deer: a model of
disease dynamics, control options, and population consequences. Journal of Wildlife
Management 65:205-215.
Guse, N. G., Jr. 1966. An administrative history of and elk herd. M.S. Thesis. Colorado State
University, Ft. Collins.
Gysel, L. W. 1960. An ecological study of the winter range of elk and mule deer in the Rocky
Mountain National Park. Journal of Forestry 58:696-703.
Harrington, F. A. 1978. Ecological segregation of ungulates in alpine and subalpine
communities. Ph.D. Dissertation, Colorado State University, Fort Collins.
Hebblewhite, M., C. A. White, C. G. Nietvelt, J. A. McKenzie, T. E. Hurd, J. M. Fryxell, S.
E. Bayley, and P. C. Paquet. 2005. Human activity mediates a trophic cascade caused by
wolves. Ecology 86:2135-2144.
Hebblewhite, M., D. H. Pletscher, and P. C. Paquet. 2002. Elk population dynamics in areas
with and without predation by recolonizing wolves in Banff National Park, Alberta. Canadian
Journal of Zoology 80:789-799.
Hinds, T. E. 1985. Diseases. Pages 87-106 in N.V. DeByle and R. P. Winokur, eds. Aspen:
ecology and management in the western United States. USDA Forest Service General
Technical Report RM-119. Rocky Mountain Forest and Range Experiment Station, Fort
Collins, Colorado.
Hobbs, N. T., D. L. Baker, J. E. Ellis, and D. M. Swift. 1981. Composition and quality of elk
winter diets in Colorado. Journal of Wildlife Management 45:156-171.
Hobbs, N. T., D. L. Baker, J. E. Ellis, D. M. Swift, and R. A. Green. 1982. Energy- and
nitrogen-based estimates of elk winter-range carrying capacity. Journal of Wildlife
Management 46:12-21.
63
Hobbs, N. T., D. L. Baker, G. D. Bear, and D. C. Bowden. 1996a. Ungulate grazing in
sagebrush grassland: mechanisms of resource competition. Ecological Applications 6:200-
217.
Hobbs, N. T., D. L. Baker, G. D. Bear, and D. C. Bowden. 1996b. Ungulate grazing in
sagebrush grassland: effects of resource competition on secondary production. Ecological
Applications 6:218-227.
Hobbs, N. T., D. Ojima, J. Loomis, S. Weiler, M. McDuff, D. M. Theobald, A. P. Covich, J.
S. Baron, M. B. Coughenour, D. J. Cooper, L. Landrum, J. Dickens. 2003. An integrated
assessment of the effects of climate change on Rocky Mountain National Park and its
gateway community. Unpublished report to the Environmental Protection Agency.
Houston, D. B. 1982. The northern Yellowstone elk. Macmillan Publishing Co., New York.
Huff, D. and J. Varley. 1999. Natural regulation in Yellowstone National Park’s northern
range. Ecological Applications 9:17-29.
Jarrett, R. D., and J. E. Costa. 1993. Hydrology and geomorphology of the 1982 Lawn Lake
dam failure, Colorado. Pages 1-17 in H. E. McCutchen, R. Herrmann, and D. R. Stevens, eds.
Ecological effects of the Lawn Lake Flood of 1982, Rocky Mountain National Park.
Scientific Monograph NPS/NRROMO/NRSM-93/21.
Jehle, G. 2004. Avian response to prescribed fire in the upland shrub/ponderosa pine system
of Rocky Mountain National Park, Colorado. M.S. Thesis, Colorado State University, Ft.
Collins.
Jenkins, K. J. and R. G. Wright. 1987. Dietary niche relationships among cervids relative to
winter snowpack in northwestern Montana. Canadian Journal Zoology 65:1397-1401.
Johnsgard, P. A. 1986. Birds of the Rocky Mountains. Colorado Associated University Press,
Boulder.
Jones, J. R., and G. A. Schier. 1985. Growth. Pages 19-24 in N.V. DeByle and R. P.
Winokur, eds. Aspen: ecology and management in the western United States. USDA Forest
Service General Technical Report RM-119. Rocky Mountain Forest and Range Experiment
Station, Fort Collins, Colorado.
Jorgenson, J.T., M. Festa-Bianchet, J-M. Gaillard, and W. D. Wishart, W.D. 1997. Effects of
age, sex, disease, and density on survival of bighorn sheep. Ecology 78:1019-1032.
Kay, C. E. 1997a. The condition and trend of aspen, Populus tremuloides, in Kootenay and
Yoho National Parks: Implications for ecological integrity. The Canadian Field-Naturalist
111:607-606.
64
Kay, C. E. 1997b. Is aspen doomed? Journal of Forestry 95:4-11.
Kaye, M. W., D. Binkley, and T. J. Stohlgren. 2005. Effects of conifers and elk browsing on
quaking aspen forests in the central Rocky Mountains, USA. Ecological Applications
15:1284-1295.
Kershaw, L., A. MacKinnon, and J. Pojar. 1998. Plants of the Rocky Mountains. Lone Pine
Publishing, Edmonton.
Kiener, W. 1939. Sociological studies of the alpine vegetation on Longs Peak. Ph.D.
Dissertation, University of Nebraska, Lincoln.
Kufeld, R. C., O. C. Wallmo, and C. Feddema. 1973. Foods of the Rocky Mountain mule
deer. USDA Forest Service Research Paper RM-111. Rocky Mountain Forest and Range
Experiment Station, Fort Collins, Colorado.
Kunkel, K. E., and D. H. Pletscher. 1999. Species-specific population dynamics of cervids in
a multipredator ecosystem. Journal of Wildlife Management 63:1082-1093.
Larkins, K. F. 1997. Patterns of elk movement and distribution in and adjacent to the eastern
boundary of Rocky Mountain National Park. M.S. Thesis. University of Northern Colorado,
Greely.
Laundré, J.W., L. Hernández, and K. B. Altendorf. 2001. Wolves, elk, and bison:
reestablishing the "landscape of fear" in Yellowstone National Park, U.S.A. Canadian Journal
of Zoology 79:1401-1409.
Leukering, T., and M. Carter. 1999. Abundance and nesting success of common breeding
birds in willow riparian areas in Rocky Mountain National Park. Final report to the National
Park Service.
Lloyd, J. 1997. The effect of elk herbivory on vegetation and songbirds of aspen communities
in Rocky Mountain National Park. Final report to the National Park Service.
Lubow, B. C., F. J. Singer, T. L. Johnson, and D. C. Bowden. 2002. Dynamics of interacting
elk populations within and adjacent to Rocky Mountain National Park. Journal of Wildlife
Management 66:757-775.
Mack, J. A., and F. J. Singer 1993. Using pop-II models to predict effects of wolf predation
and hunter harvests on elk, mule deer, and moose on the northern range. Pages 49-74 in R. S.
Cook, ed. Ecological issues on reintroducing wolves into Yellowstone National Park.
National Park Service Scientific Monographs 92/22.
65
Martin, A. C., H. S. Zim, and A. L. Nelson. 1951. A guide to wildlife food habits. Dover
Publications, Inc., New York.
Mast, J. N., T. T. Veblen, and Y. B. Linhart. 1998. Disturbance and climatic influences on
age structure of ponderosa pine at the pine/grassland ecotone, Colorado Front Range. Journal
of Biogeography 25:743-755.
May, T. A., and C. E. Braun. 1972. Seasonal foods of adult white-tailed ptarmigan in
Colorado. Journal of Wildlife Management 36:1180-1186.
McClintock, B. T. 2004. The mark-resight method: an application to bighorn sheep in
Colorado and a simulation study evaluating estimators. M.S. Thesis. Colorado State
University, Fort Collins.
McDonough, W. T. 1985. Sexual reproduction, seeds, and seedlings. Pages 25-28 in N.V.
DeByle and R. P. Winokur, eds. Aspen: ecology and management in the western United
States. USDA Forest Service General Technical Report RM-119. Rocky Mountain Forest and
Range Experiment Station, Fort Collins, Colorado.
McLaren, B. E., and R. O. Peterson. 1994. Wolves, moose, and tree rings on Isle Royale.
Science 266: 1555-1558.
McLaughlin, J. S. 1931. First annual spring wildlife report, RMNP. National Park Service
Report.
McShea, W. H. B. Underwood, and J. Rappole. 1997. Deer management and the concept of
overabundance. Pages 1-7 in W. McShea, H. B. Underwood, and J. Rappole, eds. The
Science of Overabundance: Deer Ecology and Population Management. Smithsonian
Institution Press, Washington, D.C.
Mduma, S. A. R., A. R. E. Sinclair, and R. Hilborn. 1999. Food regulates the Serengeti
wildebeest. Journal of Animal Ecology 68:1101-1122.
Menezes, R. S. C., E. T. Elliot, and J. M. Welker. 2002. Isotopic evidence of the effects of
herbivory and landscape position on plant nitrogen sources in a riparian ecosystem. In F. J.
Singer, ed. Ecological evaluation of the abundance and effects of elk in Rocky Mountain
National Park, Colorado, 1994-1999. Final report to the National Park Service.
Menezes, R. S. C., E. T. Elliot, D. W. Valentine, and S. A. Williams. 2001. Carbon and
nitrogen dynamics in elk winter ranges. Journal of Range Management 54:400-408.
Messier, F., and M. Crete. 1985. Moose-wolf dynamics and the natural regulation of moose
populations. Oecologia 65:503-512.
66
Miller, M. W., E. S. Williams, C. W. McCarty, T. R. Spraker, T. J. Kreeger, and E. T.
Thorne. 2000. Epidemiology of chronic wasting disease in free-ranging cervids. Journal of
Wildlife Diseases 36:676-690.
Monello, R. J., D. L. Murray, and F. Cassirer. 2001. Ecological correlates of pneumonia
epizootics in bighorn sheep. Canadian Journal of Zoology 79:1423-1432.
Mueggler, W. F. 1985. Vegetative associations. Pages 45-55 in N.V. DeByle and R. P.
Winokur, eds. Aspen: ecology and management in the western United States. USDA Forest
Service General Technical Report RM-119. Rocky Mountain Forest and Range Experiment
Station, Fort Collins, Colorado.
Naiman, R. J., C. A. Johnston, and J. C. Kelley. 1988. Alteration of North American streams
by beaver. Bioscience. 387:753-762.
National Park Service. 2001. Management Policies. United States Department of Interior,
Washington D.C. Available on the internet at http://www.nps.gov/policy/mp/policies.html.
Nesvacil, K., and C. E. Olmsted. 2003. The effects of prescribed fire and ungulate herbivory
6 and 7 years post-burn in the upland bitterbrush (Purshia tridentata) communities of Rocky
Mountain National Park, Colorado. Proceedings - 2002 Fire Conference: Managing Fire and
Fuels in the Remaining Wildlands and Open Spaces of the Southwest, December 2-5, 2002,
San Diego, California. USDA Forest Service General Technical Report.
Nietvelt, C. G. 2001. Herbivory interactions between beaver (Castor canadensis) and elk
(Cervus elaphus) on willow (Salix spp.) in Banff National Park, Alberta. M.S. Thesis.
University of Alberta, Edmonton.
Olmsted, C.E. 1979. The ecology of aspen with reference to utilization by large herbivores in
Rocky Mountain National Park. Pages 89-97 in M. S. Boyce and L. D. Hayden-Wing, eds.
North American elk: ecology, behavior and management. University of Wyoming Press,
Laramie.
Olmsted, C.E. 1997. Twenty years of change in Rocky Mountain National Park elk winter
range aspen. Unpublished Report to the National Park Service.
Orians, G., D. A. Cochran, J. W. Duffield, T. K. Fulla, R. J. Gutierrez, W. M. Hanemann, F.
C. James, P. Karieva, S. R. Kellert, D. Klein, B. N. McLellan, P. D. Olson, and G. Yaska.
1997. Wolves, bears and their prey in Alaska. National Academy of Press, Washington, D.C.
Packard, F. M. 1939. Notes on a conversation of Fred M. Packard with Mr.Abner Sprague at
Estes Park Colorado on August 7, 1939, regarding the early history of the bighorn and other
game animals in Rocky Mountain National Park. Unpublished Report to the National Park
Service.
67
Packard, F. M. 1946. An ecological study of the bighorn sheep in Rocky Mountain National
Park. Journal of Mammalogy 27:3-28.
Packard, F. M. 1947. A survey of the beaver population of Rocky Mountain National Park,
Colorado. Journal of Mammalogy 28:219-227.
Peek, J. M. and A. Lovaas. 1968. Differential distribution of elk by sex and age on the
Gallatin winter range. Journal Wildlife Management 32:553-557.
Peinetti. H. R. 2000. Riparian willow dynamics and their interaction with environmental and
biological factors in the elk winter range of Rocky Mountain National Park (Colorado) B a
multi-scale analysis. Ph.D. Dissertation, Colorado State University, Fort Collins.
Peinetti, H. R., M. A. Kalkhan, and M. B. Coughenour. 2002. Long-term changes in willow
spatial distribution on the elk winter range of Rocky Mountain National Park (USA).
Landscape Ecology: 17:341-354.
Peinetti, H. R., R. S. C. Menezes, and M. B. Coughenour. 2001. Changes induced by elk
browsing in the aboveground biomass production and distribution of willow (Salix monticola
Bebb): their relationships with plant water, carbon, and nitrogen dynamics. Oecologia
127:334-342.
Peterson, R. O. 1999. Wolf-moose interaction on Isle Royale: the end of natural regulation.
Ecological Applications 9:10-16.
Ratcliff, H. M. 1941a. Winter range conditions in Rocky Mountain National Park. North
American Wildlife Conference Transactions: 6:132-139.
Ratcliff, H. M. 1941b. Progress report on the bighorn sheep study, Rocky Mountain National
Park. Final report to the National Park Service.
Ripple, W. J., and R. L. Beschta. 2004. Wolves, elk, willows, and trophic cascades in the
upper Gallatin Range of Southwestern Montana, USA. Forest Ecology and Management
200:161-181.
Ripple, W. J., E. J. Larsen, R. A. Renkin, and D. W. Smith. 2001. Trophic cascades among
wolves, elk and aspen on Yellowstone National Park's northern range. Biological
Conservation 102:227-234.
Robisch, E. and R. G. Wright. 1995. A survey of ungulate management in selected U. S.
national parks. Natural Areas Journal 15:117-123.
68
Romme, W. H., L. Floyd-Hanna, D. D. Hanna, and E. Bartlett. 2001. Aspen’s ecological role
in the west. Pages 243-259 in W. D. Shepperd, D. Binkley, D. L. Bartos, T. J. Stohlgren, and
L. G. Eskew, compilers. Sustaining aspen in western landscapes: symposium proceedings.
Proceedings RMRS-P-18. Rocky Mountain Research Station. Ft. Collins, Colorado.
Romme, W. H., M. G. Turner, L. L. Wallace, and J. S. Walker. 1995. Aspen, elk, and fire in
northern Yellowstone National Park. Ecology 76: 2097-2106.
Rowdabaugh, K. M. 1978. The role of fire in the ponderosa pine-mixed conifer ecosystems.
M.S. Thesis. Colorado State University, Fort Collins.
Ryder, T. J., E. S. Williams, K. W. Mills, K. H. Bowles, and E. T. Thorne. 1992. Effect of
pneumonia on population size and lamb recruitment in Whiskey Mountain bighorn sheep.
Biennial Symposium of the Northern Wild Sheep and Goat Council 8:136-146.
Schell, L. D., and T. J. Stohlgren. 1997. Effect of elk grazing on native and non-native plant
species diversity in Beaver Meadows. Final report to the Rocky Mountain Elk Foundation.
Schier, G. A. 1975a. Promotion of sucker development on Populus tremuloides root cuttings
by and antiauxin. Canadian Journal of Forest Research 5:338-340.
Schier, G. A. 1975b. Deterioration of aspen clones in the middle Rocky Mountains. USDA
Forest Service Research Paper INT-170. Intermountain Forest and Range Experiment Station,
Ogden, Utah.
Schier, G. A. 1985. Vegetative regeneration. Pages 29-33 in N.V. DeByle and R. P. Winokur,
eds. Aspen: ecology and management in the western United States. USDA Forest Service
General Technical Report RM-119. Rocky Mountain Forest and Range Experiment Station,
Fort Collins, Colorado.
Schmitz, O. J., A. P. Beckerman, and K. M. O’Brien. 1997. Behaviorally mediated trophic
cascades: effects of predation risk on food web interactions. Ecology 78:1388-1399.
Schoenecker, K. A., F. J. Singer, R. S. C. Menezes, L. C. Zeigenfuss, and D. Binkley. 2002.
Sustainability of vegetation communities grazed by elk in Rocky Mountain National Park. In
F. J. Singer, ed. Ecological evaluation of the abundance and effects of elk in Rocky Mountain
National Park, Colorado, 1994-1999. Final report to the National Park Service.
Schoenecker, K. A., F. J. Singer, L. C. Zeigenfuss, D. Binkley, and R. S. C. Menezes. 2004.
Effects of elk herbivory on vegetation and nitrogen processes. Journal of Wildlife
Management 68:837-849.
Shepperd, W. D., and O. Engelby. 1983. Rocky Mountain aspen. U.S. Forest Service
Agricultural Handbook 445:77-79.
69
Sherriff, R. L., T. T. Veblen, and J.S. Sibold. 2001. Fire history in high elevation subalpine
forests in the Colorado Front Range. Ecoscience 8:369-380.
Simonson, S. E., P. A. Opler, T. J. Stohlgren, and G. W. Chong. 2001. Rapid assessment of
butterfly diversity in a montane landscape. Biodiversity and Conservation 10:1369-1386.
Sinclair, A. R. E. 1985. Does interspecific competition or predation shape the African
ungulate community? Journal of Animal Ecology 54:899-918.
Sinclair, A. R. E., H. Dublin, and M. Borner. 1985. Population regulation of the Serengeti
wildebeest: a test of the food hypothesis. Oecologia 65:266-268.
Singer, F. J., and J. E. Norland. 1994. Niche relationships within a guild of ungulate species
in Yellowstone National Park, Wyoming, following release from artificial controls. Canadian
Journal of Zoology 72:1383-1394.
Singer, F. J., D. M. Swift, M. B. Coughenour, and J. D. Varley. 1998b. Thunder on the
Yellowstone revisited: an assessment of management of native ungulates by natural
regulation, 1968-1993. Wildlife Society Bulletin 26:375-390.
Singer, F. J., G. Wang, and N. T. Hobbs. 2003. The role of ungulates and large predators on
plant communities and ecosystem processes in national parks. Pages 444-486 in R. G.
Anthony and C. Zabel, eds. Large mammal communities in U.S. western coniferous forests.
Cambridge University Press, Cambridge.
Singer, F. J., L. C. Mack, and R. C. Cates. 1994. Ungulate herbivory of willows on
Yellowstone's northern winter range. Journal of Range Management 47: 435-443.
Singer, F. J., L. C. Zeigenfuss, B. Lubow, and M. J. Rock. 2002. Ecological evaluation of the
appropriate number of ungulates in U.S. National Parks: a case study. In F. J. Singer, ed.
Ecological evaluation of the abundance and effects of elk in Rocky Mountain National Park,
Colorado, 1994-1999. Final report to the National Park Service.
Singer, F. J., L. C. Zeigenfuss, R. G. Cates, and D. T. Barnett. 1998a. Elk, multiple factors,
and persistence of willows in national parks. Wildlife Society Bulletin 26:419-428.
Skogland, T. 1985. The effects of density-dependent resource limitation on the demography
of wild reindeer. Journal of Animal Ecology 54:359-374.
Smith, B. L., and S. H. Anderson. 1996. Patterns of neonatal mortality of elk in northwest
Wyoming. Canadian Journal of Zoology 74:1229-1237.
Sprague, A. E. 1925. Game more plentiful now than 50 years ago in Estes Park region. Estes
Park Trail, June 5, 1925.
70
Stevens, D.R. 1980a. The deer and elk of Rocky Mountain National Park; A 10-year study.
National Park Service Report ROMO-N-13.
Stevens, D. R. 1980b. Impact of elk on alpine tundra in Rocky Mountain National Park.
Proceedings of High Altitude Vegetation Workshop 4:228-244.
Stohlgren, T. J., L. D. Schell, and B. V. Heuvel. 1999. How grazing and soil quality affect
native and exotic plant diversity in Rocky Mountain grasslands. Ecological Applications
9:45-64.
Suzuki, K., H. Suzuki, D. Binkley, and T. J. Stohlgren. 1999. Aspen regeneration in the
Colorado Front Range: differences at local and landscape scales. Landscape Ecology 14:231-
237.
Toll, O. W. 1962. Arapaho names and trails: a report of a 1914 pack trip. Privately published.
Turchi, G. M., P. L. Kennedy, D. Urban, and D. Hein. 1994. Bird species richness in relation
to isolation of aspen habitats. Wilson Bulletin 107:463-474.
United States Senate. 1967. Hearings before a Subcommittee on Appropriations, U. S.
Senate: First Session on Control of Elk Populations in Yellowstone National Park.
Washington, D. C. GPO.
Veblen, T. T., T. Kitzberger, and J. Donnegan. 2000. Climatic and human influences on fire
regimes in ponderosa pine forests in the Colorado Front Range. Ecological Applications
10:1178-1195.
Veblen, T. T., and D. C. Lorenz. 1991. The Colorado Front Range: a century of ecological
change. University of Utah Press, Salt Lake City.
Vitousek, P. 1982. Nutrient cycling and nutrient use efficiency. American Naturalist 119:553-
572.
Wambolt, C. L. 1998. Sagebrush and ungulate relationships on Yellowstone’s northern range.
Wildlife Society Bulletin 26:429-437.
Wambolt, C. L., K. S. Walhof, and M. R. Frisina. 2001. Recovery of big sagebrush
communities after burning in south-western Montana. Journal of Environmental Management
61:243-252.
Wang, G., N. T. Hobbs, K. M. Giesen, H. Galbraith, D. S. Ojima, and C. E. Braun. 2002.
Relationships between climate and population dynamics of white-tailed ptarmigan in Rocky
Mountain National Park, Colorado, USA. Final report to National Park Service.
71
Weisberg, P.J., and M. B. Coughenour. 2003. Model-based assessment of aspen responses to
elk herbivory in Rocky Mountain National Park, U.S.A. Journal of Environmental
Management 32:152-169.
White, C. A., and M. C. Feller. 2001. Predation risk and elk-aspen foraging patterns. Pages
61-80 in W. D. Shepperd, D. Binkley, D. L. Bartos, T. J. Stohlgren, and L. G. Eskew, eds.
Sustaining aspen in western landscapes: symposium proceedings, 13-15 June, Grand
Junction, CO. USDA Forest Service Proceedings RMRS-P-18. Rocky Mountain Research
Station. Fort Collins, Colorado.
White, C. A., C. E. Olmsted, and C. E. Kay. 1998. Aspen, elk, and fire in the Rocky
Mountain national parks of North America. Wildlife Society Bulletin 26:449-462.
Willard, B. E. 1963. Phytosociology of the alpint tundra of Trail Ridge, Rocky Mountain
National Park, Colorado. Ph.D. Dissertation, University of Colorado, Boulder.
Williams, G. R. 1954. Population fluctuations in some northern hemisphere game birds
(Tetraonidae). Journal of Animal Ecology 23:1-34.
Wolff, J. O., and T. Van Horn. 2003. Vigilance and foraging patterns of American elk during
the rut in habitats with and without predators. Canadian Journal of Zoology 81:266-271.
Wright, G. M., J. S. Dixon, and B. H. Thompson. 1933. Fauna of the National Parks of the
United States: a preliminary survey of faunal relations in National Parks. U.S. Government
Printing Office, Washington D.C.
Wright, R. G. 1992. Wildlife research and management in the National Parks. University of
Illinois Press, Chicago.
Zaninelli, J., and T. Leukering. 1998. Aspen: a critical component of cavity-nesting bird
habitat in Rocky Mountain National Park. Final report to the National Park Service.
Zeigenfuss, L. C., F. J. Singer, and D. Bowden. 1999. Vegetation responses to natural
regulation of elk in Rocky Mountain National Park. Biological Science Report
USGS/BRD/BSRC1999-0003. U.S. Government Printing Office, Denver, Colorado.
Zeigenfuss, L. C., F. J. Singer, S. Williams, and T. Johnson. 2002. Influences of herbivory
and water on willow in elk winter range. Journal of Wildlife Management 66:788-795.
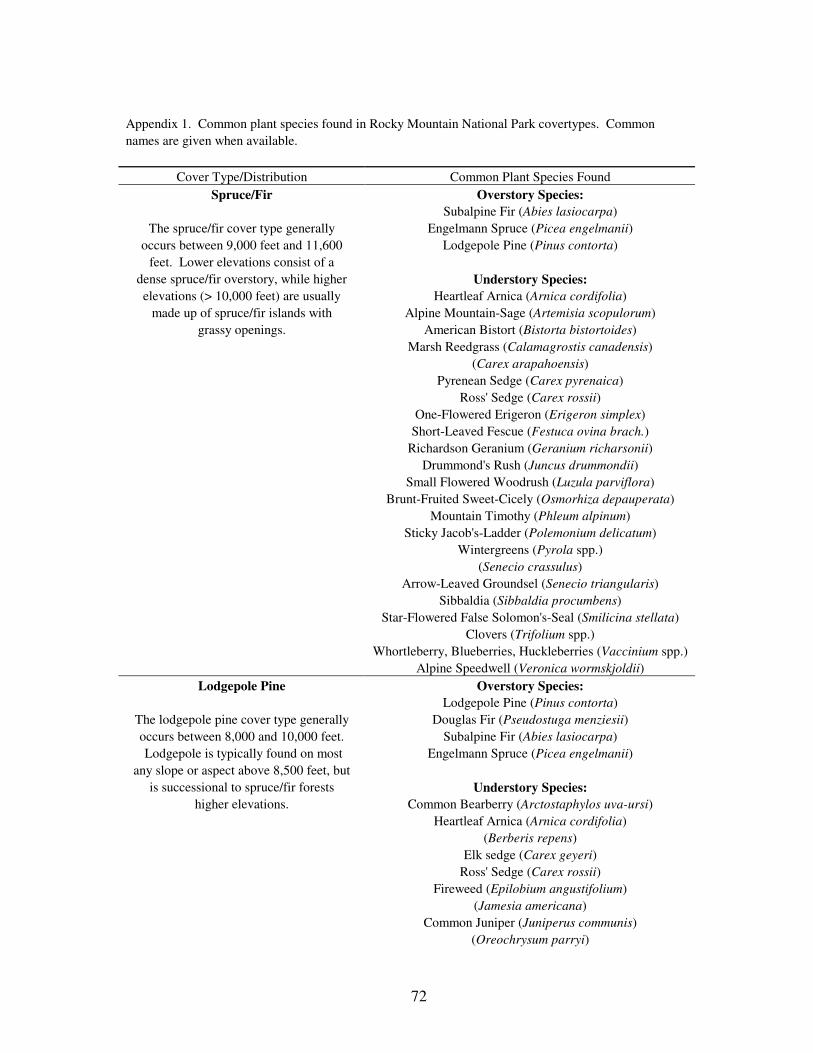
72
Appendix 1. Common plant species found in Rocky Mountain National Park covertypes. Common
names are given when available.
Cover Type/Distribution Common Plant Species Found
Spruce/Fir Overstory Species:
Subalpine Fir (Abies lasiocarpa)
The spruce/fir cover type generally Engelmann Spruce (Picea engelmanii)
occurs between 9,000 feet and 11,600 Lodgepole Pine (Pinus contorta)
feet. Lower elevations consist of a
dense spruce/fir overstory, while higher Understory Species:
elevations (> 10,000 feet) are usually Heartleaf Arnica (Arnica cordifolia)
made up of spruce/fir islands with Alpine Mountain-Sage (Artemisia scopulorum)
grassy openings. American Bistort (Bistorta bistortoides)
Marsh Reedgrass (Calamagrostis canadensis)
(Carex arapahoensis)
Pyrenean Sedge (Carex pyrenaica)
Ross' Sedge (Carex rossii)
One-Flowered Erigeron (Erigeron simplex)
Short-Leaved Fescue (Festuca ovina brach.)
Richardson Geranium (Geranium richarsonii)
Drummond's Rush (Juncus drummondii)
Small Flowered Woodrush (Luzula parviflora)
Brunt-Fruited Sweet-Cicely (Osmorhiza depauperata)
Mountain Timothy (Phleum alpinum)
Sticky Jacob's-Ladder (Polemonium delicatum)
Wintergreens (Pyrola spp.)
(Senecio crassulus)
Arrow-Leaved Groundsel (Senecio triangularis)
Sibbaldia (Sibbaldia procumbens)
Star-Flowered False Solomon's-Seal (Smilicina stellata)
Clovers (Trifolium spp.)
Whortleberry, Blueberries, Huckleberries (Vaccinium spp.)
Alpine Speedwell (Veronica wormskjoldii)
Lodgepole Pine Overstory Species:
Lodgepole Pine (Pinus contorta)
The lodgepole pine cover type generally Douglas Fir (Pseudostuga menziesii)
occurs between 8,000 and 10,000 feet. Subalpine Fir (Abies lasiocarpa)
Lodgepole is typically found on most Engelmann Spruce (Picea engelmanii)
any slope or aspect above 8,500 feet, but
is successional to spruce/fir forests Understory Species:
higher elevations. Common Bearberry (Arctostaphylos uva-ursi)
Heartleaf Arnica (Arnica cordifolia)
(Berberis repens)
Elk sedge (Carex geyeri)
Ross' Sedge (Carex rossii)
Fireweed (Epilobium angustifolium)
(Jamesia americana)
Common Juniper (Juniperus communis)
(Oreochrysum parryi)
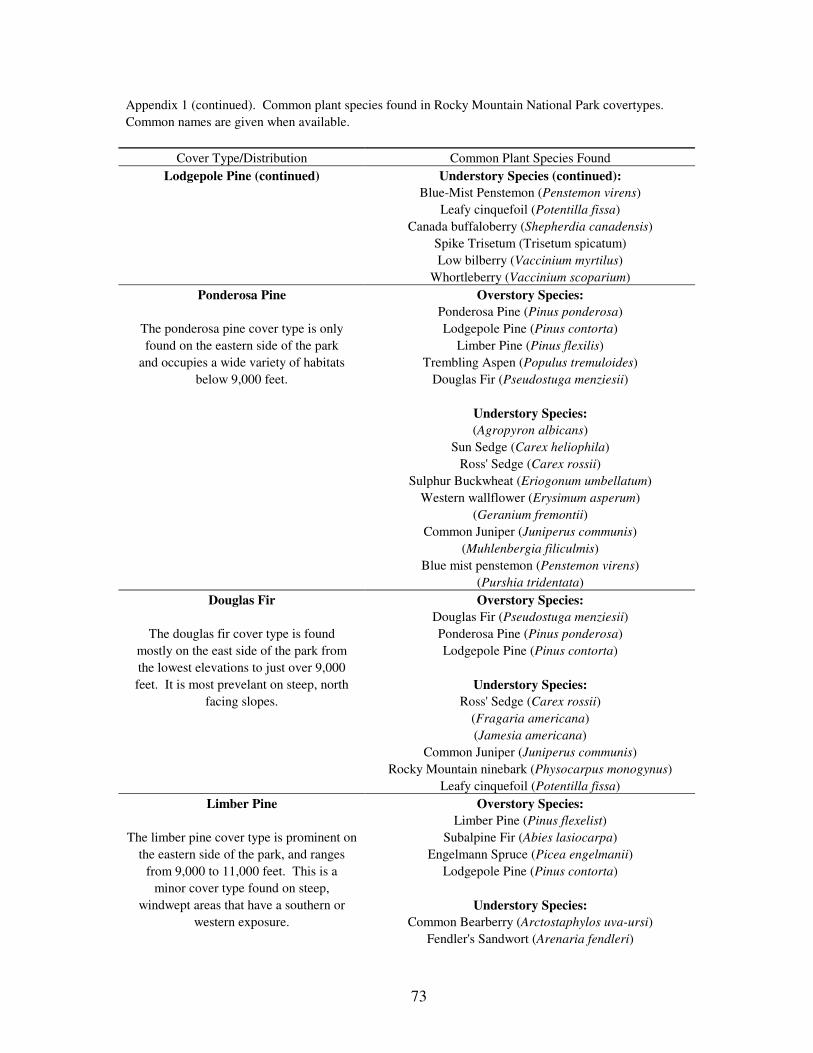
73
Appendix 1 (continued). Common plant species found in Rocky Mountain National Park covertypes.
Common names are given when available.
Cover Type/Distribution Common Plant Species Found
Lodgepole Pine (continued) Understory Species (continued):
Blue-Mist Penstemon (Penstemon virens)
Leafy cinquefoil (Potentilla fissa)
Canada buffaloberry (Shepherdia canadensis)
Spike Trisetum (Trisetum spicatum)
Low bilberry (Vaccinium myrtilus)
Whortleberry (Vaccinium scoparium)
Ponderosa Pine Overstory Species:
Ponderosa Pine (Pinus ponderosa)
The ponderosa pine cover type is only Lodgepole Pine (Pinus contorta)
found on the eastern side of the park Limber Pine (Pinus flexilis)
and occupies a wide variety of habitats Trembling Aspen (Populus tremuloides)
below 9,000 feet. Douglas Fir (Pseudostuga menziesii)
Understory Species:
(Agropyron albicans)
Sun Sedge (Carex heliophila)
Ross' Sedge (Carex rossii)
Sulphur Buckwheat (Eriogonum umbellatum)
Western wallflower (Erysimum asperum)
(Geranium fremontii)
Common Juniper (Juniperus communis)
(Muhlenbergia filiculmis)
Blue mist penstemon (Penstemon virens)
(Purshia tridentata)
Douglas Fir Overstory Species:
Douglas Fir (Pseudostuga menziesii)
The douglas fir cover type is found Ponderosa Pine (Pinus ponderosa)
mostly on the east side of the park from Lodgepole Pine (Pinus contorta)
the lowest elevations to just over 9,000
feet. It is most prevelant on steep, north Understory Species:
facing slopes. Ross' Sedge (Carex rossii)
(Fragaria americana)
(Jamesia americana)
Common Juniper (Juniperus communis)
Rocky Mountain ninebark (Physocarpus monogynus)
Leafy cinquefoil (Potentilla fissa)
Limber Pine Overstory Species:
Limber Pine (Pinus flexelist)
The limber pine cover type is prominent on Subalpine Fir (Abies lasiocarpa)
the eastern side of the park, and ranges Engelmann Spruce (Picea engelmanii)
from 9,000 to 11,000 feet. This is a Lodgepole Pine (Pinus contorta)
minor cover type found on steep,
windwept areas that have a southern or Understory Species:
western exposure. Common Bearberry (Arctostaphylos uva-ursi)
Fendler's Sandwort (Arenaria fendleri)
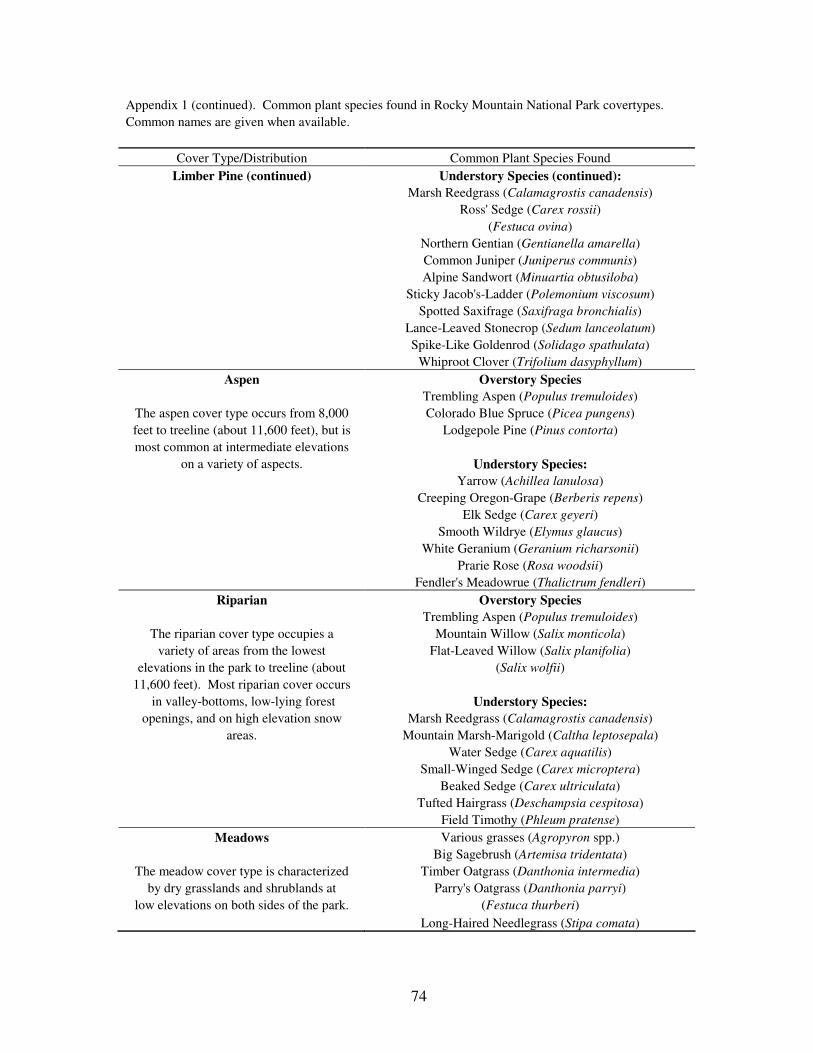
74
Appendix 1 (continued). Common plant species found in Rocky Mountain National Park covertypes.
Common names are given when available.
Cover Type/Distribution Common Plant Species Found
Limber Pine (continued) Understory Species (continued):
Marsh Reedgrass (Calamagrostis canadensis)
Ross' Sedge (Carex rossii)
(Festuca ovina)
Northern Gentian (Gentianella amarella)
Common Juniper (Juniperus communis)
Alpine Sandwort (Minuartia obtusiloba)
Sticky Jacob's-Ladder (Polemonium viscosum)
Spotted Saxifrage (Saxifraga bronchialis)
Lance-Leaved Stonecrop (Sedum lanceolatum)
Spike-Like Goldenrod (Solidago spathulata)
Whiproot Clover (Trifolium dasyphyllum)
Aspen Overstory Species
Trembling Aspen (Populus tremuloides)
The aspen cover type occurs from 8,000 Colorado Blue Spruce (Picea pungens)
feet to treeline (about 11,600 feet), but is Lodgepole Pine (Pinus contorta)
most common at intermediate elevations
on a variety of aspects. Understory Species:
Yarrow (Achillea lanulosa)
Creeping Oregon-Grape (Berberis repens)
Elk Sedge (Carex geyeri)
Smooth Wildrye (Elymus glaucus)
White Geranium (Geranium richarsonii)
Prarie Rose (Rosa woodsii)
Fendler's Meadowrue (Thalictrum fendleri)
Riparian Overstory Species
Trembling Aspen (Populus tremuloides)
The riparian cover type occupies a Mountain Willow (Salix monticola)
variety of areas from the lowest Flat-Leaved Willow (Salix planifolia)
elevations in the park to treeline (about (Salix wolfii)
11,600 feet). Most riparian cover occurs
in valley-bottoms, low-lying forest Understory Species:
openings, and on high elevation snow Marsh Reedgrass (Calamagrostis canadensis)
areas. Mountain Marsh-Marigold (Caltha leptosepala)
Water Sedge (Carex aquatilis)
Small-Winged Sedge (Carex microptera)
Beaked Sedge (Carex ultriculata)
Tufted Hairgrass (Deschampsia cespitosa)
Field Timothy (Phleum pratense)
Meadows Various grasses (Agropyron spp.)
Big Sagebrush (Artemisa tridentata)
The meadow cover type is characterized Timber Oatgrass (Danthonia intermedia)
by dry grasslands and shrublands at Parry's Oatgrass (Danthonia parryi)
low elevations on both sides of the park. (Festuca thurberi)
Long-Haired Needlegrass (Stipa comata)