The Ec Feas ergy Sugar Beet Biofuel Production in Central ...
28
Th e E conomi c F e as ibility of En e rgy Sugar B ee t Biofu e l Produ c tion in C e ntral North Dakota Th e in A . Maung and Col e R . Gus tafson D e partme nt of Agribusin ess and Appli e d E conomi cs, North Dakota Stat e Univ e r sity , Fargo, N D 58108 Se l ec t ed Pape r pr epar ed for pr ese n t a t ion a t t h e Agri c ul t ural & Appli ed E conomi cs A ssoc ia t ion 2010 AAEA , CAES, & WAEA Join t Annual M ee t ing, D e nve r , Colorado, July 25- 27, 2010 Copyright 2010 by The in Maung and Col e Gust a fson. All rights r ese rved. Re ade rs may ma ke ve rba t i m copi es of t hi s document f or non-comme r c ial purposes by any me ans, provided tha t thi s copyright not i ce appe ars on all such copi es.
Transcript of The Ec Feas ergy Sugar Beet Biofuel Production in Central ...
!
The E conomic Feasibility of Energy Sugar Beet Biofuel Production in Central North Dakota
Thein A . Maung and Cole R . Gustafson
Department of Agribusiness and Applied E conomics, North Dakota State University, Fargo, ND 58108
Selected Paper prepared for presentation at the Agricultural & Applied E conomics Association 2010 AA E A ,CA ES, & WA E A Joint Annual Meeting, Denver, Colorado, July 25-27, 2010
Copyright 2010 by Thein Maung and Cole Gustafson. All rights reserved. Readers may make
verbatim copies of this document for non-commercial purposes by any means, provided that this
copyright notice appears on all such copies.
!
The Economic Feasibility of Energy Sugar Beet Biofuel Production in Central North Dakota
Thein A. Maung and Cole R. Gustafson
Department of Agribusiness and Applied Economics, North Dakota State University, Fargo, ND 58108
Abstract
This study examines the financial feasibility of producing ethanol biofuel from sugar beets in central North Dakota. Under the Energy Independence and Security Act (EISA) of 2007, biofuel from sugar beets uniquely qualifies as an EISA mandates production of 15 billion gallons of advanced biofuels annually by 2022. A stochastic simulation financial model was calibrated with irrigated sugar beet data from central North Dakota to determine economic feasibility and risks of production for a 10MGY (million gallon per year) and 20MGY ethanol plant. Study results indicate that feedstock costs, which include sugar beets and beet molasses, account for more than 70% of total production expenses. The estimated breakeven ethanol price for the 20MGY plant is $1.52 per gallon and $1.71 per gallon for the 10MGY plant. Breakeven prices for feedstocks are also estimated and show that the 20MGYplant can tolerate greater ethanol and feedstock price risk than the 10MGY plant. Our results also show that one of the most important factors that affect investment success is the price of ethanol. At an ethanol price of $1.84 per gallon, and assuming other factors remain unchanged, the estimated net present value (NPV) of the 20MGY plant is $41.54 million. By comparison, the estimated NPV of the 10MGY plant is only $8.30 million. Other factors such as changes in prices of co-products and utilities have a relatively minor affect on investment viability.
Funding for this research was provided by the North Dakota Agricultural Products Utilization -Food Sugar beets as an Industrial Crop for Advanced
2!!
1. Introduction
U.S. ethanol demand has steadily increased following passage of Renewable Fuel Standard
(RFS) and the Energy Independence and Security Act of 2007 (EISA). Most domestic ethanol
production utilizes corn grain as feedstock. As production continues to rise, industry demand for
corn has increased substantially resulting in higher corn prices. Rising corn prices are
encouraging current and potential ethanol producers to seek alternative feedstocks, especially
cellulosic sources. EISA defines three classes of biofuels, conventional, advanced, and cellulosic.
These classes are differentiated based on potential reduction of greenhouse gas (GHG) emissions
of 20, 50, and 60 percent respectively. Existing biofuel producers are striving to develop new
conventional and cellulosic biofuels that qualify under EISA.
At present, several firms have pilot scale cellulosic ethanol production facilities under
construction and testing. However, the transition from pilot scale to full commercialization of
cellulosic ethanol will be long and difficult due to financial constraints being imposed on the
biofuel industry [1].
Advanced biofuels have received scant attention, primarily because feedstock supplies
are narrow. Two crops that EISA are sugar
beets and sugarcane. Advanced biofuel production of 15 billion gallons per year will be required
by 2022, creating a niche market opportunity.
In 2008, North Dakota and Minnesota account for about 55 percent of total sugar beet
production in the nation. In order to minimize transportation costs and GHG emissions, it would
be most cost effective to locate sugar-beet-based fuel ethanol plants in North Dakota or
Minnesota where sugar beet production is highly concentrated. In addition to expansion of
existing sugar beet acreage, beet molasses produced from existing sugar refineries is a surplus
commodity in the region and can also be used to produce ethanol. Beet molasses has a higher
3!!
concentration of sugar than sugar beets and hence can result in higher rates of ethanol production
and plant efficiency.
Highlands Enviro Fuels LLC (HEF) is developing a 20 million gallon per year (MGY)
ethanol plant in Highlands County, Florida, which will process non-food sweet sorghum and
sugar cane as its primary feedstocks. The company has completed a life-cycle analysis of
greenhouse gas (GHG) emissions and demonstrated that the planned sugar-based ethanol process
will result in 80 percent lower GHG emissions than the equivalent petroleum-based gasoline.
This reduction in GHG emissions will allow its ethanol to qualify as biofuel.
The model developed in this study is based on 10MGY and 20MGY ethanol plants in
central North Dakota which use non-food sugar beets and beet molasses as primary feedstocks.
Ethanol produced from this plant is expected to have GHG emissions that are lower than the
because a co-product of production is spray dried in a patented
process and used to generate .
1.1 Rationale and objective
Production of advanced biofuels using sugar beets as a feedstock in North Dakota would have
the following comparative advantages:
1. Low transportation, storage and processing costs of sugar beets in the region due to close
proximity to the resource, cool climate, and already existing processing infrastructure.
2. Because of their high sugar content, sugar beets can double the ethanol production per
acre as compared to corn which reduces land area requirements.
3. Unlike corn, sugar beets produce higher sugar in soils with minimal nitrogen, a key
contributor to GHG.
4!!
4. The region has great potential to expand irrigated sugar beet production, minimizing land
competition with existing food crops.
5. The process of sugar-to-ethanol conversion is simpler than that of corn-to-ethanol
conversion and hence requires less capital and energy resulting in lower production costs
and greenhouse gas emissions.
6. Current sugar producers and processors in the region can diversify their assets by
producing both sugar-beet-based ethanol and beet sugar.
The goal of this study is to investigate the economic feasibility of sugar-beet-based fuel
ethanol production in central North Dakota. Results from this study will contribute to growing
literature on the feasibility of producing ethanol from alternative feedstocks in the U.S.
2. E conomic Impact of Sugar Beet Production in Central North Dakota
Currently, U.S. sugar beets are processed into food sugar. If sugar-beet-based ethanol was to be
produced, more sugar beets would have to be planted in North Dakota to meet the demand for
both ethanol and sugar production. By growing additional sugar beets for ethanol production,
farmers can generate positive econo
for production inputs and net returns from production. Table 1 shows the economic impacts of
irrigated and non-irrigated sugar beet production in central North Dakota based on the ten year
average data of crop enterprise analysis. As can be seen in the table, the economic impact of
farm net returns is about $539.13 per acre for irrigated sugar beets and $201.39 per acre for non-
irrigated sugar beets. Economic impact from the farm total expenditures is about $804.87 per
acre for irrigated sugar beets and $592.83 per acre for non-irrigated sugar beets.
This study examines the economic feasibility of 10MGY and 20MGY fuel ethanol plants.
To produce 10MGY (20MGY) of fuel ethanol from sugar beets, one would need 377,358
5!!
(754,717) tons of sugar beets per year. In order to produce 754,717 of sugar beets for a 20MGY
ethanol plant, 23,585 acres of farm land for irrigated sugar beets or 39,911 acres of farm land for
non-irrigated sugar beets would be required, assuming that one acre of farm land yields 32 tons
of irrigated sugar beets and 19 tons of non-irrigated sugar beets. If we assume that the average
net return in Table 1 holds true for all growers of irrigated (or non-irrigated) sugar beets in
central North Dakota, then additional farm income of $12.72 million (or $8.04 million) can be
generated by the growers as a result of 20 MGY sugar-beet-based ethanol production. Similarly,
as a result of 20MGY of sugar-beet ethanol production, the direct economic impact from the
expenditures of irrigated (or non-irrigated) sugar-beet production inputs would be about $18.98
million (or $23.66 million).
3. Background and L iterature
Many studies have examined the economic feasibility of corn-based ethanol production.
However, only a few have assessed the feasibility of producing sugar-based ethanol. Outlaw et
al. [2] analyzed the feasibility of integrating ethanol production into the existing sugar mill that
uses sugarcane juice as the feedstock for ethanol production. They developed anannual Monte
Carlo simulation financial model which analyzed a 40 MGY (million gallons per year) ethanol
plant for 10 years. They found that existing sugar mills could be retrofitted to produce ethanol
and usually generated positive annual returns. Overall net present value (NPV) was found to be
positive in their study.
USDA [3] assessed the feasibility of ethanol production from sugar in the U.S. The
USDA study made use of a variety of published data to estimate the cost of producing ethanol
from sugarcane, molasses and sugar beet. The study found that it is economically feasible to
make ethanol from molasses and that producing ethanol from sugar beets and sugarcane can
6!!
become profitable only with spot market prices for ethanol rose to $4 per gallon. Yoder et al. [4]
investigated the potential development of an ethanol industry in Washington State utilizing sugar
beets as a feedstock. Their model was based on a 20 MGY plant utilizing not only sugar beets
but beet pulp in a hydrolysis process to produce ethanol. Results from their study did not offer
positive prospects for the development of a sugar-beet ethanol industry in Washington State
primarily due to the high costs of sugar beet production and high costs of transportation to a
sugar beet processing plant. They pointed out that Washington State simply does not have a
comparative advantage in producing fuel ethanol using sugar beets.
Factors that may have significant economic impact on the feasibility of utilizing sugar
beets to produce ethanol include ethanol and gasoline prices, price of inputs such as sugar beets
and beet molasses, and corn and sugar prices. Studies [5,6] show that ethanol price is the most
important factor when considering the profitability of an investment in ethanol production.
Higher ethanol prices are directly correlated with higher profits. Zhang et al [7] indicate that
ethanol demand is a derived demand from gasoline production, the price of gasoline would have
a direct influence on the price of ethanol. Serra et al [8] show that in the U.S., ethanol, corn and
oil prices tend to move together over the long run and a positive/negative shock in oil and corn
prices causes a positive/negative change in ethanol prices. Because U.S. ethanol producers have
negligible market power in the gasoline/oil sector, they are price takers in the biofuel market.
Currently in the U.S., all sugar beets are used to produce food sugar. Hence, the relationship
between sugar and ethanol prices is non-existent. However, in Brazil, sugar and ethanol prices
tend to move together because a large number of plants are dual plants producing both sugar and
ethanol and they can easily switch between the production of sugar and ethanol based on relative
prices [9]. An increase in corn prices in the U.S. and sugar prices in Brazil will have negative
7!!
impacts on the of ethanol. Nevertheless, Coltrain [5] argues that only extremely
high input grain prices can cause substantial losses in ethanol production when the price of
ethanol is $1.77 per gallon.
4. Methodology and Data Description
4.1 Technology Overview
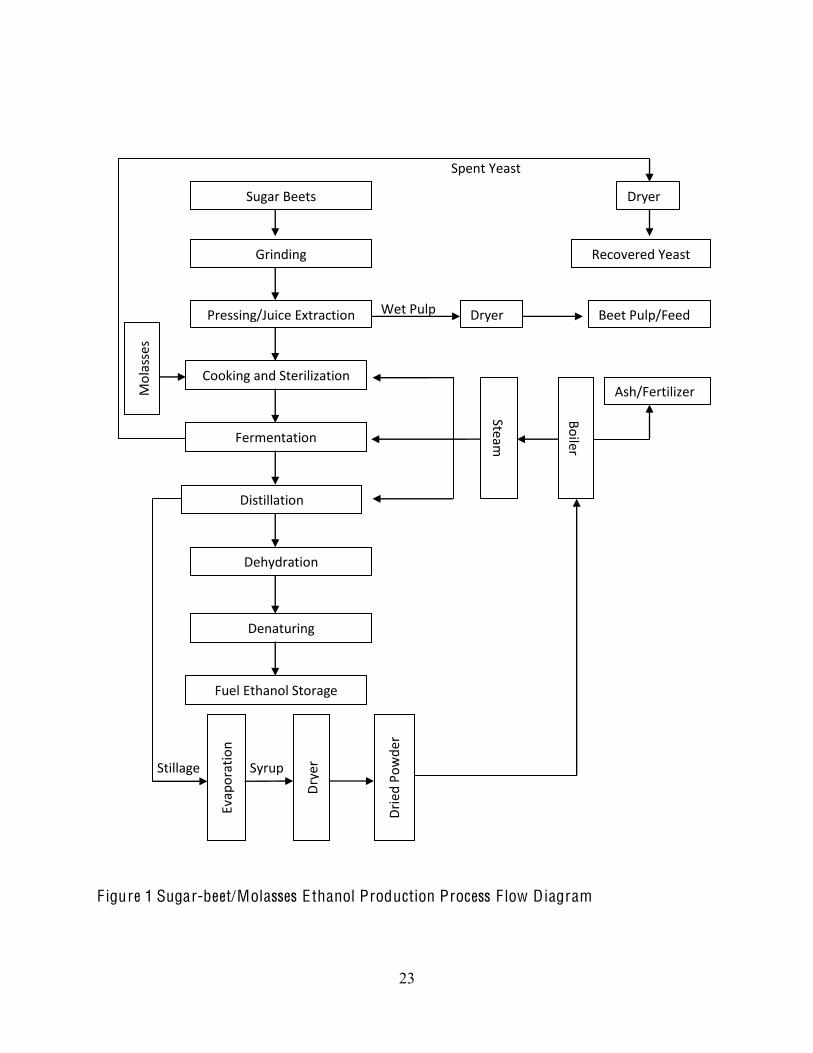
Sugar beet/molasses ethanol production technology utilizing spray-dried yeast is illustrated in
Figure 1. Sugar-based ethanol production processes involve simple sugar molecules rather than a
large amount of solid starch. Consequently the production processes require fewer operations
than starch- or cellulose-based ethanol production processes [10]. As shown in Figure 1, sugar
beets are first ground before further processing. Ground pieces are pressed and extracted to
produce sugar juice. The actual grinding process for preparing energy beets for biofuel is less
refined compared with sugar production in which beets are sliced. Simple grinding can tolerate
a wider variety of soil types and
geographic locations. Once the juice is extracted, it is separated from solid beet pulp which is
processed into animal feed. Before the final product of fuel ethanol is produced, sugar bearing
juice moves through various stages of cooking, sterilization, fermentation, distillation,
dehydration, and denaturing similar to corn ethanol production. During the fermentation
process yeast is added to convert sugar to ethanol. The spent yeast is then recovered through
centrifugation and a spray drying processes. The recovered yeast can be sold as a co-product or
used for plant thermal needs. After the distillation process, the left over solid known as stillage is
converted into a syrup through the evaporation process. The syrup is then dried to a powder
which is used to The
remaining thermal energy requirements are assumed to be generated from natural gas. Ash
8!!
generated by the boiler during the energy production process can be sold as a fertilizer.
Electricity to operate the plant is purchased.
4.2 Assumption and Method
This study uses 10MGY and 20MGY ethanol plant models to examine the economic feasibility
of producing ethanol from sugar-beet-based feedstocks in central North Dakota. At present all
sugar beets grown in North Dakota are used to produce sugar for consumption and the majority
of sugar beet production is concentrated in eastern part of the state. In order to allow
development of sugar beet production in new geographic regions for ethanol production, the
model in this study assumes that 30% sugar beet feedstock (324 tons per day for the 10MGY
plant and 648 tons per day for the 20MGY plant) and 70% molasses (220 tons and 514 tons per
day for each respective plant type) will be used initially. Over time as sugar beet acres increase,
the model assumes a gradual increase in the use of sugar beets from 30% to 70% and a gradual
decrease in the use of beet molasses from 70% to 30%. Both sugar beet growers and beet
molasses suppliers will be contracted to supply all the required feedstocks. Total investment
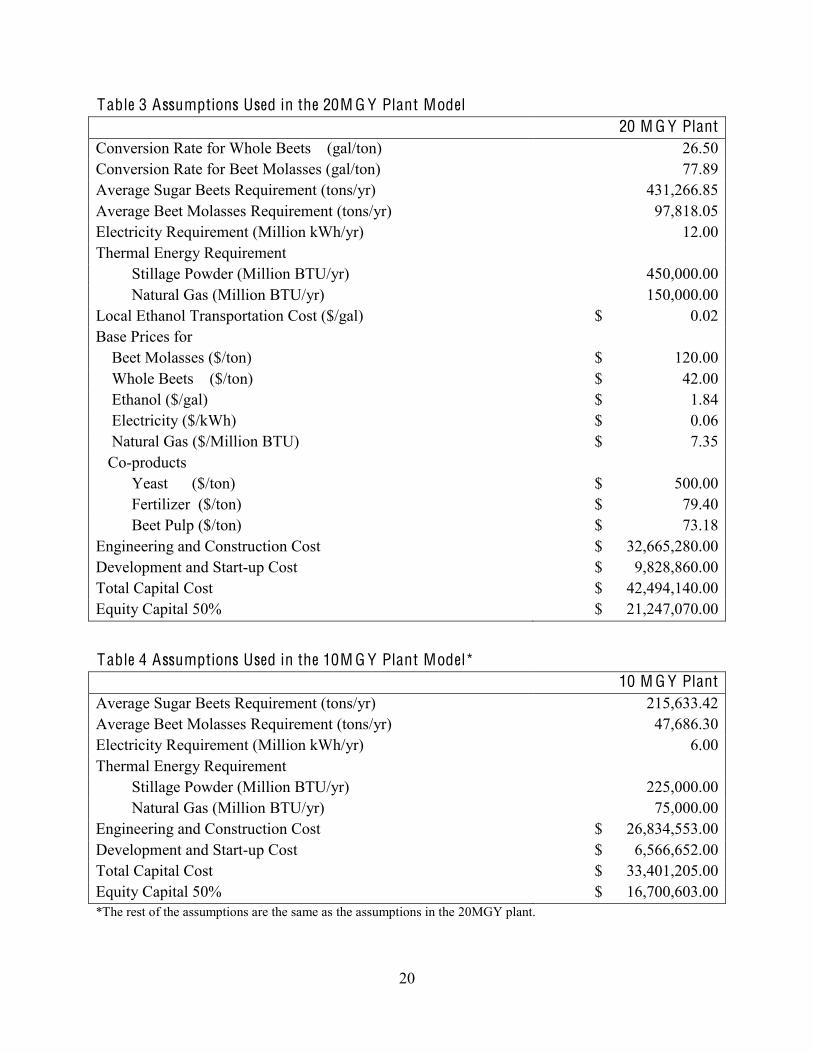
costs are shown in Table 3 and 4 for both 20MGY and 10MGY plants. Engineering and
construction costs, and development and start-up costs for the 20MGY and 10MGY plants
respectively account for about $42.5 million and $33.4 million, and financed with 50% equity
and 50% debt at 8.5% interest over 10 years.
Technical conversion data originate from a BBI study [10] and localized with price
information and sugar beet production cost data from central North Dakota. The model can be
categorized into four sections. The first section describes production assumptions which include
the conversion of sugar beets and beet molasses to ethanol, the annual requirement for feedstocks
and their respective prices, the annual co-product yields and prices, and the annual requirements
9!!
for electricity and natural gas. The second section constructs an income statement with annual
ethanol and co-product sale revenues, production costs, and administrative and operating
expenses. The cash flow financial statement is established in the third section with variables
including annual net earnings, working capital balances, investment activities, financing
activities and net cash balance. In the final section, the balance sheet with annual asset values,
liabilities and equities is developed. The net present value (NPV) is used to conduct sensitivity
and risk analysis and to determine breakeven prices for ethanol, sugar beet and beet molasses.
The NPV is calculated using the following formulation:
! " " #" $% # &
%'
!%
NCF represents net cash flows. The relationship between NCF and net income (NI) can be
expressed as follows:
! # ( " "
! ) ) "
where represents stochastic output prices which include ethanol and co-product prices. is
defined as stochastic input prices which include prices of sugar beets, molasses, electricity,
natural gas, yeast and enzymes etc. Other costs include administrative and operating expenses,
and interest, depreciation and amortization expenses. The discount rate, i, is assumed to be 8.5
percent in this study. The model produces a ten year operating financial forecast.
4.2 Stochastic Data Description
Stochastic variables used in the model are annual prices for ethanol, co-products (which include
feed, yeast, and fertilizer), sugar beet, beet molasses, electricity and natural gas. Remaining
variables are deterministic. Ethanol and co-product prices represent risk,
10!!
while other input prices Annual data used in simulation
were from 2001 to 2008. Annual ethanol price data were collected from the Official Nebraska
Government Website [11] and are used as proxies for North Dakota ethanol prices. Annual North
Dakota natural gas and electricity prices were gathered from the DOE-EIA [12,13]. Annual
North Dakota sugar beet prices1 were obtained from the USDA-ERS [14]. Beet molasses prices
were assumed to vary from $100 per ton to $200 per ton during the simulation. Similar
assumptions were made for co-product prices. Data, distribution and assumptions used in the
model are summarized in Table 2, 3 and 4. Distributions of ethanol, natural gas and electricity
prices in Table 2 were determined using the fitting algorithms in @Risk [15]. Due to data
limitations, prices for co-products and beet molasses were modeled as a triangular distribution as
described in the table. The data/assumptions described in Table 3 and 4 were based on the study
of Heartland Renewable Energy [10] and local industry sources. The financial model was
transformed into a Monte Carlo simulation model using @Risk simulation package. Simulation
results are shown in Figure 2, 3, 4 and 5. The simulated model was iterated 1000 times, each
time with a different price level.
5. Results and Discussion
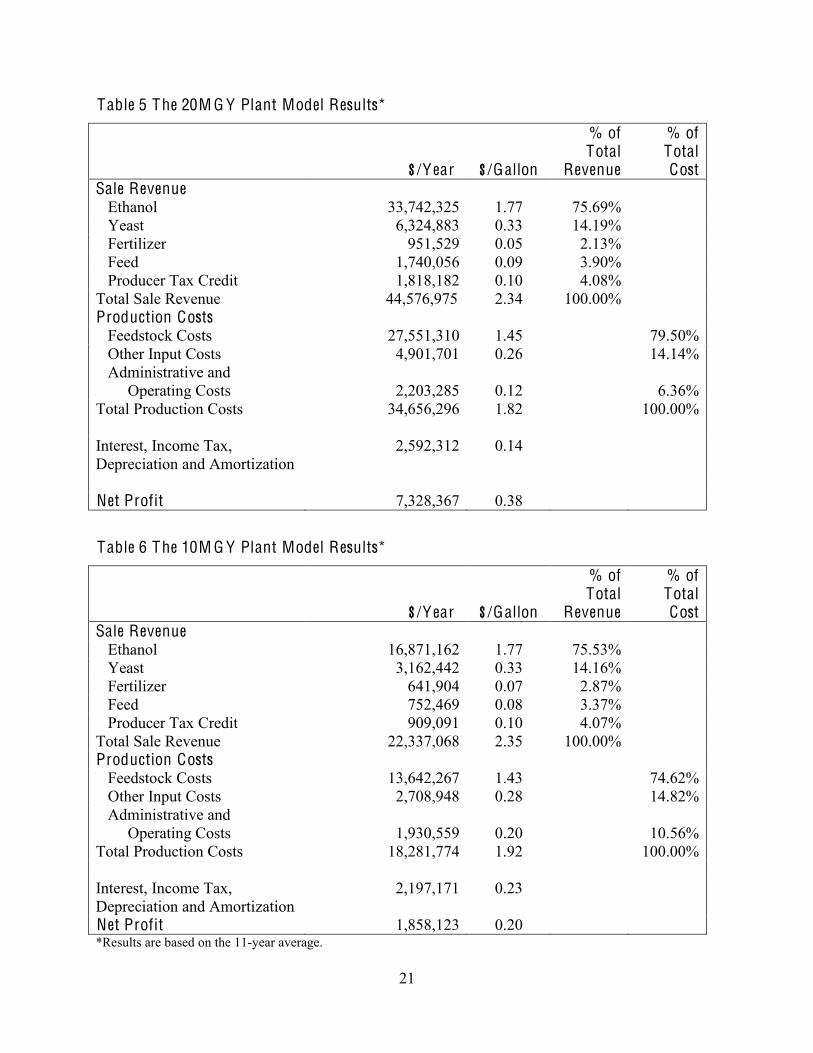
Financial results for both plant sizes are reported in Table 5 and 62. The 20MGY model results in
Table 5 show that on average the plant is expected to generate about $33.7 million of revenue per
year from ethanol sales and about $9 million of revenue per year from co-product sales.
Production costs include feedstock, chemical, labor, utility, administrative and operating costs
etc. which average $34.7 million per year. Other expenses include interest, income tax,
depreciation and amortization costs total about $2.6 million per year. Net profit for the plant
!!!!!!!!!!!!!!!!!!!!!!!!!!!!!!!!!!!!!!!!!!!!!!!!!!!!!!!!!!!"!2008 data for sugar beet price was unavailable, 2007 data was used instead.!2 The ethanol base price of $1.84 per gallon is assumed for these results.!
11!!
averages $7.3 million per year. Results are also reported in dollars per gallon. Similarly, results
for the 10MGY model shown in Table 6 can be interpreted in the same manner. The table
indicates that on average the 10MGY ethanol plant generates about $1.86 million per year of net
profit which is much less than that of 20MGY plant. Feedstock costs account for 80% of total
production expenses for the 20MGY plant and 75% for the 10MGY plant. To determine the
profitability of equity investment in sugar-beet-based ethanol production in central North
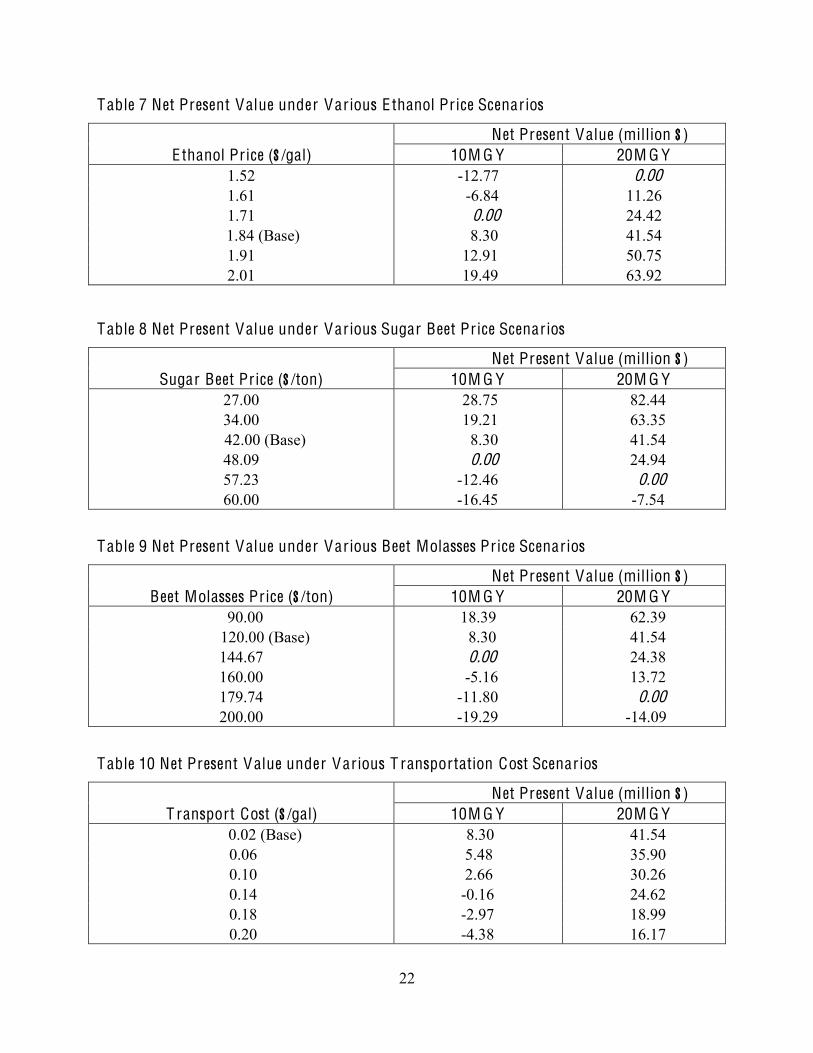
Dakota, the NPV is estimated for the project. Assuming the price of ethanol is $1.84 per gallon,
the NPV is found to be about $41.54 million for the 20MGY ethanol plant (see Table 7) which
suggests that investment in sugar-beet-based ethanol production is profitable. The estimated
NPV for the 10MGY plant is about $8.3 million which also implies profitable investment under
this model. However, fluctuations in ethanol prices can have a substantial impact on the
profitability of ethanol production.
5.1 Sensitivity and Risk Analysis
5.1.1 Sensitivity of NPV to Output Prices
The NPVs for both ethanol plant sizes under varying ethanol prices are reported in Table 7. The
table shows that breakeven prices for the 10MGY and 20MGY plants are $1.71 per gallon and
$1.52 per gallon respectively. This suggests that sugar-beet-based ethanol producers can afford
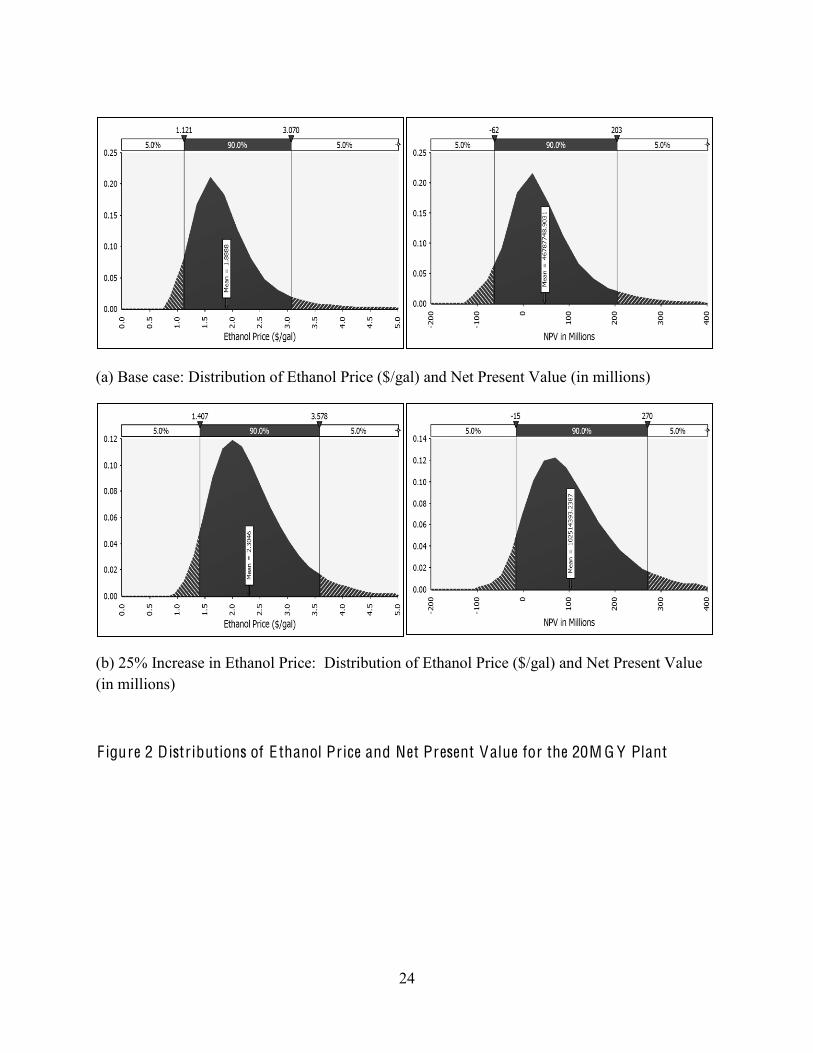
to bear more ethanol price risks by producing 20MGY rather than 10MGY. Figure 2 shows the
distribution of ethanol price and its impact on the distribution of NPVs for the 20MGY plant.
The figure is simulated based on two cases: base ethanol price scenario and 25% increase in
ethanol price scenario. The distribution of base ethanol price is fitted based on the annual historic
ethanol prices. The base case scenario (Figure 2a) indicates that distributions of ethanol price and
NPV have mean values of $1.89 per gallon and $46.8 million respectively. The figure suggests
12!!
that with 30% probability, the NPV for the 20MGY plant can become negative. Similarly, Figure
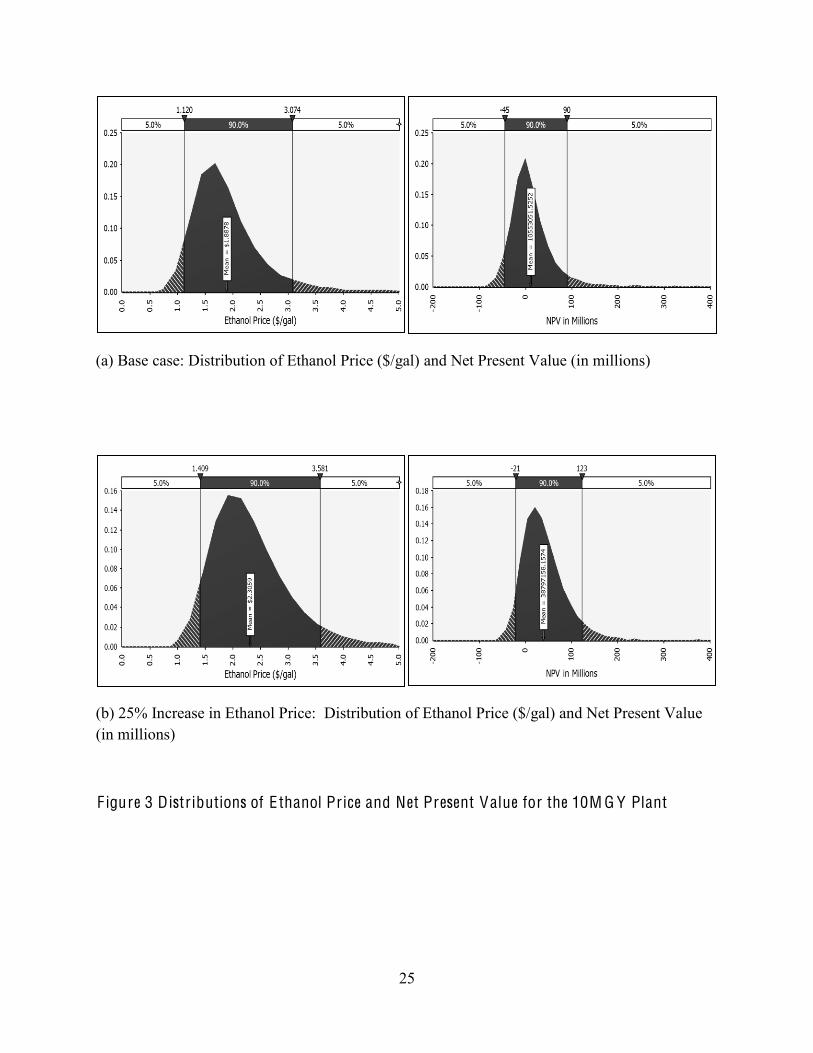
3 shows the distribution of ethanol price and its impact on the distribution of NPVs for the
10MGY plant. The figure implies that with about 47% probability, the NPV for the 10MGY
plant can become negative. Both Figure 2 and 3 show that as the mean price of ethanol increases,
the risk of generating negative NPV declines. Conversely, if the mean ethanol price decreases,
the risk of generating negative NPV increases. Overall, we can conclude that the 20MGY plant
has a higher chance of generating a positive NPV than the 10MGY plant.
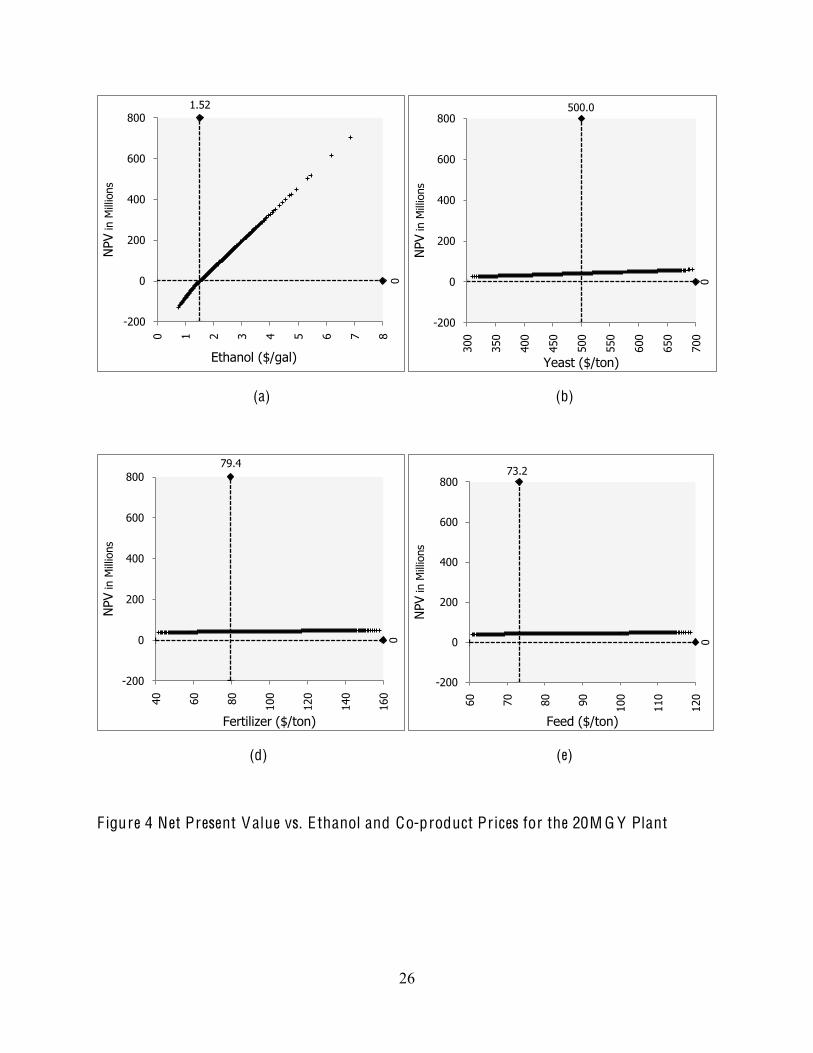
Using base case values, ethanol prices are plotted against the NPVs and depicted in
Figure 4 (a) for the 20MGY plant. Again the breakeven price for ethanol is shown to be $1.52
per gallon for the 20MGY plant. As a whole, Figure 4 shows that ethanol price is the most
significant variable in affecting the profitability of the investment. A small change in ethanol
price will have a large impact on the NPV. Comparatively, Figure 4 suggests that the sale of co-
products such as yeast, fertilizer and feed have negligible impact on revenue generation. This
especially holds true for fertilizer and feed. Similar results (not shown here) can be reported and
interpreted for the 10MGY plant.
5.1.2 Sensitivity of NPV to Input Prices
Producers of ethanol face potential risks not only from ethanol price changes but from
variations in feedstock and other input prices. Analyses were conducted to examine the impact of
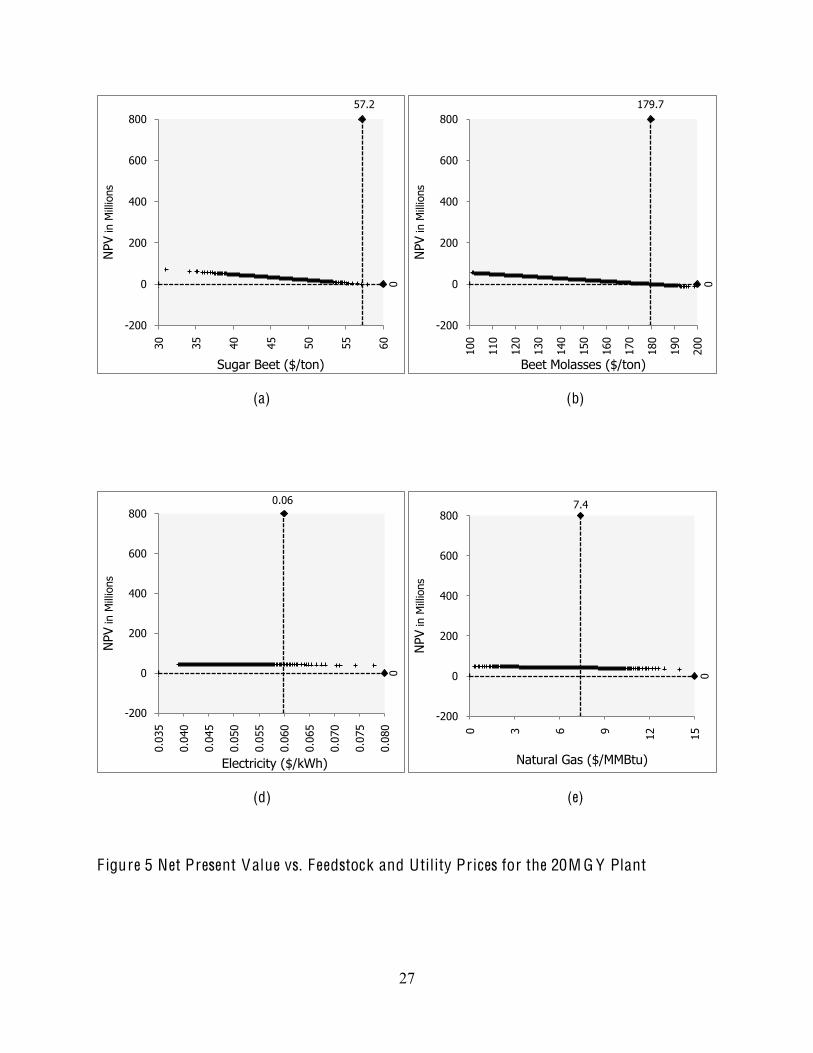
input price changes on investment risk. Figure 5 illustrates the impact of fluctuations in
feedstock and other input prices on the NPVs for the 20MGY model. As expected, the figure
indicates that variations in sugar beet and beet molasses prices will have a relatively large impact
on profit level since feedstock costs account for more than 70% of total production expenses. In
the figure (also see Table 8 and 9), breakeven prices for sugar beets and beet molasses (about
13!!
$57 per ton and $180 per ton respectively) for the 20MGY plant are shown to be much higher
than their assumed base prices. This suggests that the 20MGY plant has some leeway in allowing
feedstock prices to fluctuate from their base level without having a critical impact on the profits.
However, for the 10MGY plant, little leeway is allowed for the feedstock price changes as can be
seen in Table 8 and 9. Variations in utility expenses such as electricity and natural gas expenses
are found to have little impact on the NPVs (see Figure 5). Because of the economies of scale
involved in a large production, ethanol producers would find it more desirable to produce 20
MGY of ethanol rather than 10 MGY. By doing so they would be able to generate more cash
revenues from ethanol sales and hedge against future ethanol and feedstock price risks.
5.1.3 Sensitivity of NPV to Transportation Cost
Another important factor that will affect the profitability of sugar-beet ethanol investment is
transportation cost. This study assumes that ethanol is transported via truck to local and regional
markets. The base cost of transport is assumed to be $0.02 per gallon. Because the transport cost
is directly linked to the price of ethanol, a slight variation in the cost will have a high impact on
the profitability of investment. Table 10 reports the sensitivity of changes in transport cost on the
NPV. Assuming that other variables remain unchanged, the table shows that a $0.12 increase in
transport cost will result in a negative NPV for the 10MGY plant. As expected, the 20MGY plant
can endure a larger increase in transport cost from its base level without having a tremendously
great impact on the NPV.
6. Conclusions
At present no fuel ethanol has been commercially produced from sugar beets in the U.S. The
purpose of this paper is to assess the feasibility of producing ethanol from sugar beets in central
North Dakota. Due to its close proximity to the sugar beet supply market, cool climate, and
14!!
already existing processing infrastructure, North Dakota has the potential to produce sugar-beet-
based fuel ethanol. Results in this study indicate that ethanol sales account for more than 70% of
sale revenues. Similarly, on the cost side, feedstock costs account for more than 70% total
production expenses.
One of the most important factors that affect the profitability of the investment is the
price of ethanol. At the base price of $1.84 per gallon and assuming other factors remain
unchanged, the estimated net present value (NPV) for the 20MGY plant is about $41.54 million
which is well above zero. At that price level, sugar-beet-based ethanol production could become
attractive to investors. The estimated NPV for the 10MGY plant is about $8.3 million. The
breakeven ethanol prices for the 10MGY and 20MGY plants are respectively found to be $1.71
per gallon and $1.52 per gallon. This indicates that the 20MGY plant can endure more ethanol
price risks than the 10MGY plant. Other factors such as changes in prices of co-products have a
relatively minor affect on the profitability of investment. Variations in feedstock prices such as
increase/decrease in sugar beet and beet molasses prices can have a negative/positive impact on
the investment profitability. The breakeven prices for these feedstocks are found to be much
higher than their assumed base prices for the 20MGY plant. This suggests that the 20MGY plant
can tolerate more feedstock price fluctuations than the 10MGY plant. Fluctuations in utility
prices such as electricity and natural gas prices are found to have little impact on the profitability
of investment.
Overall, this study shows that from the producer standpoint it would be more worthwhile
to construct the 20MGY ethanol plant than the 10MGY plant, because the 20MGY plant can
withstand larger ethanol and feedstock price swings than the 10MGY plant. The price of ethanol
will be one of the most important factors for determining the future feasibility of a sugar-beet-

15!!
based ethanol plant in central North Dakota. Because the price of ethanol closely follows the
price of crude oil, future investment decisions on a sugar-beet-based ethanol plant will likely
depend on future crude oil prices.
16!!
References
[1] Gustafson CR. Financing Growth of Cellulosic Ethanol. <http://agecon search .umn.edu/bitstream/44870/2/AAE8003.pdf>, accessed August 2009.
[2] Outlaw JL, Ribera LA, Richardson JW, Silva J, Bryant H, and Steven LK. 2007.
Economics of Sugar-Based Ethanol Production and Related Policy Issues. Journal of Agricultural and Applied Economics 2007; 39:357-63.
![3] United States Department of Agriculture (USDA). The Economic Feasibility of Ethanol
Production from Sugar in the United States. http://www.usda.gov/oce/reports/ energy/EthanolSugar FeasibilityReport3.pdf, accessed June 2009.!
[4] Yoder J, Young D, "#$%&'(!)*!Chen J, Davenport J, and Galinato S. Potential for a Sugar Beet Ethanol Industry in Washington State. <http://agr.wa.gov/ AboutWSDA/ Docs/Ethanol% 20from%20WA%20Sugar%20Beets%20WSU%20Study % 20March2009.pdf>, accessed June 2009.
[5] Coltrain D. Economic Issues with Ethanol. <http://www.agmanager.info/agribus/energy/
Econ%20Issues%20with%20Ethanol%20_2_.pdf>, accessed August 2009.
[6] Herbst BK, Outlaw JL, Anderson DP, Klose SL, and Richardson JW. The Feasibility of Ethanol Production in Texas. <http://ageconsearch.umn.edu/bitstream/35181/1/sp03he05. pdf>, accessed August 2009.
[7] Zhang Z, Lohr L, Escalante C, and Wetzstein M. Ethanol, Corn, and Soybean Price
Relations in a Volatile Vehicle-Fuels Market. Energies 2009; 2: 320-39.
[8] Serra T, Zilberman D, Gil JM, and Goodwin BK. Nonlinearities in the US Corn-ethanol-oil Price System. <http://ageconsearch.umn.edu/bitstream/ 6512/2/ 464896.pdf>, accessed August 2009.
[9] Elobeid A and Tokgoz S. Removing Distortions in the U.S. Ethanol Market: What Does It
Imply for the United States and Brazil? American Journal of Agricultural Economics 2008; 90: 918-32.
[10] Heartland Renewable Energy (HRE). Feasibility Study for Ethanol Production in Muscatine, IA. A Report prepared for HRE by BBI International, September 2008.
[11] Official Nebraska Government Website. <http://www.neo.ne.gov/statshtml/66.html>, accessed August 2009.
17!!
[12] Department of Energy: Energy Information Administration (DOE-EIA). Table 5.3. Average Retail Price of Electricity to Ultimate Customers: Total by End-Use Sector. <!http://www.eia.doe.gov/cneaf/electricity/epm/table5_6_b.html>, accessed October 2009.
[13] Department of Energy: Energy Information Administration (DOE-EIA).!North Dakota Natural Gas Industrial Price (Dollars per Thousand Cubic Feet). <http://tonto.eia.doe.gov /dnav/ng/hist/n3035nd3A.htm>, accessed October 2009.
[14] United States Department of Agriculture - Economic Research Service (USDA-ERS). Table 12. Sugarbeet: Price per ton, by State and United States.#http://www.ers.usda.gov/ briefing/sugar/data.htm>, accessed October 2009.
[15] Palisade Corporation. @Risk 4.5 2009 Professional Edition. Software. New York, NY.
18!!
Table 1 E conomic Impact of Sugar Beet Production in Central North Dakota
I r rigated Non-ir rigated Yield per Acre (in ton) 32.00* 18.91 Value per ton ($) 42.00 42.00 Return per Acre ($) 1,344.00 794.22 Variable Costs per Acre ($) Seed 56.54 57.75 Fertilizer 57.22 42.91 Crop Chemicals 114.33 106.57 Crop Insurance 26.88 19.92 Irrigation Energy 25.61 0.00 Fuel and Oil 59.28 40.52 Repairs 93.35 57.94 Land Rent 50.00** 50.00** Hauling and Trucking 73.98 0.00 Stock/Quota Lease 0.00 24.82 Machinery Leases 31.73 0.23 Others 62.81 58.26 Fixed Costs per Acre ($) Machinery and Building Depreciation 75.15 53.78 Hired Labor 47.16 30.69 Farm Insurance 7.34 4.02 Interest 21.27 16.19 Utilities 4.43 4.14 Others -2.21 25.09 Total Production Costs per Acre ($) 804.87 592.83 Net Return per Acre ($) 539.13 201.39 Note: Both irrigated and non-irrigated cost data are the 10-year average data. Irrigated cost data are based on the Minnesota , as no irrigated sugar beets are produced in North Dakota. *Based on the yield trial data in Carrington, central North Dakota. **Based on the average land rent value of central North Dakota. Source: FINBIN Farm Financial Database.
19!!
Table 2 Data and Distribution for Stochastic Variables
Variable Minimum Mean Maximum Standard Deviation
Distribution*
Prices for Beet Molasses ($/ton) 101.03 140.00 199.16 21.62 Triangular Whole Beets ($/ton) 31.00 45.87 60.02 3.35 Logistic Ethanol ($/gal) 0.75 1.89 7.84 0.68 Log Logistic Electricity ($/kWh) 0.03 0.04 0.09 0.01 Exponential Natural Gas ($/Million BTU) 0.00 6.23 16.48 2.10 Logistic Co-products Yeast ($/ton) 308.92 500.00 694.07 81.70 Triangular Fertilizer ($/ton) 41.16 93.13 158.15 24.99 Triangular Beet Pulp ($/ton) 60.77 84.39 118.74 12.88 Triangular *Distributions are the same for both 10MGY and 20MGY plants
20!!
Table 3 Assumptions Used in the 20M G Y Plant Model 20 M G Y Plant Conversion Rate for Whole Beets (gal/ton) 26.50 Conversion Rate for Beet Molasses (gal/ton) 77.89 Average Sugar Beets Requirement (tons/yr) 431,266.85 Average Beet Molasses Requirement (tons/yr) 97,818.05 Electricity Requirement (Million kWh/yr) 12.00 Thermal Energy Requirement Stillage Powder (Million BTU/yr) 450,000.00 Natural Gas (Million BTU/yr) 150,000.00 Local Ethanol Transportation Cost ($/gal) $ 0.02 Base Prices for Beet Molasses ($/ton) $ 120.00 Whole Beets ($/ton) $ 42.00 Ethanol ($/gal) $ 1.84 Electricity ($/kWh) $ 0.06 Natural Gas ($/Million BTU) $ 7.35 Co-products Yeast ($/ton) $ 500.00 Fertilizer ($/ton) $ 79.40 Beet Pulp ($/ton) $ 73.18 Engineering and Construction Cost $ 32,665,280.00 Development and Start-up Cost $ 9,828,860.00 Total Capital Cost $ 42,494,140.00 Equity Capital 50% $ 21,247,070.00
Table 4 Assumptions Used in the 10M G Y Plant Model* 10 M G Y Plant Average Sugar Beets Requirement (tons/yr) 215,633.42 Average Beet Molasses Requirement (tons/yr) 47,686.30 Electricity Requirement (Million kWh/yr) 6.00 Thermal Energy Requirement Stillage Powder (Million BTU/yr) 225,000.00 Natural Gas (Million BTU/yr) 75,000.00 Engineering and Construction Cost $ 26,834,553.00 Development and Start-up Cost $ 6,566,652.00 Total Capital Cost $ 33,401,205.00 Equity Capital 50% $ 16,700,603.00 *The rest of the assumptions are the same as the assumptions in the 20MGY plant.
21!!
Table 5 The 20M G Y Plant Model Results*
$/Year
$/Gallon
% of Total
Revenue
% of Total Cost
Sale Revenue ! ! Ethanol 33,742,325 1.77 75.69% ! Yeast 6,324,883 0.33 14.19% ! Fertilizer 951,529 0.05 2.13% ! Feed 1,740,056 0.09 3.90% ! Producer Tax Credit 1,818,182 0.10 4.08% !Total Sale Revenue 44,576,975 2.34 100.00% !Production Costs ! ! Feedstock Costs 27,551,310 1.45 ! 79.50% Other Input Costs 4,901,701 0.26 ! 14.14% Administrative and Operating Costs
2,203,285
0.12
!6.36%
Total Production Costs 34,656,296 1.82 ! 100.00% ! Interest, Income Tax, Depreciation and Amortization
2,592,312 0.14 ! !
! !Net Profit 7,328,367 0.38 ! !
Table 6 The 10M G Y Plant Model Results*
$/Year
$/Gallon
% of Total
Revenue
% of Total Cost
Sale Revenue ! ! Ethanol 16,871,162 1.77 75.53% ! Yeast 3,162,442 0.33 14.16% ! Fertilizer 641,904 0.07 2.87% ! Feed 752,469 0.08 3.37% ! Producer Tax Credit 909,091 0.10 4.07% !Total Sale Revenue 22,337,068 2.35 100.00% !Production Costs ! ! Feedstock Costs 13,642,267 1.43 ! 74.62% Other Input Costs 2,708,948 0.28 ! 14.82% Administrative and Operating Costs
1,930,559
0.20
!10.56%
Total Production Costs 18,281,774 1.92 ! 100.00% ! !Interest, Income Tax, Depreciation and Amortization
2,197,171 0.23 ! !
Net Profit 1,858,123 0.20 ! !*Results are based on the 11-year average.
22!!
Table 7 Net Present Value under Various E thanol Price Scenarios
Net Present Value (million $)
E thanol Price ($/gal) 10M G Y 20M G Y 1.52 -12.77 0.00
1.61 -6.84 11.26 1.71 0.00 24.42
1.84 (Base) 8.30 41.54 1.91 12.91 50.75 2.01 19.49 63.92
Table 8 Net Present Value under Various Sugar Beet Price Scenarios
Net Present Value (million $)
Sugar Beet Price ($/ton) 10M G Y 20M G Y 27.00 28.75 82.44 34.00 19.21 63.35
42.00 (Base) 8.30 41.54 48.09 0.00 24.94 57.23 -12.46 0.00
60.00 -16.45 -7.54
Table 9 Net Present Value under Various Beet Molasses Price Scenarios
Net Present Value (million $)
Beet Molasses Price ($/ton) 10M G Y 20M G Y 90.00 18.39 62.39
120.00 (Base) 8.30 41.54 144.67 0.00 24.38 160.00 -5.16 13.72 179.74 -11.80 0.00
200.00 -19.29 -14.09
Table 10 Net Present Value under Various T ransportation Cost Scenarios
Net Present Value (million $)
T ransport Cost ($/gal) 10M G Y 20M G Y 0.02 (Base) 8.30 41.54
0.06 5.48 35.90 0.10 2.66 30.26 0.14 -0.16 24.62 0.18 -2.97 18.99
0.20 -4.38 16.17
23!!
F igure 1 Sugar-beet/Molasses E thanol Production Process F low Diagram
$%&'(()(!
*+,)+!-).!/0&1!2.)'3
!
4%5&)+!
206'+!4)).(!
7+589586!
/+)((586:;05<)!=>.+'<.5%8!
?%%@586!'89!2.)+5&5A'.5%8!
B)+3)8.'.5%8!
*5(.5&&'.5%8!
*)C,9+'.5%8!
*)8'.0+586!
B0)&!=.C'8%&!2.%+'6)!
=D'1%+'.5%8!
*+,)+!
!2,+01!
*+5)9
!/%E
9)+!
4)).!/0&1:B))9!!
F(C:B)+.5&5A)+!
*+,)+!
21)8.!G)'(.!
H)<%D)+)9!G)'(.!
!!2.5&&'6)!
24!!
!
(a) Base case: Distribution of Ethanol Price ($/gal) and Net Present Value (in millions)
(b) 25% Increase in Ethanol Price: Distribution of Ethanol Price ($/gal) and Net Present Value (in millions)
!
F igure 2 Distributions of E thanol Price and Net Present Value for the 20M G Y Plant
! !
25!!
(a) Base case: Distribution of Ethanol Price ($/gal) and Net Present Value (in millions)
(b) 25% Increase in Ethanol Price: Distribution of Ethanol Price ($/gal) and Net Present Value (in millions)
!
F igure 3 Distributions of E thanol Price and Net Present Value for the 10M G Y Plant
! !
26!!
!
(a) (b)
!
!
(d) (e)
F igure 4 Net Present Value vs. E thanol and Co-product Prices for the 20M G Y Plant
!"#$
%
&$%%
%
$%%
'%%
(%%
)%%
% ! $ * ' # ( + )
,-./012/33/405
67890431:;<=93>
#%%"%
%
&$%%
%
$%%
'%%
(%%
)%%
*%%
*#%
'%%
'#%
#%%
##%
(%%
(#%
+%%
,-./012/33/405
?@9571:;<740>
+A"'
%
&$%%
%
$%%
'%%
(%%
)%%
'% (% )% !%%
!$%
!'%
!(%
,-./012/33/405
B@C7/3/D@C1:;<740>
+*"$
%
&$%%
%
$%%
'%%
(%%
)%%(% +% )% A% !%%
!!%
!$%
,-./012/33/405
B@@E1:;<740>
27!!
(a) (b)
(d) (e)
F igure 5 Net Present Value vs. Feedstock and Utility Prices for the 20M G Y Plant
#+"$
%
&$%%
%
$%%
'%%
(%%
)%%
*% *# '% '# #% ## (%
,-./012/33/405
FG=9C1H@@71:;<740>
!+A"+
%
&$%%
%
$%%
'%%
(%%
)%%
!%%
!!%
!$%
!*%
!'%
!#%
!(%
!+%
!)%
!A%
$%%
,-./012/33/405
H@@71243955@51:;<740>
%"%(
%
&$%%
%
$%%
'%%
(%%
)%%
%"%*#
%"%'%
%"%'#
%"%#%
%"%##
%"%(%
%"%(#
%"%+%
%"%+#
%"%)%
,-./012/33/405
63@I7C/I/7J1:;<KL8>
+"'
%&$%%
%
$%%
'%%
(%%
)%%
% * ( A !$ !#
,-./012/33/405
,97GC931M951:;<22H7G>