The E ciency of a Pulsed Detonation Combustor{Axial ...
36
The Efficiency of a Pulsed Detonation Combustor–Axial Turbine Integration Carlos Xisto a,* , Olivier Petit a , Tomas Gr¨ onstedt a , Andrew Rolt b , Anders Lundbladh c , Guillermo Paniagua d a Dep. of Mechanics and Maritime Sciences, Chalmers University of Technology, Gothenburg, Sweden b School of Aerospace, Transport and Manufacturing, Cranfield University, Bedfordshire, UK c GKN Aerospace, Trollh¨attan, Sweden d Zucrow Laboratories, Purdue University, West Lafayette, Indiana, USA Abstract The paper presents a detailed numerical investigation of a pulsed detonation combustor (PDC) coupled with a transonic axial turbine stage. The time-resolved numerical analysis includes detailed chemistry to replicate detonation combustion in a stoichiometric hydrogen– air mixture, and it is fully coupled with the turbine stage flow simulation. The PDC–turbine performance and flow behaviour are analyzed for different power input conditions, by varying the system purge fraction. Such analysis allows for the establishment of cycle averaged performance data and also to identify key unsteady gas dynamic interactions occurring in the system. The results obtained allow for a better insight on the source and effect of different loss mechanisms occurring in the coupled PDC–turbine system. One key aspect arises from the interaction between the non-stationary PDC outflow and the constant rotor blade speed. Such interaction results in pronounced variations of rotor incidence angle, penalizing the turbine efficiency and capability of generating a quasi-steady shaft torque. Keywords: Pulsed detonation combustor, Axial turbines, CFD, combustion modeling 1. Introduction 1 Severe environmental regulations on emissions, such as those outlined by the European 2 vision for Aviation Flightpath 2050, has kindled research on radical engine and aircraft 3 * Corresponding author Email address: [email protected] (Carlos Xisto) Preprint submitted to Aerospace Science and Technology August 24, 2018
Transcript of The E ciency of a Pulsed Detonation Combustor{Axial ...

The Efficiency of a Pulsed Detonation Combustor–Axial Turbine
Integration
Carlos Xistoa,∗, Olivier Petita, Tomas Gronstedta, Andrew Roltb, Anders Lundbladhc,Guillermo Paniaguad
aDep. of Mechanics and Maritime Sciences, Chalmers University of Technology, Gothenburg, SwedenbSchool of Aerospace, Transport and Manufacturing, Cranfield University, Bedfordshire, UK
cGKN Aerospace, Trollhattan, SwedendZucrow Laboratories, Purdue University, West Lafayette, Indiana, USA
Abstract
The paper presents a detailed numerical investigation of a pulsed detonation combustor
(PDC) coupled with a transonic axial turbine stage. The time-resolved numerical analysis
includes detailed chemistry to replicate detonation combustion in a stoichiometric hydrogen–
air mixture, and it is fully coupled with the turbine stage flow simulation. The PDC–turbine
performance and flow behaviour are analyzed for different power input conditions, by varying
the system purge fraction. Such analysis allows for the establishment of cycle averaged
performance data and also to identify key unsteady gas dynamic interactions occurring in
the system. The results obtained allow for a better insight on the source and effect of
different loss mechanisms occurring in the coupled PDC–turbine system. One key aspect
arises from the interaction between the non-stationary PDC outflow and the constant rotor
blade speed. Such interaction results in pronounced variations of rotor incidence angle,
penalizing the turbine efficiency and capability of generating a quasi-steady shaft torque.
Keywords: Pulsed detonation combustor, Axial turbines, CFD, combustion modeling
1. Introduction1
Severe environmental regulations on emissions, such as those outlined by the European2
vision for Aviation Flightpath 2050, has kindled research on radical engine and aircraft3
∗Corresponding authorEmail address: [email protected] (Carlos Xisto)
Preprint submitted to Aerospace Science and Technology August 24, 2018

concepts. The European Ultra Low emission Technology Innovations for Mid-century Air-4
craft Turbine Engines (ULTIMATE) [1] addresses the prime gas turbine engine loss sources,5
revealed by exergetic analysis [2], and investigates possible synergies arising from the combi-6
nation of radical technologies. One of the investigated gas turbine engine concepts comprises7
an intercooled geared turbofan including a pulse detonation combustion (PDC) system [3].8
Pulsed detonation combustors burn fuel using an intermittent, periodically initiated,9
detonation wave combining heat addition with a pressure increase. This should theoretically10
result in a lower entropy increase than the conventional Joule-Brayton cycle. Pressure rise11
combustion systems are believed to provide a theoretical improvement of 8 to 15% [3, 4, 5]12
in the thermal efficiency of the power plant.13
Among many other very important engineering challenges, the theoretical potential of14
integrating pulsed detonation combustion in a gas turbine is dependent on efficient integra-15
tion with a upstream compressor [6] and a downstream expansion system [7, 8, 9, 10, 11, 12].16
The unsteady nature of pulsed detonation results in strong variations in mass flow, thermo-17
dynamic quantities, turbine rotor inlet angles [13], and can even lead to periods of reversed18
flow [14]. The turbine is therefore subjected to rapid periodic changes in operating con-19
ditions and cannot be represented by a single point in a performance map [15]. This flow20
behavior has a direct negative impact on the high pressure turbine efficiency, and can negate21
the theoretical thermal efficiency improvements of detonation combustion. Moreover, irre-22
spective of the turbomachinery concept being investigated it is important to understand23
how the non-stationary PDC shock-waves [16, 17], influence turbomachinery flows, in par-24
ticular during the early stages of detonation blowdown. The analysis of these flows are often25
complicated by adjacent tube interaction [18, 19] and tube firing sequence. A comprehen-26
sive investigation of the aforementioned unsteady processes of PDC–turbine flow is therefore27
crucial prior to the optimization of the PDC–axial turbine system.28
Several authors characterized experimentally the effect of pulsed detonation combustors29
on axial and radial turbines. The experimental studies performed by Rasheed et al. [18] and30
Glaser et al. [20] revealed that, when the PDC flow is mixed with a steady bypass flow, the31
axial turbine efficiency is not strongly penalized by the fluctuations arising from the deto-32
2

nation chamber. Without any bypass flow, St. George [21] indicates that, for low pressure33
ratios, an inefficient turbine driven by PDC flow can outperform conventional engines. How-34
ever, for the PDC–turbine system, the turbine efficiency was severely abated when compared35
with the efficiency measured under high gradient, high amplitude, non-combustion pulsating36
flows [13]. The aforementioned studies allowed the overall characteristics to be identified37
but, due to the lack of miniaturized precise measurements in such a harsh environment, they38
did not detail the aerothermal flow phenomena occurring across the PDC–turbine system.39
Different numerical studies in PDC–axial turbine systems were also undertaken by several40
authors and used to support some of the aforementioned experimental investigations. Dean41
et al. [16] confirmed the occurrence of strong reflection waves at the turbine inlet, the42
decay of the detonation shock wave across the vanes, and revealed a complex non-stationary43
shock-wave pattern in the stator outlet. Van Zante et al. [22] studied the three-dimensional44
flow field in a turbine stage exposed to the outlet conditions from a PDC, set as inlet45
boundary condition. The results obtained by Van Zante et al. confirmed the decay in46
pressure fluctuations along the axial direction of the turbine, and revealed reverse flow47
during the early stages of blowdown. The two-dimensional numerical analysis of an axial48
turbine performed by Suresh et al. [23], using as inlet boundary condition the PDC outlet,49
indicated that efficiencies of around 70-80% are within reach.50
In this paper, a PDC coupled with an axial turbine is modelled using CFD, including de-51
tailed chemistry to replicate the detonation process in a stoichiometric hydrogen–air mixture.52
The selected turbine geometry is the Graz transonic turbine stage at mid-span [24, 25, 26].53
The time-resolved investigation is two-dimensional, using a second-order time discretization54
scheme. First the paper characterizes the conditions across a single PDC tube, to select a55
robust and cost-effective numerical method for computing detonation flow. Afterwards the56
unsteady flow processes in the coupled PDC–axial turbine system are presented and the57
prime loss mechanisms identified and discussed.58
3

WallTUBE: Air + H2,
Trigger gas (H2O + N
2)
Air, p = 1 atm, T = 300 K
p1= 1 atm, T
1= 300 K R Axis
L p
tr= 60 atm, T
tr= 3000 K
Figure 1: Partial view of the numerical domain used for the PDC-tube simulations, and initial conditions
prior to detonation, R = 0.02 m, L = 0.5 m.
2. Numerical Model59
In the present paper two different test cases are addressed. The first test case, here60
designated as PDC-tube, comprises a single detonation tube filled with a stoichiometric61
fuel–air mixture, discharging to a tank of large dimensions, as illustrated in Fig. 1. This test62
case is used to select and validate an adequate finite-rate reaction mechanism able to predict63
detonation in H2–air mixtures. Two different chemical mechanisms are analyzed: a global,64
single-step, reduced mechanism [27]; and a detailed mechanism comprising 19 elementary65
reversible reactions and 9 species [28]. The PDC-tube is only required to run during the66
detonation phase of a single operating cycle, the following assumptions are made:67
• The fuel is assumed to be homogeneously mixed with air;68
• Direct initiation is employed, meaning that a self-sustained detonation wave is formed69
at the closed end of the tube using a high pressure and high temperature trigger gas;70
• The fuel—air mixture in the tube and the air in the tank are assumed to behave as71
calorically semi-perfect gases.72
The second test case comprises a coupled PDC–turbine system and investigates the73
effect of a complete PDC cycle in an axial turbine performance. The developed model,74
here illustrated in Fig. 2, includes a pair of detonation tubes aligned with the rotor mid-75
span section of the Graz transonic turbine stage [24, 25, 26]. The assumptions made in the76
PDC-tube test case also apply to the PDC–turbine model, further assumptions include:77
• The valve opens and closes instantaneously;78
4

Detonation tube
Periodic
Periodic
Rotor Interface
L
Rotor
Valve
Stator
a
h
�
in
Fill limit
y
x
U
exit
Figure 2: Model used for simulating the PDC–turbine environment, L = 0.5 m; a = 0.03 m; h = 0.038 m;
θ = 5 deg. The instantaneous mass-weighted averaged properties are obtained at in, exit and rotor interface
planes. The fill limit marks the extent of the tube to be filled with the fuel-air mixture. The image also
shows the detailed views of some sections of the 2D numerical grid.
• The detonation tube is purged with pressurized air, and refilled with fresh reactants79
when the tube internal pressure is below the inlet total pressure;80
• The fuel mixture and purge air are injected at subsonic speeds;81
• Heat transfer is neglected (adiabatic walls), but viscous effects are taken into account.82
The k–ω SST was found suitable for predicting separated flow in this particular turbine83
design [29].84
The above assumptions must comply with the limits and properties of detonation, which85
are dependent on the initial conditions, flow properties and tube geometry. A detailed86
explanation on how these properties are affected by the initial conditions can be found in87
[30].88
5

2.1. Detonation Initiation89
The onset of detonation is affected by the initial properties of the flow, size of the90
detonation tube and initiation energy. An approximate limiting value for the tube diameter91
is given by a direct relation to the detonation cell size. Previous works in the field revealed92
that the minimum diameter for reaching detonation, in stoichiometric hydrogen–air mixtures93
at 1 bar and 298 K, is of the order of 6 mm [31, 32].94
In both test cases, detonation is directly initiated at the closed end of the tube(s) using95
a high-pressure (ptr = 60p1), high-temperature (Ttr = 3000 K) trigger gas, consisting of96
nitrogen and water vapor, see Fig. 1. The trigger region length is very small (Ltr = 0.005L m)97
compared with the total tube length and, therefore, the contribution of the trigger gas to98
the pressure rise in the PDC cycle is negligible [33].99
The modeling of the detonation initiation as direct, enables the creation of a self-sustained100
detonation wave at the valve plane. This modeling has been subject to some controversy101
since direct initiation may require the deposition of substantial amounts of energy in each102
tube and detonation cycle (it can be on the order of 4.3 kJ for stoichiometric hydrogen—air103
mixtures at 1 bar and 298 K [34, 32]. Another way of achieving detonation is to use a small104
amount of energy to start deflagration and use a longer tube to allow a transition to detona-105
tion. However, the DDT (Deflagration to Detonation Transition) length can be prohibitively106
high, and may require the implementation of DDT triggering obstacles that would result in107
additional pressure losses. Still, the necessary length of the tube to achieve DDT increases108
the combustor size, and the time required to achieve detonation limits the cycle frequency.109
Moreover, in a real gas turbine application increased temperatures are to be produced by the110
compression system. Therefore, shorter tubes would also alleviate the problems associated111
with auto-ignition delay time. Analyzing the onset of detonation and prediction of DDT is112
out of the scope of the present paper, however one should take the aforementioned limita-113
tions into consideration when defining the problem boundary conditions and operation, to114
avoid unrealistic interpretation of the results.115
6

2.2. Computational methodology116
The numerical models that will be used to simulate the single PDC-tube and PDC–axial117
turbine test cases are created in Ansys Fluent 17 [35]. The numerical method is based118
on the finite volume implementation of the two-dimensional Unsteady Reynolds-Averaged119
Navier-Stokes (URANS) equations. The system of equations also includes a convection-120
diffusion equation for each specie involved. The finite-rate reactions are calculated with121
Arrhenius kinetic expressions and, due to the supersonic nature of the flame, a laminar122
finite-rate model is selected. For time discretization a dual-time formulation is employed,123
which includes the second-order backward implicit Euler method for advancing in physical124
time, and a pseudo-time marching 3-stages Runge-Kutta method for the inner iterations.125
The Courant–Friedrichs–Lewy (CFL) condition is used to select the pseudo-time step within126
the inner iterations, while a constant value is assumed for the physical time-step. The Roe127
flux-difference splitting scheme is selected to evaluate the convective fluxes and for variable128
interpolation the second order upwind scheme with a Total Variation Diminishing (TVD)129
Minmod based slope limiter is used. The fluid properties are obtained for the mixture using130
the mixing-law.131
2.3. Averaging Procedure132
Due to the cyclic operation of the pulsed detonation combustor, the calculation of bulk133
properties requires some sort of averaging. However, the selection of the averaging method134
is not arbitrary, but dependent on the purpose for which the averages are developed [36].135
The bulk isentropic efficiency is defined using mass-averaged (ma) and work-averaged (wa)136
properties:137
ηwa =Tma0,in − Tma
0,exit
Tma0,in
(1−
(pwa0,exit
pwa0,in
) γ−1γ
) (1)
The properties at the turbine inlet (plane in) and outlet (plane exit) are mass-averaged over138
a PDC cycle using the following equation:139
Φmain/exit =
∫ τ0
Φ∫Ain/exit
ρu dAdt∫ τ0
∫Ain/exit
ρu dAdt(2)
7

In equation (2), Φ represents the instantaneous mass-weighted average property at the inlet140
(in) or exit turbine planes,141
Φ =
∫Ain/exit
φρu dA∫Ain/exit
ρu dA(3)
where φ should be replaced by the appropriate property (e.g. temperature, T0, total enthalpy,142
h0, and ratio of specific heats, γ). This is the most adequate way of averaging temperature143
and enthalpy since it ensures the conservation of energy flux into the system [36, 13]. The144
instantaneous mass-weighted average properties are not to be confused with cycle mass-145
average properties (denoted by ma), as the later represents the average over an entire pulsed146
detonation cycle.147
The pressure field is work-averaged and based on the definition of a uniform pressure148
field that preserves the work input [36, 23, 13],149 (pwa0,in
) γ−1γ =
∫ τ0
∫Ain
ρuT0 dAdt∫ τ0
∫Ain
ρu
(T0
(p0)γ−1γ
)dAdt
(4)
and output [23],150 (pwa0,exit
) γ−1γ =
1
τ |Aexit|
∫ τ
0
∫Aexit
(p0)γ−1γ dAdt (5)
The cycle mass-averaged specific work is given by:151
wma = hma0,in − hma
0,exit (6)
The cycle mass-averaged stage loading, ψ, is calculated as the ratio of the cycle mass-152
averaged specific work with the square of blade speed:153
ψma =wma
U2(7)
The cycle mass-averaged rotor incidence angle, β2,ma, and cycle mass-averaged stator outlet154
angle, α2,ma, are calculated at the stator–rotor interface,155
Φmainterface =
∫ τ0
Φ∫Ainterface
ρu dAdt∫ τ0
∫Ainterface
ρu dAdt(8)
The mass balance is calculated over a period to check for mass conservation.156
∆m =
∫ τ
0
∫Ain
ρu dAdt−∫ τ
0
∫Aexit
ρu dAdt (9)
8

3. Performance of a single PDC-tube157
In this section an accurate and robust model is selected and validated against analytically158
predicted detonation properties. A partial view of the tube geometry (R = 0.02 m, L =159
0.5 m) is illustrated in Figure 1. The figure also shows the imposed boundary conditions as160
well as the initial conditions prior to detonation. The tube is closed at its left end, whereas161
the right end is open allowing for the fluid to discharge to a tank of large dimensions. The162
tank is represented by a domain with length equal to 5L and radius equal to 50R. The tube163
is filled with a stoichiometric mixture of hydrogen and air at p = 1 atm and T = 300 K,164
while the outer domain is filled only with air at similar conditions.
p2
p1
0.585 0.59 0.595 0.6 0.60515
20
25
30
/
t = 0.00015 s
x/L
(a)
p2
p1
0 0.2 0.4 0.6 0.8 10
5
10
15
20
25
30
x/L
/
0.59 0.59516
18
20
22
24
(b)
Figure 3: Instantaneous pressure ratio distribution in the detonation tube at t = 0.00015 s. a) Comparison
between the detailed and global mechanism. b) Results obtained with the detailed mechanism.
165
Regarding boundary conditions, a pressure outlet condition is specified in the outer166
boundaries, and a slip wall condition is considered for the tube walls. The pressure outlet167
condition imposes a constant static pressure of 1 atm when the flow is subsonic, and it168
extrapolates the pressure from the domain interior when the flow is supersonic.169
A grid sensitivity study was performed to evaluate the impact of axial grid resolution on170
results. Four grids with increased axial resolution in the tube were generated: grid-A, ∆x =171
9

0.25 mm; grid-B, ∆x = 0.125 mm; grid-C, ∆x = 0.0625 mm; grid-D, ∆x = 0.03125 mm.172
Regarding time-step, a maximum allowed physical time-step for each grid is found to be173
in the range of 10−8 s to 10−7 s. This range provides reasonably accurate results without174
the occurrence of numerical instabilities. Moreover, it gives a good compromise between175
accuracy and computational time and it is in the acceptable range for the computation of176
the PDC–turbine test case.177
The instantaneous pressure ratio distributions in the tube at t = 0.00015 s, obtained178
with the global and detailed mechanisms, are compared in Fig. 3-a). The results show179
that the global mechanism predicts, in all grids, a higher detonation wave propagation180
velocity, and a higher von-Neumann peak pressure. Figure 3-b) shows the pressure ratio181
distribution computed with the detailed mechanism in different grids along the entire tube182
length. The results indicate that refining the grid provides a sharper resolution of the shock183
wave, but does not provide any further improvement in computing the post-shock conditions.184
Moreover, Fig. 3-a) shows that the usage of grid-D and the global mechanism might result in185
overshooting the analytically computed von-Neumann peak pressure of 27 atm. In Table 1186
the results obtained with grid-B for the detonation wave velocity are compared with results187
obtained with the NASA Chemical Equilibrium with Applications code (CEA) [37]. The188
deviation of the computed wave speed, relative to the analytically obtained solution is also189
listed in Table 1. The comparison shows that the detailed mechanism is more accurate when190
predicting the detonation wave velocity. The results obtained in grid-B, using a time-step191
of 5 × 10⁻⁸, show a good compromise between accuracy, computation time and stability.192
Therefore, grid-B is selected together with the detailed finite-rate mechanism for the PDC–193
turbine computation.194
4. Performance of the PDC–Turbine Stage195
In this section the results obtained from a two-dimensional turbine stage computation,196
coupled with a pulse detonation combustor, are presented and discussed. In low hub/tip ra-197
dius ratio stages, three-dimensional effects may account for a significant portion of the stage198
losses. At the same time, in high hub/tip radius ratio turbines (e.g. high-pressure turbines)199
10

Table 1: Comparison of the computed global and detailed mechanisms in grid-B with the CEA [37] and
analytical [38] results.
DCJ (m/s) εDCJ
Global mech. 2015 2.5%
Detailed mech. 1945 1%
CEA 1965 -
radial velocities are normally modest, and if tip-leakage and endwall flows are neglected, the200
flow may be approximated as two-dimensional. However, if the turbine stage or operating201
conditions are prone to cause flow separation, neglecting three-dimensional effects will result202
in an underestimation of losses, and consequently an overestimation of stage performance.203
Computing turbulent flow including the chemical reactions necessary to simulate detonating204
combustion requires extremely refined grids in the direction of detonation wave propagation.205
At the same time, the chemical time-scales require extremely small advances in computa-206
tional time. These restrictions lead to prohibitive computation time if three-dimensional207
flow is considered. Still, it is anticipated that the pulse detonation flow will cause strong208
variations in momentum in the two-dimensional plane. The impact of such variations in the209
turbine flow-field and on efficiency should be estimated first before considering the effects of210
three-dimensional secondary flows. Moreover, the estimation of two-dimensional flow pro-211
vides a first insight into some of the major loss mechanisms occurring in PDC–turbines, i.e.212
flow separation and shock induced losses.213
The next section gives details about the geometry and boundary conditions. Afterwards,214
the results obtained for the grid independence study are presented and the strategy to ensure215
convergence is discussed. The result section is divided into two subsections. First, the PDC–216
turbine cycle averaged properties are analyzed to establish performance data for the turbine217
operating under different purge fractions. Afterwards, the PDC–turbine instantaneous flow218
behaviour is investigated in detailed, by analyzing the time-histories of different properties219
and also its variation of purge fraction and blade speed.220
11

Table 2: Geometrical data and operating conditions for the Graz transonic turbine stage and 2D model at
rotor mid-span.
Annular 2D linear
Stator pitch 15◦ 60.94 mm
Stator axial chord 56.3 mm 56.3 mm
Stator chord 81 mm 81 mm
Geom. turning angle stator 70◦ 70◦
Rotor pitch 10◦ 40.63 mm
Rotor axial chord 46.8 mm 46.8 mm
Rotor chord 55.9 mm 55.9 mm
Geom. turning angle rotor 107◦ 107◦
Stator rotor spacing 27.5 mm 27.5 mm
Detonation tube height, h - 38 mm
Tube stator spacing, a - 30 mm
Pressure ratio, π 3.5 -
Rotational speed (rpm) 10,500 -
Inlet total temperature 402 K -
4.1. Geometry and boundary conditions221
Figure 2 shows the two-dimensional PDC–turbine model used in the present computa-222
tions. The geometry is inspired by the work of [39, 40], and no special care is taken on223
selecting any of the geometrical parameters. It comprises two detonation tubes coupled224
with a transonic turbine stage that was experimentally tested at Graz University in dry-air225
and steady inlet conditions. The Graz turbine geometry was selected primarily because it226
is a public available geometry. Such feature brings in the benefit of repeatability and allows227
for other researchers within the field to further elaborate on the presented work. The tur-228
bine stage vane and blade 2D sections are extracted at rotor mid-span. Details about the229
full annular configuration can be found in [24, 25] and additional details about the turbine230
stage and 2D linear model are listed in Table 2. The simulation of the PDC–turbine system231
12

includes the typical sequential processes of a pulse detonation cycle, as illustrated in Fig. 4.232
During the fill process, a uniform mixture of fuel and air is injected at the valve plane233
(Fig. 4-a). During this process the valve is completely open. Afterwards, the valve is closed234
and a shock induced mechanism is used to initiate detonation at the left end of the tube235
(Fig. 4-b). During propagation, the detonation wave travels towards the right end of the236
tube, increasing pressure and temperature as the fuel–air mixture is consumed (Fig. 4-c).237
The blowdown process is initiated when the detonation wave leaves the tube, creating an238
expansion wave that propagates towards the closed end of the tube starting the exhaust239
process (Fig. 4-d), until the initial (purge) static pressure is reached (Fig. 4-e). The final240
process is the injection of purge air, which is used to completely or partially purge the tube241
of the hot products of detonation (Fig. 4-f). The purge flow acts as a buffer, preventing242
pre-detonation of the subsequently injected fuel–air mixture and can also be used to control243
the cycle mass-averaged outlet temperature.244
The boundary conditions for the different cycle phases are given in Table 3. A variable245
boundary condition is employed at the valve to simulate the aforementioned PDC processes.246
It specifies total pressure, total temperature and mass fraction of species during fill and247
purge, shifting instantaneously into a wall condition during detonation propagation and248
blowdown. At the outlet, a constant static pressure is specified when the flow is subsonic,249
and pressure is extrapolated from the numerical domain when the flow is supersonic. In the250
detonation tube and turbine walls a non-slip boundary condition is imposed. Again, a trigger251
gas is used to start detonation in the closed end of the tube (ptr = 60pin, Ttr = 3000 K).252
Regarding the time-step, it also varies for the different PDC processes. During fill and purge253
a time-step ranging from 2.80×10⁻⁶ s to 4.76×10⁻⁶ s, is used for the higher and lower rotor254
speeds, respectively. During detonation propagation and blowdown a time-step of 5×10⁻⁸ s255
is employed to resolve the chemistry time-scales.256
4.2. Numerical grid and convergence check257
The stage blade-count ratio is 2:3 simplifying the creation of the numerical grid, which258
is composed of three independent domains. Two domains are stationary, comprising the259
13

�1�1�
1
�0,in
p0,inReactants
a)
Products
e)
Products�1�1�
1
Purge Starts
f)
�0,in
p0,in
Detonation Initiation (trigger region)
�1�1�
1
b)
Wall
Detonation Front propagation
CJD
c)
Wall
d)
Wall
Figure 4: Different phases occurring in a PDC cycle [3]: a) filling ends; b-e) detonation initiation, propagation
and blowdown; f) purge starts.
14

Table 3: Boundary conditions specified during the pulsed detonation combustion cycle. The mass fractions
for the trigger phase are specified in the trigger region Ltr = 0.005L.
H2a O2
a H2Oa N2 p0,in
b T0,inc pout
b
Fill 0.0283 0.204 0 0.767 3.4 403 0.935
Purge 0 0.233 0 0.767 3.4 403 0.935
Det. Wall Wall Wall Wall Wall Wall 0.935
Trig. 0d 0d 0.232d 0.767d Wall Wall 0.935
a Values are in mass fraction
b Values are in bar
c Values are in K
d In the trigger region
detonation tubes and two stator passages. The third domain includes three rotor blades and260
it is moving at a constant translational velocity, U , in the positive y−axis direction. For261
the turbine stage walls, the first cell is located at a distance that ensures a y+ < 1 for the262
entire range of operation of the PDC cycle. In the detonation tube, one needs to ensure263
that enough cells are positioned in the direction of detonation wave propagation. The axial264
distance of the cells is thus set to ∆x = 0.125 mm.265
A grid sensitivity study was performed in order to reach a final solution independent266
of mesh size. Three different grids of increasing resolution are investigated: 142,000 cells;267
492,565 cells; and 1,970,260 cells. Figure 5 shows the relative error for the mass-averaged268
total pressure and mass-flow rate, sampled at the stator-rotor interface. The results show269
that the error magnitude decreases with grid refinement, and that the relative difference270
in mass flow rate and total pressure, between the refined and medium size grid is lower271
than 0.05%. The medium size grid is therefore selected for the remaining PDC–turbine272
computations.273
Time convergence is confirmed by analyzing the time-variation of different properties274
at the turbine inlet and outlet planes, and ensuring that a periodic solution is obtained.275
Figure 6 shows the static pressure time history sampled at plane in. One can verify that276
15

0 0.5 1 1.5 20
0.05
0.1
0.15
0.2
erro
r [%
]
Total pressure
Mass flow rate
Figure 5: Relative error computed for the mass-flow rate and total pressure at stator-rotor interface.
a time periodic solution is obtained after four PDC cycles. Therefore, all cases are allowed277
to run for at least 4 cycles before any data is extracted. The mass balance over a period is278
calculated using equation (9) and also used for convergence check.279
4.3. Results280
The supersonic nature of detonation combustion generates high amplitude pressure fluc-281
tuations during the active detonation phase of the PDC cycle. Figure 7 shows the time-282
history of the mass-weighted averaged static pressure during one pulse detonation cycle,283
0 1 2 3 4 5 6 7
0
0.5
1
0 1 2 3 4 5 6 7
0
0.5
1
Figure 6: Static pressure history sampled at the turbine inlet during the first seven periods of simulation.
16

sampled at the turbine inlet plane (in). The figure also shows the behavior of isobars at284
different time instances. At time instance A one can observe the propagation of the det-285
onation wave, increasing pressure and temperature, as the fuel–air mixture is combusted.286
The detonation wave is followed by an expansion wave as the flow is decelerated from the287
Chapman-Jouguet (CJ) state to stagnation at the valve plane. A complex shockwave pat-288
tern travels through the stator vanes at time instance B. At the same time instance, it is289
possible to observe the creation of an upstream non-stationary bow-shock. The interaction290
between the shockwaves and the boundary layer may lead to the creation of localized sepa-291
ration bubbles in the stator vanes, or even complete separation of the boundary layer. These292
phenomena will be responsible for increasing the boundary layer losses, see Fig.8. The same293
phenomena occur in the rotor blades as the non-stationary shockwaves travel in the rotor294
domain at time-instance C, where one can also observe a pressure wave reflected towards295
the tubes. At time-instance D, the first reflected wave arrives at the turbine inlet and is296
ingested by the stage, carrying with it a portion of the combustion products. The final297
stage of detonation is represented by time-instance E, where the products of detonation are298
ingested by the turbine until the pressure in the tubes is lower than the inlet total pres-299
sure. This is the most stable period of the detonation phase, where temperature is gradually300
decreasing without the occurrence of significant pressure waves. The detonation phase is301
preceded/followed by the purge and fill phases, where colder flow is injected at the tube302
valve section in the form of purge air or fuel–air mixture. The turbine is therefore subjected303
to an unbalanced flow-field over the entire PDC period with unique features and associated304
losses. The purpose of the present work is to identify possible trade-offs likely to be neces-305
sary to balance the work output with stage efficiency. Such trade-offs can be identified by306
varying a cycle parameter (purge-fraction) and analyzing the behavior of the flow-field and307
loss mechanisms.308
In the present study the effect of purge fraction,309
f =tp
tf + tp(10)
given by the relation between purge and valve opening time, is analyzed for different rotor310
17

0 0.1 0.2 0.3 0.4 0.5 0.6 0.7 0.8 0.9 10
0.5
1
A
B
C
D
E
A
B
C
D
E
Reflected wave
Expansion wave Detonation Front
Non-stationary bow shock
Wave arrives
Det.FillPurge
Figure 7: Mass-weighted averaged static pressure history sampled at plane in. The figure also shows
instantaneous isobar lines illustrating the complex shockwave structure occurring in the rotor and stator
domains.
18

Figure 8: Shock wave interaction with the nozzle suction side boundary layer causing a localized separation
zone. This flow behaviour is observed between time instances B and C of Fig.7. The isobar lines are shown
in red, the velocity vectors in black, and the separation bubble velocity vectors in blue.
19

0.4 0.5 0.6 0.70.45
0.5
0.55
0.6
0.65
0.7
0.75
256 m/s
384 m/s
435 m/s
Duty cycle increase
(a)
0.4 0.5 0.6 0.70.4
0.5
0.6
0.7
0.8
0.9
1
256 m/s
384 m/s
435 m/s
Duty cycle increase
(b)
0.4 0.5 0.6 0.7-10
0
10
20
30
40
50
256 m/s
384 m/s
435 m/s Duty cycle increase
(c)
0.4 0.5 0.6 0.763
64
65
66
67
256 m/s
384 m/s
435 m/s
Duty cycle increase
(d)
0.4 0.5 0.6 0.70
1
2
3
4
5
6
256 m/s
384 m/s
435 m/s
Duty cycle increase
(e) (f)
Figure 9: a) Work-averaged isentropic efficiency vs purge fraction; b) Normalized cycle mass-averaged work
vs purge fraction; c) Cycle mass-averaged rotor incidence angle vs purge fraction; d) Cycle mass-averaged
stator exit angle vs purge fraction. e) Cycle mass-averaged stage loading vs purge fraction. f) Angle
definition used at stator–rotor interface, Ca is the axial velocity, C2 is the absolute velocity and V2 is the
relative velocity.20

speeds (U = 256 m/s; U = 384 m/s; U = 435 m/s). Purge fraction can also be calculated311
in terms of volume or mass ratios. For the present investigation, only synchronized firing312
was considered, hence all phases of the detonation cycle occur simultaneously in all tubes.313
Therefore, purge fraction in terms of time-ratio gives a good approximation to mass-ratio.314
The purge fraction is modified by varying the purge time, tp while keeping the filling time,315
tf = 1 ms constant. The test cases considered in the present analysis are listed in Table 4.316
Table 4: Different purge fractions considered in the current analysis.
PG1 PG2 PG3 PG4 PG5 PG6
f 1/3 1/2 3/5 2/3 5/7 3/4
tp (ms) 0.5 1 1.5 2 2.5 3
4.3.1. Cycle averaged properties317
Figure 9-a) shows the variation of the cycle work-averaged turbine efficiency, ηwa, with318
purge fraction, f , for different rotor speeds. The plot shows that a decrease in purge frac-319
tion, down to f = 1/2, results in a reduction in turbine efficiency. For constant fill and320
detonation times, a decrease in purge fraction leads to an increase in duty cycle or deto-321
nation frequency. This means that if a turbine design point is closer to purge conditions,322
increasing the detonation frequency will subject the turbine to operating under off-design323
conditions for a larger portion of the PDC cycle. At the same time, increasing the duty cycle324
is a necessary feature for increasing the cycle mass-averaged turbine work output, wma, see325
Fig. 9-b). It is noted that the work output is normalized by the maximum attained value for326
all the different rotor speeds. Regarding the effects of rotor speed, a 50% increase in rotor327
translational velocity leads to 22% and 14% increase in efficiency for the lower and higher328
purge fractions, respectively. This discrepancy is associated with the fact that increasing the329
duty cycle affects the cycle mass-averaged rotor incidence angle β2,ma, at different rates for330
different rotor speeds, see Fig. 9-c). For the lower rotor speeds, excessive incidence angles331
are observed during purge conditions. Such behavior can be identified by analyzing the time332
history of the rotor incidence angle for a single detonation cycle, see Fig. 10 upper plot. The333
21

angle definition used at the stator-rotor interface is given in Fig. 9-f), Ca is the axial velocity,334
C2 is the absolute velocity and V2 is the relative velocity. The results obtained for the cycle335
work-averaged turbine efficiency also show a slight increase in performance in the lower end336
of purge fraction. It is believed that the reason behind such behaviour is the increased337
operating frequency and power input to the turbine (increase in cycle mass-averaged input338
temperature and pressure), this will be elaborated in the next subsection.339
The normalized cycle mass-averaged work generated by the turbine is plotted in Fig. 9-340
b), showing that increasing the rotor speed results in an increase in mass-averaged work341
production. However, the incidence angle (Fig. 9-c) and consequently the rotor turning angle342
also decreases with rotor speed, compromising the turbine capability for generating shaft343
torque. This effect is more pronounced at higher purge fractions, where the work generated344
increases by approximately 20% for a 50% increase in rotational speed. For lower purge345
fractions the work generated increases by 30% for the same increase in rotor speed. The346
cycle mass-averaged stator outlet angle, α2,ma, is almost insensitive to rotor speed and purge347
fraction, see Fig. 9-d). The cycle mass-averaged stage loading coefficient, ψma, is plotted348
against purge fraction and rotational speed in Fig. 9-e). A decrease in rotational speed and349
purge fraction leads to an increase in mass-averaged rotor incidence angle, implying a larger350
turning angle and thus a higher stage loading coefficient.351
4.3.2. Instantaneous properties352
Figure 10 shows the time history of the mass-weighted averaged rotor incidence angle, β2,353
normalized total temperature, T0, and stator exit angle, α2. The plots shows the properties354
computed for a constant rotor speed of 256 m/s and purge fraction of f = 5/7 (PG5).355
The instantaneous mass-weighted averaged properties are calculated at stage inlet (in) and356
stage outlet (exit) planes. The relative instantaneous mass-weighted averaged velocities are357
calculated at the stator–rotor interface and are used to calculate the rotor inlet angle. The358
upper plot of Fig. 10 reveals an excessive rotor incidence angle during several phases of the359
detonation cycle, causing flow separation and further penalizing the stage efficiency. During360
fill it also shows a slight decrease in rotor incidence angle. This marks the arrival of the colder361
22

0 0.1 0.2 0.3 0.4 0.5 0.6 0.7 0.8 0.9 1
40
60
80
0
0.5
1
Plane in
Plane exit
0
50
100
Purge Fill Det.
Figure 10: Time-history of mass-weighted averaged rotor incidence angle, β2, normalized total temperature,
T0, and stator exit angle, α2; computed for a purge fraction of f = 5/7 and rotor velocity of 256 m/s
(PG5-256).
purge air at the rotor inlet, reducing the speed of sound and relative velocities. The turning362
capability of the stator is not affected during purge and fill; therefore α2 remains almost363
constant (bottom plot in Fig. 10). During the detonation phase one can observe strong364
variations in both angles, which are responsible for large penalties in turbine efficiency.365
The effects of rotor speed in the time history of the mass-weighted averaged rotor inci-366
dence angle, β2, normalized total temperature, T0, and stator exit angle, α2, can be observed367
by comparing Fig. 10 with Fig. 11. For a better comparison, the β2 plot includes, in gray,368
the β2 variation obtained for the case of reduced rotor speed (PG5-256, Fig. 10). The higher369
rotational speed in the PG5-435 test case leads to more favorable rotor incidence angles370
23

during purge, but generates negative incidence angles during detonation, reducing the stage371
loading and deteriorating the turbine’s capability to generate shaft torque. As expected,372
the stator outlet angle and total temperature time histories are almost insensitive to a rotor373
speed increase from 256 m/s to 435 m/s. The ratio between inlet and outlet total temper-374
ature slightly increases with rotor speed, due to an increase in efficiency and higher work375
output.376
The time history of normalized total pressure, p0, computed at stage inlet and exit377
planes is shown in Fig. 11 to support the evaluation of the peak pressure damping across378
the turbine. The pressure damping, Γ, across the stage can be calculated with the following379
expression:380
Γ =MinMaxin −MinMaxexit
MinMaxin(11)
where,381
MinMax =max [p0(t)]−min [p0(t)]
mean [p0(t)](12)
The damping of pressure across the stage is found to be 21% at low rotor speed, which is382
consistent with turbine studies performed in a turbine exposed to the fluctuations from a383
rotating detonation combustor [11], for which a damping of about 28% was identified. At384
higher rotational speeds the damping computed in the present simulation is increased to385
39%. A deeper analysis of the results reveals that most of the damping actually occurs386
through the vane passage.387
The time-histories of Mach number, M, computed at the stage inlet plane and at the388
stator–rotor interface are also shown in Fig. 11. As the detonation front arrives at the inlet389
vane, the vane inlet Mach number peaks above one, causing an instantaneous choking of the390
flow. Therefore, there is an accumulation of mass flow which is then followed by the release391
of the mass during the expansion phase.392
A closer inspection of the time-history of the flow streamlines, for the test case with higher393
blade speed (Fig. 11, PG5-435) is given in Fig. 12, allowing some mechanisms responsible for394
the penalization of efficiency and work output to be identified. It is noted that the labeling395
used in Fig. 12 (A-F) refers to Fig. 11 upper plot time instances. Figure 12 shows that396
24
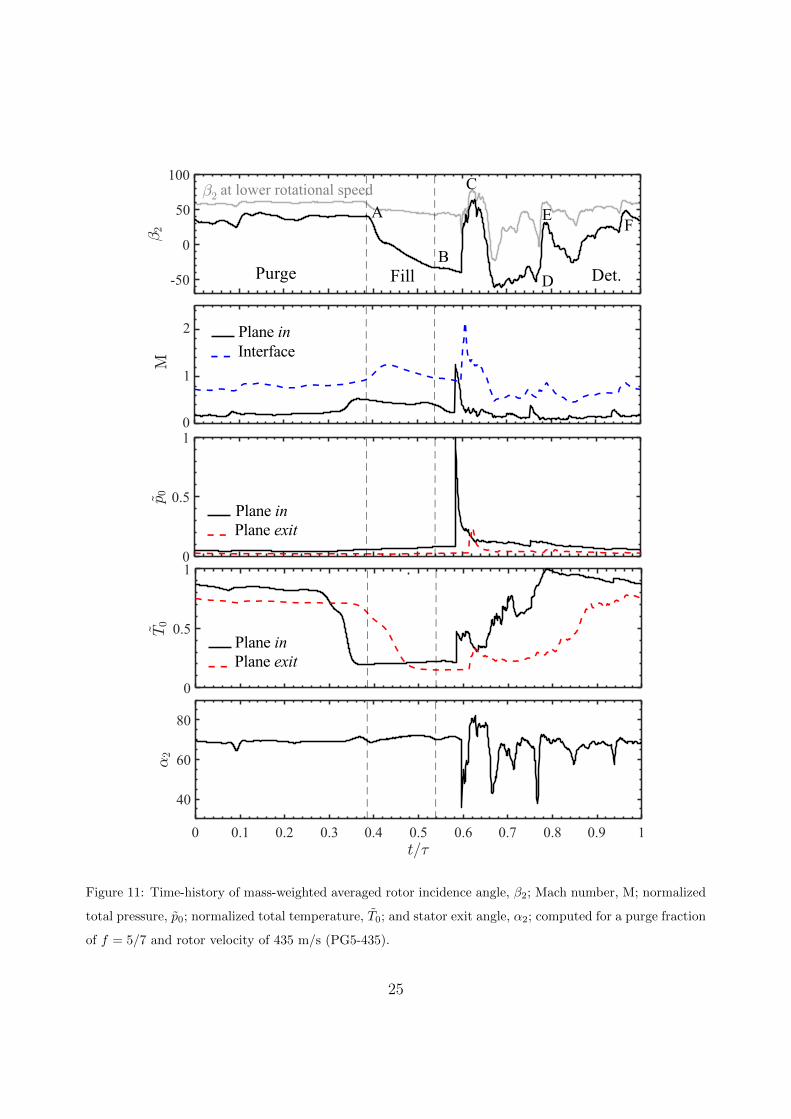
Figure 11: Time-history of mass-weighted averaged rotor incidence angle, β2; Mach number, M; normalized
total pressure, p0; normalized total temperature, T0; and stator exit angle, α2; computed for a purge fraction
of f = 5/7 and rotor velocity of 435 m/s (PG5-435).
25

during purge (instance A) the hot products are entering the turbine at an angle close to397
design conditions, leading to a smooth turning of the flow. Instance B represents an instance398
of the fill period, where a portion of the cold purge flow enters the rotor domain, resulting399
in a decrease in speed of sound and relative velocities that leads to negative incidence angles400
and negative torque. When the first shockwave arrives at the rotor, at time instance C,401
the excess in kinetic energy results in a sudden increase in Mach number and incidence402
angle, causing flow separation and increasing the stage losses. At instance D, the hot403
products of detonation have not yet completely reached the stator-rotor interface, leading404
again to negative incidence angles. Instance E, marks the arrival of a pressure wave, slightly405
increasing the kinetic energy, increasing the turbine pressure ratio, and carrying a portion406
of the hot gases that were trapped in the detonation tube. This will result in an inflexion407
of the rotor incidence angle, likely to cause subsequent flow separation and losses. During408
the last periods of the PDC cycle, here represented by time instance F, the remaining409
hot products of detonation are ingested by the stage without the occurrence of significant410
pressure fluctuations or flow separation.411
The variation of rotor inlet conditions (pressure, temperature, velocity field and mass412
flow) and consequent mismatch with the rotor speed, seems to be responsible for a reasonable413
amount of the losses arising in the PDC–turbine system and requires further investigation.414
Figure 13 shows the time history of rotor incidence angle for different purge fractions and415
for a constant rotor speed of 435 m/s. The results show that the behavior of rotor angle416
fluctuations, around the β2 = 0, varies significantly with purge fraction. The aforementioned417
trend, leads to an increase in cycle mass-averaged β2,ma, with decreasing purge fraction, as418
shown in Fig. 9-c). The plot also reveals that the fluctuations in incidence angle during419
detonation and blowdown are less severe for lower purge fractions (increase in duty cycle and420
power input). Such behaviour, is likely to be responsible for an increase in stage efficiency421
when the purge fraction is reduced from 1/2 to 1/3 (see Fig. 9a). It is noted that the422
fluctuations in incidence angle are affected by the fluctuations in thermodynamic properties.423
This behavior is illustrated in Fig. 14, where the normalized temperature history, sampled at424
planes in and exit, is plotted for different purge fractions and the same rotor speed. The plot425
26

A B
CD
EF
1.4
1.4
1.4
1.20.9
0.5
0.5
0.5
0.5
0.5
0.5
0.2
0.3
0.4
0.8
1.1
1.0
0.9
1.0
1.1
0.3
0.3
0.2
0.2
1.2
1.3
1.3
0.1
0.1
0.15
0.15
0.25
0.25
0.2
0.35
0.45
0.4
0.55
0.6
0.9
0.9
0.85
0.850.75
0.65 0.7
0.75
Figure 12: Mach numbers computed at the stator domain and relative streamlines computed at the rotor
domain for a purge fraction of f = 5/7 and rotor blade speed of 435 m/s (PG5-435).
27

shows that decreasing the purge fraction also decreases the number and average amplitudes426
of the temperature fluctuations and reveals a smoother transition between purge, fill and427
detonation phases.428
The results plotted in Figs. 13–14 show that increasing the detonation duty cycle in-429
creases the cycle mass-average temperature (and pressure) and power input to the turbine.430
That will allow for the turbine nozzle to be choked during a bigger portion of the cycle431
and to reduce flow instabilities. The increased duty cycle will also result in a more uniform432
temperature field at the PDC outlet with the associated benefits in rotor incidence angle.433
Increasing the PDC inlet purge air and fuel–air mixture temperature and pressure should434
also allow for a similar effect, by reducing the amplitude of both temperature and rotor435
incidence angle variations.436
5. Conclusions437
In this paper a numerical study, using URANS simulations, of a coupled PDC–turbine438
system is reported in an attempt to identify the different loss mechanisms occurring in axial439
turbines under the influence of pulsed detonation combustion flow. The URANS solver was440
coupled with a detailed chemistry mechanism for simulating detonation flow in stoichiometric441
hydrogen–air mixtures.442
The results allowed the identification of different loss mechanisms. The occurrence and443
traveling of non-stationary shockwaves across the stage are responsible for the creation of444
localized separation bubbles in the nozzle vanes and rotor blades. The complex shockwave445
pattern is, therefore, expected to increase the boundary layer losses in every PDC cycle446
and should also be the source of unwanted vibrations. The mismatch between the constant447
blade speed and time-dependent rotor inlet conditions resulted in strong periodic variations448
of incidence angle. Such variations were identified as the cause for both flow separation and449
periods of negligible or even negative torque. Such behaviour is believed to be responsible450
for a reasonable amount of losses arising in the present PDC–turbine system. For this451
particular turbine design, it is also observed that the stage operates more efficiently under452
purge conditions. This implies that a change to a more favorable blade angle could improve453
28

Figure 13: Variation of rotor incidence angle time history with purge fraction for a constant rotor blade
speed of 435 m/s.
29

Figure 14: Variation of stage normalized temperature history with purge fraction for a constant rotor blade
speed of 435 m/s.
30

the efficiency when the amount of purge flow is reduced. It should indeed be possible to find454
an optimal rotor blade angle for a particular purge fraction.455
The results also revealed that the stage efficiency increased when operating at higher456
input power settings (lower end of purge fraction). Such behaviour was linked to less severe457
fluctuations in temperature and rotor incidence angle. Increasing the power input to the458
turbine, by increasing the temperature and pressure of purge and fill flow should have a459
similar effect on turbine performance.460
Following the conclusions above, the analysis of geometrical design is, therefore, a natural461
next step in the development of PDC–turbine systems. Previous studies show that the level462
of reaction can have a major impact on the efficiency of axial turbines under pulsating flow463
and that high reaction designs are less sensitive to off-design conditions. Still, this might464
not be the case under detonation flow, and a reaction level study could clarify this aspect.465
The present study only considered the effect of synchronized detonation flow. Sequential466
detonation might allow reducing some of the flow instabilities at the stator–rotor interface.467
However, one must also consider the effect of tube-to-tube interference that might affect the468
mixture detonability of adjacent tubes.469
Acknowledgements470
This work is financially supported by the E.U. under the “ULTIMATE – Ultra Low Emis-471
sion Technology Innovations for Mid-century Aircraft Turbine Engines” Project co-funded472
by the European Commission within the Horizon 2020 Programme (2014-2020) under Grant473
Agreement no. 633436. The computations were performed on resources at Chalmers Cen-474
tre for Computational Science and Engineering (C3SE) provided by the Swedish National475
Infrastructure for Computing (SNIC). The authors would like to acknowledge the US De-476
partment of Energy for the part-time faculty appointment of Prof. Paniagua to the Faculty477
Research Participation Program at the National Energy Technology Laboratory.478
Nomenclature479
480
31

A Area (m2)481
DCJ Detonation wave velocity (m/s)482
f Purge fraction483
h0 Total enthalpy (J)484
p Static pressure (Pa)485
p0 Stagnation pressure (Pa)486
pVN von Neumann peak pressure (Pa)487
t Time (s)488
T0 Total temperature (K)489
tf Fill Time490
tp Purge time (s)491
U Rotor blade speed (m/s)492
u Normal velocity (m/s)493
w Specific work (J/kg)494
Greek symbols495
α2 Stator exit angle (◦)496
β2 Rotor incidence angle (◦)497
∆ Variation498
η Isentropic efficiency499
γ Ratio of specific heats500
32

ρ Fluid density (kg/m3)501
τ Period (s)502
Subscripts503
1 Pre-detonation state504
2 Post-detonation state505
ma Cycle mass-averaged506
wa Cycle work-averaged507
References508
[1] T. Gronstedt, C. Xisto, V. Sethi, A. Rolt, N. G. Rosa, A. Seitz, K. Yakinthos, S. Donnerhack, P. Newton,509
N. Tantot, O. Schmitz, A. Lundbladh, Ultra low emission technology innovations for mid-century510
aircraft turbine engines, in: Proceedings of the ASME Turbo Expo, 2016. doi:10.1115/GT2016-56123.511
[2] T. Gronstedt, M. Irannezhad, X. Lei, O. Thulin, A. Lundbladh, First and second law analysis of future512
aircraft engines, Journal of Engineering for Gas Turbines and Power 136 (3) (2014) 031202–031202–10.513
doi:10.1115/1.4025727.514
[3] C. Xisto, F. Ali, O. Petit, T. Gronstedt, A. Rolt, A. Lundbladh, Analytical model for the performance515
estimation of pre-cooled pulse detonation turbofan engines, in: Proceedings of the ASME Turbo Expo,516
2017. doi:10.1115/GT2017-63776.517
[4] C. Xisto, O. Petit, T. Gronstedt, A. Lundbladh, Assessment of co2 and nox emissions in intercooled518
pulsed detonation turbofan engines, ASME J Eng Gas Turb Power, in pressdoi:10.1115/1.4040741.519
[5] W. H. Heiser, D. T. Pratt, Thermodynamic cycle analysis of pulse detonation engines, Journal of520
Propulsion and Power 18 (1) (2002) 68–76. doi:10.2514/2.5899.521
[6] C. Bruck, C. Tiedemann, D. Peitsch, Experimental investigations on highly loaded compressor air-522
foils with active flow control under non-steady flow conditions in a 3d-annular low-speed cascade, in:523
Proceedings of the ASME Turbo Expo, 2016. doi:10.1115/GT2016-56891.524
[7] G. Paniagua, M. C. Iorio, N. Vinha, J. Sousa, Design and analysis of pioneering high525
supersonic axial turbines, International Journal of Mechanical Sciences 89 (2014) 65–77.526
doi:10.1016/j.ijmecsci.2014.08.014.527
[8] J. Sousa, G. Paniagua, Entropy minimization design approach of supersonic internal passages, Entropy528
17 (8) (2015) 5593–5610. doi:10.3390/e17085593.529
33

[9] J. Sousa, G. Paniagua, J. Saavedra, Aerodynamic response of internal passages to pulsating inlet530
supersonic conditions, Computers & Fluids 149 (2017) 31–40. doi:10.1016/j.compfluid.2017.03.005.531
[10] J. Sousa, G. Paniagua, E. C. Morata, Thermodynamic analysis of a gas turbine engine with a rotating532
detonation combustor, Applied Energy 195 (2017) 247–256. doi:10.1016/j.apenergy.2017.03.045.533
[11] Z. Liu, J. Braun, G. Paniagua, Performance of axial turbines exposed to large fluctuations, in: 53rd534
AIAA/SAE/ASEE Joint Propulsion Conference, 2017. doi:10.2514/6.2017-4817.535
[12] F. Ornano, J. Braun, B. H. Saracoglu, G. Paniagua, Multi-stage nozzle-shape optimization for536
pulsed hydrogen-air detonation combustor, Advances in Mechanical Engineering 9 (2) (2017) 1–9.537
doi:10.1177/1687814017690955.538
[13] A. St George, R. Driscoll, E. Gutmark, D. Munday, Experimental comparison of axial turbine perfor-539
mance under steady and pulsating flows, Journal of Turbomachinery 136 (11). doi:10.1115/1.4028115.540
[14] K. P. Rouser, P. I. King, F. R. Schauer, R. Sondergaard, J. L. Hoke, L. P. Goss, Time-resolved flow541
properties in a turbine driven by pulsed detonations, Journal of Propulsion and Power 30 (6) (2014)542
1528–1536. doi:10.2514/1.B34966.543
[15] A. St. George, E. Gutmark, Trends in pulsating turbine performance: Pulse-detonation driven axial flow544
turbine, in: 50th AIAA Aerospace Sciences Meeting including the New Horizons Forum and Aerospace545
Exposition, 2012. doi:10.2514/6.2012-769.546
[16] A. J. Dean, A. Rasheed, V. Tangirala, P. F. Pinard, Operation and noise transmission of an axial547
turbine driven by a pulse detonation combustors, in: Proceedings of the ASME Turbo Expo, 2005.548
doi:10.1115/GT2005-69141.549
[17] A. Rasheed, A. H. Furman, A. J. Dean, Pressure measurements and attenuation in a hybrid mul-550
titube pulse detonation turbine system, Journal of Propulsion and Power 25 (1) (2009) 148–161.551
doi:10.2514/1.31893.552
[18] A. Rasheed, A. H. Furman, A. J. Dean, Experimental investigations of the performance of a mul-553
titube pulse detonation turbine system, Journal of Propulsion and Power 27 (3) (2011) 586–596.554
doi:10.2514/1.B34013.555
[19] F. H. Ma, J. Y. Choi, V. Yang, Thrust chamber dynamics and propulsive performance of multitube556
pulse detonation engines, Journal of Propulsion and Power 21 (4) (2005) 681–691. doi:10.2514/1.8182.557
[20] A. Glaser, N. Caldwell, E. Gutmark, Performance of an axial flow turbine driven by multiple pulse deto-558
nation combustors, in: 45th AIAA Aerospace Sciences Meeting and Exhibit, 2007. doi:10.2514/6.2007-559
1244.560
[21] S. George, Development and testing of pulsed and rotating detonation combustors, Ph.D. Thesis,561
University of Cincinnati (2016).562
[22] D. VanZante, E. Envia, M. Turner, The attenuation of a detonation wave by an aircraft engine axial563
34

turbine stage, in: 18th ISABE Conference, 2007.564
[23] A. Suresh, D. C. Hofer, V. E. Tangirala, Turbine efficiency for unsteady, periodic flows, Journal of565
Turbomachinery 134 (3) (2012) 034501–034501–6. doi:10.1115/1.4003246.566
[24] E. Gottlich, F. Neumayer, J. Woisetschlager, W. Sanz, F. Heitmeir, Investigation of stator-rotor inter-567
action in a transonic turbine stage using laser doppler velocimetry and pneumatic probes, Journal of568
Turbomachinery 126 (2) (2004) 297–305. doi:10.1115/1.1649745.569
[25] E. Gottlich, J. Woisetschlager, P. Pieringer, B. Hampel, F. Heitmeir, Investigation of vortex shedding570
and wake-wake interaction in a transonic turbine stage using laser-doppler-velocimetry and particle-571
image-velocimetry, Journal of Turbomachinery 128 (1) (2006) 178–187. doi:10.1115/1.2103092.572
[26] J. Pascoa, C. Xisto, E. Gottlich, Performance assessment limits in transonic 3d turbine stage blade573
rows using a mixing-plane approach, Journal of Mechanical Science and Technology 24 (10) (2010)574
2035–2042. doi:10.1007/s12206-010-0713-9.575
[27] M. A. Mawid, T. W. Park, B. Sekar, C. Arana, Application of pulse detonation combustion to576
turbofan engines, Journal of Engineering for Gas Turbines and Power 125 (1) (2003) 270–283.577
doi:10.1115/1.1494098.578
[28] S. Yungster, K. Radhakrishnan, K. Breisacher, Computational study of nox formation in hydrogen-579
fuelled pulse detonation engines, Combustion Theory and Modelling 10 (6) (2006) 981–1002.580
doi:10.1080/13647830600876629.581
[29] R. Pecnik, P. Pieringer, W. Sanz, Numerical investigation of the secondary flow of a transonic582
turbine stage using various turbulence closures, in: Proceedings of the ASME Turbo Expo, 2005.583
doi:10.1115/GT2005-68754.584
[30] G. D. Roy, S. M. Frolov, A. A. Borisov, D. W. Netzer, Pulse detonation propulsion: challenges, current585
status, and future perspective, Progress in Energy and Combustion Science 30 (6) (2004) 545–672.586
doi:10.1016/j.pecs.2004.05.001.587
[31] G. L. Agafonov, S. M. Frolov, Computation of the detonation limits in gaseous hydrogen-containing588
mixtures, Combustion Explosion and Shock Waves 30 (1) (1994) 91–100. doi:10.1007/Bf00787891.589
[32] M. Kaneshige, J. Shepherd, Detonation database, Report Technical Report FM97-8, Caltech, GALCIT590
(1997).591
[33] S. Y. Yungster, K. Radhakrishnan, Pulsating one-dimensional detonations in hydrogen-air mixtures,592
Combustion Theory and Modelling 8 (4) (2004) 745–770. doi:10.1088/1364-7830/8/4/005.593
[34] W. Benedick, C. Guirao, R. Knystautas, J. Lee, Critical Charge for the Direct Initiation of Detonation594
in Gaseous Fuel-Air Mixtures, Progress in Astronautics and Aeronautics, AIAA, 1986, pp. 181–202.595
doi:10.2514/5.9781600865800.0181.0202.596
[35] ANSYS, ANSYS Fluent Theory Guide, ANSYS Inc., 2016.597
35

[36] N. A. Cumpsty, J. H. Horlock, Averaging nonuniform flow for a purpose, Journal of Turbomachinery598
128 (1) (2006) 120–129. doi:10.1115/1.2098807.599
[37] B. McBride, S. Gordon, Computer program for calculating and fitting thermodynamic functions, Report600
NASA RP-1271, NASA (1992).601
[38] L. Landau, E. Lifshitz, One Dimensional Gas Flow, Vol. 6, Pergamon, 1987, pp. 361–413.602
[39] M. Irannezhad, T. Gronstedt, L.-E. Eriksson, Limitation on tube filling in a pulse detonation engine,603
in: 20th ISABE Conference, 2011.604
[40] M. Irannezhad, A numerical study of reacting flows using finite rate chemistry, Ph.D. Thesis, Chalmers605
University of Technology (2012).606
36