THE DYNATA GLOBAL TRENDS REPORT
56
THE DYNATA GLOBAL TRENDS REPORT
Transcript of THE DYNATA GLOBAL TRENDS REPORT
THE DYNATA GLOBAL TRENDS REPORT

2
When people participate in research, many things go into their decisions about what to share and the opinions they express, which are beyond the scope of the traditional survey dataset delivered to clients. Participants make early decisions about the trustworthiness of the company asking for their participation and continue to evaluate that trust with every question. They also consider their personal values, goals, fears, and perceptions of the world around them. To accurately measure people’s intentions, we must consider the environmental, societal, and psychological factors impacting them. There is a principle In Gestalt psychology of the figure-ground relationship. As humans, we tend to focus on the figure – or rather, what we choose to focus on is the figure – while the ground is the background against which the action takes place. On a societal level, this means we focus more on action and actors and tend to ignore the slower moving societal changes that inform possible future behaviors. We work in a world of brands and measurement. As a result, we are often more interested in “How many users does Facebook have?” rather than “What is social media, at heart, and how will it affect other things?” The art of interpreting consumer trends is to focus on the background and use the trends to provide better context to the statistics. We must try to understand what the observed behavior actually represents as a shift in society and consider how this might affect one’s own business. In this report, Dynata benchmarks global behaviors and sentiments that affect the statistics we tend to focus on, with our follow-up annual reports and quarterly spotlight reports building ongoing trendlines. Our report analyzes environmental aspects, such as people’s device and web behaviors, as well as media consumption. We focus on societal considerations, including trust and privacy, as well as psychological factors like economic and financial sentiment. These factors affect whether or not people will share data, and when they do, how they respond to brands and their products.
Melanie CourtrightEVP, Research Science and Data Strategy
FOREWORD
3
Device Usage and Internet of Things (IoT):As technology becomes increasingly integral to people’s daily lives, understanding tech adoption rates, usage trends, and device preferences is necessary to effectively reach consumers and businesspeople, as well as identify which channels to invest in. Perhaps most symbolic of the integral relationship between technology and everyday life is the smartphone and its indispensable role in our lives. Dynata research shows that smartphone ownership is truly ubiquitous among Millennials and Gen X’ers. Across all nine countries studied (US, Canada, UK, France, Germany, the Netherlands Australia, Japan, and China), 98% of Millennials own a smartphone, as do 95% of Gen X’ers. Even among Baby Boomers (82%) and the Silent Generation (71%), adoption is quite high.
One of the most significant developments in consumer-facing technology has been the proliferation of voice assistants (VA) and voice-activated devices. Among those who own smartphones, usage of VA capability is high. Companies have also made a push to get standalone VA devices into homes. However, while in-home usage is still quite low, the VA trend does exist and the technology will continue to shape people’s behaviors and data.
Media Consumption:Given the evolving digital landscape and rise of online streaming, people are consuming media differently than they did just a few years ago. Across all countries studied, overall media consumption is the highest in the US and Canada. In the US, 41% of media is consumed on all forms of television, 40% online, 15% radio, and 4% print.
While other organizations follow global trends, very few zero-in on trends that impact people’s participation in survey research, the opinions they share, and how we should engage them. Leveraging Dynata’s global scale, unique proximity to consumers and businesspeople, and representative sample, our goal is to fill this void with our new Global Trends Report. Below are summary findings that can be explored by country in the full report.

4
It is important to debunk the myth that younger generations are giving up television for online media consumption. Rather than trading one for the other, Millennials and Gen X’ers are actually just consuming more media than preceding generations—their overall media diets are fatter. This is why we need to consider media consumption as a whole, not just broadcast TV vs. online. US Millennials consume 39% of TV media on broadcast television, 29% on-demand, and 32% through streaming services. In comparison, US Baby Boomers consume 68% on broadcast television, 16% on-demand, and 16% via streaming services.
Consumer Sentiment Trends:In survey research, consumers are frequently asked about their propensity to buy. When considering this, participants evaluate a variety of sentiments including their financial status, overall optimism, and views of society.
We analyzed consumer sentiment trends surrounding brands, happiness/optimism, work and ArtificiaI Intelligence (AI), climate change, religion, society, and economics to uncover the “Why?” behind the data we collect. These insights also help predict how generations’ values, opinions, and spending habits will change over time.
We found that ideas about happiness and optimism don’t vary greatly by generation, but there are dramatic differences across geographies. For example, in China, 65% of participants think the world will be a better place in five years’ time, compared to just 25% in the US. However, across all countries, Americans reported the highest level of happiness today.
Turning to economic well-being, 50% of Americans expect their financial life to be better in five years’ time. However, this pales in comparison to China’s optimism, where 74% said they think their financial well-being will be better in five years— well over double the average for all other countries studied.
Trust and Privacy:In a post-GDPR world, global concerns surrounding privacy, data breaches, and how companies use data are top-of-mind. Trust and privacy are paramount when interacting with consumers. This section focuses on three major areas: consumer preferences regarding sharing data, providing information on websites, and how they protect their data.
Across all markets, a large majority are comfortable sharing their basics, such as name, age, nationality, marital status, and gender with a company with which they are familiar. Many are also willing to share more sensitive information if they are familiar with the company requesting it. However, willingness to share information drops significantly when a company is unfamiliar. For example, 70% of Americans would willingly share their name with a company they’re familiar with, but only 37% would share it if they didn’t recognize the company. In the US and Australia, people are also most likely to take some sort of action to protect their privacy. Importantly, the offer of a reward does not significantly raise the comfort level in sharing information, as only 27% said they would feel more comfortable sharing information in exchange for a reward. In other words, when it comes to sharing information, trust and brand familiarity are more important to consumers than being rewarded. By tracking these trends and many more, like deeper economic and political concerns and B2B climate and changes, our goal is to equip researchers and marketers with a deeper understanding of the many nuances that impact consumer behaviors and opinions. This report, the first of many, will help you design better research studies, deliver more insightful global reports, realize more comprehensive data sets, and develop richer understandings to launch more effective campaigns.

5
Dynata conducted online interviews in the US, Canada, UK, France, Germany, the Netherlands and Australia in November 2018 (Tuesday 13th through Monday 19th). These were augmented by interviewing in China and Japan conducted in February 2019 (Wednesday 6th to Tuesday 12th). Participants were selected from across all Dynata’s proprietary research panel assets and the samples quota controlled to reflect the population on age, gender, and region.
A total of 9178 interviews were conducted:
US CanadaUK France Germany The Netherlands Australia China Japan
Given these sample sizes the margin of error (at the 95% confidence level) is, at worst, +/- 3.6% (for China) and, at best, +/- 2.9% (for the UK).
For the data on Media Consumption, this was collected, again online and again using Dynata’s proprietary research panel assets, during February 2019 (Thursday 14th to Tuesday 26th).
A total of 9297 interviews were conducted:
US Canada UKFrance Germany The Netherlands Australia JapanChina
METHODOLOGY
1105110411201007100910091106742976
102910091008101610061249 94510112024
Given these sample sizes the margin of error (at the 95% confidence level) is, at worst, +/- 3.1% (for Australia) and, at best, +/- 2.8% (for the Netherlands).
The age groups are defined as:
Silent Generation: age 74+ (Born in or before 1945) Baby Boomer: age 55 - 73 (Born between 1946 - 1964)Gen X: age 39 - 54 (Born between 1965 - 1980) Millennials: age 23 - 38 (Born between 1981 - 1996)

6
Device and IoT Trends
7
Silent
Gen X
21%
43%
26%
37%
38%
28%
51%
21%Adopt slowly
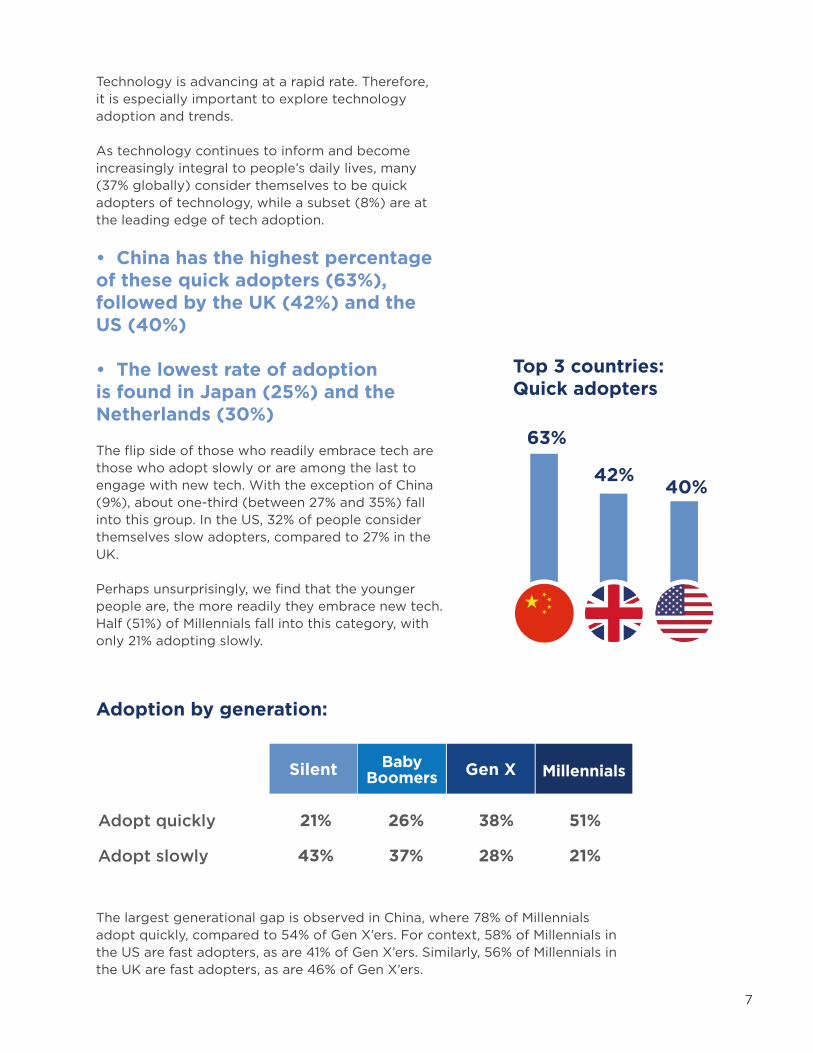
Technology is advancing at a rapid rate. Therefore, it is especially important to explore technology adoption and trends.
As technology continues to inform and become increasingly integral to people’s daily lives, many (37% globally) consider themselves to be quick adopters of technology, while a subset (8%) are at the leading edge of tech adoption.
• China has the highest percentage of these quick adopters (63%), followed by the UK (42%) and the US (40%)
• The lowest rate of adoption is found in Japan (25%) and the Netherlands (30%)
The flip side of those who readily embrace tech are those who adopt slowly or are among the last to engage with new tech. With the exception of China (9%), about one-third (between 27% and 35%) fall into this group. In the US, 32% of people consider themselves slow adopters, compared to 27% in the UK.
Perhaps unsurprisingly, we find that the younger people are, the more readily they embrace new tech. Half (51%) of Millennials fall into this category, with only 21% adopting slowly.
The largest generational gap is observed in China, where 78% of Millennials adopt quickly, compared to 54% of Gen X’ers. For context, 58% of Millennials in the US are fast adopters, as are 41% of Gen X’ers. Similarly, 56% of Millennials in the UK are fast adopters, as are 46% of Gen X’ers.
63%
42%40%
Adoption by generation:
Top 3 countries: Quick adopters
BabyBoomers Millennials
Adopt quickly

8
Smartphone ownership is truly ubiquitous among Millennials (98%) and Gen X (95%) globally. Even among Boomers (82%) and Silent (71%), adoption is quite high.
The truly ubiquitous technology
Symbolic in many ways of the integral relationship between technology and everyday life, the smartphone serves to connect people globally to both themselves and the internet. Because it is the most common tech device and also serves as a conduit for other tech-based interactions (apps for everything: banking, travel, communications, etc.), knowing not only who owns smartphones but how they use them is essential to understanding people and researching consumer behavior.
Smartphone Ownership

9
Millennials
95% 98%82%71%
Gen XBaby Boomers
Silent
Smartphones preferred for survey taking As mobile internet traffic continues to grow (and PC traffic declines), we must turn our attention to smartphones in order to find and target people where they are. In most scenarios, brands and marketers are wise to adopt a mobile-first strategy to engage with consumers. This same sentiment applies to engaging with people for research purposes. In the first quarter of 2019, Dynata observed that 34% of surveys globally were taken on smartphones, 8% on tablets, and 58% on desktop/laptop computers. Looking at younger age cohorts, closely associated with mobile usage, the numbers shift in favor of smartphones with 56% of surveys being taken on smartphones (3% tablet, 41% PC). Even among Baby Boomers between the ages of 55 and 64, mobile survey taking is noteworthy, with 23% being taken on smartphones, 12% on tablets, and 65% on PCs. The message here is clear: whether you are conducting research or marketing to people, understanding how your target audience is using mobile devices should be top of mind.
Smartphone ownership

10
Voice-activated Technology

11
One of the most significant developments in consumer-facing technology has been the proliferation of voice assistants and voice-activated devices. Some sort of voice assistant (VA) is built into or supported by the majority of smartphones today— think Siri, Alexa, OK Google. Having this capability built directly into smartphones has boosted the adoption of voice tech more broadly.
Among those who have VA, usage is high, approaching or exceeding 50% of people who use the VA at least occasionally. It is clear that VA tech has gained traction in the US and China more than other markets, as 29% in the US and 24% in China use it very often.
Have Smartphone Voice Assistant
43% 46%
59%
73%66%
61% 63%55%
51%44%
58%62%
72%
MillennialsGen XBaby Boomers
Silent
Base: All Smartphone Owners
12
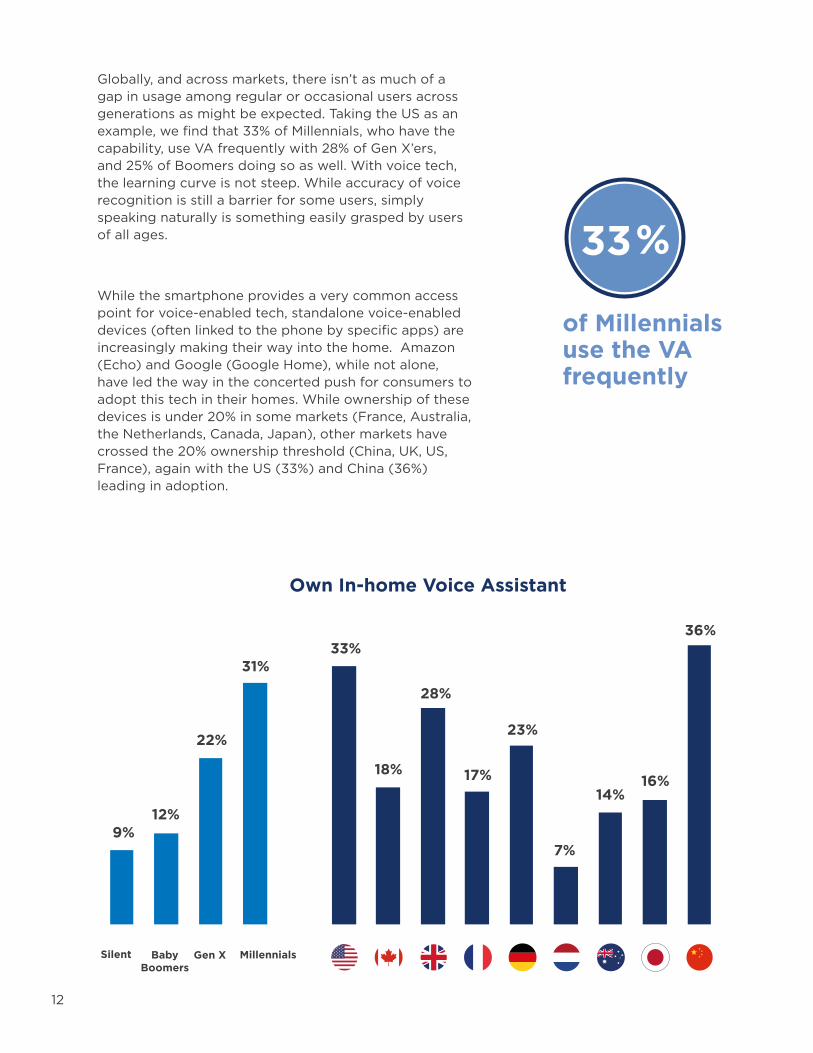
Globally, and across markets, there isn’t as much of a gap in usage among regular or occasional users across generations as might be expected. Taking the US as an example, we find that 33% of Millennials, who have the capability, use VA frequently with 28% of Gen X’ers, and 25% of Boomers doing so as well. With voice tech, the learning curve is not steep. While accuracy of voice recognition is still a barrier for some users, simply speaking naturally is something easily grasped by users of all ages.
While the smartphone provides a very common access point for voice-enabled tech, standalone voice-enabled devices (often linked to the phone by specific apps) are increasingly making their way into the home. Amazon (Echo) and Google (Google Home), while not alone, have led the way in the concerted push for consumers to adopt this tech in their homes. While ownership of these devices is under 20% in some markets (France, Australia, the Netherlands, Canada, Japan), other markets have crossed the 20% ownership threshold (China, UK, US, France), again with the US (33%) and China (36%) leading in adoption.
%
of Millennials use the VA frequently
33
Own In-home Voice Assistant
9%12%
22%
31%33%
18%
28%
17%
23%
7%
14%16%
36%
MillennialsGen XBaby Boomers
Silent

13
While companies have made a push to simply get these devices into homes, how have they fared in terms of getting people to actually use them? Of those who own the likes of Echo and Google Home in their homes, with the exception of France (52%) and the US (50%), less than half of people reported using their in-home VA frequently. Interestingly, in China where ownership is highest, only about one-third (35%) use their devices often. While regular usage may not be that high, for the most part, in home VA aren’t sitting on the shelves collecting dust. With the exception of the Netherlands (27%), 20% or less use them rarely or never. Forty-four percent of both Millennials and Gen X use the devices very often, compared to 36% of Boomers.
Phone VA Usage
Very often Occasionally
Rarely Never
0% 10% 20% 30% 40% 50% 60%

14
Integrated portable devices are the most popular tech-enabled tools
Technology-enabled devices, many of which are “connected devices,” continue to proliferate in the marketplace. While some, like 3D Printers, have commercial/industrial applications as well as consumer use cases, most of the devices we studied are directly consumer-facing. 3D Printers have yet to make their way into people’s homes at scale, but as prices decrease and utility increases, we may see them become more mainstream. With the exception of China (12%), ownership is 8% or lower.
Devices that are truly portable have gained more interest from consumers. Integrating directly with smartphones, both fitness trackers (e.g. FitBit) and smartwatches, which also have integrated fitness tracking capabilities, have become increasingly popular. These are the most widely adopted devices in the personal fitness/health sphere and are owned by between 7 and 17% of people across markets, save China where ownership is much higher at over 50%.
With smartwatches specifically, adoption is much higher among Millennials (31%) and Gen X’ers (22%) than with older generations (<10%), and this trend is consistent across each market.
Ownership of 3D printers in the home is
or lower8%

15
Own a Fitness Band
11% 11%14%
27%
17%
12%14% 14%
16%
10%
14%
7%
54%
MillennialsGen XBaby Boomers
Silent
Devices that are truly portable have gained more interest from consumers.

16
IoT Devices: a tangible way tech is impacting our living space Connected or smart home devices are one of the most tangible ways in which technology is impacting physical living spaces. Through voice assistants, smartphones, tablets, or computers, these devices allow one to control numerous aspects of the home environment such as lighting, appliances, and air quality/purification as well as monitoring the interior and exterior of the home via video. While outside of China ownership of these types of devices is under 20%, as prices decrease and functionality increases, we might expect these numbers to rise. In most markets, remote controllable lighting hovers around 15% with remotely controllable climate control being just slightly lower.
Remotely controllable central heating or AC control
Remote door monitor/camera
Remotely controllable light switches
Remotely controllable appliances
15%
7%
17%
7%
12%
14%
18%
8%
11%
9%
14%
5%
11%
14%
15%
9%
11%
10%
15%
7%
13%
7%
21%
6%
13%
11%
15%
6%
10%
8%
10%
6%
29%
39%
31%
29%
Tech Device Ownership and Usage – Home Tech/IoT
China – Aspirational answering
It is well known that Chinese people will, within certain categories, answer ownership questions in an aspirational sense (i.e. “I want to have this”). As one of the fastest growing markets in the world and one of the leading countries for IT, this is not an idle dream but a very likely future. We believe that the numbers reported here for smartwatches, 3D printers and all four remote controlled household appliances are overstated, but still point to a strong trend for these devices within China.
17
Media Diet and Consumption Trends

18
Surprisingly, across generations, we see a similar picture, proportionally, in terms of time spent consuming media. Gen X’ers and Millennials do consume more media, with additional media hours driven by time spent online, but the proportions of time spent on various platforms are roughly the same. In the US, 79% of Millennials’ total media hours are spent with TV and online platforms, compared to 82% for Baby Boomers.
Given the evolving digital landscape and rise of online streaming, people are consuming media differently.
Emerging platforms coupled with constant technological growth requires new definitions of “TV viewing” and “radio listening.” We are no longer living in a world where comparing traditional “TV” to “online” is viable, which is why this section focuses on media consumption as a whole.
When analyzing media consumption trends, it is important to debunk the myth that younger generations are replacing traditional broadcast television with online media. Rather than trading one for the other, younger cohorts are consuming more media overall.
Dynata research shows that each generation consumes more media than its preceding generation. For example, Millennials consume more media than Gen X’ers and Gen X’ers consume more than Baby Boomers.
More than 90% of all advertising spend is concentrated in Digital, TV, Radio, and Print. Four-fifths of this expenditure is in Digital and TV. As perhaps expected, media consumption, in terms of hours spent, roughly mimics these proportions.
19
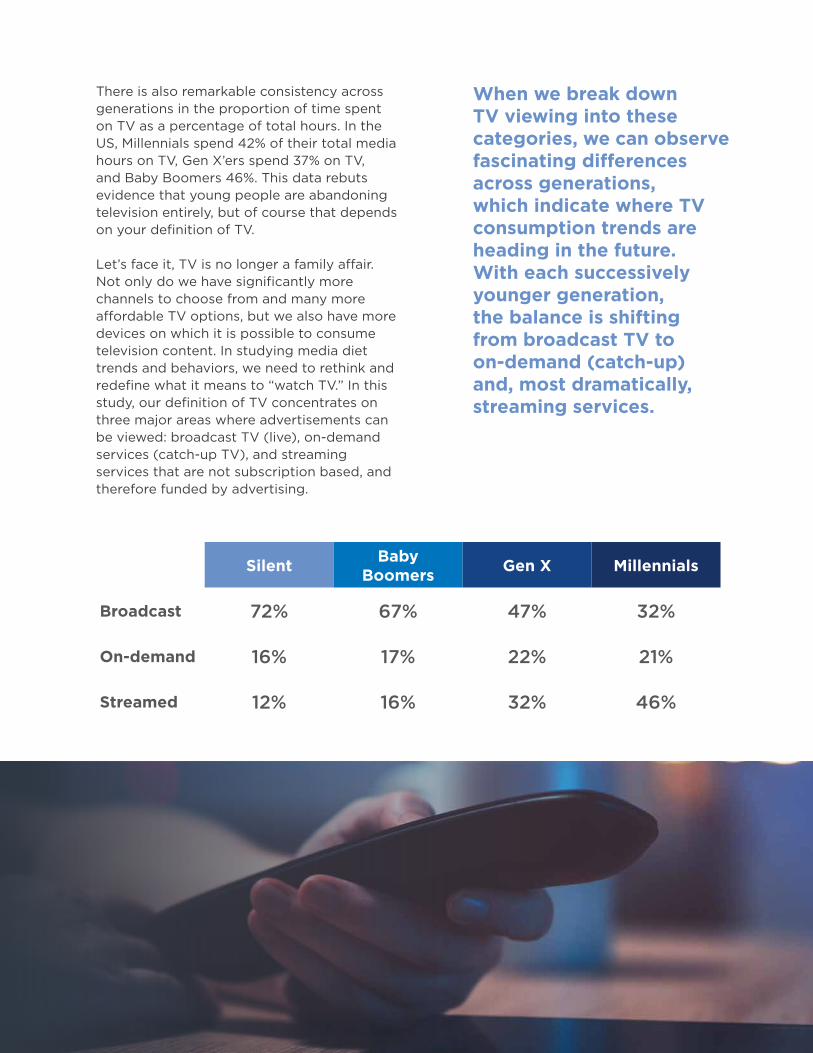
There is also remarkable consistency across generations in the proportion of time spent on TV as a percentage of total hours. In the US, Millennials spend 42% of their total media hours on TV, Gen X’ers spend 37% on TV, and Baby Boomers 46%. This data rebuts evidence that young people are abandoning television entirely, but of course that depends on your definition of TV.
Let’s face it, TV is no longer a family affair. Not only do we have significantly more channels to choose from and many more affordable TV options, but we also have more devices on which it is possible to consume television content. In studying media diet trends and behaviors, we need to rethink and redefine what it means to “watch TV.” In this study, our definition of TV concentrates on three major areas where advertisements can be viewed: broadcast TV (live), on-demand services (catch-up TV), and streaming services that are not subscription based, and therefore funded by advertising.
When we break down TV viewing into these categories, we can observe fascinating differences across generations, which indicate where TV consumption trends are heading in the future. With each successively younger generation, the balance is shifting from broadcast TV to on-demand (catch-up) and, most dramatically, streaming services.
Silent Baby Boomers Gen X Millennials
Broadcast 72% 67% 47% 32%
On-demand 16% 17% 22% 21%
Streamed 12% 16% 32% 46%

20
In many countries, Millennials consume twice as much TV on streaming platforms as Baby Boomers. US Millennials consume 39% of TV on broadcast television, 32% via streaming services, and 29% through on-demand services. On the other hand, Baby Boomers in the US watch 68% of TV on broadcast, 16% on-demand, and 16% via streaming services. There is no reason to suspect that this trend has to do with youth itself, meaning we would not expect Millennials to “settle down” over time and become broadcast TV viewers. However, it is related to a desire for convenience and freedom in terms of device choice and time of viewership. Across all countries studied, the outlier is China, as it shows no generational differences at all. This is because most forms of media consumption, including TV, are relatively recent phenomena in China.
On-demand, or catch-up TV, commands a relatively large share of television consumption among Millennials and Gen X’ers. Out of all nine countries, in China, on-demand commands the highest share of TV hours across each generation. Chinese Millennials dedicate 34% of their TV viewing to on-demand platforms, while Gen X’ers and Baby Boomers each spend 30% of TV hours with on-demand TV. US and UK Millennials say they spend about 30% of their TV hours on-demand. Comparatively Gen X’ers in each country consume about one-fourth of their total TV hours on-demand.
In the future, we can expect TV viewers to continue gravitating toward mediums that offer free choice and untether them from the constraints of their TV sets.
21
We also observe a similar story in radio, if you define “radio” as listening to music you don’t own. Across generations, we see a similar amount of time spent with radio, but methods of consumption vary. As with TV, there is a steep drop-off in the amount of broadcast radio consumed, and an increase in radio listening via streamed music services, such as Spotify and Apple Music. For Millennials, streaming services command at least 45% of all listening, and as high as 73% in the US. Just as with TV, we see an increasing share of streamed music as the generation gets younger.
When discussing TV viewership, the “elephant in the room” is YouTube. Currently we classify its content as “online” because the number of 30-minute, ‘TV-style programs’ on the platform is limited. But with YouTubeTV available in 98% of US homes as of January 2019, this may prove to be an inflection point in the rise of streamed TV across the board in the US.

22
Within each of these mediums (TV and radio), we observe a rise in sub-media that is adaptable, customizable, and preferably algorithm-driven based on one’s input. We are no longer passive consumers of media, but instead active agents in the process. The future of traditional, “broadcast” TV and radio does not look promising based on the trends observed.
Online provides the highest level of user control compared to any other medium. In terms of total media hours consumed, online is one of the only growth areas, as measured at the aggregate level. Each successive generation is consuming more online content and spending more time in front of a screen. Only time will tell whether this is a permanent cultural phenomenon or entirely related to age.
We split online into three separate functional arenas, based on how people categorize their online activity: social media, short form video (e.g. YouTube), and general, or the “rest of the internet.”
23
Millennials
Gen X
173
119
220
141
184
134
161
110
186
136
207
139
132
104
107
91
137
97
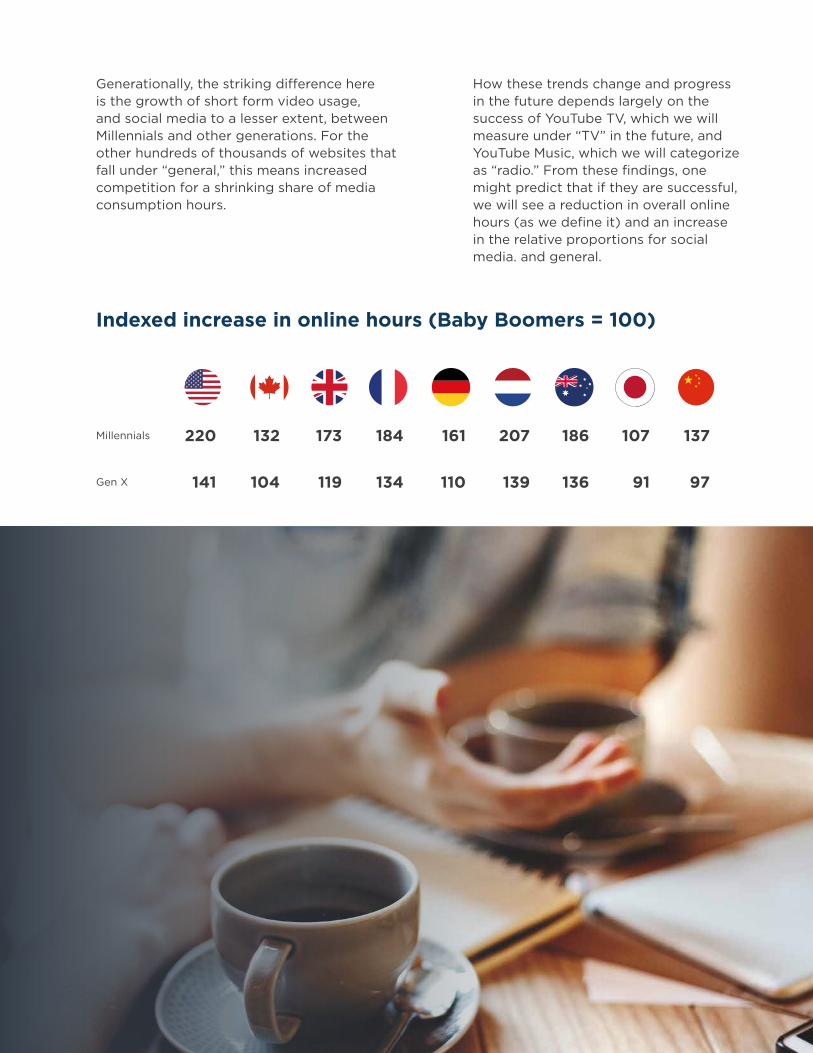
Indexed increase in online hours (Baby Boomers = 100)
Generationally, the striking difference here is the growth of short form video usage, and social media to a lesser extent, between Millennials and other generations. For the other hundreds of thousands of websites that fall under “general,” this means increased competition for a shrinking share of media consumption hours.
How these trends change and progress in the future depends largely on the success of YouTube TV, which we will measure under “TV” in the future, and YouTube Music, which we will categorize as “radio.” From these findings, one might predict that if they are successful, we will see a reduction in overall online hours (as we define it) and an increase in the relative proportions for social media. and general.

24
Consumer Sentiment Trends

25
The consumer purchase journey has been upended in the past decade. A 2009 McKinsey study recognized that change was happening, saying “Consumers are moving outside the marketing funnel by changing the way they research and buy products.”
We examined sources of concern in the world today: the impact of workplace automation, climate change and topics such as financial wellbeing, happiness, optimism and attitudes to religion. A decade later, our study examines consumers’ relationship to brands, who they trust when making purchasing decisions and how they feel about giving feedback on their brand purchases.
26
Our survey found that consumers may not identify as closely with brands as we might think. Only 16% of people surveyed agreed with the statement that “The brands you buy say a lot about you.” Just a quarter (26%) think you can tell a lot about an item’s quality from its brand, and about a fifth (22%) say brands help them make choices in a crowded marketplace. Forty percent agree with the statement, “There are brands that I love,” while many fewer (21%) think branding is just an excuse for inflated price.
People in France and Japan tend to be the most skeptical: Only 19% in France and 14% in Japan think brand name is a measure of quality, compared to 26% in the UK, 27% in Australia and 53% in China. Only 32% of people in France and 27% in Japan say they have brands they love compared to 44% in the US and Canada and 57% in China.
What’s in a (Brand) Name?

27
A generational shift is evident in some attitudes to brands.
However, a generational shift is evident in some attitudes to brands. While only 11% of Baby Boomers and 16% of Gen X’ers think brands say a lot about them, 22% of Millennials believe the brands they buy speak for them and 26% believe brands can signal quality, compared to only 21% of Baby Boomers.
Attitudes towards brands can of course vary greatly depending on the item under consideration (a car compared to toothpaste, for example), so this study asked about the importance of brands across a wide variety of items.
Motor Vehicles 54%
Clothing 44%
Mobile Phones 53%
Alcohol 31%
Basic Foodstuffs 23%
Computers and Tablets 52%
Soft Drinks 26%
Ready Meals 22%
Branding is important in...
28
At least half of all participants think brands are important when considering major purchases including motor vehicles (54%), mobile phones (53%), and computers and tablets (52%). Forty-four percent think brands matter when considering clothing purchases. However, only about a quarter think brands are important when purchasing a smaller item, including heavily brand-advertised categories like alcohol (31%), soft drinks (26%), basic foods (23%), and ready meals (22%). Finally, 16% of people claim not to think brands are important in any of these categories.
Opinions about the importance of brand by category were generally consistent across most countries studied. The US, however, stood out for its higher than average (38% v. 26%) appreciation for the importance of branding in the soft drinks category and Australia scored higher than average (37% v. 31%) in believing brand is important when buying alcohol.
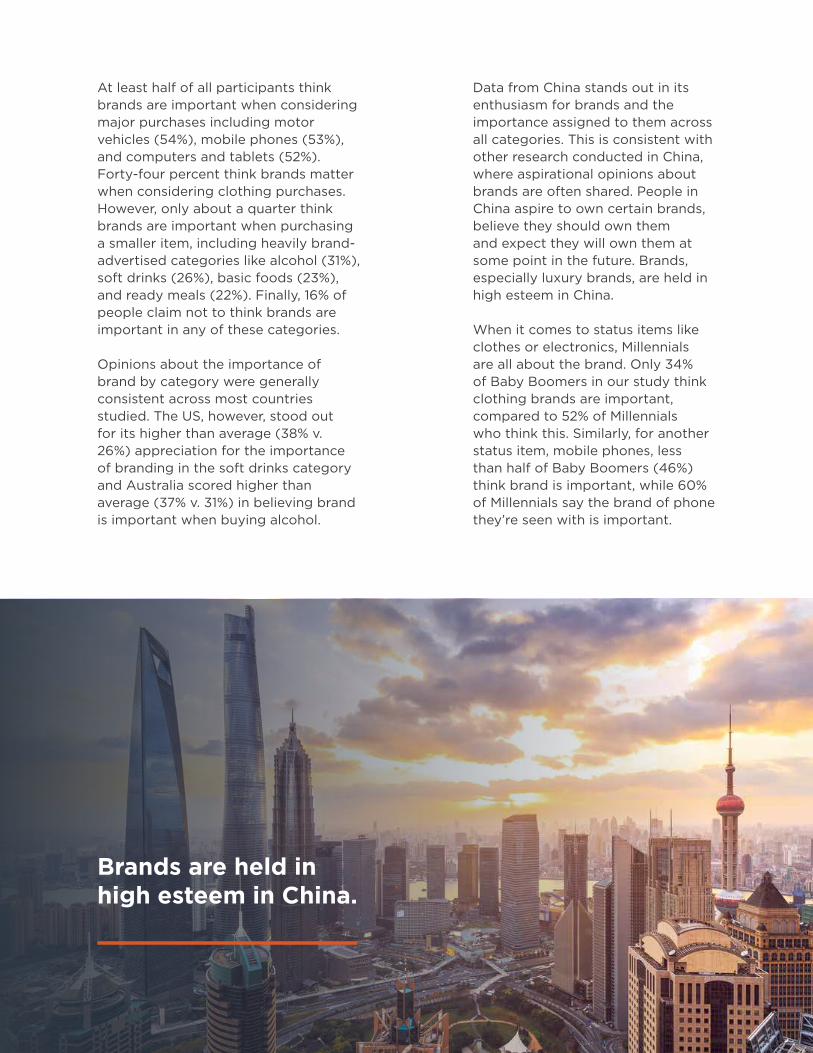
Data from China stands out in its enthusiasm for brands and the importance assigned to them across all categories. This is consistent with other research conducted in China, where aspirational opinions about brands are often shared. People in China aspire to own certain brands, believe they should own them and expect they will own them at some point in the future. Brands, especially luxury brands, are held in high esteem in China.
When it comes to status items like clothes or electronics, Millennials are all about the brand. Only 34% of Baby Boomers in our study think clothing brands are important, compared to 52% of Millennials who think this. Similarly, for another status item, mobile phones, less than half of Baby Boomers (46%) think brand is important, while 60% of Millennials say the brand of phone they’re seen with is important.
Brands are held in high esteem in China.
29
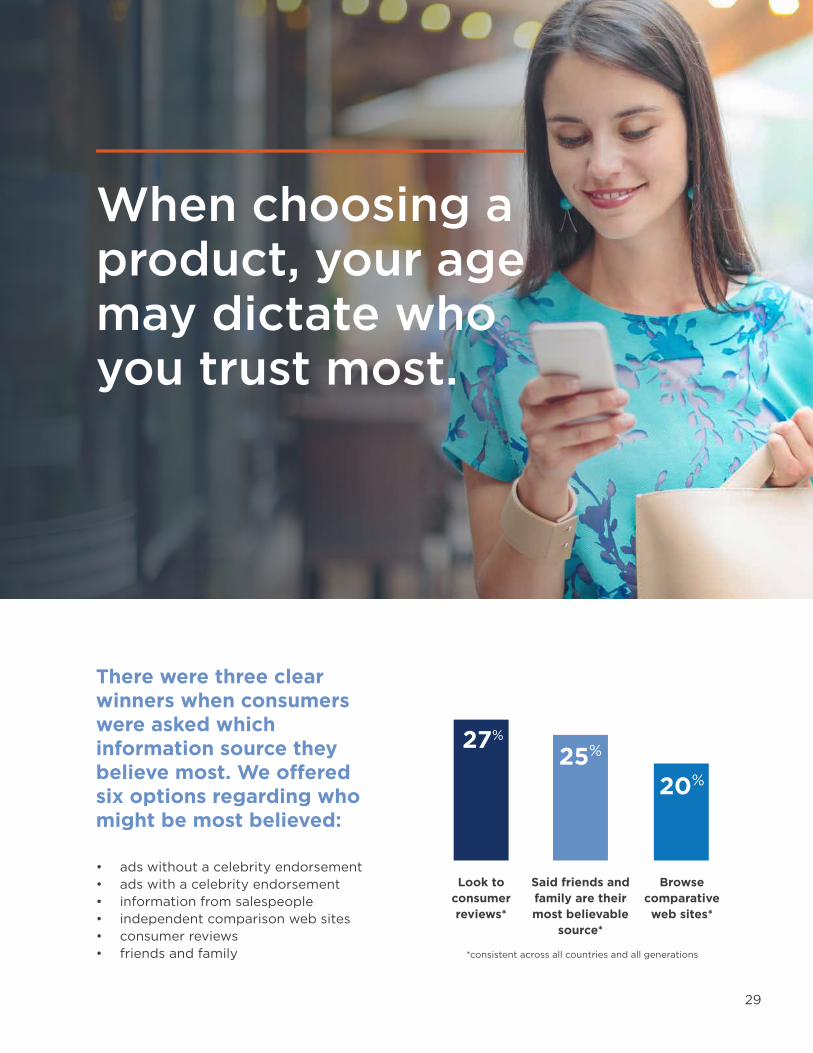
Look to consumer reviews*
Said friends and family are their most believable
source*
*consistent across all countries and all generations
Browse comparative web sites*
27%
When choosing a product, your age may dictate who you trust most.
There were three clear winners when consumers were asked which information source they believe most. We offered six options regarding who might be most believed:
• ads without a celebrity endorsement• ads with a celebrity endorsement• information from salespeople• independent comparison web sites• consumer reviews• friends and family
25%
20%

30
When it comes to the least trusted source of information, 37% of people chose ads with a celebrity endorsement, with salespeople telling them about the brand second (20% saying this is their least trusted source).
Advertising with a celebrity endorsement was the least trusted source within every generation, although there was more acceptance of this method among younger generations. Forty-eight percent of the Silent Generation and 45% of Baby Boomers selected this as their least trusted source, compared to 36% for Gen X’ers and 28% for Millennials.
31
Consumers believe their opinions matter to brands and make a difference. This might seem to be an obvious conclusion to derive from a survey of people who choose to take surveys. But there is sometimes a perception that people who take surveys, especially online surveys, are just in it for the money, or don’t care about the information they’re giving. Our study found that 60% of the people surveyed believe the opinions they express in surveys about brands or companies will improve their experience with those brands or companies.
Consumers believe their feedback counts, but differ in how they want to provide it.

32
This belief that their opinions can make a difference is very consistent across six of the countries studied (UK, Germany, the Netherlands, Australia, Canada, and the US) ranging from 55% - 59%. More French (65%) and Chinese (81%) people surveyed believe this, while fewer Japanese (47%) agree.
Invite me to do a survey, not right after I purchase or use the product/service
Invite me to do a survey right after I purchase or use the product/service
Observe what I write about the product on social network sites/blogs
Allow me to contact you directly to give my feedback
Read my product reviews
37%
12%
29%
9%
12%
Best way to get customer feedback from me…

33
When asked which of the five ways of giving customer satisfaction feedback people preferred, getting a survey at any time, not immediately after purchase, was the favorite method selected by 37% of people across all countries. Twenty-nine percent preferred to be asked immediately after they purchase something, 12% wanted companies to read their product reviews, and 9% wanted companies to read what they post on sites like Facebook and Twitter. Twelve percent prefer an active approach, contacting the company themselves to give feedback, rather than waiting to be contacted.

34
Happiness levels don’t vary greatly by generation, but younger people are more optimistic about their own and the world’s future, and there are dramatic differences across geographies.
Across all nine countries studied (US, Canada, UK, France, Germany, the Netherlands, Australia, Japan and China), 39% of the Silent Generation count themselves extremely or very happy, 35% of Baby Boomers say this, while 35% of Gen X’ers and 44% of Millennials agree. Fourteen percent of the Silent Generation say they are somewhat or not at all happy, 22% of Baby Boomers say this, as do 24% of Gen X’ers, and 20% of Millennials. When it comes to levels of optimism by country the differences are stark.
Twenty-five percent of Americans and an astounding 65% of Chinese participants think the world will be a better place in five years’ time, compared to 7% in France, 8% in Germany, 10% in the Netherlands and the UK, and 14% in Canada.
Happiness and Optimism
The world will be a better place in 5 years time
65%
25%
14%
13%
11%
10%
10%
8%
7%
Americans are optimistic… but Chinese are exuberant

35
We see evidence of the hopefulness of youth in answers to this question about the state of the world: In France, just 2% of the Silent Generation think the world will be a better place in five years versus 14% of Millennials. Among Americans, the numbers are very different, but the trend is the same: 18% of the Silent Generation think the world will be a better place in five years versus 36% of Millennials. US optimism isn’t just about dreaming of a brighter future. Forty-nine percent of Americans say they’re extremely or very happy now, compared to 26% in Japan, 29% in France, 35% in Germany, 38% in Australia, 39% in China and the Netherlands, 40% in the UK, and 43% in Canada. In fact, Americans are happier and more optimistic across multiple measures, compared to all countries studied except China.
When it comes to prospects for one’s personal life in five years’ time, 47% of Americans expect life to be better, but only 23% of French and 24% of Germans agree. Twenty-nine percent of participants from the Netherlands think their personal life will be better in five years, 31% of Britons, 35% of Australians, and 42% of Canadians think this.
50% of Americans expect prospects for their financial life to be better in five years’ time, but only 25% of French participants and 27% of Germans agree. Thirty-one percent of those from the Netherlands think their financial life will be better in five years, and 34% of Britons, 37% of Australians, and 44% of Canadians agree.
Millennials believe personal finances will be better in 5 years time
89%
70%60%
58%52%52%
50%46%
38%
Base: All Millennials
36
Yet American optimism pales in comparison to the exuberant scores we see from China.Chinese people may not be markedly happier today than people in other countries (39% say they’re somewhat or extremely happy today, compared to 38% for all countries). However, when it comes to optimism about the future, their scores are sky-high. Fully 70% of those interviewed think their personal life will be better in five years’ time and 74% think their financial wellbeing will be better in five years– well over double the average for the other eight countries.
These scores are not surprising. While there has been a slowdown in the Chinese economy recently, the bigger picture supports the optimism we see. China has experienced rapid economic expansion, urbanization and industrialization; the IMF reports 2018 real GDP growth for China as 6.6% compared to 1.6% for France and 2.9% for the US. China’s Millennials, who have the inbuilt optimism of youth and have only known growth and transformation in their country, are the most optimistic of all. Fifty-three percent of Millennials across all countries expect their personal life to be better in five years’ time, compared to 36% for the generation immediately preceding them and 21% for Baby Boomers. In contrast, 82% of Chinese Millennials expect their personal life to be better in five years. Our youngest cohort is more optimistic about their financial wellbeing too: 58% of Millennials across all countries expect their financial prospects to improve in the next half decade, compared to 39% for Gen X and 21% of Baby Boomers. In China, 89% of Millennials interviewed expect their financial prospects to be better in five years. A possible additional factor in the high spirits found in these results is the timing of this survey, which was conducted soon after the Chinese New Year. 2019 is the year of the pig, characterized by optimism, good fortune, and happiness!

37
Two topics, which have been identified as global concerns that might impact people’s optimism are the rise in technology, which has the potential to radically change people’s working lives, and climate change, which has the potential to change where and how people live in coming decades.
People appear to be coming to grips with the idea that machines will take over jobs in the coming decades. Replacement of their work with robots or AI would have been almost unimaginable to members of the Silent Generation, and a novel idea to Baby Boomers, but Gen X’ers and especially Millennials have lived with increased automation since they were toddlers: the youngest members of Gen X were born just a few years before the first Macintosh was introduced and Millennials (those born since the mid-1980s) have grown up with AI and automation. Only 15% of the Baby Boomer generation think the world would be a better place if work was done by robots or AI, yet 23% of Gen X’ers think this and 32% of Millennials agree.
Work and AI
54%of working Baby Boomers think the world would be a worse place if work was done by robots or AI
Redundant by Robot: Attitudes towards automating the workplace
Millennials
23% 45% 32% 38%15% 54%23% 50%
Gen XBaby BoomersBetter Better Better BetterWorse Worse Worse Worse
Silent
View of the world if AI takes over jobs
Base: All in work

38
Only 15% of Baby Boomers think the world would be a better place if work was done by robots or AI, yet 23% of Gen X’ers think this and 32% of Millennials agree. Conversely, 54% of Baby Boomers think the world would be a worse place if this happened; 45% of Gen X’ers think this and 38% of Millennials.
Moving from the abstract to their own job situation, we see the same evolution of opinion. Forty-two percent of Baby Boomers, who currently work, think it’s not at all likely that their job will be taken over by a robot or AI in the future, but only 29% of Gen X’ers and just 16% of Millennials think this is not at all likely.
With this increasing acceptance and positivity towards human work being taken over by robots and AI, there are some notable differences of opinion among the countries studied.
Forty-one percent of people in China, 35% in Japan and 33% in the US think their jobs are extremely or very likely to be taken over, while only 16% in the Netherlands expect this to happen.
Forty percent in China think the world would be a better place if AI and robots took over jobs. In contrast, just 25% of Americans, 22% in the UK, 21% in Germany, 20% in Australia, 19% in Canada, 18% in the Netherlands, and 16% in France think this. In the US, nearly twice as many people (47%) think the world would be a worse rather than better place (25%) if AI and robots took over jobs.
41% of Millennials think it’s extremely or very likely their job will be taken over by robots or AI, a quarter (26%) of Gen X’ers think this, yet only 16% of Baby Boomers expect this to happen.

39
Society
We might best understand the level of fear within our society as a whole not by looking at how safe we feel within our own local communities, but how this drops away as our focus moves further away, to our town or city, to our country and then out to other countries.

40
The fear/distance relationship usually shows a smooth trend downwards, but we observe some interesting anomalies. In both Australia and Canada, the line is flat between town/city and country. Australians and Canadians are projecting a more cohesive nation perhaps.
For Australia and Canada this results in what appears to be a large disparity between the “home nation” and “foreign countries.” Canada, which had rated its neighborhoods the safest of all the countries covered, now slips to being among those considering other countries to be more unsafe. Both countries are large, which, one might think, would lead to greater unfamiliarity between town/city and country and therefore greater distrust. However, they are both relatively sparsely populated and relatively homogeneous in culture, notwithstanding the language differences in Canada. The same is not true of the US. Here we observe the largest drop- off between town/city and the country as a whole.
China presents an interesting case. It is the only country where the rest of the country is deemed safer than either the local neighborhood or the city/town lived in. This may well reflect the urban nature of the internet population in China, and therefore a recognition of the truth. Generally, the smaller the country, and perhaps the more travelled the population is, the smoother the progression becomes. The UK, France, Germany and the Netherlands all exhibit this pattern.
Neighborhood
Town/city
Your country
Other countries
62% 63% 59% 39% 50% 41% 54% 44% 50%
52% 52% 42% 32% 39% 31% 44% 44% 50%
30% 53% 28% 17% 30% 19% 42% 37% 58%
17% 13% 15% 12% 14% 8% 13% 5% 21%
Extremely/Very Safe
Safety in society
41
As we concentrate on the generations we see that the level of fear of the “other” increases with age. Whether this comes with age or is a result of reduced exposure to other cultures remains to be seen in the fullness of time. A factor that is driven by age is the perception of the crime rate. Clearly the crime rate either is or is not going up in any particular country. In the US, for example, crime has decreased year over year since the 1990s, as it has in the UK, but it is not perceived this way.
Perhaps what such a question actually measures is the fear of crime. Almost six in 10 of the Silent Generation, and over half of all Baby Boomers, feel that the crime rate is increasing. Even when the majority don’t think it is going up (as is the case for both Gen X’ers and Millennials), very few recognize it is actually going down, it is only around one in 20 outside China. China is the only country that reports that crime is going down; a mere one in eight think it is on the rise.
The pattern across nations is roughly similar. Canadians are the least likely to feel that crime is on the increase, although one in three Canadians feels this way. The UK has the highest perception, almost six in 10 Britons feeling that crime is on the rise. Fear of outsiders, the “other,” along with a perception of an increase in crime, might feed into a feeling of a lack of cohesiveness in society. And this is very much in evidence.
Feeling that society is more together today is a minority opinion to hold; except in China, around one in 10, irrespective of country, feels this way. That it is this high is very much driven by Millennials. One in five Millennials feels society is more together, this halves to one in 10 Gen X’ers, then halves again to one in 20 Baby Boomers.
Again excepting China, the majority view is that society is becoming more divided. Only in Australia and Canada, and there only just, does less than half the population think this way. Germany is the country feeling most divided, with two out of three Germans feeling this way. China presents a completely different view of the cohesiveness of its society. Only two in ten feel their country is more divided with four in ten feeling it is more together than ever.
42
Bo
Climate Change
100% sure
Pretty sure
Probably is
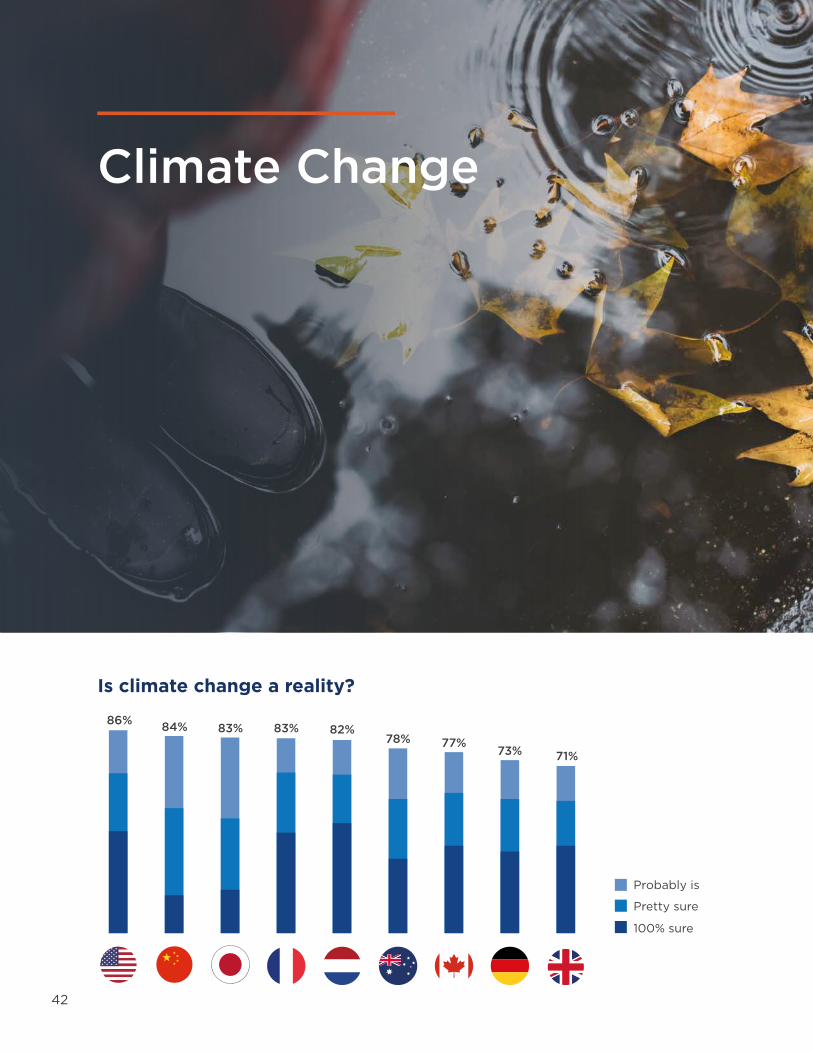
Is climate change a reality?
86% 84% 83%
83%
82%
78%
77%
73%
71%

43
Ask 10 people if climate change is happening and at least seven of them will agree it is. This rises to just over eight out of 10 Dutch, American, Japanese, Chinese, and French citizens.
With the exception of Japan and China, around half of those that think climate change is a reality are 100% sure that this is the case. Only Australia bucks this trend, being a little less sure (41% of those who are sure, are 100% sure). However, in both Japan and China only around one in five are 100% sure.
Our findings generally hold across the generations with Millennials being somewhat less sure that climate change is a reality.
All this said, one in 10 of all surveyed do not believe that climate change is happening. This is at its highest in the UK and Germany where 15% and 13%, respectively, do not believe in climate change.
While we may recognize that our climate is changing, where the cause lies is subject to some debate, as is what could be done about it. Eight out of 10 agree that the climate change they are witnessing is caused by human activity, irrespective of age or generation, and on average, two-thirds believe that climate change can be reversed by our actions. Here we see, for the first time on this topic, some serious variation between countries. France,
home to the Paris Agreement on Climate Change, of course leads the way with eight out of 10 believing we can do something to reverse it. France’s neighbor, Germany, is lowest. Fewer than half of all Germans (48%) believe climate change can be reversed by human action. In the US, which has signalled its intent to withdraw from the Paris Agreement, two-thirds believe that climate change can be reversed by human action. China, the number one contributor to greenhouse gas emissions, is the most positive that the problem can be fixed by our own actions.
As we concentrate on the larger number it is worth pointing out that one in three of those who believe that people are the cause of global warming are resigned to us being unable to fix the problem we have caused.
One in 10 of all surveyed do not believe that climate change is happening.
Base: All thinking climate change is a reality
Yes - Climate Change is Fixable
Millennials
63% 62%67%63%
Gen XBaby Boomers
Silent
65%
72%
64%
82%
48%
55%
63%
51%
75%

44
Religion

45
Analysis by generation reveals that the waning of religion holds true for all the generations born since World War II, and to much the same level. Only among the Silent Generation are the majority believers. This implies that the decline in overall religious belief reported over time may well plateau or rise slightly. In almost all countries (Japan being the exception) Millennials were more likely to be religious believers than the generation ahead of them, Gen X’ers, closer in fact to Baby Boomers.
Whether believers or not, a large majority in most countries attends church or any religious gathering either rarely or, more often, never. Only in the United States did more than one in ten claim to attend very frequently.
Outside North America, the majority of participants (ranging from 82% in Japan to 55% in Germany) said they were not religious believers* of any faith. Only in Canada (52%) and the US (66%) are believers in the majority.
Religion is more relevant today
20%33%
25%25%
16%21%
12%16%
13%15%
15%15%
15%14%
10%14%
12%11%
Gen X
Millennials
*The answer to the question “how many religious believers are there?” depends very much on what is understood by a “religion” and by “belief.” Our question asked: “Would you describe yourself as a religious believer, of whatever faith?”

46
The future may be rosier than this for houses of worship. Millennials were more likely than any previous generation to say they attended very frequently, surpassing attendance by the Silent Generation in many countries. In fact, one in four Millennials attends either very frequently or often.
Unsurprisingly then, religion is more likely to be seen as more relevant today than in the past by Millennials more than any other generation. Also unsurprisingly, Americans are the nationality most likely to say the same. Canada, the second highest country in terms of believers, has similar reported levels of the relevance of religion to the Netherlands, the European country with the fewest number of believers. Interestingly China, with fewer than one in four believers, is the country most similar to the US. Just under one in four think religion is more relevant today than in the past.
Our question asked: “Would you describe yourself as a religious believer, of whatever faith?”

47
Trust and Privacy
48
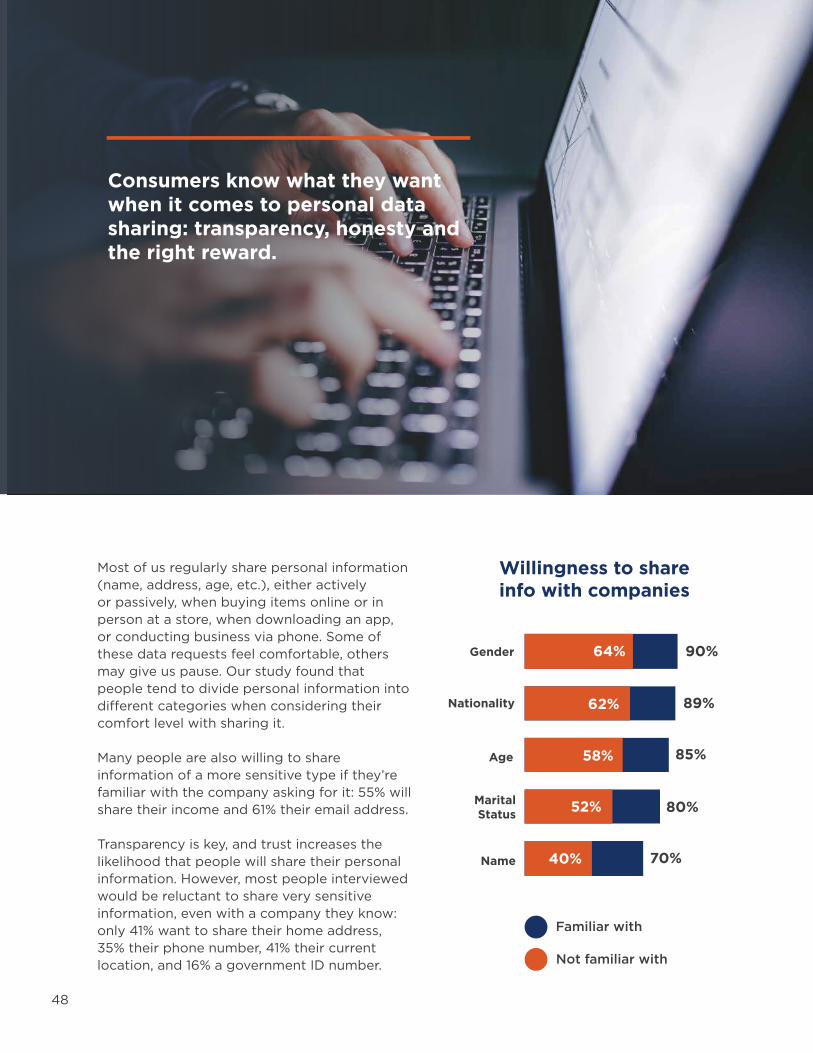
Most of us regularly share personal information (name, address, age, etc.), either actively or passively, when buying items online or in person at a store, when downloading an app, or conducting business via phone. Some of these data requests feel comfortable, others may give us pause. Our study found that people tend to divide personal information into different categories when considering their comfort level with sharing it.
Many people are also willing to share information of a more sensitive type if they’re familiar with the company asking for it: 55% will share their income and 61% their email address.
Transparency is key, and trust increases the likelihood that people will share their personal information. However, most people interviewed would be reluctant to share very sensitive information, even with a company they know: only 41% want to share their home address, 35% their phone number, 41% their current location, and 16% a government ID number.
Consumers know what they want when it comes to personal data sharing: transparency, honesty and the right reward.
90%Gender
89%
85%
80%
70%
64%
62%
58%
52%
40%
Willingness to share info with companies
Nationality
Age
Marital Status
Name
Familiar with
Not familiar with
49
Participants in China displayed more reluctance to share these items than those in all other countries. Only 38% are comfortable sharing their name with a company they’re familiar with. Only 67% are comfortable sharing their age, although most (80%) would be willing to share their nationality, 62% their marital status, and 77% their gender.
As expected, a willingness to share information drops significantly when the company is one not familiar to the person. For example, 70% of Americans would willingly share their name with a company they’re familiar with, but only 37% would share if they didn’t know the company asking for this information.
Common-sense measures by companies could ease consumer anxiety about sharing information. Consumers want to be informed and in control: 45% want companies to be transparent about how the company will use personal data, 45% say companies should give them the choice of opting out, 46% ask companies to make it easy to choose what they share, and 42% want short, easy-to-understand privacy agreements.
We tend to assume that everyone’s data is for sale and that people will be willing to share on a simple transactional basis. But the offer of a reward doesn’t allay people’s discomfort. Only 27% said they would feel more comfortable giving up their personal data if they received a reward. The clear favorite reward for sharing personal data was discounts and other perks, preferred by 59% of participants.
Thirty-four percent would share their data if doing so improved products and offerings and 31% would be willing to share in exchange for membership or higher status in a loyalty program. On the other hand, more relevant offers and promotions, tailored product suggestions, in-the-moment prompts, and faster customer support were not strong inducements for people to part with their personal data; these options were favored by less than a fifth of those interviewed.

50
In conclusion, there is a great deal of concern about data collection practices: 80% of people interviewed think consumers “have lost control” over how personal data is collected and used, and 71% said companies have been “dishonest” about how their own personal data has been used. This fear poses a real risk to marketers and researchers who rely on the availability of consumer opinions and data to solve business problems and create new business opportunities.
However, consumers seem willing to give companies a chance to change consumer perception of data security. Seventy-three percent said they would be willing to share personal data if they could see a clear benefit, but that benefit must be a meaningful one. People today clearly understand the value of their personal information to businesses and are unwilling to share it without some consideration of its value and how it will be used.
81%Said they would be more willing to share their data if they thought companies were being more transparent in how the data is used.
Be more willing to share data with businesses if they were more transparent about use
83%
82%
85%
86%
82%
78%
86%
59%
87%
27%
26%
22%
27%
24%
21%
25%
5%
15%
Agree (total)
Agree (strongly)

51
It may come as no surprise that not everyone always gives 100% accurate information on websites. Very few, around one in 20, say they never do this.
In fact, the number of people who told us they never gave false information was, taking all countries together, the most popular answer choice. Just under four out of ten (39%) said that. This rose to almost half of all Americans (48%) and similar numbers of Canadians, Dutch and French citizens who always gave the truth.
Consistently, across all countries, about a quarter of everyone surveyed said they often or sometimes gave false information. Three quarters said they rarely or never lied on a website.
39%
never give falseinformation on websites.
Providing Personal Information on Websites

52
Consumers are taking action to protect their data privacyEighty-four percent of people across the nine countries surveyed have taken some kind of action in the past 12 months in response to concerns about their data privacy.
The top ten things consumers are doing to address privacy concerns are:
33%
31%30%
29%29%
29%27%
26%24%
10%

53
Nine percent of people across all countries said they considered purchasing a product and decided not to, or bought it from a different brand, and 4% called a company to raise privacy concerns.
People in Japan are less likely to take actions such as deciding not to buy a product or buying from a different brand or raising concerns with the company due to privacy concerns than those in other countries studied. For example:
The US and Australia are the countries where people are most likely to be taking action, followed by China, Canada, Germany and the UK. In the US:
• Only 9% of respondents surveyed in Japan said they’d hesitate to share opinions or content on social media because of data security concerns, compared to 34% of people in the US, 31% in Canada, 27% in Australia, and 23% in the Netherlands.
• Only 3% of people surveyed in Japan have changed their purchasing behavior, compared to 10% in China, 13% in Australia, and 12% in the US.
• Only 15% in Japan have adjusted their mobile phone privacy settings in the past year, compared to 47% in China and 41% in the US.
• 42% of people surveyed have deleted apps on their phones, compared to just 27% in France.
• 40% have chosen not to visit certain sites, or closed them, compared to 22% in China and 25% in the UK.
• 41% of people have adjusted mobile phone settings, compared to 21% in France and 26% in Germany.

54
CONCLUSION
Access to valuable, first-party data is just the first step. Now it’s up to us, as researchers and marketers, to identify the key takeaways and integrate them into our everyday work. So, how might we use this data to improve our business strategies?
1. Mythbusting: The fact that young people are not wholly giving up broadcast TV for media consumption via other devices, and that religion is more engaging and relevant for younger people than some older generations might come as a surprise, and thus encourage us to challenge conventional assumptions and provide fresh perspectives on our data.
2. Using macro trends for context: Specific findings like varying levels of enthusiasm for a new concept in France v. China, for example, might be informed by much broader macro trends, driven by forces of global economic and technological shifts.
3. Offering the long view: News articles tell us of recent economic woes in China, but when we see the optimism of that population, we think about how the country has changed over the last one or two decades and how that longer experience informs people’s attitudes on so many of the topics we care about.
4. Better ways to ask: Opinions on trust and privacy force us to think about how to construct our own questions. Given the high levels of mistrust we see, how can we give people options and more autonomy and freedom to give their opinions in a way that feels comfortable to them? Over 60% of people have provided false information online. Can we offer better ways to share sensitive information, make ranges broader, be more transparent about how we use people’s data, and give them more leeway to help them share their truths?
5. The ownership/usage gap: Just because someone has an item in their home doesn’t mean they use it, nor does it mean that they use it as much as they once did – and of course the gap varies by item. Today, it might apply to a new technology device, tomorrow to a car in the garage.

55
6. Trends worth close attention: The data offers hints about the technologies that are catching on and those that aren’t, which might help us decide which items to keep an eye on in our own trackers.
7. Identifying the inflection points: YouTube is almost ubiquitous in US homes – this could have a huge impact on any product or trend related to a rise in streamed TV.
8. Gaining context: There’s no shortage of statistics online, but what are they counting exactly? When we see numbers around TV viewership, for example, do they include YouTube?
9. Being better at our craft: The findings about how people want to give their opinions can help inform research designs which use not only traditional questionnaires, but an array of other data sources.
10. Deeper understanding of regional differences: There are many drivers of varying opinions by country on whether we can do anything about climate change, whether we feel safe, or how we view our future. These include availability of information, economics, politics, and education. The differences may also signal different levels of self-determination, which academic research has shown varies by country and helps put our findings in context.
CONTRIBUTORS
Melanie CourtrightExecutive Vice President, Global Research Science Jackie LorchVice President, Global Knowledge Management Pete Cape Director, Global Knowledge Roddy KnowlesDirector, Product and Innovation Research
Kaitlin NizolekCorporate Communications Manager, Marketing

About Dynata
Dynata is one of the world’s leading providers of first-party data contributed by consumers and business professionals. With a reach that encompasses 60+ million people globally and an extensive library of individual profile attributes collected through surveys, Dynata is the cornerstone for precise, trustworthy quality data. The company has built innovative data services and solutions around its core first-party data offering to bring the voice of the customer to the entire marketing spectrum, from market research to marketing and advertising. Dynata serves nearly 6,000 market research agencies, media and advertising agencies, consulting and investment firms, and healthcare and corporate customers in North America, South America, Europe, and Asia-Pacific. For more information, go to www.dynata.com
dynata.com© 2019 Survey Sampling International, LLC. All rights reserved.