Bed Breakfast Bikes Pyrenees Offering Best Guided Cycling Tours

The Dynamic Tumor Bed Volume and Image-Guided Breast Irradiation
Tzu-I Jonathan Yang

The work presented in this thesis was performed at: The department of Radiation Oncology, Netherlands Cancer Institute, Amsterdam, The Netherlands. The department of Radiation Oncology, Memorial Sloan Kettering Cancer Center, New York, U.S.A. Copyright: Tzu-I Jonathan Yang, Amsterdam/New York, 2016 All rights reserved. No part of this book may be reproduced, stored in a retrieval system, or transmitted in any form or by any means, electronic, mechanical or otherwise, without prior written permission of the author.
VRIJE UNIVERSITEIT
The Dynamic Tumor Bed Volume and Image-Guided Breast Irradiation
ACADEMISCH PROEFSCHRIFT
ter verkrijging van de graad Doctor aan de Vrije Universiteit Amsterdam,
op gezag van de rector magnificus prof.dr. V. Subramaniam,
in het openbaar te verdedigen ten overstaan van de promotiecommissie
van de Faculteit der Geneeskunde op dinsdag 6 september 2016 om 13.45 uur
in de aula van de universiteit, De Boelelaan 1105
door
Tzu-I Jonathan Yang
geboren te Kaohsiung, Taiwan

promotor: prof.dr. M. Verheij copromotor: dr.ir. C. van Vliet-Vroegindeweij
dr. P.H. Elkhuizen

promotiecommissie:
prof.dr. H. Bartelink
prof.dr. S.N. Powell
prof.dr. C.R.N. Rasch
prof.dr. E.J.Th. Rutgers
prof.dr. B.J. Slotman
dr.ir. J.J. Sonke
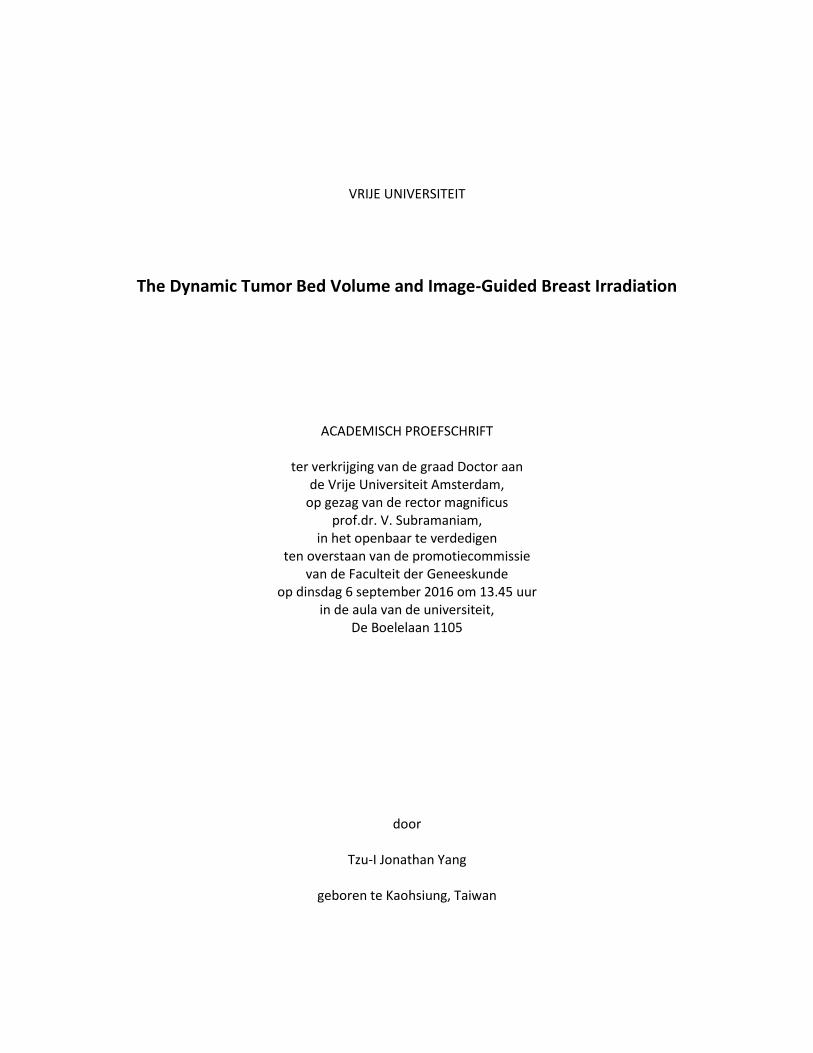
Georges Chicotot: A physician with credentials in both painting and Roentgenology. In 1908, he painted a self-
portrait that captures a historic moment in radiotherapy: the first attempt to treat breast cancer with X-rays. In his
left hand he holds a watch to time the exposure, in his right he holds what looks like a Bunsen burner that spouts
flames from its tip, heating the vacuum tube. The object glowing from the center of this painting is a Crookes tube.
Source: FASEB J 1631-1634 Vol. 24 June 2010.
TABLE OF CONTENTS Chapter 1 Introduction and Thesis Outline ……………………………………………………………………………………………………..……1-9 Chapter 2 Clinical Factors Associated with Seroma Volume Reduction in Breast-Conserving Therapy for Early-Stage Breast Cancer: a Multi-Institutional Analysis………………………………………………………………………………….…10-22 Chapter 3 Clinical Applicability of Cone-Beam Computed Tomography in Monitoring Seroma Volume Change During Breast Irradiation ………………………………………………………………………………………………………………….23-36 Chapter 4 Dosimetric Impact of Post-Operative Seroma Reduction During Radiotherapy After Breast-Conserving Surgery……………………………………………………………………………………………………………………………………………..37-49 Chapter 5 Clinical Assessment of 2D/3D Registration Accuracy in Four Major Anatomic Sites Using On-Board 2D Kilovoltage Images for 6D Patient Setup………………………………………………………………………………………..…50-64 Chapter 6 Discussion and Future Directions, Summary……………………………………………………………………………………..65-84 List of Publications...…………………………………………………………………………………………………………………………85-86 Acknowledgement…………………………………………………………………………………………………………………………………88 Curriculum Vitae……………………………………………………………………………………………………………………………………89

1
Chapter 1
INTRODUCTION AND THESIS OUTLINE Modified from: Yang TJ, Ho AY. Radiation Therapy in the Management of Breast Cancer. Surg Clin North Am. 93(2): 455-71 (2013).
2
Breast Cancer
According to American Cancer Society (ACS) statistics, breast cancer is the most common malignant disease in American women and the second most common cause of cancer death. Annually, it accounts for over 230,000 new diagnoses and it is responsible for over 40,000 deaths in the United States [1]. Approximately one in eight women will develop breast cancer in their lifetime [2]. The incidence rates decreased since 1999 to 2007 by approximately 2% per year, likely due to the discontinuation of long-term hormone replacement therapy in postmenopausal women after it was found to be associated with an increase risk in the development of breast cancer [3, 4]. Breast cancer also accounts for 2,140 new cases and 450 deaths in men annually [5]. The median age of onset of breast cancer in men is 65-67, approximately 5-10 years older than in women [6, 7]. Invasive ductal carcinoma is the most common invasive cancer, accounting for 70-80% of invasive lesions, and approximately 50% of invasive ductal carcinoma includes a DCIS component. It originates in the ductal component of the breast, penetrates basement membrane, and invades surrounding glands and adipose tissue. Invasive lobular carcinoma is the second most common type of invasive breast cancer, accounting for 5-10% of all invasive lesions. It originates from the glands, or lobules, of the breast.
Radiation Therapy and Early Stage Breast Cancer
A multidisciplinary approach that includes surgery, radiation therapy, and systemic therapy is required
for optimal breast cancer treatment. Historically, breast cancer was treated aggressively via radical
mastectomy usually without radiation therapy or chemotherapy. Advancements in the management and
cure of breast cancer resulted from conclusive data of randomized controlled trials conducted by large
national cooperative groups, such as the National Surgical Adjuvant Breast and Bowel Project (NSABP),
the Radiation Therapy Oncology Group (RTOG) and many others across the world. Collectively, they
have shown the value of adjuvant systemic therapy to reduce the risk of distant metastasis and adjuvant
radiation therapy to reduce the risk of loco-regional failure.
Radiation therapy (RT) plays an essential role in the management of breast cancer by eradicating subclinical disease after surgical removal of tumor. In women with early stage breast cancer, lumpectomy followed by RT (breast-conserving therapy, or BCT) and mastectomy have the same long-term outcomes. To date, six prospective randomized trials comparing breast conserving therapy to mastectomy have been performed [8-15] (Table 1), and multiple randomized trials have demonstrated that the addition of RT to the whole breast after lumpectomy for invasive cancer significantly reduces local relapse [16]. Although patient selection criteria and length of follow-up between these trials differed, all six trials established that breast conserving therapy and mastectomy have an equivalent effect on survival outcomes. A meta-analysis conducted by the Early Breast Cancer Trialists’ Collaborative Group (EBCTCG) that included over 10,000 women concluded that adjuvant whole breast radiation therapy (breast irradiation after lumpectomy) reduces disease recurrence at 10-year from 35% to 19%. Individual series of breast-conserving surgery and radiation therapy produce results that are frequently less than 10% and often <5% [17-20]. What is arguably even more important to patients is that the benefit in improving local control translated into an improvement in breast-cancer survival in women who received radiation therapy compared to women who did not [21].
3
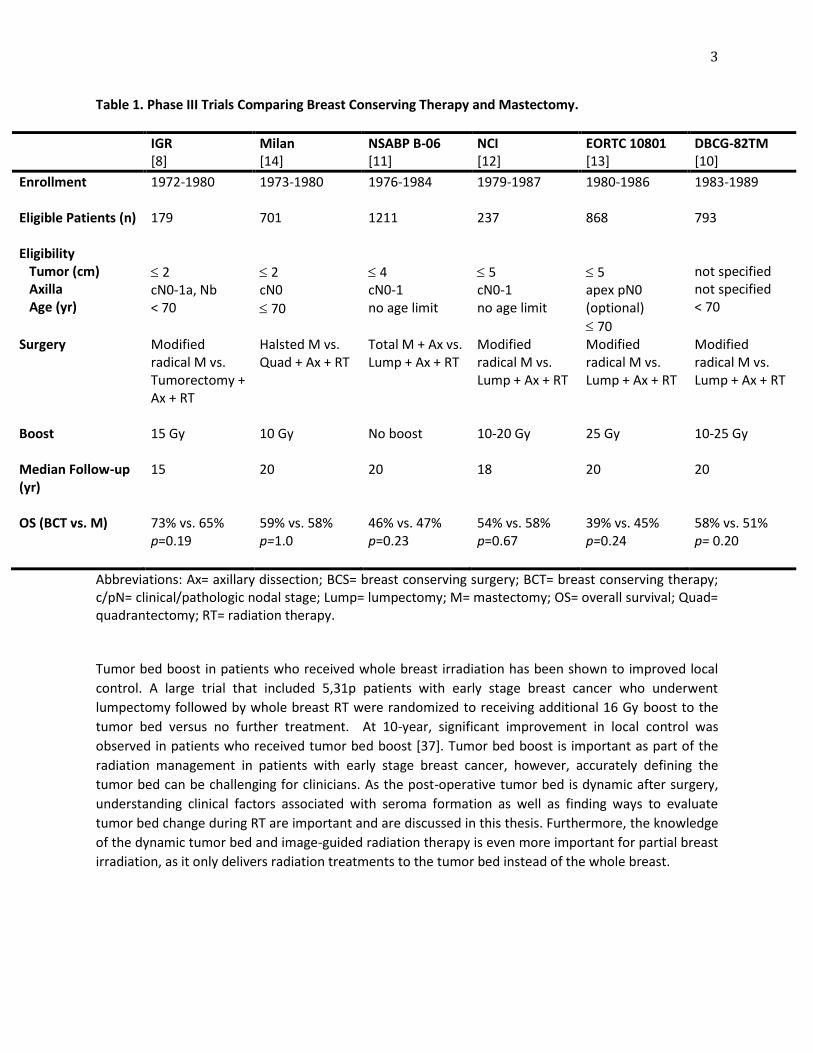
Table 1. Phase III Trials Comparing Breast Conserving Therapy and Mastectomy.
IGR [8]
Milan [14]
NSABP B-06 [11]
NCI [12]
EORTC 10801 [13]
DBCG-82TM [10]
Enrollment
1972-1980 1973-1980 1976-1984 1979-1987 1980-1986 1983-1989
Eligible Patients (n)
179 701 1211 237 868 793
Eligibility Tumor (cm) Axilla Age (yr)
2 cN0-1a, Nb < 70
2 cN0
70
4 cN0-1 no age limit
5 cN0-1 no age limit
5 apex pN0 (optional)
70
not specified not specified < 70
Surgery Modified radical M vs. Tumorectomy + Ax + RT
Halsted M vs. Quad + Ax + RT
Total M + Ax vs. Lump + Ax + RT
Modified radical M vs. Lump + Ax + RT
Modified radical M vs. Lump + Ax + RT
Modified radical M vs. Lump + Ax + RT
Boost 15 Gy 10 Gy No boost 10-20 Gy 25 Gy 10-25 Gy
Median Follow-up (yr)
15
20 20 18 20 20
OS (BCT vs. M)
73% vs. 65% p=0.19
59% vs. 58% p=1.0
46% vs. 47% p=0.23
54% vs. 58% p=0.67
39% vs. 45% p=0.24
58% vs. 51% p= 0.20
Abbreviations: Ax= axillary dissection; BCS= breast conserving surgery; BCT= breast conserving therapy; c/pN= clinical/pathologic nodal stage; Lump= lumpectomy; M= mastectomy; OS= overall survival; Quad= quadrantectomy; RT= radiation therapy. Tumor bed boost in patients who received whole breast irradiation has been shown to improved local
control. A large trial that included 5,31p patients with early stage breast cancer who underwent
lumpectomy followed by whole breast RT were randomized to receiving additional 16 Gy boost to the
tumor bed versus no further treatment. At 10-year, significant improvement in local control was
observed in patients who received tumor bed boost [37]. Tumor bed boost is important as part of the
radiation management in patients with early stage breast cancer, however, accurately defining the
tumor bed can be challenging for clinicians. As the post-operative tumor bed is dynamic after surgery,
understanding clinical factors associated with seroma formation as well as finding ways to evaluate
tumor bed change during RT are important and are discussed in this thesis. Furthermore, the knowledge
of the dynamic tumor bed and image-guided radiation therapy is even more important for partial breast
irradiation, as it only delivers radiation treatments to the tumor bed instead of the whole breast.
4
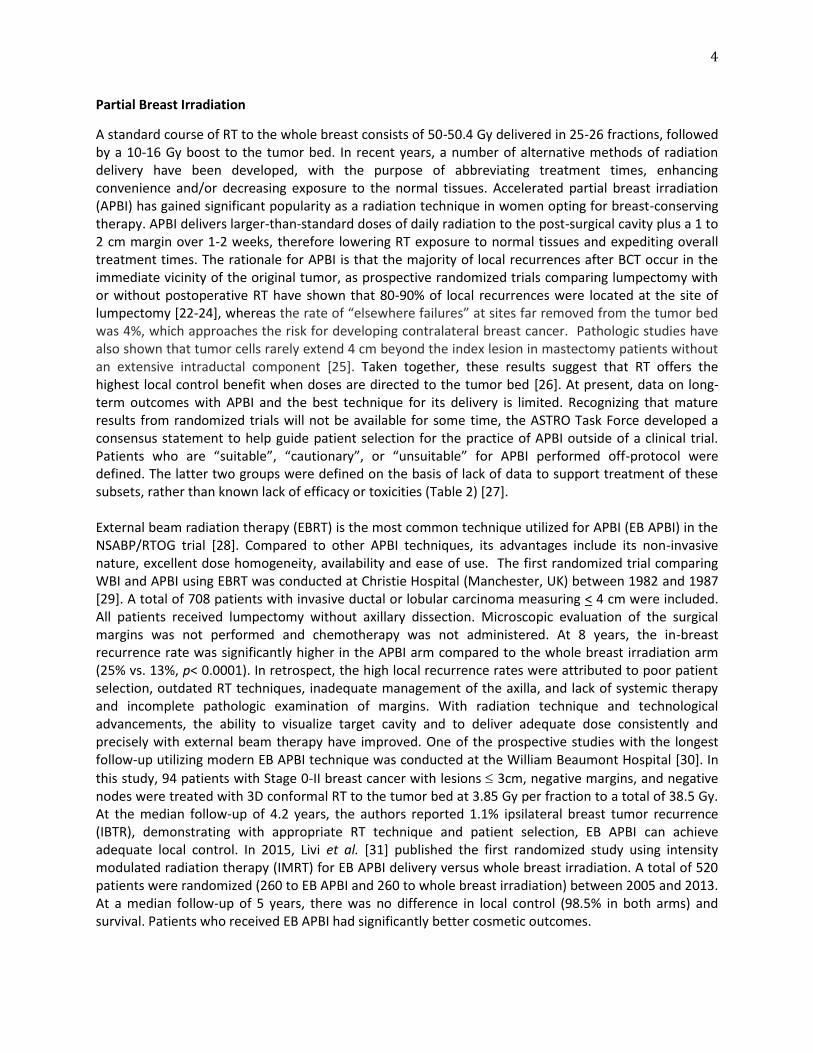
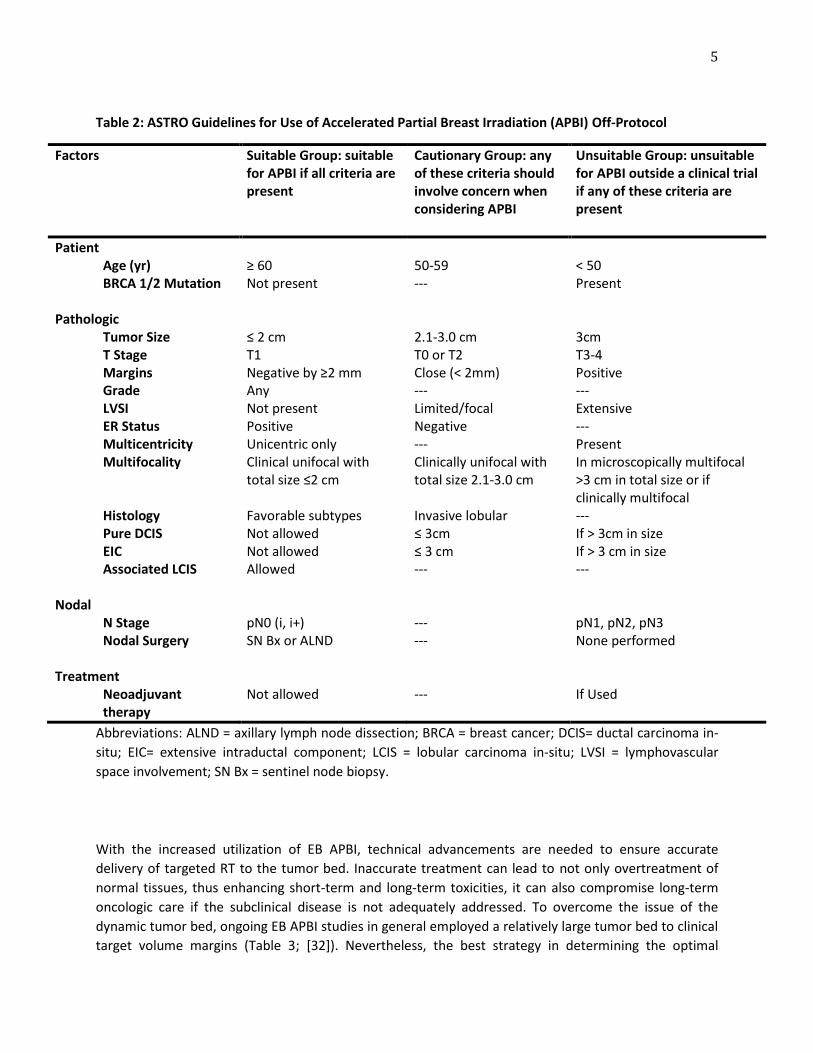
Partial Breast Irradiation
A standard course of RT to the whole breast consists of 50-50.4 Gy delivered in 25-26 fractions, followed by a 10-16 Gy boost to the tumor bed. In recent years, a number of alternative methods of radiation delivery have been developed, with the purpose of abbreviating treatment times, enhancing convenience and/or decreasing exposure to the normal tissues. Accelerated partial breast irradiation (APBI) has gained significant popularity as a radiation technique in women opting for breast-conserving therapy. APBI delivers larger-than-standard doses of daily radiation to the post-surgical cavity plus a 1 to 2 cm margin over 1-2 weeks, therefore lowering RT exposure to normal tissues and expediting overall treatment times. The rationale for APBI is that the majority of local recurrences after BCT occur in the immediate vicinity of the original tumor, as prospective randomized trials comparing lumpectomy with or without postoperative RT have shown that 80-90% of local recurrences were located at the site of lumpectomy [22-24], whereas the rate of “elsewhere failures” at sites far removed from the tumor bed was 4%, which approaches the risk for developing contralateral breast cancer. Pathologic studies have also shown that tumor cells rarely extend 4 cm beyond the index lesion in mastectomy patients without an extensive intraductal component [25]. Taken together, these results suggest that RT offers the highest local control benefit when doses are directed to the tumor bed [26]. At present, data on long-term outcomes with APBI and the best technique for its delivery is limited. Recognizing that mature results from randomized trials will not be available for some time, the ASTRO Task Force developed a consensus statement to help guide patient selection for the practice of APBI outside of a clinical trial. Patients who are “suitable”, “cautionary”, or “unsuitable” for APBI performed off-protocol were defined. The latter two groups were defined on the basis of lack of data to support treatment of these subsets, rather than known lack of efficacy or toxicities (Table 2) [27]. External beam radiation therapy (EBRT) is the most common technique utilized for APBI (EB APBI) in the NSABP/RTOG trial [28]. Compared to other APBI techniques, its advantages include its non-invasive nature, excellent dose homogeneity, availability and ease of use. The first randomized trial comparing WBI and APBI using EBRT was conducted at Christie Hospital (Manchester, UK) between 1982 and 1987 [29]. A total of 708 patients with invasive ductal or lobular carcinoma measuring < 4 cm were included. All patients received lumpectomy without axillary dissection. Microscopic evaluation of the surgical margins was not performed and chemotherapy was not administered. At 8 years, the in-breast recurrence rate was significantly higher in the APBI arm compared to the whole breast irradiation arm (25% vs. 13%, p< 0.0001). In retrospect, the high local recurrence rates were attributed to poor patient selection, outdated RT techniques, inadequate management of the axilla, and lack of systemic therapy and incomplete pathologic examination of margins. With radiation technique and technological advancements, the ability to visualize target cavity and to deliver adequate dose consistently and precisely with external beam therapy have improved. One of the prospective studies with the longest follow-up utilizing modern EB APBI technique was conducted at the William Beaumont Hospital [30]. In
this study, 94 patients with Stage 0-II breast cancer with lesions 3cm, negative margins, and negative nodes were treated with 3D conformal RT to the tumor bed at 3.85 Gy per fraction to a total of 38.5 Gy. At the median follow-up of 4.2 years, the authors reported 1.1% ipsilateral breast tumor recurrence (IBTR), demonstrating with appropriate RT technique and patient selection, EB APBI can achieve adequate local control. In 2015, Livi et al. [31] published the first randomized study using intensity modulated radiation therapy (IMRT) for EB APBI delivery versus whole breast irradiation. A total of 520 patients were randomized (260 to EB APBI and 260 to whole breast irradiation) between 2005 and 2013. At a median follow-up of 5 years, there was no difference in local control (98.5% in both arms) and survival. Patients who received EB APBI had significantly better cosmetic outcomes.
5
Table 2: ASTRO Guidelines for Use of Accelerated Partial Breast Irradiation (APBI) Off-Protocol
Factors Suitable Group: suitable for APBI if all criteria are present
Cautionary Group: any of these criteria should involve concern when considering APBI
Unsuitable Group: unsuitable for APBI outside a clinical trial if any of these criteria are present
Patient Age (yr) BRCA 1/2 Mutation
≥ 60 Not present
50-59 ---
< 50 Present
Pathologic Tumor Size T Stage Margins Grade LVSI ER Status Multicentricity Multifocality Histology Pure DCIS EIC Associated LCIS
≤ 2 cm T1 Negative by ≥2 mm Any Not present Positive Unicentric only Clinical unifocal with total size ≤2 cm Favorable subtypes Not allowed Not allowed Allowed
2.1-3.0 cm T0 or T2 Close (< 2mm) --- Limited/focal Negative --- Clinically unifocal with total size 2.1-3.0 cm Invasive lobular ≤ 3cm ≤ 3 cm ---
3cm T3-4 Positive --- Extensive --- Present In microscopically multifocal >3 cm in total size or if clinically multifocal --- If > 3cm in size If > 3 cm in size ---
Nodal N Stage Nodal Surgery
pN0 (i, i+) SN Bx or ALND
--- ---
pN1, pN2, pN3 None performed
Treatment Neoadjuvant therapy
Not allowed
---
If Used
Abbreviations: ALND = axillary lymph node dissection; BRCA = breast cancer; DCIS= ductal carcinoma in-
situ; EIC= extensive intraductal component; LCIS = lobular carcinoma in-situ; LVSI = lymphovascular
space involvement; SN Bx = sentinel node biopsy.
With the increased utilization of EB APBI, technical advancements are needed to ensure accurate
delivery of targeted RT to the tumor bed. Inaccurate treatment can lead to not only overtreatment of
normal tissues, thus enhancing short-term and long-term toxicities, it can also compromise long-term
oncologic care if the subclinical disease is not adequately addressed. To overcome the issue of the
dynamic tumor bed, ongoing EB APBI studies in general employed a relatively large tumor bed to clinical
target volume margins (Table 3; [32]). Nevertheless, the best strategy in determining the optimal
6
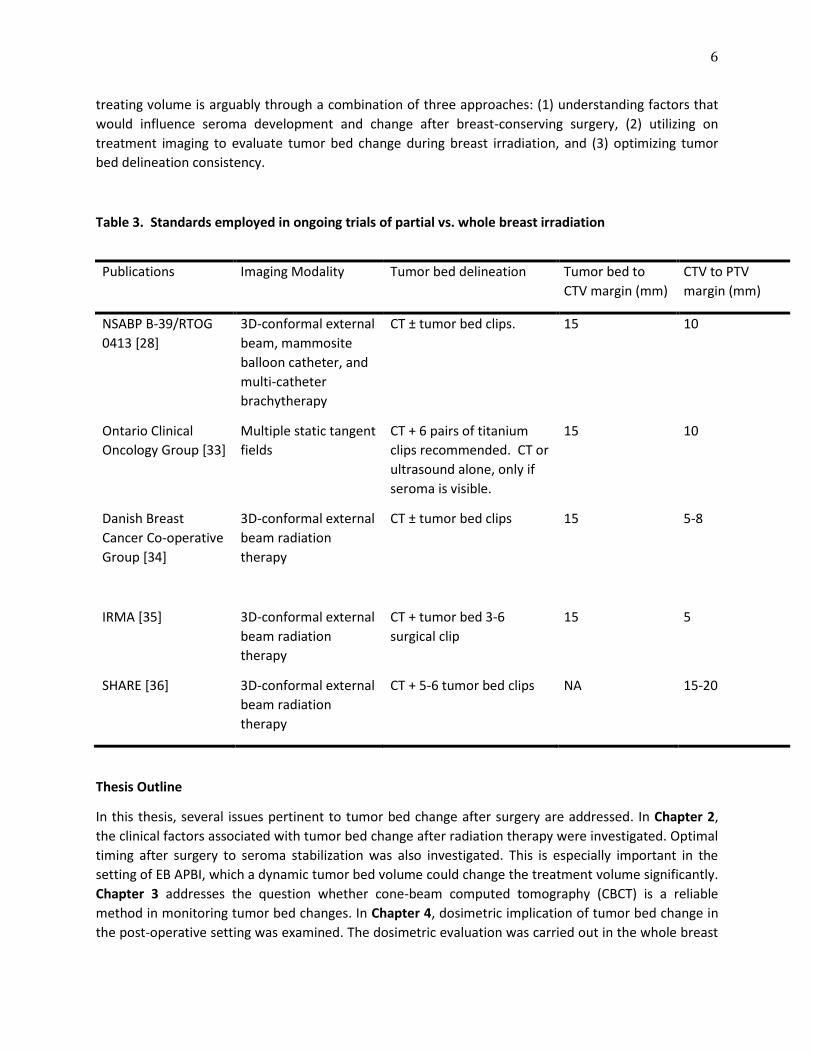
treating volume is arguably through a combination of three approaches: (1) understanding factors that
would influence seroma development and change after breast-conserving surgery, (2) utilizing on
treatment imaging to evaluate tumor bed change during breast irradiation, and (3) optimizing tumor
bed delineation consistency.
Table 3. Standards employed in ongoing trials of partial vs. whole breast irradiation
Publications Imaging Modality Tumor bed delineation Tumor bed to
CTV margin (mm)
CTV to PTV
margin (mm)
NSABP B-39/RTOG
0413 [28]
3D-conformal external
beam, mammosite
balloon catheter, and
multi-catheter
brachytherapy
CT ± tumor bed clips. 15 10
Ontario Clinical
Oncology Group [33]
Multiple static tangent
fields
CT + 6 pairs of titanium
clips recommended. CT or
ultrasound alone, only if
seroma is visible.
15 10
Danish Breast
Cancer Co-operative
Group [34]
3D-conformal external
beam radiation
therapy
CT ± tumor bed clips 15 5-8
IRMA [35]
3D-conformal external
beam radiation
therapy
CT + tumor bed 3-6
surgical clip
15
5
SHARE [36] 3D-conformal external
beam radiation
therapy
CT + 5-6 tumor bed clips NA 15-20
Thesis Outline
In this thesis, several issues pertinent to tumor bed change after surgery are addressed. In Chapter 2,
the clinical factors associated with tumor bed change after radiation therapy were investigated. Optimal
timing after surgery to seroma stabilization was also investigated. This is especially important in the
setting of EB APBI, which a dynamic tumor bed volume could change the treatment volume significantly.
Chapter 3 addresses the question whether cone-beam computed tomography (CBCT) is a reliable
method in monitoring tumor bed changes. In Chapter 4, dosimetric implication of tumor bed change in
the post-operative setting was examined. The dosimetric evaluation was carried out in the whole breast
7
irradiation with boost scenario, which the dynamic tumor bed would impact dose distribution
significantly in the long course RT. Not all institutions are equipped with CBCT for tracking daily setup
stability, which is especially important for breast IGRT. Therefore, IGRT using two dimensional (2D)
kilovoltage x-rays was investigated in Chapter 5. While there is no consistent internal landmark within
the lumpectomy cavity due to potential tumor bed change during RT, a practical 2D IGRT delivery
method was investigated using landmarks outside of the breast (i.e., thoracic spine and boney
structures) that can be applied with treatments. In this chapter, 2D-3D registration of thoracic spinal
lesions treatments were investigated. Finally, Chapter 6 describes a thorough literature review in the
optimal target definition of EB APBI. These investigations made a cohesive argument for the importance
of understanding and monitoring tumor bed change after surgery in the setting of EB APBI, utilizing
anatomical landmarks outside the lumpectomy cavity for IGRT delivery, and a strong recommendation in
better defining the target volume for future studies.
8
References 1. Siegel R, Naishadham D, Jemal A. Cancer statistics, 2013. CA Cancer J Clin 2013; 63: 11-30. 2. Siegel R, Naishadham D, Jemal A. Cancer statistics, 2012. CA Cancer J Clin 2012; 62: 10-29. 3. Marshall SF, Clarke CA, Deapen D et al. Recent breast cancer incidence trends according to hormone therapy use: the California Teachers Study cohort. Breast Cancer Res 2010; 12: R4. 4. Chlebowski RT, Kuller LH, Prentice RL et al. Breast cancer after use of estrogen plus progestin in postmenopausal women. N Engl J Med 2009; 360: 573-587. 5. DeSantis C, Siegel R, Bandi P, Jemal A. Breast cancer statistics, 2011. CA Cancer J Clin 2011; 61: 409-418. 6. Nahleh ZA, Srikantiah R, Safa M et al. Male breast cancer in the veterans affairs population: a comparative analysis. Cancer 2007; 109: 1471-1477. 7. Anderson WF, Althuis MD, Brinton LA, Devesa SS. Is male breast cancer similar or different than female breast cancer? Breast Cancer Res Treat 2004; 83: 77-86. 8. Arriagada R, Le MG, Rochard F, Contesso G. Conservative treatment versus mastectomy in early breast cancer: patterns of failure with 15 years of follow-up data. Institut Gustave-Roussy Breast Cancer Group. J Clin Oncol. 1996; 14: 1558-1564. 9. Blichert-Toft M, Rose C, Andersen JA et al. Danish randomized trial comparing breast conservation therapy with mastectomy: six years of life-table analysis. Danish Breast Cancer Cooperative Group. J Natl Cancer Inst Monogr. 1992; 19-25. 10. Blichert-Toft M, Nielsen M, During M et al. Long-term results of breast conserving surgery vs. mastectomy for early stage invasive breast cancer: 20-year follow-up of the Danish randomized DBCG-82TM protocol. Acta Oncol. 2008; 47: 672-681. 11. Fisher B, Anderson S, Bryant J et al. Twenty-year follow-up of a randomized trial comparing total mastectomy, lumpectomy, and lumpectomy plus irradiation for the treatment of invasive breast cancer. N Engl J Med. 2002; 347: 1233-1241. 12. Poggi MM, Danforth DN, Sciuto LC et al. Eighteen-year results in the treatment of early breast carcinoma with mastectomy versus breast conservation therapy: the National Cancer Institute Randomized Trial. Cancer. 2003; 98: 697-702. 13. Van Dongen JA, Voogd AC, Fentiman IS et al. Long-term results of a randomized trial comparing breast-conserving therapy with mastectomy: European Organization for Research and Treatment of Cancer 10801 trial. J Natl Cancer Inst. 2000; 92: 1143-1150. 14. Veronesi U, Cascinelli N, Mariani L et al. Twenty-year follow-up of a randomized study comparing breast-conserving surgery with radical mastectomy for early breast cancer. N Engl J Med. 2002; 347: 1227-1232. 15. Litiere S, Werutsky G, Fentiman IS et al. Breast conserving therapy versus mastectomy for stage I-II breast cancer: 20 year follow-up of the EORTC 10801 phase 3 randomised trial. Lancet Oncol 2012; 13: 412-419. 16. Clark RM, Whelan T, Levine M et al. Randomized clinical trial of breast irradiation following lumpectomy and axillary dissection for node-negative breast cancer: an update. Ontario Clinical Oncology Group. J Natl Cancer Inst 1996; 88: 1659-1664. 17. Liljegren G, Holmberg L, Adami HO et al. Sector Resection with or without Postoperative Radiotherapy for Stage-I Breast-Cancer - 5-Year Results of a Randomized Trial. Journal of the National Cancer Institute 1994; 86: 717-722. 18. Forrest AP, Stewart HJ, Everington D et al. Randomised controlled trial of conservation therapy for breast cancer: 6-year analysis of the Scottish trial. Scottish Cancer Trials Breast Group. Lancet 1996; 348: 708-713.
9
19. Veronesi U, Marubini E, Mariani L et al. Radiotherapy after breast-conserving surgery in small breast carcinoma: long-term results of a randomized trial. Ann Oncol 2001; 12: 997-1003. 20. Fisher B, Bryant J, Dignam JJ et al. Tamoxifen, radiation therapy, or both for prevention of ipsilateral breast tumor recurrence after lumpectomy in women with invasive breast cancers of one centimeter or less. Journal of Clinical Oncology 2002; 20: 4141-4149. 21. Early Breast Cancer Trialists' Collaborative G, Darby S, McGale P et al. Effect of radiotherapy after breast-conserving surgery on 10-year recurrence and 15-year breast cancer death: meta-analysis of individual patient data for 10,801 women in 17 randomised trials. Lancet 2011; 378: 1707-1716. 22. Liljegren G, Holmberg L, Bergh J et al. 10-Year results after sector resection with or without postoperative radiotherapy for stage I breast cancer: a randomized trial. J Clin Oncol. 1999; 17: 2326-2333. 23. Veronesi U, Marubini E, Mariani L et al. Radiotherapy after breast-conserving surgery in small breast carcinoma: long-term results of a randomized trial. Ann Oncol. 2001; 12: 997-1003. 24. Fisher B, Jeong JH, Anderson S et al. Twenty-five-year follow-up of a randomized trial comparing radical mastectomy, total mastectomy, and total mastectomy followed by irradiation. N Engl J Med. 2002; 347: 567-575. 25. Holland R, Veling SH, Mravunac M, Hendriks JH. Histologic multifocality of Tis, T1-2 breast carcinomas. Implications for clinical trials of breast-conserving surgery. Cancer. 1985; 56: 979-990. 26. Yang TJ, Ho AY. Radiation therapy in the management of breast cancer. Surg Clin North Am 2013; 93: 455-471. 27. Smith BD, Bentzen SM, Correa CR et al. Fractionation for whole breast irradiation: an American Society for Radiation Oncology (ASTRO) evidence-based guideline. Int 81: 59-68. Epub 2010 Jul 2016. 28. NSABP B-39/RTOG 0413 Phase III Randomized Study of Adjuvant Whole-Breast Versus Partial-Breast Irradiation in Women with Ductal Carcinoma In Situ or Stage I or II Breast Cancer. 2005. 29. Magee B, Swindell R, Harris M, Banerjee SS. Prognostic factors for breast recurrence after conservative breast surgery and radiotherapy: results from a randomised trial. Radiother Oncol 1996; 39: 223-227. 30. Chen PY, Wallace M, Mitchell C et al. Four-year efficacy, cosmesis, and toxicity using three-dimensional conformal external beam radiation therapy to deliver accelerated partial breast irradiation. Int J Radiat Oncol Biol Phys 76: 991-997. 31. Livi L, Meattini I, Marrazzo L et al. Accelerated partial breast irradiation using intensity-modulated radiotherapy versus whole breast irradiation: 5-year survival analysis of a phase 3 randomised controlled trial. Eur J Cancer 2015; 51: 451-463. 32. Yang TJ, Tao R, Elkhuizen PH et al. Tumor bed delineation for external beam accelerated partial breast irradiation: a systematic review. Radiother Oncol 2013; 108: 181-189. 33. RAPID: randomized trial of accelerated partial breast irradiation. http://clinicaltrials.gov/ct2/show/study/NCT00282035 34. Partial breast versus whole breast irradiation in elderly women operated on for early breast cancer. http://clinicaltrials.gov/ct2/show/NCT00892814 35. IRMA: breast cancer with low risk of local recurrence: partial and accelerated radiation with three-dimentional conformal radiotherapy vs. standard radiotherapy after conserving surgery. http://groups.eortc.be/radio/res/irma/synopsis_trial_irma1.pdf 36. Standard or hypofractionated radiotherapy versus accelerated partial breast irradiation for breast cancer (SHARE). http://clinicaltrials.gov/ct2/show/study/NCT01247233 37. Poortsman PM, Collette L, Bartelink H et al. The addition of a boost dose on the primary tumour bed after lumpectomy in breast conserving treatment for breast cancer. Cancer Radiother 2008; 12:565-70.
10
Chapter 2
CLINICAL FACTORS ASSOCIATED WITH SEROMA VOLUME REDUCTION IN BREAST-CONSERVING
THERAPY FOR EARLY-STAGE BREAST CANCER: A MULTI-INSTITUTIONAL ANALYSIS
T. Jonathan Yang, Paula H. M. Elkhuizen, Danny Minkema, Wilma Heemsbergen, Anke M. van
Mourik, Jorien Cassee, Coen Hurkmans, and Corine van Vliet-Vroegindeweij
International Journal of Radiation Oncology*Biology*Physics 76(5): 1325-32 (2010)
11
Abstract Purpose: To correlate clinical factors with seroma volume and reduction; and to determine whether
cone-beam CT (CBCT) can be used clinically to monitor seroma reduction.
Patients and Methods: This investigation included 102 women from five institutions with stage T1–2
breast cancer treated with breast-conserving therapy. Two CT scans were acquired: the planning CT
(CT1) and a second CT (CT2) during radiotherapy (RT). Seroma was contoured on all scans, and
correlations between seroma characteristics and clinical factors were investigated by univariate and
multivariate analyses. In a substudy, 10 of the 102 patients received multiple CBCT scans during RT.
Seroma were contoured by two observers in the substudy. Fifteen time points at which CT and CBCT
were performed within 2 days were identified. The levels of correlation in seroma contours between
CBCT and CT and between the two observers were examined.
Results: The mean relative seroma reduction from CT1 to CT2 was 54% (p < 0.001). A significant inverse
relation- ship was found between relative seroma reduction per week and number of RT fractions given
by univariate and multivariate analyses (p = 0.01, 0.03). The mean difference in contoured seroma
volumes between CT and CBCT was 12% (3.3 cm3). When assessing the relative difference in seroma
contours between Observer 1 and Observer 2, an interobserver difference of 12% was demonstrated.
Neither discrepancy was clinically significant.
Conclusions: Radiotherapy seems to hinder seroma reduction. Volume discrepancies between CBCT and
CT were minor, with low interobserver variation, indicating that CBCT might be useful in monitoring
seroma reduction.
Introduction
Breast-conserving therapy (BCT) has been found to be the therapeutic equivalent of total mastectomy in
early breast cancer patients through many randomized studies [1–6]. In BCT, the tumor is first removed
with a margin of normal tissue, followed by whole-breast irradiation (WBI). Radiotherapy (RT) has been
proven to be effective in improving local control and long-term survival [7–12]. More recently, an
additional boost to the tumor bed was found to further decrease the local recurrence rate [13, 14].
Because radiation morbidity is directly related to irradiated volume [15, 16], limiting irradiated volume
can be expected to decrease late toxicity [17–20]; therefore, there is great interest in accurately
defining boost target volume. Furthermore, with the recent increase in the number of external beam
partial-breast irradiation studies, it is now of even greater importance to define the tumor bed volume
and volume change precisely over time, because there is no background dose to the whole breast.
The target volume for boost irradiation treatment planning is often identified by the tumor excision
cavity or postoperative seroma on the initial planning CT scan. For the majority of breast cancer patients
who do not receive adjuvant chemotherapy, the planning CT is obtained during postoperative weeks 3–
8. By using a single CT for both WBI and boost treatment planning, it is often assumed that the boost
target volume does not change significantly during RT. However, this assumption has been proven faulty
by many investigators [21–26]. The postsurgical tumor bed volume reduction has been reported to be
36–50% before RT [25, 26], and studies have demonstrated a 22–62% decrease in excision cavity volume
during RT [21–24]. Contrary to suggestions, this decrease cannot be attributed to interobserver
12
differences in seroma volume contouring [21]. These findings indicate that, for patients who receive
simultaneous integrated boost, it is necessary to monitor seroma volume change during RT and adjust
the boost target volume accordingly to avoid unnecessary normal tissue irradiation. For patients who
receive boost treatments after WBI (sequential boost), acquiring a second planning CT before the
initiation of boost treatment can minimize boost treatment volume. However, a postoperative seroma
may require up to 14 weeks to stabilize [25], which could occur after the additional CT scan.
It is reasonable to assume that the seroma volume change from the initial CT scan can influence the
volume of breast tissue to be included within the boost irradiation fields. Understanding the rate of
seroma volume change and factors that can influence seroma reduction is imperative to reduce excess
healthy tissue irradiation. In this context, it would be useful to find an effective method to monitor the
volume change during RT. Although conventional CT scan can be used for volume definition during
treatment planning, a more clinically efficient surrogate, such as cone-beam CT (CBCT), would be
valuable in tracking seroma reduction. Unlike conventional CT scans, CBCT scans can be done frequently
without impeding clinic flow since it is generally performed concurrently with RT.
In this study, we investigated correlations between clinical factors and seroma volume and volume
reduction in our patients. Furthermore, we investigated whether CBCT can be helpful in monitoring
seroma volume change in a substudy evaluating consistency in seroma contouring on CBCT scans.
Patients and Methods
Patient Selection
The study cohort comprised 102 women with early-stage breast cancer who received BCT consisting of
lumpectomy and RT between June 2005 and September 2008. Patients were recruited from five
different medical institutions within The Netherlands: Catharina Hospital, Eindhoven (69 patients); The
Netherlands Cancer Institute - Antoni van Leeuwenhoek Hospital, Amsterdam (12 patients); Medical
Center Haaglanden-Westeinde, Den Haag (7 patients); St. Radboud Hospital, Nijmegen (7 patients); and
University Medical Center Groningen, Groningen (7 patients). Selected patients developed seroma
within breast tissue after surgery. Patients with seroma due to axillary dissection and patients with
other forms of postoperative changes, such as hematoma or postsurgical scar, were excluded from this
study. A chart review for the assessment of clinical data was conducted for each patient and included
the following: age at diagnosis, TNM (tumor, node, metastasis) staging, date of last definitive surgery,
excised breast tissue dimensions, CT and CBCT dates, and the seroma volume of each scan.
Scans
All patients underwent CT as part of the standard planning for RT. The first CT (CT1) was acquired for
initial treatment planning. The second CT (CT2) was performed at a mean interval of 23 days [13–43
days) after CT1 during RT. Of the 102 patients in the study cohort, 10 women received more than 2 CT
scans during their RT course, obtained either by conventional CT or by CBCT equipped on linear
accelerators. All 10 women received a minimum of 7 CBCT scans throughout their treatment (mean, 10
scans; range, 7–11 scans) as part of a patient setup protocol, and 5 of the 10 women received 1 to 2
extra conventional CT scans (in addition to CT1 and CT2) at various time points during their treatment.
13
Seroma Contouring and Analyses
Contouring of seroma on CT scans of all 102 patients was either performed or verified by a trained staff
member. Contouring of seroma on CT and CBCT scans for the 10 patients who underwent both imaging
techniques was performed by two observers to check for interobserver variation. The great majority of
our patients did not have surgical clips placed in the postoperative cavity. In the rare cases of patients
with surgical clips, clips were not used in seroma contouring. All contours were performed by trained
radiation therapists and were checked by a radiation oncologist to ensure that the locations of seroma
were correctly identified by the observers (no changes were made). For each scan, seroma volume was
computed and recorded.
To assess clinical applicability of CBCT in monitoring seroma volume change, consistency in seroma
contouring between CT and CBCT was evaluated. To this end, 15 time points were identified at which CT
and CBCT were performed within 2 days of each other. The absolute value of the difference in seroma
volumes between CT and CBCT and the standard deviation were calculated for each time point for both
observers.
Scope and Statistical Analysis
Statistical significance of seroma reduction time trend during RT was determined by one-sample t-test.
Another endpoint of the study was to determine correlations between seroma volume change and
clinical factors: initial seroma volume, patient age, days between surgery and CT, excised breast tissue
volume, excised breast tissue surface area, maximal dimension of excision, and the number of RT
fractions given between CT1 and CT2 (RT%; RT%= CT2date-FirstRTdate/ CT2date-CT1date; Equation 1).
Patients were divided into three subgroups according to RT%, and the relative seroma reduction per
week between CT1 and CT2 was calculated for each RT% cohort.
All parameters were assessed by univariate linear regression analyses and Pearson’s two-tailed
correlation (r) analyses. The relationship between RT% and seroma shrinkage per week was determined
by means of univariate and multivariate analyses. A significance level of p < 0.05 was used for this study.
Boundary conditions to justify use of t-tests and regression analyses were verified by means of visual
inspection.
Results
Patient Characteristics
Patient characteristics are summarized in Table 1. The mean age for the study cohort was 59 years
(range, 36–80 years). The majority of our patients had breast tumors of T1 stage (75%), followed by T2
stage (15%). Two patients had T0 stage with pathologic staging at the time of surgery. These patients
received neoadjuvant chemotherapy before surgery and radiation treatments. Only 6 patients of our
study cohort received pre-RT chemotherapy; thus the effect of receiving chemotherapy before RT on
seroma volume could not be assessed in our series. The mean total RT dose of our patients was 65 Gy,
and the mean time elapsed between surgery and the start of RT was 34 days. Excised breast tissue
dimensions were extracted from patient charts. Of the 102 patients investigated, 5 patients’ surgical
volumes were not documented. Therefore, they were excluded from the analysis of excised breast

14
tissue and its correlation with seroma volume and seroma volume change. The mean excised tissue
volume of the remaining 97 patients was 151 cm3.
Table 1. Patient characteristics Patients 102 Age (y) at RT initiation 59 (36–80) T stage
T0* 2 Tis 8 T1 77 T2 15
N stage N0 84 N1 18
Pre-RT chemotherapy Yes 6 No 96
Excision cavity volume (cm3) 151 (16–660) Whole-breast irradiation dose (Gy) 51 (50–51) Boost irradiation dose (Gy) 15 (0–20) Time between surgery and CT1 (d) 27 (10–63) Time between CT1 and CT2 (d) 23 (13–43) Abbreviations: CT1 = initial planning CT; CT2 = second CT obtained during a patient’s RT course; RT = radiotherapy. Values are number or mean (range). * Pathologic staging. Patients received chemotherapy before lumpectomy. Change in Seroma Volume with Two CT Data Points
Table 2 details the volume change data of our study cohort. The mean seroma volumes for CT1 and CT2
were 67 cm3 and 29 cm3, respectively, and the mean relative seroma reduction from CT1 to CT2 was
54% (p < 0.001) in an average of 23 days (range, 13–43 days). The starting seroma volume was not a
significant predictor of relative seroma reduction; however, it did correlate significantly and strongly
with absolute seroma reduction (r = -0.90, p < 0.001). This indicates that a larger seroma on CT1 would
result in greater volume reduction when compared with a seroma with a smaller starting volume,
whereas the percentage in seroma shrinkage is similar regardless of the starting volume. The mean
relative seroma reduction per week was 17% (p < 0.001) between CT1 and CT2. It is important to note
that the mean relative seroma reduction per week of the 6 patients who received neoadjuvant
chemotherapy was not significantly different from the mean relative seroma reduction per week of the
96 patients who did not receive neoadjuvant chemotherapy (20% and 17%, respectively, p = 0.4). The
mean relative seroma reductions per week including and excluding the 6 patients who received
neoadjuvant chemotherapy were the same (17%).
15
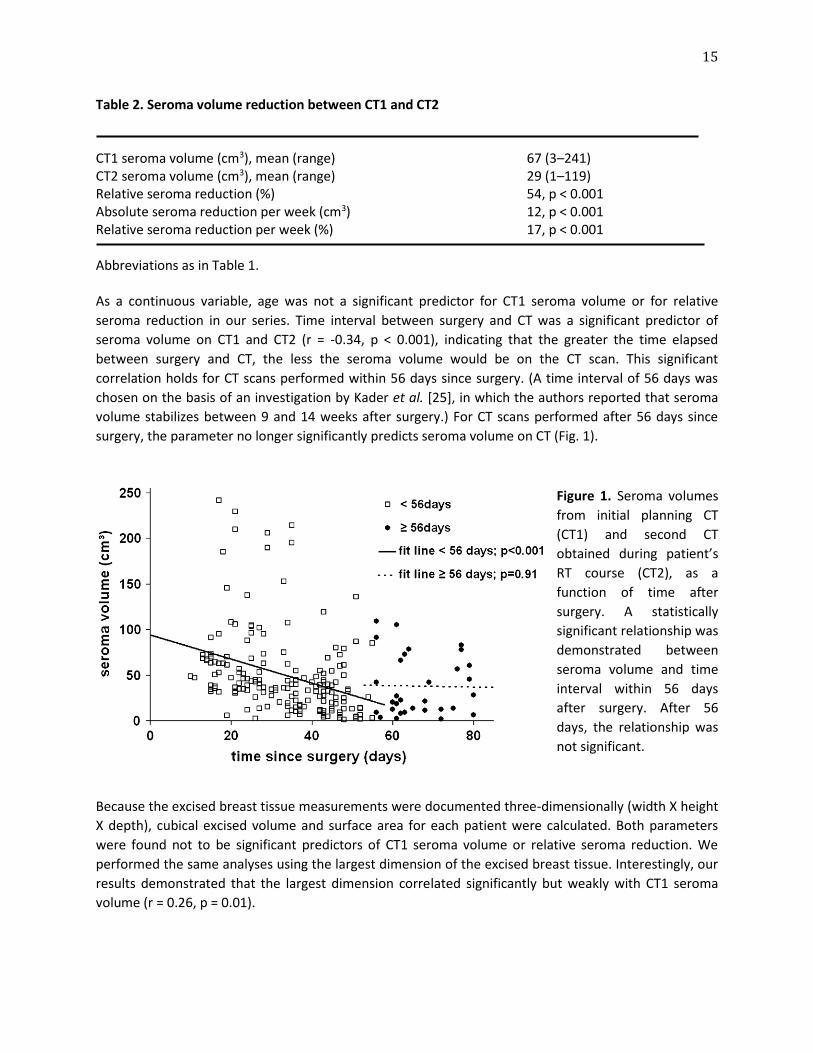
Table 2. Seroma volume reduction between CT1 and CT2 CT1 seroma volume (cm3), mean (range) 67 (3–241) CT2 seroma volume (cm3), mean (range) 29 (1–119) Relative seroma reduction (%) 54, p < 0.001 Absolute seroma reduction per week (cm3) 12, p < 0.001 Relative seroma reduction per week (%) 17, p < 0.001 Abbreviations as in Table 1. As a continuous variable, age was not a significant predictor for CT1 seroma volume or for relative
seroma reduction in our series. Time interval between surgery and CT was a significant predictor of
seroma volume on CT1 and CT2 (r = -0.34, p < 0.001), indicating that the greater the time elapsed
between surgery and CT, the less the seroma volume would be on the CT scan. This significant
correlation holds for CT scans performed within 56 days since surgery. (A time interval of 56 days was
chosen on the basis of an investigation by Kader et al. [25], in which the authors reported that seroma
volume stabilizes between 9 and 14 weeks after surgery.) For CT scans performed after 56 days since
surgery, the parameter no longer significantly predicts seroma volume on CT (Fig. 1).
Figure 1. Seroma volumes
from initial planning CT
(CT1) and second CT
obtained during patient’s
RT course (CT2), as a
function of time after
surgery. A statistically
significant relationship was
demonstrated between
seroma volume and time
interval within 56 days
after surgery. After 56
days, the relationship was
not significant.
Because the excised breast tissue measurements were documented three-dimensionally (width X height
X depth), cubical excised volume and surface area for each patient were calculated. Both parameters
were found not to be significant predictors of CT1 seroma volume or relative seroma reduction. We
performed the same analyses using the largest dimension of the excised breast tissue. Interestingly, our
results demonstrated that the largest dimension correlated significantly but weakly with CT1 seroma
volume (r = 0.26, p = 0.01).
16
Another focus of our investigation was to look at the effect of radiation treatments on seroma
shrinkage. We found a statistically significant inverse relationship between RT% and relative seroma
reduction per week with both univariate and multivariate analyses (p = 0.01 and p = 0.03, respectively),
with days elapsed between surgery and CT2 corrected for. This means that, for patients who received
more fractions of RT between CT1 and CT2, less relative seroma reduction was observed, and the effect
is independent of the postoperative time effect. We separated our patients into three groups according
to RT%. The majority of our patients (63 patients) had 60–70% RT days between CT1 and CT2, and their
mean relative seroma reduction per week was 17%. The mean relative seroma reduction per week was
23% for patients with <60% RT days between CT1 and CT2 (12 patients) and 14% for patients with >70%
RT days (27 patients). The decrease in seroma reduction per week between each group was statistically
significant (p = 0.02). A clear decline in relative seroma reduction per week was demonstrated in
patients who received more RT fractions.
Compare CT and CBCT
In the seroma-contouring substudy with 10 patients, the mean absolute difference in seroma volumes
when comparing CT and CBCT was 3.3 cm3 (standard deviation, 4 cm3), or a relative difference of 12%
(standard deviation, 9%). Of the 15 time points, 12 had <30% differences in seroma volume between CT
and CBCT for both observers, and 8 time points had <20% differences. When comparing the relative
difference in seroma contours of Observer 1 and Observer 2, a mean 12% (standard deviation, 12%)
interobserver difference was demonstrated. All seroma contoured by the two independent observers
were checked by one radiation oncologist in this substudy. We concluded that seroma volumes on CT
and CBCT were in good agreement, and a good level of consistency between the two observers was
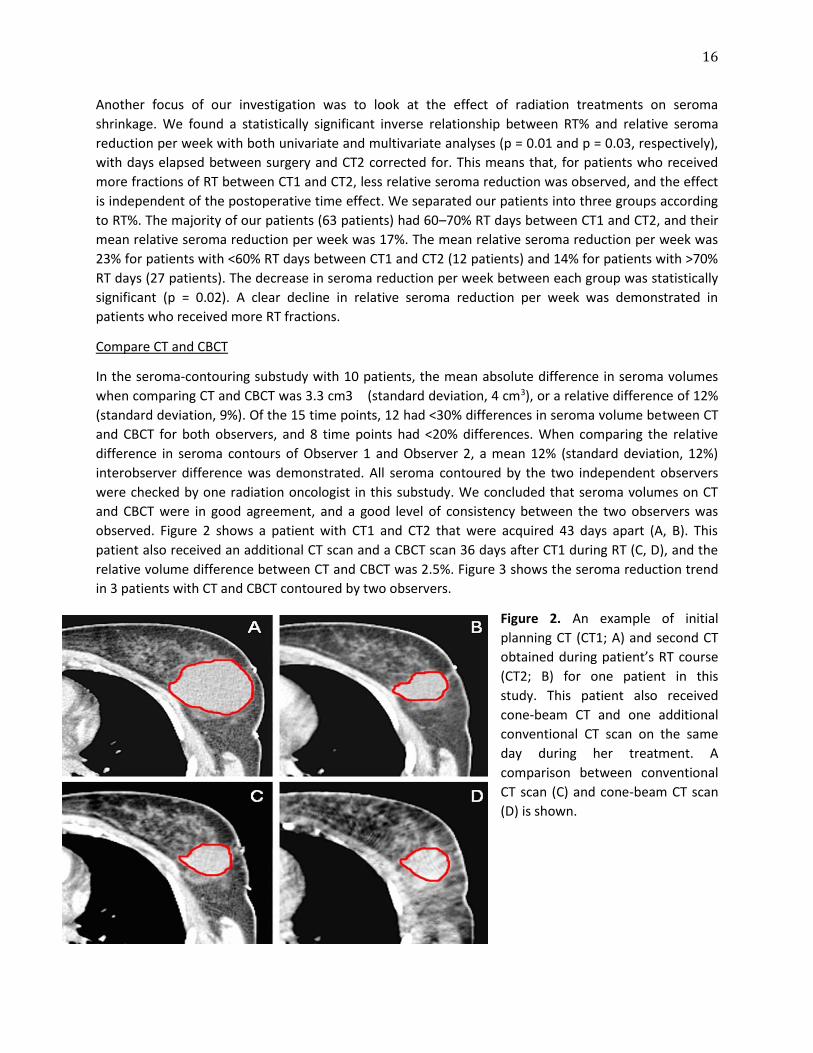
observed. Figure 2 shows a patient with CT1 and CT2 that were acquired 43 days apart (A, B). This
patient also received an additional CT scan and a CBCT scan 36 days after CT1 during RT (C, D), and the
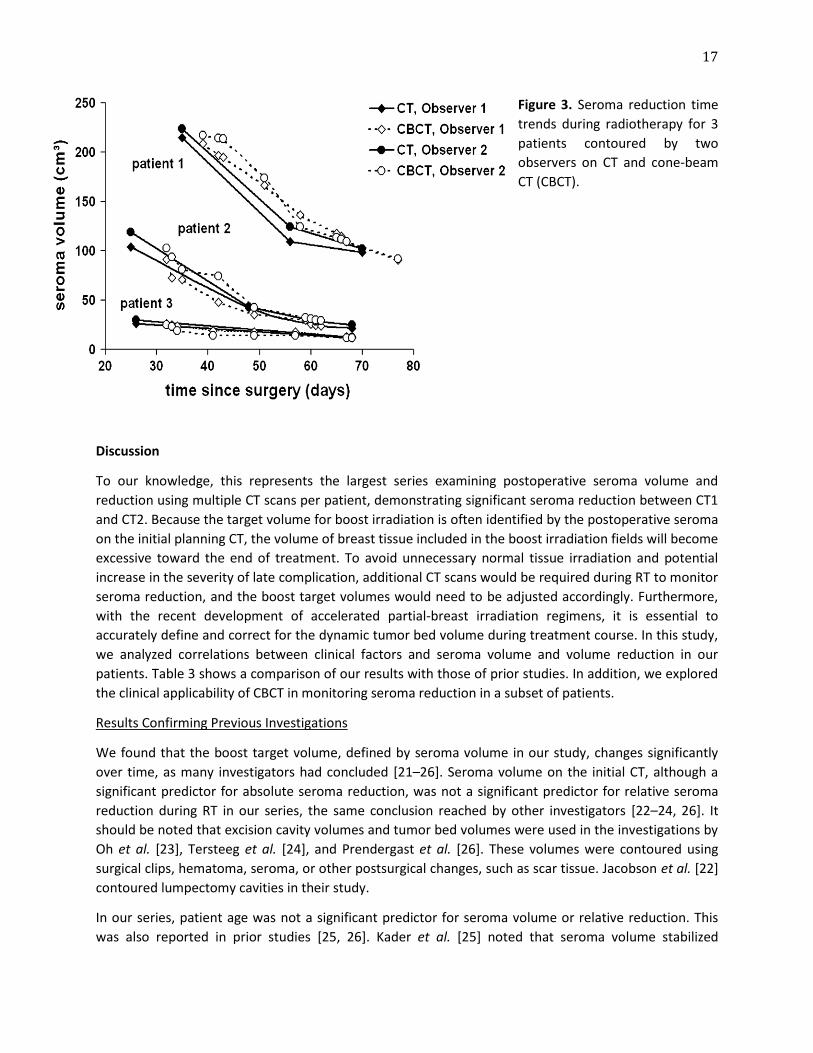
relative volume difference between CT and CBCT was 2.5%. Figure 3 shows the seroma reduction trend
in 3 patients with CT and CBCT contoured by two observers.
Figure 2. An example of initial
planning CT (CT1; A) and second CT
obtained during patient’s RT course
(CT2; B) for one patient in this
study. This patient also received
cone-beam CT and one additional
conventional CT scan on the same
day during her treatment. A
comparison between conventional
CT scan (C) and cone-beam CT scan
(D) is shown.
17
Figure 3. Seroma reduction time
trends during radiotherapy for 3
patients contoured by two
observers on CT and cone-beam
CT (CBCT).
Discussion
To our knowledge, this represents the largest series examining postoperative seroma volume and
reduction using multiple CT scans per patient, demonstrating significant seroma reduction between CT1
and CT2. Because the target volume for boost irradiation is often identified by the postoperative seroma
on the initial planning CT, the volume of breast tissue included in the boost irradiation fields will become
excessive toward the end of treatment. To avoid unnecessary normal tissue irradiation and potential
increase in the severity of late complication, additional CT scans would be required during RT to monitor
seroma reduction, and the boost target volumes would need to be adjusted accordingly. Furthermore,
with the recent development of accelerated partial-breast irradiation regimens, it is essential to
accurately define and correct for the dynamic tumor bed volume during treatment course. In this study,
we analyzed correlations between clinical factors and seroma volume and volume reduction in our
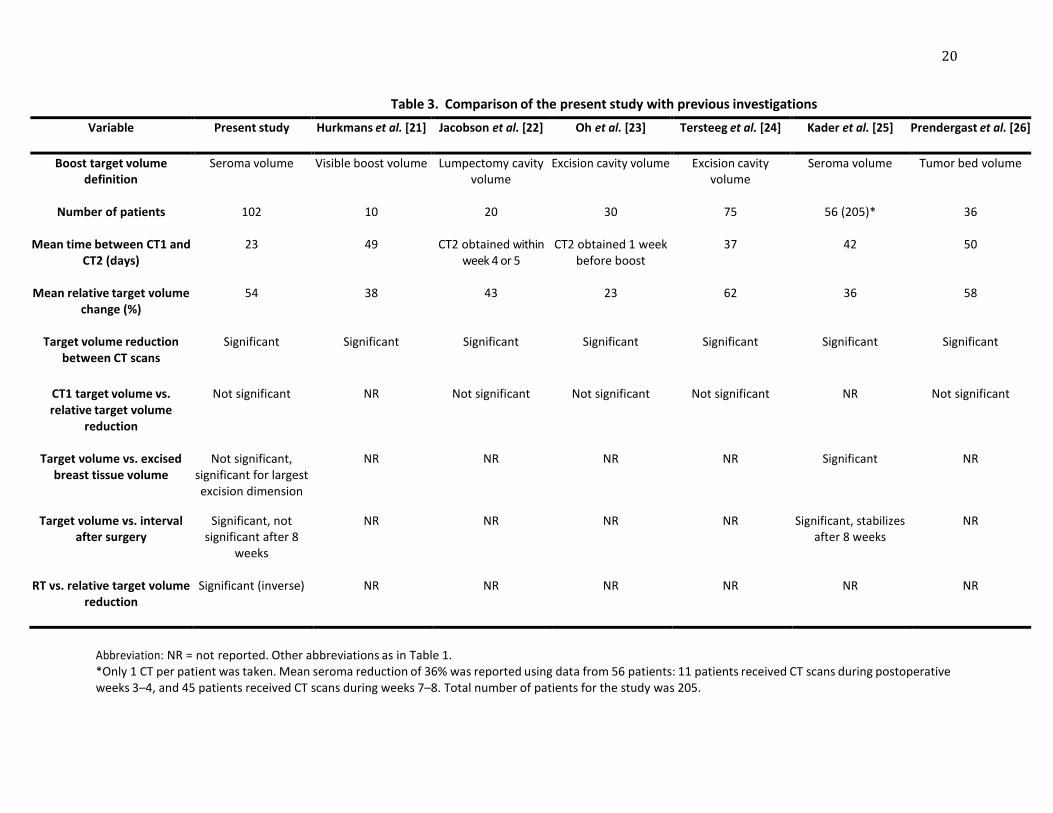
patients. Table 3 shows a comparison of our results with those of prior studies. In addition, we explored
the clinical applicability of CBCT in monitoring seroma reduction in a subset of patients.
Results Confirming Previous Investigations
We found that the boost target volume, defined by seroma volume in our study, changes significantly
over time, as many investigators had concluded [21–26]. Seroma volume on the initial CT, although a
significant predictor for absolute seroma reduction, was not a significant predictor for relative seroma
reduction during RT in our series, the same conclusion reached by other investigators [22–24, 26]. It
should be noted that excision cavity volumes and tumor bed volumes were used in the investigations by
Oh et al. [23], Tersteeg et al. [24], and Prendergast et al. [26]. These volumes were contoured using
surgical clips, hematoma, seroma, or other postsurgical changes, such as scar tissue. Jacobson et al. [22]
contoured lumpectomy cavities in their study.
In our series, patient age was not a significant predictor for seroma volume or relative reduction. This
was also reported in prior studies [25, 26]. Kader et al. [25] noted that seroma volume stabilized
18
between 9 and 14 weeks after surgery, with the largest reduction occurring in postoperative weeks 3–8.
To determine whether this was also true in our cohort, linear regression analyses were done on seroma
volumes before and after 56 days. We found a significant, linear relationship between seroma volume
and time interval after surgery up to and including 8 weeks, whereas there was not a significant
relationship after 56 days. In summary, our results largely concur with those of previous investigations.
However, we did not examine seroma visibility as a potential influence on seroma volume and reduction
in this series, which were addressed by Prendergast et al. [26]. On the basis of the present results, we
believe it may be useful to monitor seroma reduction during RT for at least 8 weeks (56 days) after
surgery to help accurately define the boost target volume.
Additional Results
From the three-dimensional excised breast tissue data, cubic excision volume and surface area were
calculated for our patients, but we did not find significant correlations between these parameters and
the starting seroma volume. Kader et al. [25] reported significant correlation between seroma volume
and excised breast tissue volume. Although we think excision volume and surface area are predictive of
the level of tissue irritation and the subsequent size of seroma, we concluded that cuboids are not
representative of the true shape of the excised breast tissue in our cohort. The largest dimension of the
three-dimensional excision was found to be a significant but weak predictor for the starting seroma
volume. Surgical technique and its influence on seroma volume were not investigated in our series, and
we believe a dedicated study is required to better understand the relationship between different
techniques and levels of tissue damage. Before we have definitive data on this subject, using the largest
dimension of excised breast tissue to roughly predict seroma size, regardless of the shape of excision, is
helpful in the clinical management of a patient.
Regarding the influence of RT on seroma reduction, both univariate and multivariate analyses
demonstrated less seroma shrinkage per week when a larger number of fractions of RT was given
between CT1 and CT2. Patients who received more radiation fractions had slower seroma shrinkage
when compared with patients who were earlier in their radiation treatments, and this effect was
independent of the post-operative time effect. We attribute this to radiation acting as a source of tissue
irritation during treatment, thus hindering seroma shrinkage. Although our multivariate analysis
corrected for the possibility that most patients received their RT during the postoperative period when
seroma began to stabilize, thus resulting in less reduction being observed, there could be other factors
we did not address that can influence the significance of our results. Nevertheless, RT seems to
confound seroma reduction significantly in our series a novel finding that may have clinical implications.
At this time, for patients with very large seroma, postponing their start of RT until large seroma
reduction is observed should be considered if it is clinically agreeable.
In a recent magnetic resonance imaging study, Whipp et al. [27] argued that seroma may not shrink
entirely as a result of simple serous fluid absorption, but instead, new tissues are being laid down. An
indication of the generation of new tissues could be a minimally changed breast volume through a
patient’s RT while the initially defined seroma shrinks. Previous studies had noted such observations but
did not necessarily reach the conclusion of tissue replacement [23]. The biologic process of seroma
shrinkage is an important question that warrants further investigation.
19
CBCT Substudy
In our 10-patient substudy, we found that seroma volume contoured using CBCT scan was in good
agreement with seroma volume contoured using conventional CT scan. Furthermore, we demonstrated
a high level of consistency in seroma contouring between the two observers in this subset of patients.
Assuming that conventional CT is the best available imaging modality for boost target identification, our
results are promising and indicate that CBCT should be considered for clinically detecting boost target
volume reduction, because the mean seroma difference between the two modalities in this
investigation was minor. We understand a volumetric comparison between the two observers is a one-
dimensional assessment of interobserver variation because the position or shape of the contoured
structures may be variable [28]. In this investigation the observers were in agreement with the locations
of seroma contoured because all CT and CBCT delineations were checked and confirmed by one
radiation oncologist. A larger study in our institution being conducted is to confirm these initial results
and to examine variability that can influence an observer’s ability to determine the location and size of
the seroma.
Conclusion
Our investigation demonstrated significant correlations between clinical factors and seroma volume and
volume change. Radiotherapy was found to hinder seroma reduction. Furthermore, a substudy
comparing seroma contouring using CBCT and conventional CT demonstrated minor volume differences
between the two modalities and a good level of consistency between two independent observers. These
results suggest that redefining target volumes and modifying treatment plans are needed during RT to
reduce high-dose volume, and CBCT might be used as a clinical surrogate for conventional CT in
detecting seroma reduction.
20
Table 3. Comparison of the present study with previous investigations
Variable Present study
Hurkmans et al. [21] Jacobson et al. [22]
Oh et al. [23]
Tersteeg et al. [24]
Kader et al. [25] Prendergast et al. [26]
Boost target volume definition
Seroma volume Visible boost volume Lumpectomy cavity volume
Excision cavity volume Excision cavity volume
Seroma volume Tumor bed volume
Number of patients
102 10 20 30 75 56 (205)* 36
Mean time between CT1 and CT2 (days)
23 49 CT2 obtained within week 4 or 5
CT2 obtained 1 week before boost
37 42 50
Mean relative target volume change (%)
54 38 43 23 62 36 58
Target volume reduction between CT scans
Significant Significant Significant Significant Significant Significant Significant
CT1 target volume vs. relative target volume
reduction
Not significant NR Not significant Not significant Not significant NR Not significant
Target volume vs. excised breast tissue volume
Not significant, significant for largest excision dimension
NR NR NR NR Significant NR
Target volume vs. interval after surgery
Significant, not significant after 8
weeks
NR NR NR NR Significant, stabilizes after 8 weeks
NR
RT vs. relative target volume reduction
Significant (inverse) NR NR NR NR NR NR
Abbreviation: NR = not reported. Other abbreviations as in Table 1. *Only 1 CT per patient was taken. Mean seroma reduction of 36% was reported using data from 56 patients: 11 patients received CT scans during postoperative weeks 3–4, and 45 patients received CT scans during weeks 7–8. Total number of patients for the study was 205.
21
References 1. Blichert-Toft M, Rose C, Andersen JA et al. Danish randomized trial comparing breast conservation therapy with mastectomy: Six years of life-table analysis. Danish Breast Cancer Cooperative Group. J Natl Cancer Inst Monogr 1992; (11): 19–25. 2. Fisher B, Anderson S, Bryant J et al. Twenty-year follow-up of a randomized trial comparing total mastectomy, lumpectomy, and lumpectomy plus irradiation for the treatment of invasive breast cancer. N Engl J Med 2002; 347: 1233–1241. 3. Jacobson JA, Danforth DN, Cowan KH et al. Ten-year results of a comparison of conservation with mastectomy in the treatment of stage I and II breast cancer. N Engl J Med 1995; 332: 907–911. 4. Sarrazin D, Le MG, Arriagada R et al. Ten-year results of a randomized trial comparing a conservative treatment to mastectomy in early breast cancer. Radiother Oncol 1989; 14: 177–184. 5. Van Dongen JA, Voogd AC, Fentiman IS et al. Long-term results of a randomized trial comparing breast-conserving therapy with mastectomy: European Organization for Research and Treatment of Cancer 10801 trial. J Natl Cancer Inst 2000; 92: 1143–1150. 6. Veronesi U, Marubini E, Mariani L et al. Radiotherapy after breast-conserving surgery in small breast carcinoma: Long-term results of a randomized trial. Ann Oncol 2001; 12: 997–1003. 7. Fisher B, Dignam J, Wolmark N et al. Lumpectomy and radiation therapy for the treatment of intraductal breast cancer: Findings from National Surgical Adjuvant Breast and Bowel Project B-17. J Clin Oncol 1998; 16: 441–452. 8. Halverson KJ, Perez CA, Kuske RR et al. Isolated local- regional recurrence of breast cancer following mastectomy: Radiotherapeutic management. Int J Radiat Oncol Biol Phys 1990; 19: 851–858. 9. Overgaard M, Jensen MB, Overgaard J et al. Postoperative radiotherapy in high-risk postmenopausal breast-cancer patients given adjuvant tamoxifen: Danish Breast Cancer Cooperative Group DBCG 82c randomised trial. Lancet 1999; 353: 1641–1648. 10. Ragaz J, Jackson SM, Le N et al. Adjuvant radiotherapy and chemotherapy in node-positive premenopausal women with breast cancer. N Engl J Med 1997; 337: 956–962. 11. Solin LJ, Kurtz J, Fourquet A et al. Fifteen-year results of breast-conserving surgery and definitive breast irradiation for the treatment of ductal carcinoma in situ of the breast. J Clin Oncol 1996; 14: 754–763. 12. Clarke M, Collins R, Darby S et al. Effects of radiotherapy and of differences in the extent of surgery for early breast cancer on local recurrence and 15-year survival: An overview of the randomised trials. Lancet 2005; 366: 2087–2106. 13. Bartelink H, Horiot JC, Poortmans P et al. Recurrence rates after treatment of breast cancer with standard radiotherapy with or without additional radiation. N Engl J Med 2001; 345: 1378–1387. 14. Romestaing P, Lehingue Y, Carrie C et al. Role of a 10-Gy boost in the conservative treatment of early breast cancer: Results of a randomized clinical trial in Lyon, France. J Clin Oncol 1997; 15: 963–968. 15. Lyman JT. Complication probability as assessed from dose-volume histograms. Radiat Res Suppl 1985; 8: S13–S19. 16. Borger JH, Hooning MJ, Boersma LJ et al. Cardiotoxic effects of tangential breast irradiation in early breast cancer patients: The role of irradiated heart volume. Int J Radiat Oncol Biol Phys 2007; 69: 1131–1138. 17. Owen JR, Ashton A, Bliss JM et al. Effect of radiotherapy fraction size on tumour control in patients with early-stage breast cancer after local tumour excision: Long-term results of a randomised trial. Lancet Oncol 2006; 7: 467–471. 18. Whelan T, MacKenzie R, Julian J et al. Randomized trial of breast irradiation schedules after lumpectomy for women with lymph node-negative breast cancer. J Natl Cancer Inst 2002; 94: 1143–1150.
22
19. Kuske RR, Winter K, Arthur DW et al. Phase II trial of brachytherapy alone after lumpectomy for select breast cancer: Toxicity analysis of RTOG 95-17. Int J Radiat Oncol Biol Phys 2006; 65: 45–51. 20. Johansson S, Svensson H, Denekamp J. Timescale of evolution of late radiation injury after postoperative radiotherapy of breast cancer patients. Int J Radiat Oncol Biol Phys 2000; 48: 745–750. 21. Hurkmans C, Admiraal M, van der Sangen M et al. Significance of breast boost volume changes during radiotherapy in relation to current clinical interobserver variations. Radiother Oncol 2009; 90: 60–65. 22. Jacobson G, Betts V, Smith B. Change in volume of lumpectomy cavity during external-beam irradiation of the intact breast. Int J Radiat Oncol Biol Phys 2006; 65: 1161–1164. 23. Oh KS, Kong FM, Griffith KA et al. Planning the breast tumor bed boost: Changes in the excision cavity volume and surgical scar location after breast-conserving surgery and whole-breast irradiation. Int J Radiat Oncol Biol Phys 2006; 66: 680–686. 24. Tersteeg RJ, Roesink JM, Albregts M et al. Changes in excision cavity volume: Prediction of the reduction in absolute volume during breast irradiation. Int J Radiat Oncol Biol Phys 2009; 74: 1181-1185. 25. Kader HA, Truong PT, Pai R et al. When is CT-based postoperative seroma most useful to plan partial breast radiotherapy? Evaluation of clinical factors affecting seroma volume and clarity. Int J Radiat Oncol Biol Phys 2008; 72: 1064–1069. 26. Prendergast B, Indelicato DJ, Grobmyer SR et al. The dynamic tumor bed: Volumetric changes in the lumpectomy cavity during breast-conserving therapy. Int J Radiat Oncol Biol Phys 2009: 74: 695-701 27. Whipp EC, Halliwell M. Magnetic resonance imaging appearances in the postoperative breast: The clinical target volume-tumor and its relationship to the chest wall. Int J Radiat Oncol Biol Phys 2008; 72: 49–57. 28. Landis DM, Luo W, Song J et al. Variability among breast radiation oncologists in delineation of the postsurgical lumpectomy cavity. Int J Radiat Oncol Biol Phys 2007; 67: 1299–1308.
23
Chapter 3
CLINICAL APPLICABILITY OF CONE-BEAM COMPUTED TOMOGRAPHY IN MONITORING SEROMA VOLUME CHANGE DURING BREAST IRRADIATION
T. Jonathan Yang, Danny Minkema, Paula H.M. Elkhuizen, Wilma Heemsbergen, Anke M. van Mourik,
and Corine van Vliet-Vroegindeweij
International Journal of Radiation Oncology*Biology*Physics 78(1): 119-26 (2010)
24
Abstract
Purpose: To determine whether cone-beam CT (CBCT) is effective in monitoring seroma reduction during breast irradiation when compared with conventional CT. Patients and Methods: This study included 19 women with Stage T1-2 breast cancer treated with breast-conserving therapy. Each patient underwent two to four CT and multiple CBCT scans (mean, 8; range, 7–13 scans) at various time intervals during radiotherapy. Seroma were contoured by two observers on all scans and checked by one radiation oncologist. Seroma clarity was determined according to The British Columbia Cancer Agency Seroma Clarity Score scale, and conformity index (CI) of the two observers was evaluated. Correlations in seroma contours and seroma characteristics between CBCT and CT, as well as interobserver variation, were examined. Results: The mean differences in seroma volume between CT and CBCT (3%, p = 0.3) and between the
two observers (6%, p = 0.2) were not statistically significant. Seroma clarity correlated significantly with
CI for both CT and CBCT (p = 0.02 and p = 0.001, respectively), indicating the higher the seroma clarity
score, the greater the CI between the observers. With seroma clarity 3 or higher for CT and CBCT, a high
level of observer concordance was shown (all CI of these scans were >505).
Conclusion: Volume discrepancy between CBCT and CT and between the two observers was not
statistically significant. Seroma clarity influenced observers’ ability to contour on CT and CBCT equally.
Therefore, CBCT is a good clinical surrogate for CT in monitoring seroma reduction during breast
radiotherapy, especially for patients with seroma clarity score 3 or higher.
Introduction
Radiotherapy (RT) after breast-conserving surgery has been proven to be effective in improving local
control and long-term survival [1–5], and an additional boost to the tumor bed was found to further
decrease local recurrence [6, 7]. Because radiation morbidity is directly related to irradiated volume [8,
9], limiting the irradiated volume by accurately defining targets can be expected to decrease late toxicity
[10–13]. The target volumes for boost irradiation treatment planning generally include the
postoperative seroma on the initial RT planning CT scan. Using the same CT scan for both whole-breast
irradiation and boost treatment planning, whether given as a sequential or a simultaneous boost,
wrongly assumes that the boost target volume does not change significantly during RT. Prior studies
have indeed demonstrated 36–50% tumor bed volume reduction before RT [14, 15] and 22–62% during
RT [16–20]. These findings suggest that for patients who received boost irradiation planned with the
same CT scan as their whole-breast irradiation, the volume of breast tissue included in the irradiation
fields will become excessive toward the end of treatment. To prevent unnecessary increase of potential
late toxicity it is necessary to monitor seroma reduction during RT, so as to redefine boost target volume
and modify the treatment plan accordingly.
Target delineation for CT-based breast irradiation treatment planning has typically been done with
conventional spiral CT scans. However, because of the multiple scans needed to track seroma volume
change during RT, a more clinical efficient surrogate, such as cone-beam CT (CBCT), is needed. In a
previous feasibility investigation with a limited number of patients, we demonstrated only minor volume
differences between the two modalities when comparing seroma contouring using CBCT and
25
conventional CT [17]. Although promising results were shown, seroma volume, clarity, and their
influence on observer conformity were not included in that investigation. Studies in the past have
concluded that variation in contouring occurs frequently in target definition for breast cancer treatment
planning [21–23]. Understanding seroma attributes and their influence on contouring consistency is
especially important when evaluating the clinical usability of a new imaging modality, in this case,
whether CBCT can reliably replace CT in seroma monitoring, and if so, under what clinical conditions.
In this study, seroma volume, seroma clarity, and their influence on seroma contouring on both CBCT
and CT were assessed. Furthermore, an investigation of interobserver variation with both volumetric
comparison and conformity index comparison was done. Seroma characteristics that were associated
with a high level of interobserver concordance were determined. In sum, the purpose of the study was
to provide an in-depth analysis of the clinical applicability of CBCT in monitoring seroma reduction
during RT in place of conventional CT.
Patients and Methods
Patient Selection
The study cohort comprised 19 women with early-stage breast cancer who received breast-conservation
therapy consisting of lumpectomy and postoperative RT between June 2005 and March 2009. Selected
patients had developed seroma within breast tissue after surgery. A chart review for the assessment of
clinical data was conducted for each patient and included age at diagnosis, TNM staging, date of last
definitive surgery, excised breast tissue volume and surface area, CT and CBCT date, and the seroma
volume of each scan. Excised breast tissue volume and surface area for our patients were calculated
from the three-dimensional data (length x width x height) obtained at the time of surgery.
Scans
All patients underwent an initial planning CT scan as part of the standard planning for RT. Each patient
received a minimum of 7 CBCT scans throughout their treatment (mean, 8; range, 7–13 scans) as part of
a patient setup protocol. In addition to the initial planning CT, one to three extra conventional CT scans
were made at various time points during treatment. Thirty-one time points at which CT and CBCT were
performed within 2 days of each other were identified. The maximum time interval of 2 days was chosen
to ensure little or no seroma volume change in the time between the two imaging procedures. The
planning CT scans were acquired with 4.8-mm slice thinness and used for treatment planning (Pinnacle,
version 7.4f; Philips Radiation Oncology Systems, Milpitas, CA) and as a reference for seroma contouring
on the subsequent CT and CBCT scans. The CBCT scans were acquired using 120 kVp, 16 mA over an
angle of 200o with the Elekta Synergy X-ray CBCT system (Elekta Oncology Systems, Crawley, United
Kingdom).
Seroma Contouring
Contouring of seroma on CT and CBCT scans for the 19 patients was performed by two observers (T.J.Y.
and D.M.) using in-house-developed image contouring and registration software (World-Match). The
observers were able to adjust the image window settings, contrast, and magnification at their discretion.
The seroma contoured on the initial planning CT was used as a reference for seroma contouring by the
26
observers on the subsequent CT and CBCT scans for each patient. No patient in the study cohort had
surgical clips placed in the postoperative cavity. All contours on CT and CBCT were checked by a
radiation oncologist (P.H.M.E.), only to ensure that the locations of seroma were correctly identified by
the observers (no changes were made). For each scan, seroma volume was computed and recorded.
Comparing CT and CBCT
To assess the clinical applicability of CBCT in monitoring seroma volume change, consistency in seroma
contouring between CT and CBCT was evaluated. The absolute and relative difference in seroma
volumes between CT and CBCT and the standard deviation (SD) were calculated for both observers.
Correlations between the relative difference in seroma volume between CT and CBCT, seroma clarity,
and the mean of the seroma volumes contoured by the two observers were tested.
Seroma Clarity
The British Columbia Cancer Agency Seroma Clarity Score scale [24] was used to grade the clarity of
seroma in this study. This scale uses a 6-point scoring system, ranging from 0 (not detectable) to 5
(clearest). Seroma clarity scores for the 62 scans of the 31 time points at which CT and CBCT were
performed within 2 days were determined. Mean seroma clarity scores for CT and CBCT were calculated
for comparison. Seroma clarity scores of the two different imaging modalities were subsequently
correlated with each other, with the volume difference of seroma between CT and CBCT, and with
patient age, seroma volume, and excised breast tissue volume and surface area.
Conformity Index
The level of conformity between the two observers for the 31 time points on both the CT and CBCT
scans (total 62 data) was evaluated using the conformity index (CI). The CI has been used in previous
studies evaluating observer concordance [24]. It is defined as the ratio of overlapping volume and the
encompassing total contoured volume of the two observers. A CI of 1 indicates that the observers
agreed on 100% of the encompassing volume, a CI of 0.50 indicates that the observers agreed on 50% of
the total delineated volume, and a CI of 0 indicates no concordance. The mean CI of CT scans and CBCT
scans and the SDs were calculated for comparison. The CIs of the two imaging modalities at the same
time point were tested for correlation. Correlations between CI and patient age, excised breast tissue
volume and surface area, seroma volume, and seroma clarity score were also tested.
Statistical Analysis
The significance of seroma reduction over time, of the volume difference between CBCT and CT, and
between the two observers was determined using a one-sample t test. Correlation of seroma clarity
score between CT and CBCT was determined using Pearson’s X2 test. Correlations between seroma
clarity score, CI, and clinical parameters were assessed using univariate linear regression analyses and
Pearson’s two-tailed correlation (r) analyses. Correlations between CI, seroma volume, and clarity score
on CT were further examined using multivariate analyses. A significance level of p < 0.05 was used for
this study. Boundary conditions to justify use of t tests and regression analyses were verified by means
of visual inspections.
27
Results
Patient Characteristics
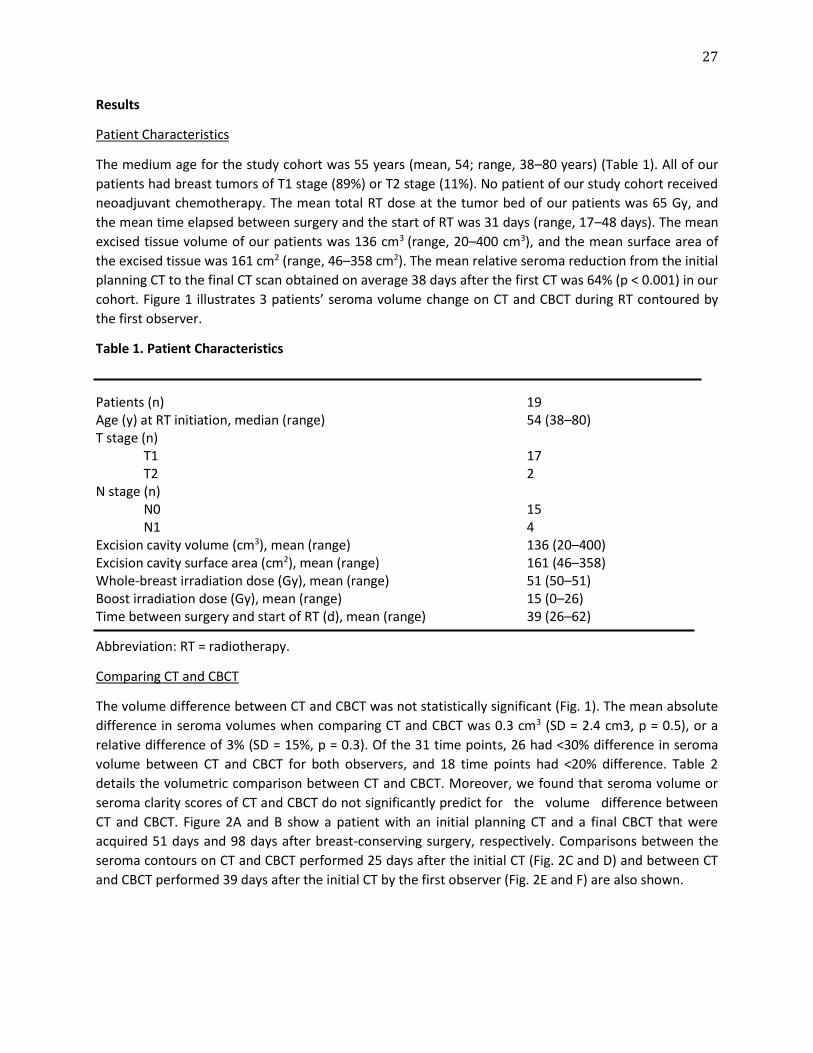
The medium age for the study cohort was 55 years (mean, 54; range, 38–80 years) (Table 1). All of our
patients had breast tumors of T1 stage (89%) or T2 stage (11%). No patient of our study cohort received
neoadjuvant chemotherapy. The mean total RT dose at the tumor bed of our patients was 65 Gy, and
the mean time elapsed between surgery and the start of RT was 31 days (range, 17–48 days). The mean
excised tissue volume of our patients was 136 cm3 (range, 20–400 cm3), and the mean surface area of
the excised tissue was 161 cm2 (range, 46–358 cm2). The mean relative seroma reduction from the initial
planning CT to the final CT scan obtained on average 38 days after the first CT was 64% (p < 0.001) in our
cohort. Figure 1 illustrates 3 patients’ seroma volume change on CT and CBCT during RT contoured by
the first observer.
Table 1. Patient Characteristics Patients (n) 19 Age (y) at RT initiation, median (range) 54 (38–80) T stage (n)
T1 17 T2 2
N stage (n) N0 15 N1 4
Excision cavity volume (cm3), mean (range) 136 (20–400) Excision cavity surface area (cm2), mean (range) 161 (46–358) Whole-breast irradiation dose (Gy), mean (range) 51 (50–51) Boost irradiation dose (Gy), mean (range) 15 (0–26) Time between surgery and start of RT (d), mean (range) 39 (26–62)
Abbreviation: RT = radiotherapy.
Comparing CT and CBCT
The volume difference between CT and CBCT was not statistically significant (Fig. 1). The mean absolute
difference in seroma volumes when comparing CT and CBCT was 0.3 cm3 (SD = 2.4 cm3, p = 0.5), or a
relative difference of 3% (SD = 15%, p = 0.3). Of the 31 time points, 26 had <30% difference in seroma
volume between CT and CBCT for both observers, and 18 time points had <20% difference. Table 2
details the volumetric comparison between CT and CBCT. Moreover, we found that seroma volume or
seroma clarity scores of CT and CBCT do not significantly predict for the volume difference between
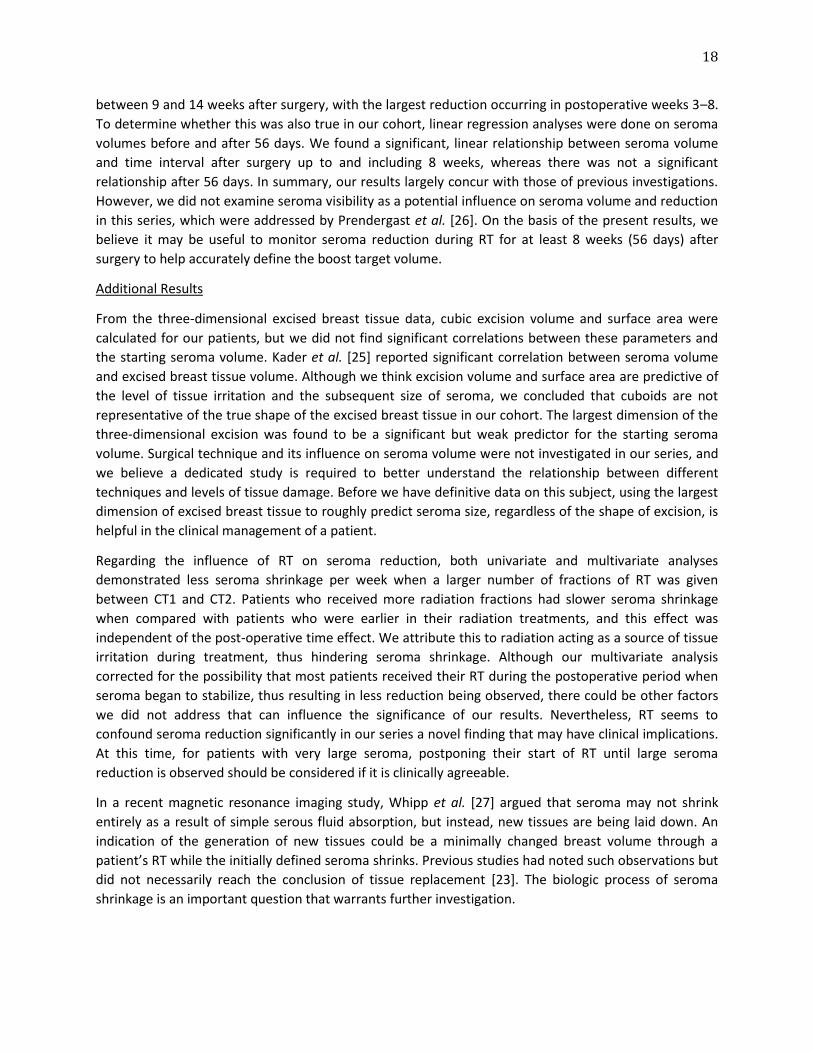
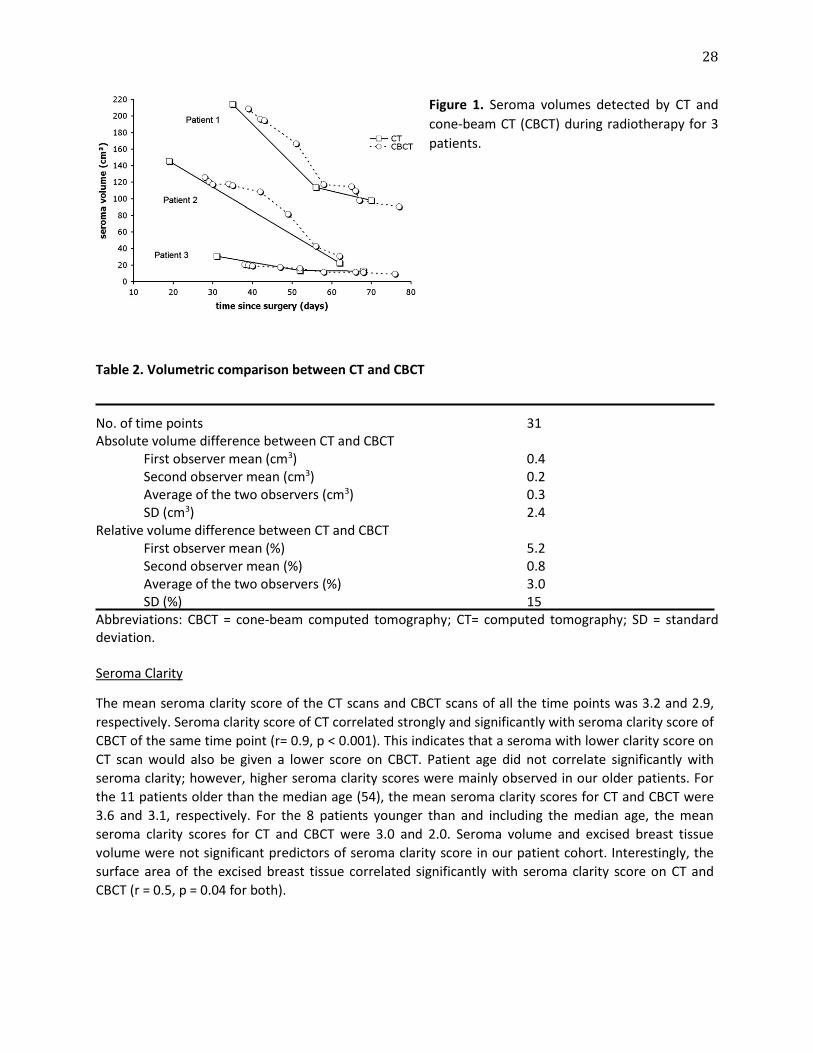
CT and CBCT. Figure 2A and B show a patient with an initial planning CT and a final CBCT that were
acquired 51 days and 98 days after breast-conserving surgery, respectively. Comparisons between the
seroma contours on CT and CBCT performed 25 days after the initial CT (Fig. 2C and D) and between CT
and CBCT performed 39 days after the initial CT by the first observer (Fig. 2E and F) are also shown.
28
Figure 1. Seroma volumes detected by CT and
cone-beam CT (CBCT) during radiotherapy for 3
patients.
Table 2. Volumetric comparison between CT and CBCT No. of time points 31 Absolute volume difference between CT and CBCT
First observer mean (cm3) 0.4 Second observer mean (cm3) 0.2 Average of the two observers (cm3) 0.3 SD (cm3) 2.4
Relative volume difference between CT and CBCT First observer mean (%) 5.2 Second observer mean (%) 0.8 Average of the two observers (%) 3.0 SD (%) 15
Abbreviations: CBCT = cone-beam computed tomography; CT= computed tomography; SD = standard deviation. Seroma Clarity
The mean seroma clarity score of the CT scans and CBCT scans of all the time points was 3.2 and 2.9,
respectively. Seroma clarity score of CT correlated strongly and significantly with seroma clarity score of
CBCT of the same time point (r= 0.9, p < 0.001). This indicates that a seroma with lower clarity score on
CT scan would also be given a lower score on CBCT. Patient age did not correlate significantly with
seroma clarity; however, higher seroma clarity scores were mainly observed in our older patients. For
the 11 patients older than the median age (54), the mean seroma clarity scores for CT and CBCT were
3.6 and 3.1, respectively. For the 8 patients younger than and including the median age, the mean
seroma clarity scores for CT and CBCT were 3.0 and 2.0. Seroma volume and excised breast tissue
volume were not significant predictors of seroma clarity score in our patient cohort. Interestingly, the
surface area of the excised breast tissue correlated significantly with seroma clarity score on CT and
CBCT (r = 0.5, p = 0.04 for both).
29
Interobserver Variation
When comparing the difference in seroma volume between CT and CBCT of Observer 1 with that of
Observer 2, a mean of 0.2 cm3 (SD = 3.4 cm3, p= 0.8) or a relative difference of 6% (SD = 16%, p= 0.2)
interobserver difference in volume was demonstrated. Interobserver variation through volumetric
comparison between the two observers was determined not to be statistically significant. To investigate
the level of concordance in location of seroma contours, the CI of the two observers was determined for
all CT and CBCT scans of the 31 time points. The mean CI on CT scans was 0.73 (range, 0.32–0.88), and
the mean CI on CBCT scans was 0.64 (range, 0.23–0.89). The CI of the two observers on the CT scan
significantly predicts for the CI on the corresponding CBCT scan (r= 0.5, p = 0.004) of the same time
point. No significant relationship was found between CI and patient age or excised breast tissue volume
or surface area.
Figure 2. An example of the initial planning
CT (A) and final cone-beam CT (CBCT) (B) for
1 of our patients. This patient demonstrated
49% seroma reduction in 47 days. She also
received CBCT and two additional
conventional CT scans during her treatment.
A comparison between conventional CT scan
(C) and CBCT scan (D) 25 days after the initial
CT is shown, and the relative volume
difference between CT and CBCT was 4%. A
comparison between conventional CT scan
(E) and CBCT scan (F) 39 days after the initial
CT is also shown, and the relative volume
difference between CT and CBCT was 1%.
30
Seroma Volume, Seroma Clarity, and CI
With univariate analyses, the CI on CT significantly correlated with both seroma clarity score (r = 0.4, p =
0.02) and seroma volume (r= 0.4, p = 0.04) on CT scans. Seroma clarity score of CBCT correlated
significantly with CI on CBCT as well (r = 0.7, p < 0.001). With multivariate analyses, seroma clarity
remained a statistically significant predictor of CI on CT. Figure 3 shows 3 patients with different seroma
clarity scores and both observers’ contours on CT (A, C, E) and CBCT (B, D, F). Seroma clarity score
determined on CT and CBCT and the CI associated with each score are detailed in Table 3.
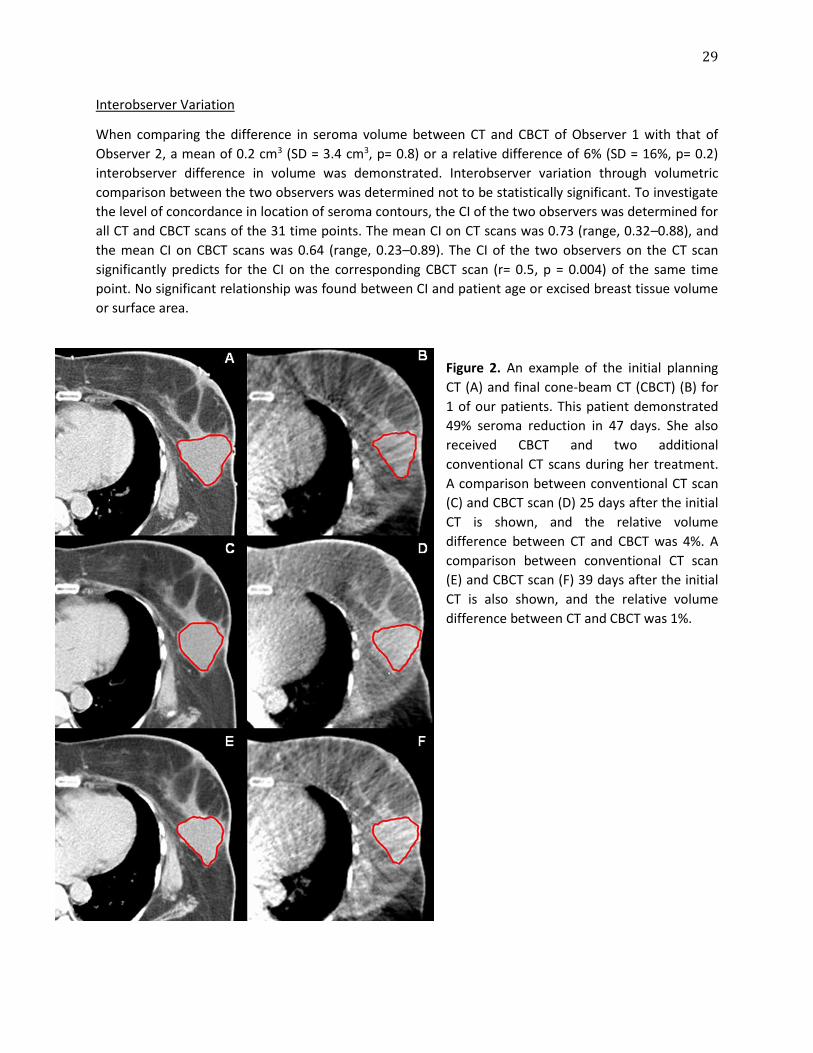
Table 4 also illustrates the relationship between seroma clarity and CI. As the seroma clarity score
increased, slightly higher CI on CT was demonstrated, and the SD decreased notably between seroma
clarity scores 2 and 3 (SD = 0.2 and 0.09, respectively). On the other hand, for CBCT, a large increase in
mean CI was observed between seroma clarity scores 2 and 3. Furthermore, the SD again demonstrated
a large reduction between seroma clarity scores 2 and 3 (SD = 0.2 and 0.09, respectively). With both CT
and CBCT, a seroma clarity score of 3 is required for our observers to demonstrate at least 50%
concordance. These findings are represented graphically in Fig. 4.
Table 3. CI of the two observers on CT and CBCT _____________________________________________________________________________________ Parameter CT seroma clarity 2 CT seroma clarity 3 CT seroma clarity 4 _____________________________________________________________________________________ CBCT seroma clarity 1
Time points (n) 4 0 0
CI of CT 0.64 (0.32–0.84) NA NA CI of CBCT 0.51 (0.37–0.67) NA NA
CBCT seroma clarity 2
Time points (n) 1 6 1 CI of CT 0.79 0.69 (0.58–0.88) 0.81 CI of CBCT 0.76 0.47 (0.23–0.79) 0.70
CBCT seroma clarity 3 Time points (n) CI of CT
0 NA
5 0.72 (0.62–0.79)
6 0.77 (0.68–0.86)
CI of CBCT NA 0.62 (0.50–0.70) 0.66 (0.53–0.81)
CBCT seroma clarity 4
CBCT seroma clarity 4 Time points (n) CI of CT
0 NA
0 NA
8 0.79 (0.73–0.88)
CI of CBCT NA NA 0.79 (0.71–0.89)
Abbreviation: CI = conformity index; CBCT = cone-beam computed tomography; CT= computed tomography; NA = no data available. Values are mean (range) except where noted.
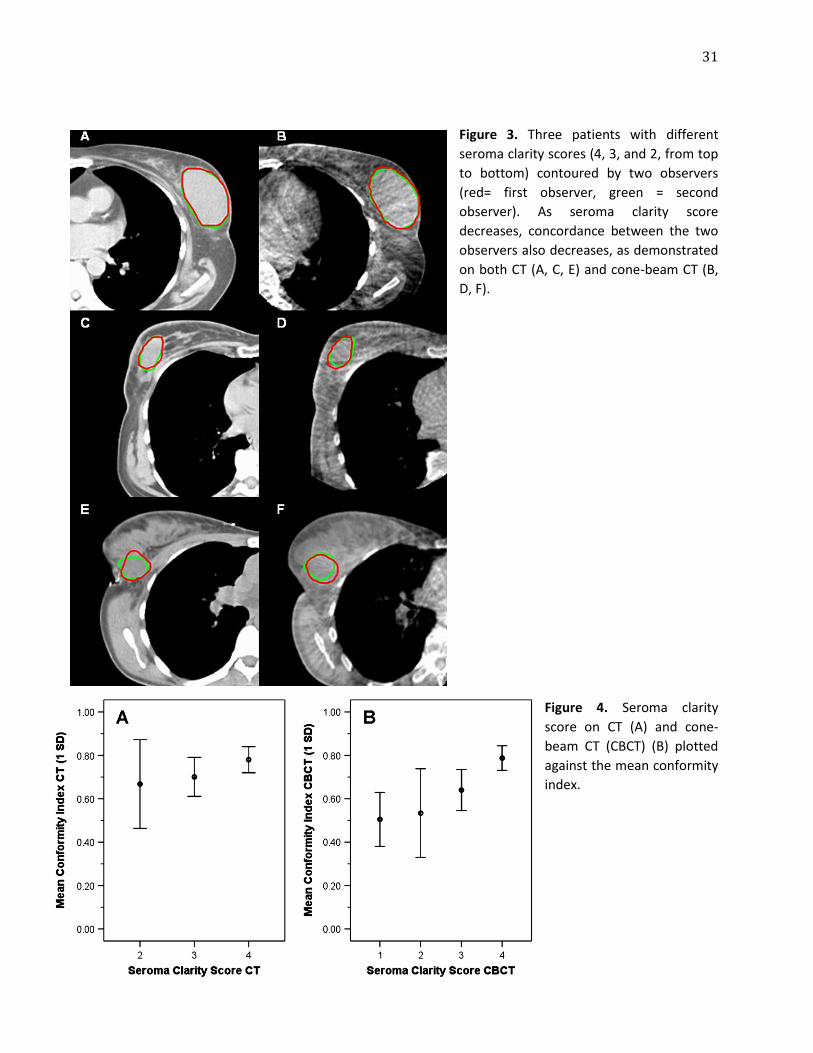
31
Figure 3. Three patients with different
seroma clarity scores (4, 3, and 2, from top
to bottom) contoured by two observers
(red= first observer, green = second
observer). As seroma clarity score
decreases, concordance between the two
observers also decreases, as demonstrated
on both CT (A, C, E) and cone-beam CT (B,
D, F).
Figure 4. Seroma clarity
score on CT (A) and cone-
beam CT (CBCT) (B) plotted
against the mean conformity
index.
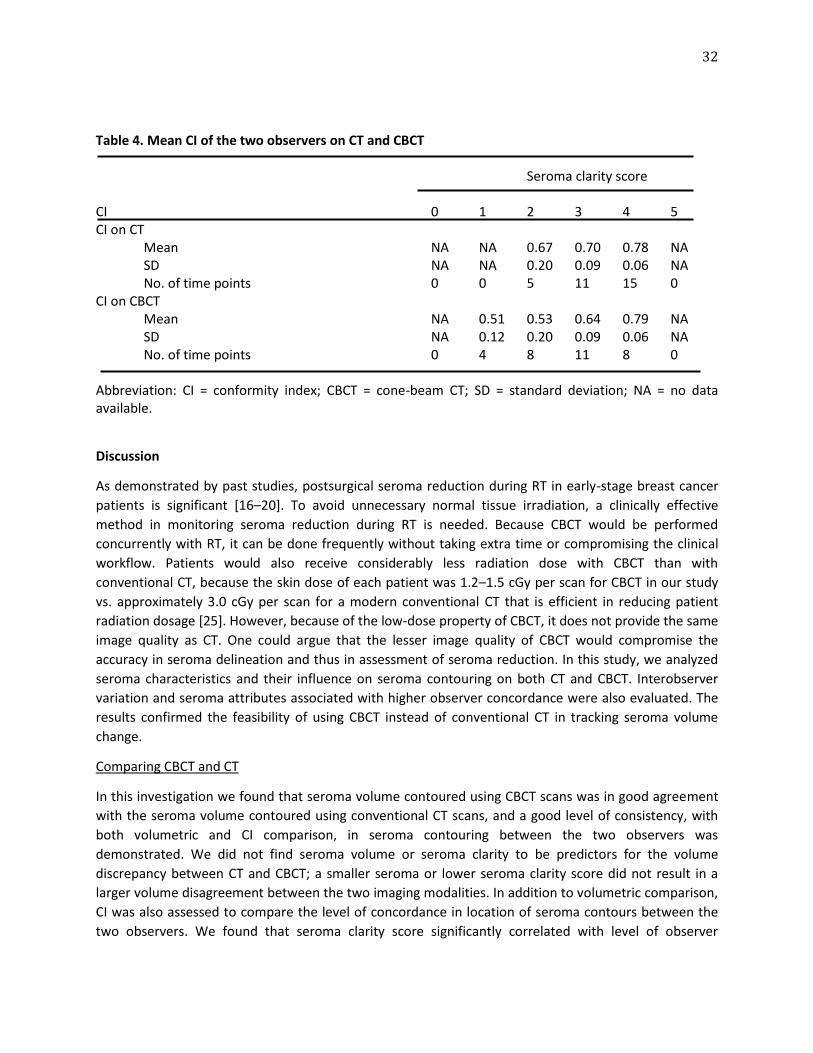
32
Table 4. Mean CI of the two observers on CT and CBCT
Seroma clarity score
CI 0 1 2 3 4 5 CI on CT
Mean NA NA 0.67 0.70 0.78 NA SD NA NA 0.20 0.09 0.06 NA No. of time points 0 0 5 11 15 0
CI on CBCT Mean NA 0.51 0.53 0.64 0.79 NA SD NA 0.12 0.20 0.09 0.06 NA No. of time points 0 4 8 11 8 0
Abbreviation: CI = conformity index; CBCT = cone-beam CT; SD = standard deviation; NA = no data available.
Discussion
As demonstrated by past studies, postsurgical seroma reduction during RT in early-stage breast cancer
patients is significant [16–20]. To avoid unnecessary normal tissue irradiation, a clinically effective
method in monitoring seroma reduction during RT is needed. Because CBCT would be performed
concurrently with RT, it can be done frequently without taking extra time or compromising the clinical
workflow. Patients would also receive considerably less radiation dose with CBCT than with
conventional CT, because the skin dose of each patient was 1.2–1.5 cGy per scan for CBCT in our study
vs. approximately 3.0 cGy per scan for a modern conventional CT that is efficient in reducing patient
radiation dosage [25]. However, because of the low-dose property of CBCT, it does not provide the same
image quality as CT. One could argue that the lesser image quality of CBCT would compromise the
accuracy in seroma delineation and thus in assessment of seroma reduction. In this study, we analyzed
seroma characteristics and their influence on seroma contouring on both CT and CBCT. Interobserver
variation and seroma attributes associated with higher observer concordance were also evaluated. The
results confirmed the feasibility of using CBCT instead of conventional CT in tracking seroma volume
change.
Comparing CBCT and CT
In this investigation we found that seroma volume contoured using CBCT scans was in good agreement
with the seroma volume contoured using conventional CT scans, and a good level of consistency, with
both volumetric and CI comparison, in seroma contouring between the two observers was
demonstrated. We did not find seroma volume or seroma clarity to be predictors for the volume
discrepancy between CT and CBCT; a smaller seroma or lower seroma clarity score did not result in a
larger volume disagreement between the two imaging modalities. In addition to volumetric comparison,
CI was also assessed to compare the level of concordance in location of seroma contours between the
two observers. We found that seroma clarity score significantly correlated with level of observer
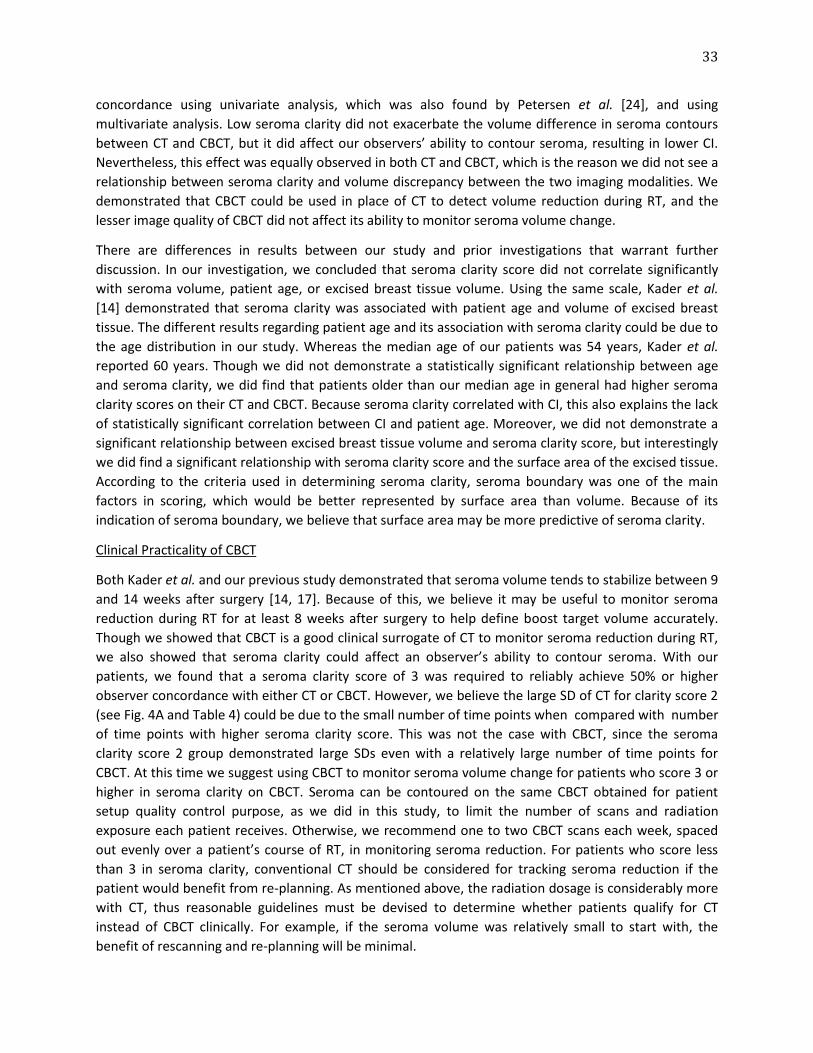
33
concordance using univariate analysis, which was also found by Petersen et al. [24], and using
multivariate analysis. Low seroma clarity did not exacerbate the volume difference in seroma contours
between CT and CBCT, but it did affect our observers’ ability to contour seroma, resulting in lower CI.
Nevertheless, this effect was equally observed in both CT and CBCT, which is the reason we did not see a
relationship between seroma clarity and volume discrepancy between the two imaging modalities. We
demonstrated that CBCT could be used in place of CT to detect volume reduction during RT, and the
lesser image quality of CBCT did not affect its ability to monitor seroma volume change.
There are differences in results between our study and prior investigations that warrant further
discussion. In our investigation, we concluded that seroma clarity score did not correlate significantly
with seroma volume, patient age, or excised breast tissue volume. Using the same scale, Kader et al.
[14] demonstrated that seroma clarity was associated with patient age and volume of excised breast
tissue. The different results regarding patient age and its association with seroma clarity could be due to
the age distribution in our study. Whereas the median age of our patients was 54 years, Kader et al.
reported 60 years. Though we did not demonstrate a statistically significant relationship between age
and seroma clarity, we did find that patients older than our median age in general had higher seroma
clarity scores on their CT and CBCT. Because seroma clarity correlated with CI, this also explains the lack
of statistically significant correlation between CI and patient age. Moreover, we did not demonstrate a
significant relationship between excised breast tissue volume and seroma clarity score, but interestingly
we did find a significant relationship with seroma clarity score and the surface area of the excised tissue.
According to the criteria used in determining seroma clarity, seroma boundary was one of the main
factors in scoring, which would be better represented by surface area than volume. Because of its
indication of seroma boundary, we believe that surface area may be more predictive of seroma clarity.
Clinical Practicality of CBCT
Both Kader et al. and our previous study demonstrated that seroma volume tends to stabilize between 9
and 14 weeks after surgery [14, 17]. Because of this, we believe it may be useful to monitor seroma
reduction during RT for at least 8 weeks after surgery to help define boost target volume accurately.
Though we showed that CBCT is a good clinical surrogate of CT to monitor seroma reduction during RT,
we also showed that seroma clarity could affect an observer’s ability to contour seroma. With our
patients, we found that a seroma clarity score of 3 was required to reliably achieve 50% or higher
observer concordance with either CT or CBCT. However, we believe the large SD of CT for clarity score 2
(see Fig. 4A and Table 4) could be due to the small number of time points when compared with number
of time points with higher seroma clarity score. This was not the case with CBCT, since the seroma
clarity score 2 group demonstrated large SDs even with a relatively large number of time points for
CBCT. At this time we suggest using CBCT to monitor seroma volume change for patients who score 3 or
higher in seroma clarity on CBCT. Seroma can be contoured on the same CBCT obtained for patient
setup quality control purpose, as we did in this study, to limit the number of scans and radiation
exposure each patient receives. Otherwise, we recommend one to two CBCT scans each week, spaced
out evenly over a patient’s course of RT, in monitoring seroma reduction. For patients who score less
than 3 in seroma clarity, conventional CT should be considered for tracking seroma reduction if the
patient would benefit from re-planning. As mentioned above, the radiation dosage is considerably more
with CT, thus reasonable guidelines must be devised to determine whether patients qualify for CT
instead of CBCT clinically. For example, if the seroma volume was relatively small to start with, the
benefit of rescanning and re-planning will be minimal.
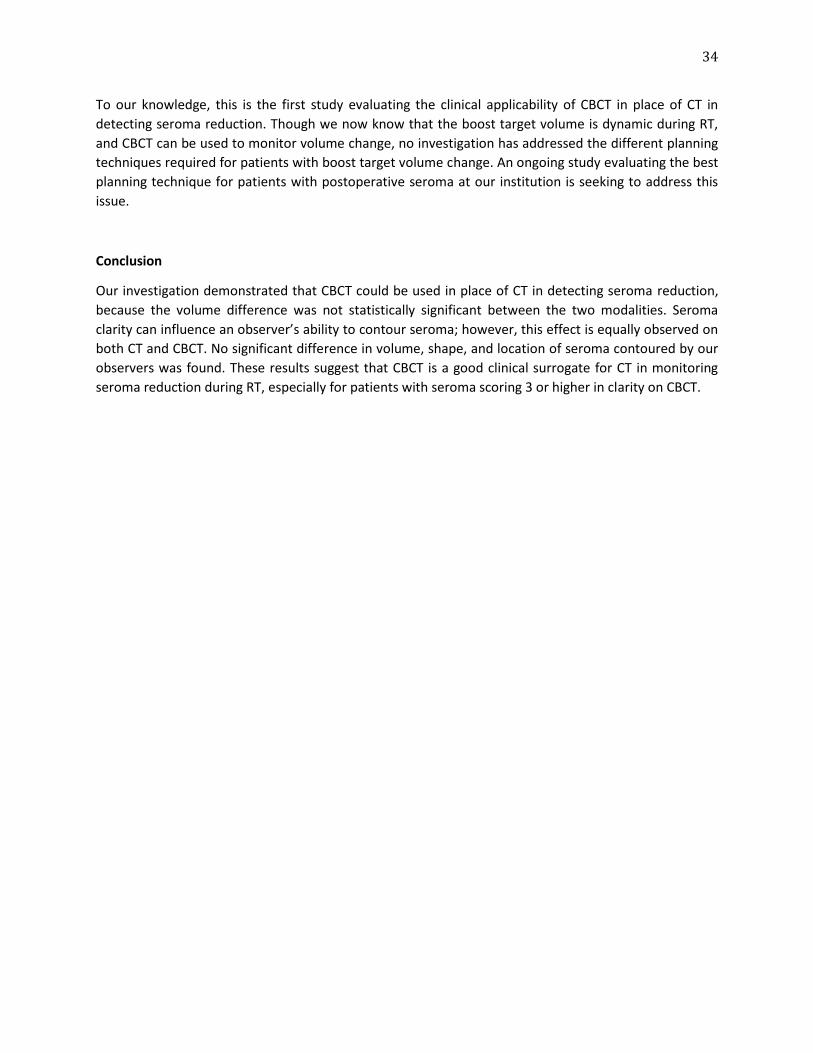
34
To our knowledge, this is the first study evaluating the clinical applicability of CBCT in place of CT in
detecting seroma reduction. Though we now know that the boost target volume is dynamic during RT,
and CBCT can be used to monitor volume change, no investigation has addressed the different planning
techniques required for patients with boost target volume change. An ongoing study evaluating the best
planning technique for patients with postoperative seroma at our institution is seeking to address this
issue.
Conclusion
Our investigation demonstrated that CBCT could be used in place of CT in detecting seroma reduction,
because the volume difference was not statistically significant between the two modalities. Seroma
clarity can influence an observer’s ability to contour seroma; however, this effect is equally observed on
both CT and CBCT. No significant difference in volume, shape, and location of seroma contoured by our
observers was found. These results suggest that CBCT is a good clinical surrogate for CT in monitoring
seroma reduction during RT, especially for patients with seroma scoring 3 or higher in clarity on CBCT.
35
References
1. Clark RM, McCulloch PB, Levine MN et al. Randomized clinical trial to assess the effectiveness of breast irradiation following lumpectomy and axillary dissection for node-negative breast cancer. J Natl Cancer Inst 1992; 84: 683–689. 2. Fisher B, Anderson S, Bryant J et al. Twenty-year follow-up of a randomized trial comparing total mastectomy, lumpectomy, and lumpectomy plus irradiation for the treatment of invasive breast cancer. N Engl J Med 2002; 347: 1233–1241. 3. Overgaard M, Jensen MB, Overgaard J et al. Postoperative radiotherapy in high-risk postmenopausal breast-cancer patients given adjuvant tamoxifen: Danish Breast Cancer Cooperative Group DBCG 82c randomised trial. Lancet 1999; 353: 1641–1648. 4. Ragaz J, Jackson SM, Le N et al. Adjuvant radiotherapy and chemotherapy in node-positive premenopausal women with breast cancer. N Engl J Med 1997; 337: 956–962. 5. Solin LJ, Kurtz J, Fourquet A et al. Fifteen-year results of breast-conserving surgery and definitive breast irradiation for the treatment of ductal carcinoma in situ of the breast. J Clin Oncol 1996; 14: 754–763. 6. Bartelink H, Horiot JC, Poortmans P et al. Recurrence rates after treatment of breast cancer with standard radiotherapy with or without additional radiation. N Engl J Med 2001; 345: 1378–1387. 7. Romestaing P, Lehingue Y, Carrie C et al. Role of a 10-Gy boost in the conservative treatment of early breast cancer: Results of a randomized clinical trial in Lyon, France. J Clin Oncol 1997; 15: 963–968. 8. Borger JH, Hooning MJ, Boersma LJ et al. Cardiotoxic effects of tangential breast irradiation in early breast cancer patients: The role of irradiated heart volume. Int J Radiat Oncol Biol Phys 2007; 69: 1131–1138. 9. Lyman JT. Complication probability as assessed from dose-volume histograms. Radiat Res Suppl 1985; 8:S13–S19. 10. Johansson S, Svensson H, Denekamp J. Timescale of evolution of late radiation injury after postoperative radiotherapy of breast cancer patients. Int J Radiat Oncol Biol Phys 2000; 48: 745–750. 11. Kuske RR, Winter K, Arthur DW et al. Phase II trial of brachytherapy alone after lumpectomy for select breast cancer: Toxicity analysis of RTOG 95-17. Int J Radiat Oncol Biol Phys 2006; 65: 45–51. 12. Owen JR, Ashton A, Bliss JM et al. Effect of radiotherapy fraction size on tumour control in patients with early-stage breast cancer after local tumour excision: Long-term results of a randomised trial. Lancet Oncol 2006; 7: 467–471. 13. Whelan T, MacKenzie R, Julian J et al. Randomized trial of breast irradiation schedules after lumpectomy for women with lymph node-negative breast cancer. J Natl Cancer Inst 2002; 94: 1143–1150. 14. Kader HA, Truong PT, Pai R et al. When is CT-based postoperative seroma most useful to plan partial breast radiotherapy? Evaluation of clinical factors affecting seroma volume and clarity. Int J Radiat Oncol Biol Phys 2008; 72: 1064–1069. 15. Prendergast B, Indelicato DJ, Grobmyer SR et al. The dynamic tumor bed: Volumetric changes in the lumpectomy cavity during breast-conserving therapy. Int J Radiat Oncol Biol Phys 2009; 74: 695–701. 16. Tersteeg RJ, Roesink JM, Albregts M et al. Changes in excision cavity volume: Prediction of the reduction in absolute volume during breast irradiation. Int J Radiat Oncol Biol Phys 2009; 74: 1181–1185. 17. Yang TJ, Elkhuizen PH, Minkema D et al. Clinical factors associated with seroma volume reduction in breast-conserving therapy for early stage breast cancer, a multi-institutional analysis. Int J Radiat Oncol Biol Phys 2010; 76: 1325-32. 18. Hurkmans C, Admiraal M, van der Sangen M, et al. Significance of breast boost volume changes during radiotherapy in relation to current clinical interobserver variations. Radiother Oncol 2009; 90: 60–65.
36
19. Jacobson G, Betts V, Smith B. Change in volume of lumpectomy cavity during external-beam irradiation of the intact breast. Int J Radiat Oncol Biol Phys 2006; 65: 1161–1164. 20. Oh KS, Kong FM, Griffith KA, et al. Planning the breast tumor bed boost: Changes in the excision cavity volume and surgical scar location after breast-conserving surgery and whole-breast irradiation. Int J Radiat Oncol Biol Phys 2006; 66: 680–686. 21. Hurkmans CW, Borger JH, Pieters BR, et al. Variability in target volume delineation on CT scans of the breast. Int J Radiat Oncol Biol Phys 2001; 50: 1366–1372. 22. Struikmans H, Warlam-Rodenhuis C, Stam T, et al. Interobserver variability of clinical target volume delineation of glandular breast tissue and of boost volume in tangential breast irradiation. Radiother Oncol 2005; 76: 293–299. 23. Wong EK, Truong PT, Kader HA, et al. Consistency in seroma contouring for partial breast radiotherapy: Impact of guidelines. Int J Radiat Oncol Biol Phys 2006; 66: 372–376. 24. Petersen RP, Truong PT, Kader HA, et al. Target volume delineation for partial breast radiotherapy planning: Clinical characteristics associated with low interobserver concordance. Int J Radiat Oncol Biol Phys 2007; 69: 41–48. 25. Matsubara K, Takata T, Koshida K, et al. Chest CT performed with 3D and z-axis automatic tube current modulation technique: Breast and effective doses. Acad Radiol 2009; 16: 450–455.

37
Chapter 4
DOSIMETRIC IMPACT OF POST-OPERATIVE SEROMA REDUCTION DURING RADIOTHERAPY AFTER BREAST-CONSERVING SURGERY
Tanja Alderliesten, Suzanne den Hollander, T. Jonathan Yang, Paula H.M. Elkhuizen, Anke M. van Mourik,
Coen Hurkmans, Peter Remeijer, Corine van Vliet-Vroegindeweij
Radiotherapy and Oncology 100(2): 265-70 (2011)
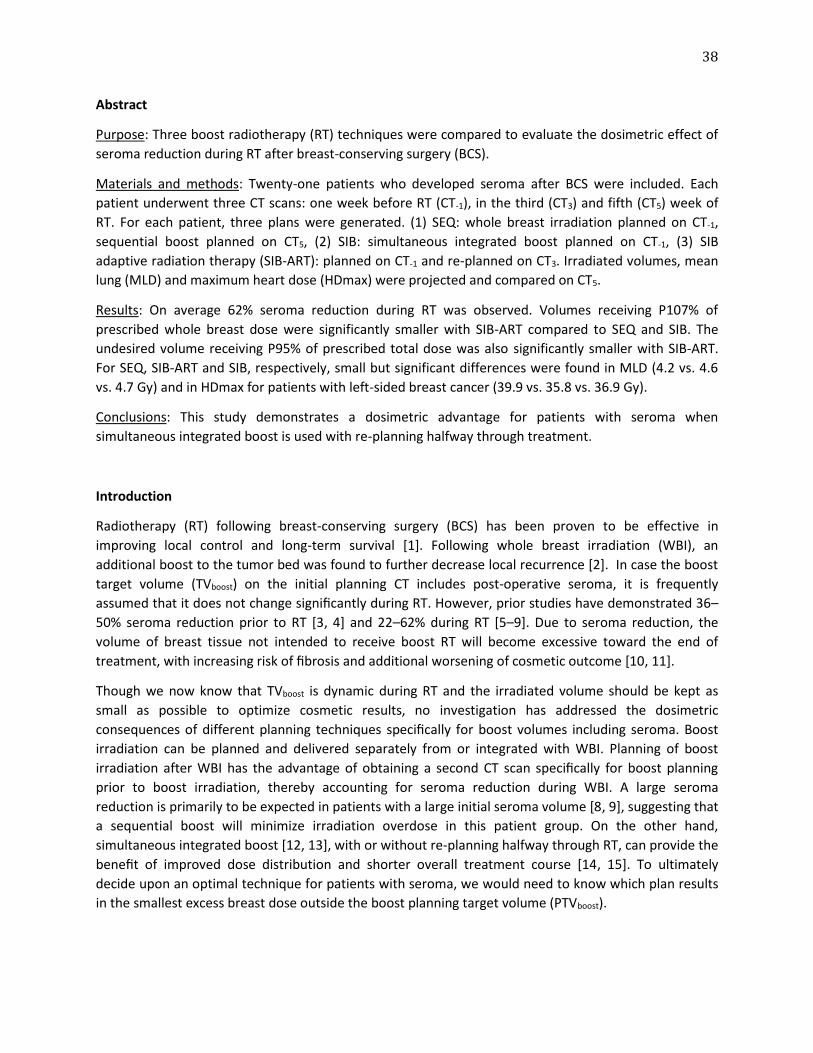
38
Abstract
Purpose: Three boost radiotherapy (RT) techniques were compared to evaluate the dosimetric effect of
seroma reduction during RT after breast-conserving surgery (BCS).
Materials and methods: Twenty-one patients who developed seroma after BCS were included. Each
patient underwent three CT scans: one week before RT (CT-1), in the third (CT3) and fifth (CT5) week of
RT. For each patient, three plans were generated. (1) SEQ: whole breast irradiation planned on CT-1,
sequential boost planned on CT5, (2) SIB: simultaneous integrated boost planned on CT-1, (3) SIB
adaptive radiation therapy (SIB-ART): planned on CT-1 and re-planned on CT3. Irradiated volumes, mean
lung (MLD) and maximum heart dose (HDmax) were projected and compared on CT5.
Results: On average 62% seroma reduction during RT was observed. Volumes receiving P107% of
prescribed whole breast dose were significantly smaller with SIB-ART compared to SEQ and SIB. The
undesired volume receiving P95% of prescribed total dose was also significantly smaller with SIB-ART.
For SEQ, SIB-ART and SIB, respectively, small but significant differences were found in MLD (4.2 vs. 4.6
vs. 4.7 Gy) and in HDmax for patients with left-sided breast cancer (39.9 vs. 35.8 vs. 36.9 Gy).
Conclusions: This study demonstrates a dosimetric advantage for patients with seroma when
simultaneous integrated boost is used with re-planning halfway through treatment.
Introduction
Radiotherapy (RT) following breast-conserving surgery (BCS) has been proven to be effective in
improving local control and long-term survival [1]. Following whole breast irradiation (WBI), an
additional boost to the tumor bed was found to further decrease local recurrence [2]. In case the boost
target volume (TVboost) on the initial planning CT includes post-operative seroma, it is frequently
assumed that it does not change significantly during RT. However, prior studies have demonstrated 36–
50% seroma reduction prior to RT [3, 4] and 22–62% during RT [5–9]. Due to seroma reduction, the
volume of breast tissue not intended to receive boost RT will become excessive toward the end of
treatment, with increasing risk of fibrosis and additional worsening of cosmetic outcome [10, 11].
Though we now know that TVboost is dynamic during RT and the irradiated volume should be kept as
small as possible to optimize cosmetic results, no investigation has addressed the dosimetric
consequences of different planning techniques specifically for boost volumes including seroma. Boost
irradiation can be planned and delivered separately from or integrated with WBI. Planning of boost
irradiation after WBI has the advantage of obtaining a second CT scan specifically for boost planning
prior to boost irradiation, thereby accounting for seroma reduction during WBI. A large seroma
reduction is primarily to be expected in patients with a large initial seroma volume [8, 9], suggesting that
a sequential boost will minimize irradiation overdose in this patient group. On the other hand,
simultaneous integrated boost [12, 13], with or without re-planning halfway through RT, can provide the
benefit of improved dose distribution and shorter overall treatment course [14, 15]. To ultimately
decide upon an optimal technique for patients with seroma, we would need to know which plan results
in the smallest excess breast dose outside the boost planning target volume (PTVboost).
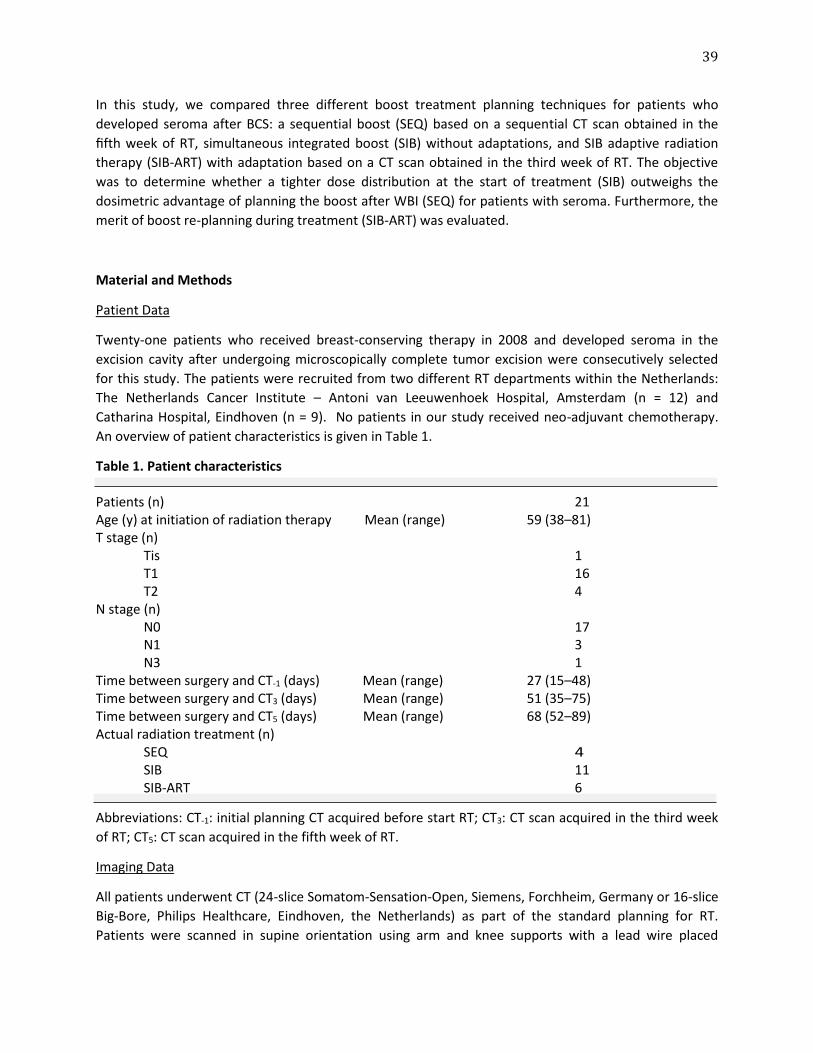
39
In this study, we compared three different boost treatment planning techniques for patients who
developed seroma after BCS: a sequential boost (SEQ) based on a sequential CT scan obtained in the
fifth week of RT, simultaneous integrated boost (SIB) without adaptations, and SIB adaptive radiation
therapy (SIB-ART) with adaptation based on a CT scan obtained in the third week of RT. The objective
was to determine whether a tighter dose distribution at the start of treatment (SIB) outweighs the
dosimetric advantage of planning the boost after WBI (SEQ) for patients with seroma. Furthermore, the
merit of boost re-planning during treatment (SIB-ART) was evaluated.
Material and Methods
Patient Data
Twenty-one patients who received breast-conserving therapy in 2008 and developed seroma in the
excision cavity after undergoing microscopically complete tumor excision were consecutively selected
for this study. The patients were recruited from two different RT departments within the Netherlands:
The Netherlands Cancer Institute – Antoni van Leeuwenhoek Hospital, Amsterdam (n = 12) and
Catharina Hospital, Eindhoven (n = 9). No patients in our study received neo-adjuvant chemotherapy.
An overview of patient characteristics is given in Table 1.
Table 1. Patient characteristics Patients (n) 21 Age (y) at initiation of radiation therapy Mean (range) 59 (38–81) T stage (n)
Tis 1 T1 16 T2 4
N stage (n) N0 17 N1 3 N3 1
Time between surgery and CT-1 (days) Mean (range) 27 (15–48) Time between surgery and CT3 (days) Mean (range) 51 (35–75) Time between surgery and CT5 (days) Mean (range) 68 (52–89) Actual radiation treatment (n)
SEQ 4 SIB 11 SIB-ART 6
Abbreviations: CT-1: initial planning CT acquired before start RT; CT3: CT scan acquired in the third week
of RT; CT5: CT scan acquired in the fifth week of RT.
Imaging Data
All patients underwent CT (24-slice Somatom-Sensation-Open, Siemens, Forchheim, Germany or 16-slice
Big-Bore, Philips Healthcare, Eindhoven, the Netherlands) as part of the standard planning for RT.
Patients were scanned in supine orientation using arm and knee supports with a lead wire placed
40
around the breast as an aid in generating the breast contour. The initial planning CT scan (CT-1) was
acquired one week prior to RT. Two additional CT scans were acquired in the third (CT3) and fifth weeks
(CT5) of RT. CT3 and CT5 were registered to CT-1 using rigid registration (translations only) of bony
anatomy.
Planning Target Volumes and Organs at Risk
Volumes were specifically defined and delineated for this study to avoid differences between
contributing institutions. The lungs were delineated using an automatic contouring tool and visually
verified. The heart was manually delineated. The total breast target volume (TVbreast) was generated
based on the field borders of the radiation field. The volume was restricted to 7 mm inside the field
borders, 7 mm toward the skin, 5 mm toward the lung, and 10 mm margin toward the heart. Finally,
liver, stomach and ribs were removed from the volume. All patients were operated without closure of
the excision cavity, therefore, the post-operative seroma was defined to be the ‘‘tumor bed’’. The tumor
bed was delineated by a trained radiation therapist using Pinnacle 8.1v (research version, Philips
Radiation Oncology Systems, Milpitas, CA). All delineations were checked and approved by a radiation
oncologist. To obtain the boost clinical target volume (CTVboost), the tumor bed was expanded by 10 mm,
subsequently ribs and muscles were excluded. Finally, a PTVboost suitable for inverse optimization was
obtained by an additional 5 mm expansion followed by a correction to exclude air and skin (plus 7 mm
margin).
Boost Delivery Techniques
For each patient, three photon beams treatment plans1 were generated with Pinnacle 8.1v using three
different planning techniques: SEQ, SIB, and SIB-ART. The linear quadratic cell survival model was used
to calculate fraction sizes and total doses in SIB and SIB-ART planning [17]. The resulting SIB and SIB-ART
plans were biologically equivalent to the SEQ plans in the total dose delivered to the target volumes in 2
Gy fractions assuming an a/b-ratio of 10 Gy for the tumor bed (BED10).
SEQ 1. WBI 50.00 Gy (25 x 2.00 Gy) planned on CT-1, 2. Subsequently boost of 16.00 Gy (8 x 2.00 Gy) planned on CT5. SIB
Total boost RT of 64.40 Gy in 28 fractions including: 1. WBI 50.68 Gy (28 x 1.81 Gy) planned on CT-1, 2. Boost 13.72 Gy (28 x 0.49 Gy) also planned on CT-1. SIB-ART
After 15 fractions a new treatment plan is made based on CT3 to take part of the post-operative seroma
reduction into account.
1. In the first 15 fractions boost RT of 34.50 Gy includes: • WBI 27.15 Gy (15 x 1.81 Gy) planned on CT-1, • Boost 7.35 Gy (15 x 0.49 Gy) planned on CT-1.
2. In the final 13 fractions boost RT of 29.90 Gy includes:
41
• WBI 23.53 Gy (13 x 1.81 Gy) planned on CT3, • Boost 6.37 Gy (13 x 0.49 Gy) also planned on CT3.
In terms of total dose, the administered dose in SIB-ART is the same as SIB.
Beam Setup and Plan Optimization
WBI
For all three techniques WBI treatment planning consisted of simultaneous inverse optimization of two
tangential glancing rectangular fields (medial and lateral) combined with two tangential IMRT fields with
identical gantry angles. The rectangular fields were positioned according to the lead wire marking the
outer breast contour. In the direction of the skin a 2 cm margin was used to create glancing rectangular
fields to take into account displacement of the breast due to breathing. Based on digitally reconstructed
radiographs, Pinnacle skin views (projection of the fields on the skin) and the CT data multileaf
collimator shielding was used to protect the heart as much as possible. Optimization was limited to a
maximum of eight segments (≥9 cm2) for the IMRT fields. A minimum of four monitor units were used
per segment. A minimum of 80% of the whole breast dose was given with the two open fields.
Boost Irradiation
One orthogonal and one or two tangential fields (depending on tumor location) were used for the boost. For SEQ, boost fields are IMRT fields and the boost plan was created without taking into account the WBI plan. If the boundary of the PTV was 7 mm from the skin, the multi-leaf collimator segments were positioned around the PTV. If the PTV extended to within 7 mm from the skin, all leafs positioned within 7 mm to the skin surface were opened in the skin direction. For both SIB and SIB-ART, boost fields are conformal and set around the PTVboost with a margin of 6 mm. Dose to boost and breast target volumes were simultaneously optimized. Treatment Planning The setup of the tangential beams was chosen such as to achieve minimal irradiation of the contralateral breast. All plans were inversely optimized with the goal to achieve sufficient coverage of the target volumes and to minimize dose to heart and lungs. Furthermore, in order to minimize the volume with excess dose outside PTVboost, the dose to the whole breast minus PTVboost + 6 mm margin was minimized subject to the constraint that the dose to the whole breast does not drop below the minimal required dose. For all three techniques, at least 97% of TVbreast and 99% of PTVboost should receive at least 95% of the prescribed dose. For all patients, plan optimization was started using a standard set of objectives. Subsequently, patient-specific tuning of the plans was performed without resetting the segments found in the initial optimization to further minimize dose to the heart and lungs.
Analysis of Coverage, Dose Distribution and Normal Tissues
To establish treatment doses (as opposed to planned doses), for all dose distributions, a dose volume histogram (DVH) was calculated for the volume defined by the external contour of the patient, CTVboost
and PTVboost as defined on CT5. Target coverage was determined by evaluating the relative volumes of both CTVboost and PTVboost receiving 95% of the prescribed dose. For the whole patient (including PTVboost), the volume that received ≥107% of the prescribed dose to the whole breast (Vpatient, 107%(breast-
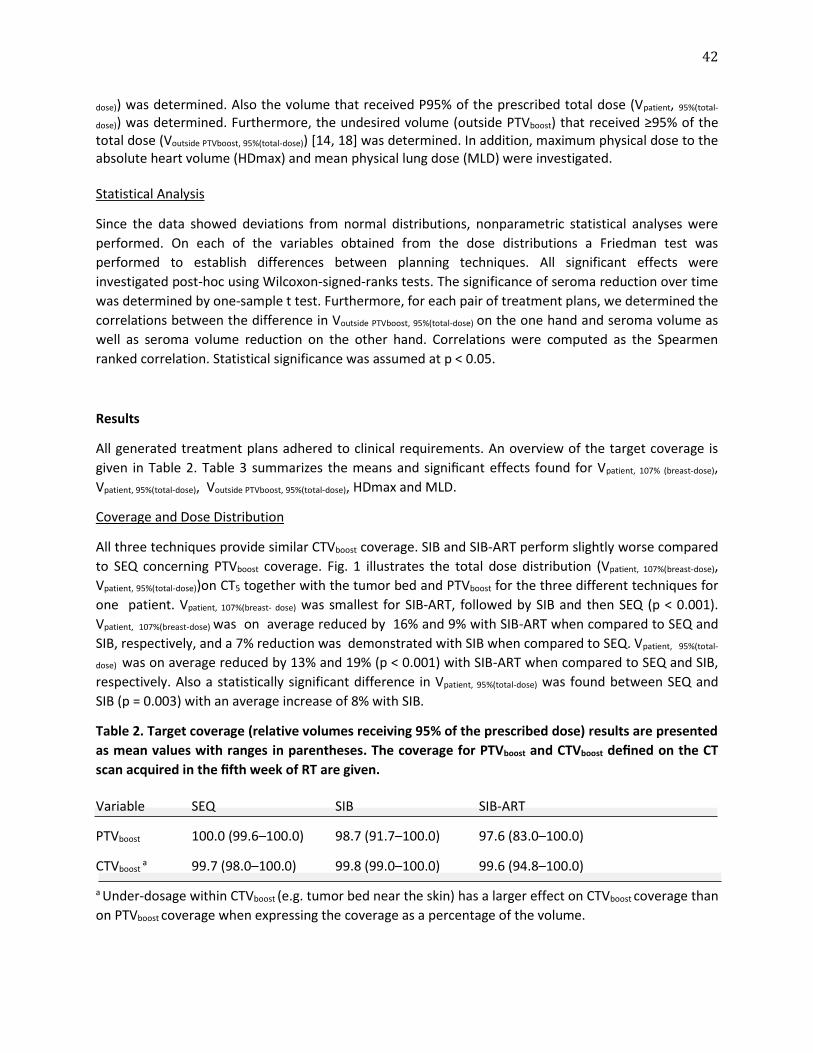
42
dose)) was determined. Also the volume that received P95% of the prescribed total dose (Vpatient, 95%(total-
dose)) was determined. Furthermore, the undesired volume (outside PTVboost) that received ≥95% of the total dose (Voutside PTVboost, 95%(total-dose)) [14, 18] was determined. In addition, maximum physical dose to the absolute heart volume (HDmax) and mean physical lung dose (MLD) were investigated. Statistical Analysis
Since the data showed deviations from normal distributions, nonparametric statistical analyses were
performed. On each of the variables obtained from the dose distributions a Friedman test was
performed to establish differences between planning techniques. All significant effects were
investigated post-hoc using Wilcoxon-signed-ranks tests. The significance of seroma reduction over time
was determined by one-sample t test. Furthermore, for each pair of treatment plans, we determined the
correlations between the difference in Voutside PTVboost, 95%(total-dose) on the one hand and seroma volume as
well as seroma volume reduction on the other hand. Correlations were computed as the Spearmen
ranked correlation. Statistical significance was assumed at p < 0.05.
Results
All generated treatment plans adhered to clinical requirements. An overview of the target coverage is
given in Table 2. Table 3 summarizes the means and significant effects found for Vpatient, 107% (breast-dose),
Vpatient, 95%(total-dose), Voutside PTVboost, 95%(total-dose), HDmax and MLD.
Coverage and Dose Distribution
All three techniques provide similar CTVboost coverage. SIB and SIB-ART perform slightly worse compared
to SEQ concerning PTVboost coverage. Fig. 1 illustrates the total dose distribution (Vpatient, 107%(breast-dose),
Vpatient, 95%(total-dose))on CT5 together with the tumor bed and PTVboost for the three different techniques for
one patient. Vpatient, 107%(breast- dose) was smallest for SIB-ART, followed by SIB and then SEQ (p < 0.001).
Vpatient, 107%(breast-dose) was on average reduced by 16% and 9% with SIB-ART when compared to SEQ and
SIB, respectively, and a 7% reduction was demonstrated with SIB when compared to SEQ. Vpatient, 95%(total-
dose) was on average reduced by 13% and 19% (p < 0.001) with SIB-ART when compared to SEQ and SIB,
respectively. Also a statistically significant difference in Vpatient, 95%(total-dose) was found between SEQ and
SIB (p = 0.003) with an average increase of 8% with SIB.
Table 2. Target coverage (relative volumes receiving 95% of the prescribed dose) results are presented
as mean values with ranges in parentheses. The coverage for PTVboost and CTVboost defined on the CT
scan acquired in the fifth week of RT are given.
Variable SEQ SIB SIB-ART
PTVboost 100.0 (99.6–100.0) 98.7 (91.7–100.0) 97.6 (83.0–100.0)
CTVboost a 99.7 (98.0–100.0) 99.8 (99.0–100.0) 99.6 (94.8–100.0)
a Under-dosage within CTVboost (e.g. tumor bed near the skin) has a larger effect on CTVboost coverage than
on PTVboost coverage when expressing the coverage as a percentage of the volume.
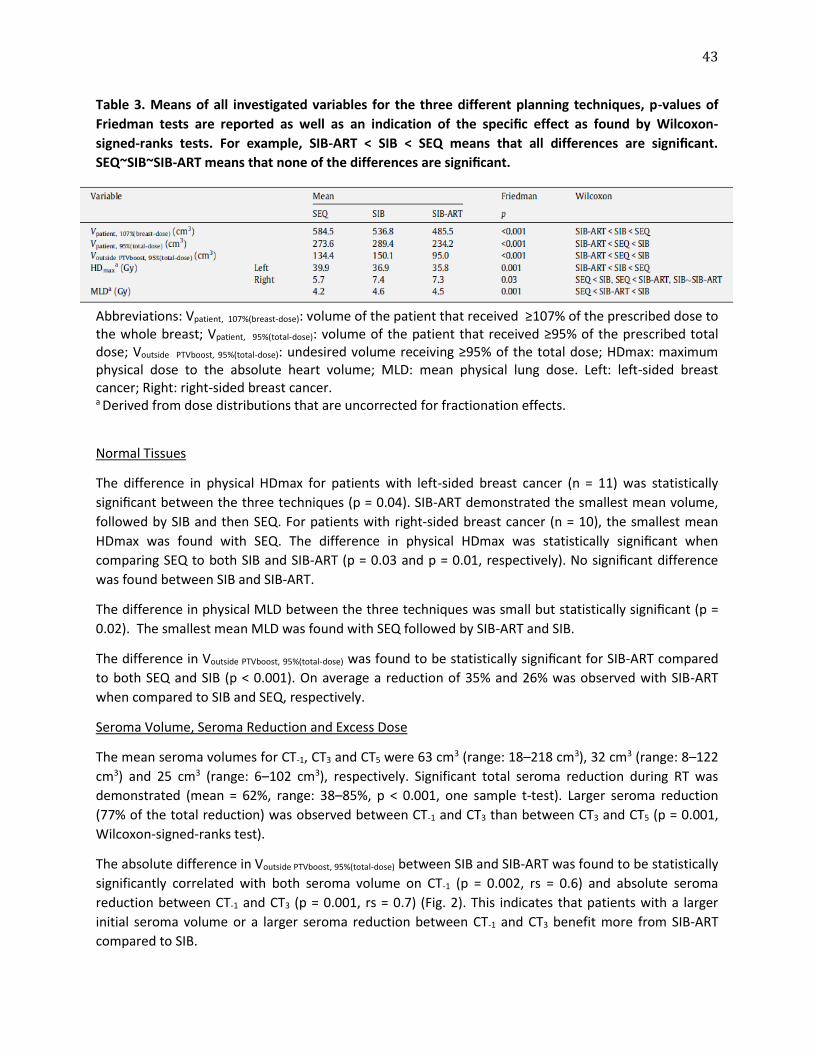
43
Table 3. Means of all investigated variables for the three different planning techniques, p-values of
Friedman tests are reported as well as an indication of the specific effect as found by Wilcoxon-
signed-ranks tests. For example, SIB-ART < SIB < SEQ means that all differences are significant.
SEQ~SIB~SIB-ART means that none of the differences are significant.
Abbreviations: Vpatient, 107%(breast-dose): volume of the patient that received ≥107% of the prescribed dose to the whole breast; Vpatient, 95%(total-dose): volume of the patient that received ≥95% of the prescribed total dose; Voutside PTVboost, 95%(total-dose): undesired volume receiving ≥95% of the total dose; HDmax: maximum physical dose to the absolute heart volume; MLD: mean physical lung dose. Left: left-sided breast cancer; Right: right-sided breast cancer. a Derived from dose distributions that are uncorrected for fractionation effects.
Normal Tissues
The difference in physical HDmax for patients with left-sided breast cancer (n = 11) was statistically
significant between the three techniques (p = 0.04). SIB-ART demonstrated the smallest mean volume,
followed by SIB and then SEQ. For patients with right-sided breast cancer (n = 10), the smallest mean
HDmax was found with SEQ. The difference in physical HDmax was statistically significant when
comparing SEQ to both SIB and SIB-ART (p = 0.03 and p = 0.01, respectively). No significant difference
was found between SIB and SIB-ART.
The difference in physical MLD between the three techniques was small but statistically significant (p =
0.02). The smallest mean MLD was found with SEQ followed by SIB-ART and SIB.
The difference in Voutside PTVboost, 95%(total-dose) was found to be statistically significant for SIB-ART compared
to both SEQ and SIB (p < 0.001). On average a reduction of 35% and 26% was observed with SIB-ART
when compared to SIB and SEQ, respectively.
Seroma Volume, Seroma Reduction and Excess Dose
The mean seroma volumes for CT-1, CT3 and CT5 were 63 cm3 (range: 18–218 cm3), 32 cm3 (range: 8–122
cm3) and 25 cm3 (range: 6–102 cm3), respectively. Significant total seroma reduction during RT was
demonstrated (mean = 62%, range: 38–85%, p < 0.001, one sample t-test). Larger seroma reduction
(77% of the total reduction) was observed between CT-1 and CT3 than between CT3 and CT5 (p = 0.001,
Wilcoxon-signed-ranks test).
The absolute difference in Voutside PTVboost, 95%(total-dose) between SIB and SIB-ART was found to be statistically
significantly correlated with both seroma volume on CT-1 (p = 0.002, rs = 0.6) and absolute seroma
reduction between CT-1 and CT3 (p = 0.001, rs = 0.7) (Fig. 2). This indicates that patients with a larger
initial seroma volume or a larger seroma reduction between CT-1 and CT3 benefit more from SIB-ART
compared to SIB.
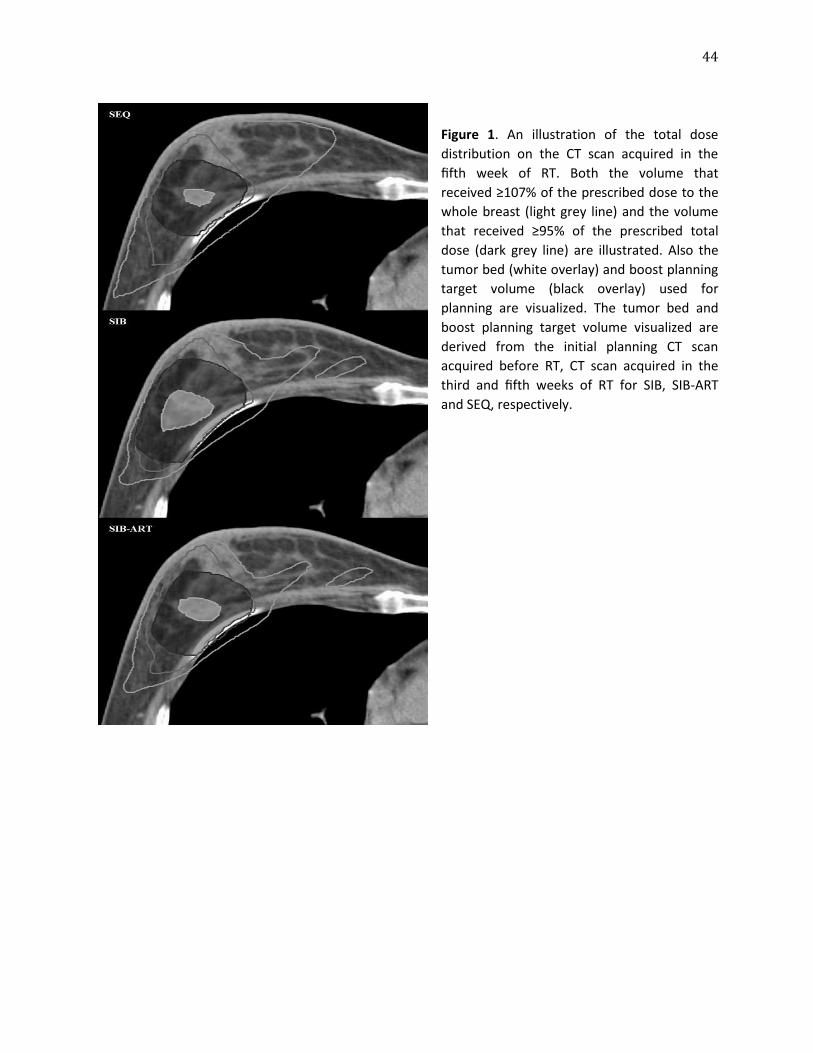
44
Figure 1. An illustration of the total dose
distribution on the CT scan acquired in the
fifth week of RT. Both the volume that
received ≥107% of the prescribed dose to the
whole breast (light grey line) and the volume
that received ≥95% of the prescribed total
dose (dark grey line) are illustrated. Also the
tumor bed (white overlay) and boost planning
target volume (black overlay) used for
planning are visualized. The tumor bed and
boost planning target volume visualized are
derived from the initial planning CT scan
acquired before RT, CT scan acquired in the
third and fifth weeks of RT for SIB, SIB-ART
and SEQ, respectively.
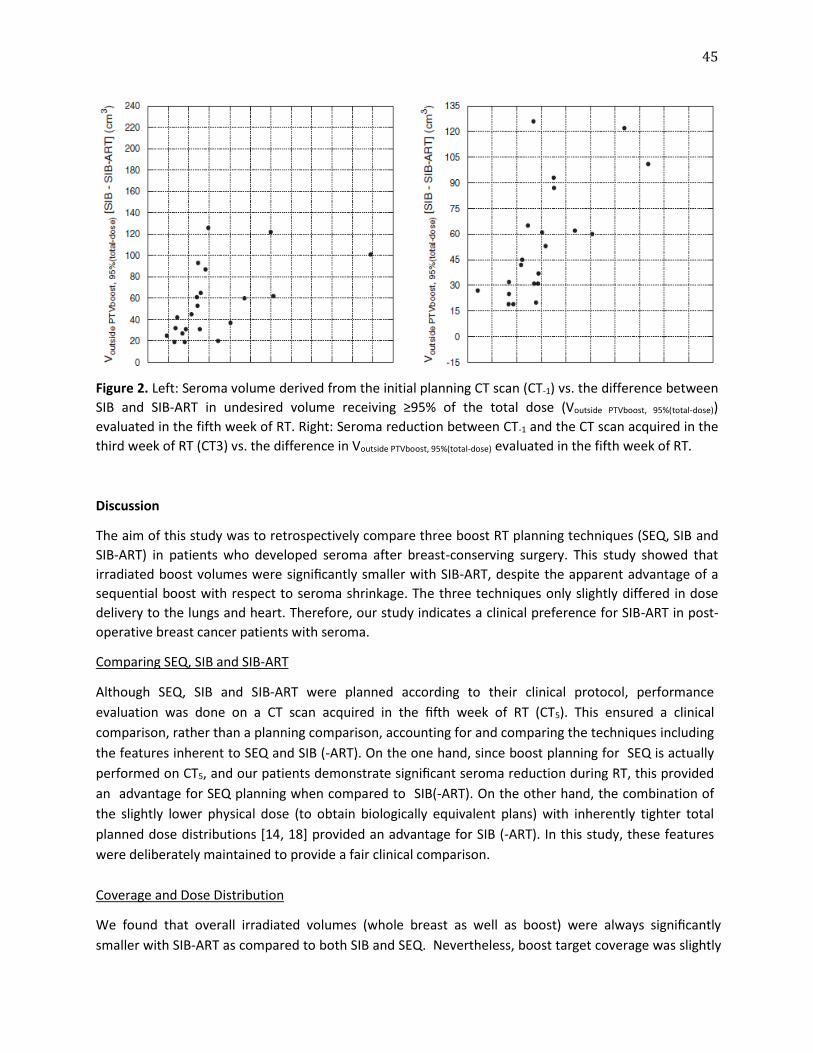
45
Figure 2. Left: Seroma volume derived from the initial planning CT scan (CT-1) vs. the difference between
SIB and SIB-ART in undesired volume receiving ≥95% of the total dose (Voutside PTVboost, 95%(total-dose))
evaluated in the fifth week of RT. Right: Seroma reduction between CT-1 and the CT scan acquired in the
third week of RT (CT3) vs. the difference in Voutside PTVboost, 95%(total-dose) evaluated in the fifth week of RT.
Discussion
The aim of this study was to retrospectively compare three boost RT planning techniques (SEQ, SIB and
SIB-ART) in patients who developed seroma after breast-conserving surgery. This study showed that
irradiated boost volumes were significantly smaller with SIB-ART, despite the apparent advantage of a
sequential boost with respect to seroma shrinkage. The three techniques only slightly differed in dose
delivery to the lungs and heart. Therefore, our study indicates a clinical preference for SIB-ART in post-
operative breast cancer patients with seroma.
Comparing SEQ, SIB and SIB-ART
Although SEQ, SIB and SIB-ART were planned according to their clinical protocol, performance
evaluation was done on a CT scan acquired in the fifth week of RT (CT5). This ensured a clinical
comparison, rather than a planning comparison, accounting for and comparing the techniques including
the features inherent to SEQ and SIB (-ART). On the one hand, since boost planning for SEQ is actually
performed on CT5, and our patients demonstrate significant seroma reduction during RT, this provided
an advantage for SEQ planning when compared to SIB(-ART). On the other hand, the combination of
the slightly lower physical dose (to obtain biologically equivalent plans) with inherently tighter total
planned dose distributions [14, 18] provided an advantage for SIB (-ART). In this study, these features
were deliberately maintained to provide a fair clinical comparison.
Coverage and Dose Distribution
We found that overall irradiated volumes (whole breast as well as boost) were always significantly
smaller with SIB-ART as compared to both SIB and SEQ. Nevertheless, boost target coverage was slightly
46
worse for both SIB and SIB-ART compared to SEQ. This is due to geometrical changes in breast tissue that
occurred in three patients during the third and fifth weeks of RT. Therefore, boost target volumes
assessed for SIB and SIB-ART in CT scans obtained pre-treatment and in the third week of RT were no
longer representative of the boost volumes in the fifth week of RT for these patients. This finding
indicates the importance of monitoring the excision cavity for changes during RT in order to re-define
target volume and modify treatment plans when needed [19].
Normal Tissues
For patients with right-sided breast cancer, HDmax was found to be significantly lower for SEQ when
compared to both SIB and SIB-ART. Nevertheless, since RT for patients with right-sided breast cancer
generally involves smaller cardiac dose delivery, HDmax was for all three techniques smaller than 8 Gy
on average. It is, therefore, questionable whether the small differences in dosage have any clinical
impact [20]. For all three techniques, the average mean physical lung dose was well below the maximum
normalized total lung dose (7.5 Gy) that could result in less than 1% risk of radiation pneumonitis Grade
2 or higher [21].
Since boost treatment planning for SEQ is planned on a CT scan obtained in the fifth week of RT, one
might expect superiority of the performance of SEQ when evaluating Voutside PTVboost, 95%(total- dose) in the
fifth week of RT. Conversely, evaluation of the performance of the three techniques in this study
showed a reduction of 26% in Voutside PTVboost, 95%(total-dose) when using SIB-ART compared to SEQ. On the
other hand, an increase of 16% in Voutside PTVboost, 95%(total-dose) was observed when using SIB compared to
SEQ. Note that the performances of SIB and SIB-ART are biased to their disadvantage as a consequence
of the evaluation of the total plan on CT5. Nevertheless, the current results indicate a preference for SIB-
ART with respect to minimizing Voutside PTVboost, 95%(total-dose).
Clinical Implications
Our study showed that for patients who demonstrated seroma reduction, a SIB-ART planning technique
is clinically preferable to a SEQ planning technique as the combined effect of a tighter dose distribution
and re-planning midway through RT is most successful in achieving excess dose reduction. The clinical
implication would be replacing SEQ with SIB (-ART). Nevertheless, a difficult issue remains: what specific
dosimetric gain is clinically relevant enough to spend the additional time associated with re-planning?
For each 100 cm3 increase in irradiated boost volume a fourfold increase in risk of fibrosis was observed
[10]. Therefore, a reduction of 50 cm3 in volume of excess dose during RT can be considered clinically
significant and should be taken into consideration. The graphs in Fig. 2 could be used to derive clinical
indications for the decision to start monitoring and to create the adaptive plan. Two thresholds can be
derived: (1) patients with an initial seroma volume ≥40 cm3 should be monitored and (2) patients with
seroma reduction of ≥20 cm3 in the first four weeks after acquisition of the initial planning CT should be
re-planned. In our investigated patient group 48% of the patients would benefit (reduction of ≥50 cm3 in
volume of excess dose) from SIB-ART compared to SIB. However, whether these thresholds are effective
should be addressed in a larger patient group in future investigations.
Variation in boost target volume delineation in breast RT is a well-known issue [22–24]. However, it has
been shown that changes in boost volume during RT due to seroma shrinkage are significant in relation
to clinical interobserver variations [25]. Furthermore, delineation variation is smaller when seroma is
47
present [22, 24]. In case SIB-ART is used in clinical practice it is advisable to have all delineations for a
specific patient done by the same physician. This way delineation variation is minimized and undesirable
adaptation of the location of the boost target volume is prevented.
Limitations
It is questionable whether SIB-ART would be preferable to SIB in a sub-selection of patients that
demonstrates minor seroma reduction in the first three weeks of RT. This was not investigated in our
current study and should be addressed in future investigations.
The clinical fractionation schedule for SIB was calculated using an a/b-ratio of 10 Gy. However, recent
data suggest lower a/b-ratio (e.g. 3.6 Gy) could be more applicable [26, 27]. Nevertheless, our study
represents the current clinical practice in terms of breast RT dosing.
Conclusions
Seroma is frequently seen in patients after breast-conserving surgery. Reduction is normally seen during
the first weeks of adjuvant radiotherapy [3, 9]. Our study demonstrates that, for patients with seroma
reduction, a tighter dose distribution from the start of treatment (SIB) outweighs the advantage of
sequential boost planning (SEQ) provided that the delivery of SIB is re-planned halfway through
treatment. This leads us to the conclusion that SIB-ART is the optimal boost radiation treatment
planning technique and should be considered for standard clinical practice.
48
References
1. Clarke M, Collins R, Darby S et al. Effects of radiotherapy and of differences in the extent of surgery for early breast cancer on local recurrence and 15-year survival: an overview of the randomised trials. Lancet 2005; 366: 2087–106. 2. Bartelink H, Horiot JC, Poortmans PM et al. Impact of higher radiation dose on local control and survival in breast-conserving therapy of early breast cancer: 10-year results of the randomized boost versus no boost EORTC 22881-10882 trial. J Clin Oncol 2007; 25: 3259–65. 3. Kader HA, Truong PT, Pai R et al. When is CT-based postoperative seroma most useful to plan partial breast radiotherapy? Evaluation of clinical factors affecting seroma volume and clarity. Int J Radiat Oncol Biol Phys 2008; 72: 1064–9. 4. Prendergast B, Indelicato DJ, Grobmyer SR et al. The dynamic tumor bed: volumetric changes in the lumpectomy cavity during breast-conserving therapy. Int J Radiat Oncol Biol Phys 2009; 74: 695–701. 5. Hurkmans CW, Borger JH, Pieters BR et al. Variability in target volume delineation on CT scans of the breast. Int J Radiat Oncol Biol Phys 2001; 50: 1366–72. 6. Jacobson G, Betts V, Smith B. Change in volume of lumpectomy cavity during external-beam irradiation of the intact breast. Int J Radiat Oncol Biol Phys 2006; 65: 1161–4. 7. Oh KS, Kong FM, Griffith KA et al. Planning the breast tumor bed boost: changes in the excision cavity volume and surgical scar location after breast- conserving surgery and whole-breast irradiation. Int J Radiat Oncol Biol Phys 2006; 66: 680–6. 8. Tersteeg RJ, Roesink JM, Albregts M et al. Changes in excision cavity volume: prediction of the reduction in absolute volume during breast irradiation. Int J Radiat Oncol Biol Phys 2009; 74: 1181–5. 9. Yang TJ, Elkhuizen PH, Minkema D et al. Clinical factors associated with seroma volume reduction in breast-conserving therapy for early stage breast cancer, a multi-institutional analysis. Int J Radiat Oncol Biol Phys 2010; 76: 1325–32. 10. Borger JH, Kemperman H, Smitt HS et al. Dose and volume effects on fibrosis after breast conservation therapy. Int J Radiat Oncol Biol Phys 1994; 30: 1073–81. 11. Collette S, Collette L, Budiharto T et al. Predictors of the risk of fibrosis at 10 years after breast conserving therapy for early breast cancer – a study based on the EORTC trial 22881-10882 ‘boost versus no boost’. Eur J Cancer 2008; 44: 2587–99. 12. Hijal T, Fournier-Bidoz N, Castro-Pena P et al. Simultaneous integrated boost in breast conserving treatment of breast cancer: a dosimetric comparison of helical tomotherapy and three-dimensional conformal radiotherapy. Radiother Oncol 2010; 94: 300–6. 13. Van der Laan HP, Dolsma WV, Schilstra C et al. Limited benefit of inversely optimised intensity modulation in breast conserving radiotherapy with simultaneously integrated boost. Radiother Oncol 2010; 94: 307–12. 14. Hurkmans CW, Meijer GJ, van Vliet-Vroegindeweij C et al. High-dose simultaneously integrated breast boost using intensity-modulated radiotherapy and inverse optimization. Int J Radiat Oncol Biol Phys 2006; 66: 923–30. 15. McDonald MW, Godette KD, Whitaker DJ et al. Three-year outcomes of breast intensity-modulated radiation therapy with simultaneous integrated boost. Int J Radiat Oncol Biol Phys 2010; 77: 523–30. 16. Toscas JI, Linero D, Rubio I et al. Boosting the tumor bed from deep-seated tumors in early-stage breast cancer: a planning study between electron, photon, and proton beams. Radiother Oncol 2010; 96: 192–8. 17. Joiner MC, van der Kogel AJ. The linear-quadratic approach to fractionation and calculation of isoeffect relationships. In: Steel GG, editor. Basic clinical radiobiology. London: Arnold; 1997. p. 106–22.
49
18. Van der Laan HP, Dolsma WV, Maduro JH et al. Three-dimensional conformal simultaneously integrated boost technique for breast-conserving radiotherapy. Int J Radiat Oncol Biol Phys 2007; 68: 1018–23. 19. Yang TJ, Minkema D, Elkhuizen PH et al. Clinical applicability of cone-beam CT in monitoring seroma volume change during breast irradiation. Int J Radiat Oncol Biol Phys 2010; 78: 119–26. 20. Taylor CW, Povall JM, McGale P et al. Cardiac dose from tangential breast cancer radiotherapy in the year 2006. Int J Radiat Oncol Biol Phys 2008; 72: 501–7. 21. Kwa SLS, Lebesque JV, Theuws JCM et al. Radiation pneumonitis as a function of mean lung dose: an analysis of pooled data of 540 patients. Int J Radiat Oncol Biol Phys 1998; 42: 1–9. 22. Petersen RP, Truong PT, Kader HA et al. Target volume delineation for partial breast radiotherapy planning: clinical characteristics associated with low interobserver concordance. Int J Radiat Oncol Biol Phys 2007; 69: 41–8. 23. Struikmans H, Wárlám-Rodenhuis C, Stam T et al. Interobserver variability of clinical target volume delineation of glandular breast tissue and of boost volume in tangential breast irradiation. Radiother Oncol 2005; 76: 293–9. 24. van Mourik AM, Elkhuizen PH, Minkema D et al. Multiinstitutional study on target volume delineation variation in breast radiotherapy in the presence of guidelines. Radiother Oncol 2010; 94: 286–91. 25. Hurkmans C, Admiraal M, van der Sangen M et al. Significance or breast boost volume changes during radiotherapy in relation to current clinical interobserver variations. Radiother Oncol 2009; 90: 60–5. 26. Owen JR, Ashton A, Bliss JM et al. Effect of radiotherapy fraction size on tumour control in patients with early-stage breast cancer after local tumour excision: long-term results of a randomised trial. Lancet Oncol 2006; 7: 467–71. 27. Qi XS, White J, Li XA. Is a/b for breast cancer really low? Radiother Oncol 2011; 100: 282–8.
50
Chapter 5
CLINICAL ASSESSMENT OF 2D/3D REGISTRATION ACCURACY IN FOUR MAJOR ANATOMIC SITES USING ON-BOARD 2D KILOVOLTAGE IMAGES FOR 6D PATIENT SETUP
Guang Li*, T. Jonathan Yang*, Hugo Furtado, Wolfgang Birkfellner, Ase Ballangrud, Simon N. Powell, and
James Mechalakos *Co-first authors
Technology in Cancer Research and Treatment 14(3): 305-14 (2015).
51
Abstract To provide a comprehensive assessment of patient setup accuracy in 6 degrees of freedom (DOF) using 2D/3D image registration with on-board 2-dimensional kilovoltage (OB-2DkV) radiographic images, we evaluated cranial, head and neck, thoracic and abdominal sites under clinical conditions. A fast 2D/3D image registration method using graphics processing unit (GPU) was modified for registration between OB-2DkV and 3D simulation computed tomography (simCT) images, with 3D/3D registration as the gold standard for 6DOF alignment. In 2D/3D registration, body roll rotation was obtained solely by matching orthogonal OB-2DkV images with a series of digitally reconstructed radiographs (DRRs) from simCT with a small rotational increment along the gantry-rotation axis. Window/Level adjustments for optimal visualization of the bone in OB-2DkV and DRRs were performed prior to registration. Ideal patient alignment at the isocenter was calculated and used as an initial registration position. In 3D/3D registration, cone-beam CT (CBCT) was aligned to simCT on bony structures using a bone density filter in 6DOF. Included in this retrospective study were 37 patients treated in 55 fractions with frameless stereotactic radiosurgery (fSRS) or stereotactic body radiotherapy (SBRT) for cranial and paraspinal cancer. A cranial phantom was used to serve as a control. In all cases, CBCT images were acquired for patient setup with subsequent OB-2DkV verification. It was found that the accuracy of the 2D/3D registration was 0.0±0.5mm and 0.1°±0.4° in phantom. In patient, it is site-dependent due to deformation of the anatomy: 0.2±1.6mm and -0.4°±1.2° on average for each dimension for the cranial site; 0.7±1.6mm and 0.3°±1.3° for head and neck; 0.7±2.0mm and -0.7°±1.1° for the thorax; and 1.1±2.6mm and -0.5°±1.9° for the abdomen. Anatomical deformation and presence of soft tissue in 2D/3D registration affects the consistency with 3D/3D registration in 6DOF: the discrepancy increases superior-to-inferior direction. Introduction Image-guided radiotherapy (IGRT) has substantially improved the accuracy of patient setup, resulting in greater confidence in tumor dose coverage and in many instances, reducing the treatment margin and sparing more normal tissue [33, 34]. In-room 2-dimensional kilovoltage (2DkV) imaging systems, which provide high-contrast images of bony structures, implanted fiducials, and even soft tissues, are essential to localizing and positioning an internal target. A gantry-mounted kV system, such as Varian’s On-board Imager (OBI, Varian Medical Systems, Palo Alto, CA) and the Elekta Synergy system (Elekta Inc, Stockholm, Sweden), provides orthogonal on-board 2DkV (OB-2DkV) images and/or half/full rotational scan around the linac isocenter for cone-beam computed tomography (CBCT) images [35, 36]. The 3D/3D registration between CBCT and simulation CT images yields 6 degrees of freedom (DOF) while the 2D/2D registration between orthogonal OB-2DkV image pair and digitally reconstructed radiograph (DRR) images can produce 5DOF, including 2 in-plane rotations (Yaw and Pitch), leaving Roll rotation undetected. In conventional-fractionation radiotherapy, translational alignment is of primary importance whereas residual rotations are often uncorrected. In frameless stereotactic radiosurgery (fSRS) or stereotactic body radiotherapy (SBRT), however, correction of residual rotation becomes more important as it can improve treatment accuracy, especially for targets with asymmetric shape and next to a critical structure. Full 6DOF can be obtained from orthogonal 2DkV images using 2D/3D image registration and has been used by CyberKnife (Accuray Inc, Sunnyvale, CA) and ExacTrac (BrainLab, AG Feldkirchen, Germany) to
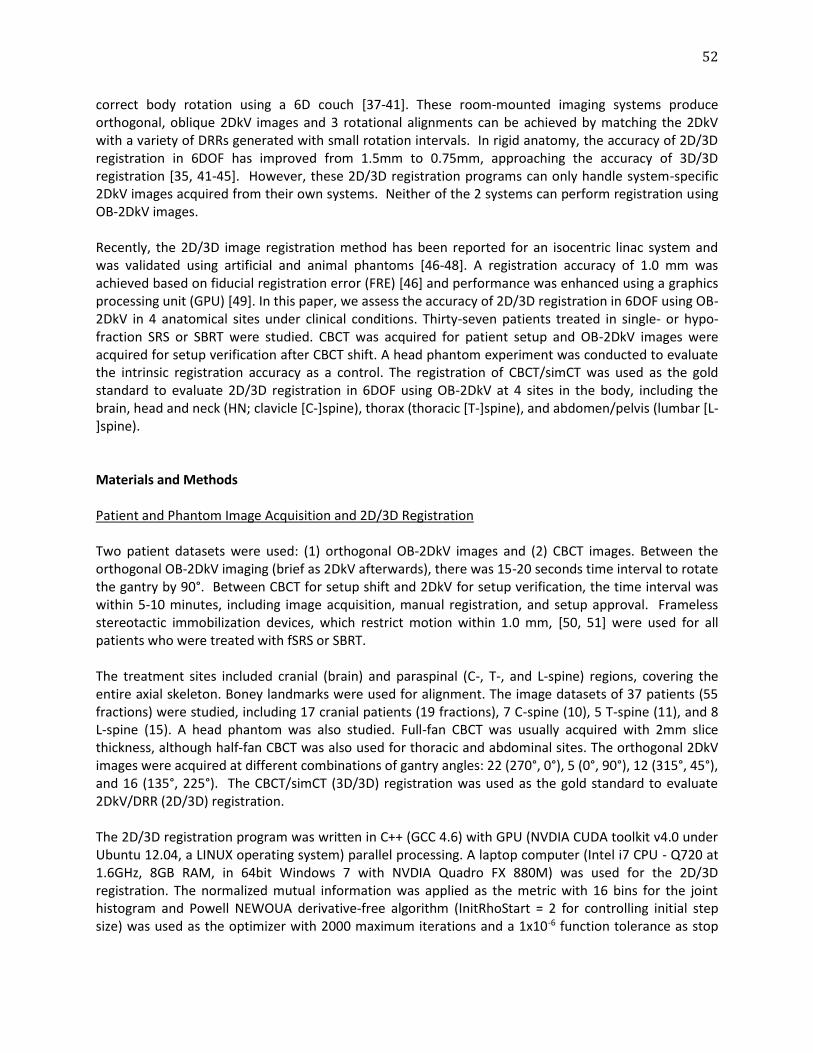
52
correct body rotation using a 6D couch [37-41]. These room-mounted imaging systems produce orthogonal, oblique 2DkV images and 3 rotational alignments can be achieved by matching the 2DkV with a variety of DRRs generated with small rotation intervals. In rigid anatomy, the accuracy of 2D/3D registration in 6DOF has improved from 1.5mm to 0.75mm, approaching the accuracy of 3D/3D registration [35, 41-45]. However, these 2D/3D registration programs can only handle system-specific 2DkV images acquired from their own systems. Neither of the 2 systems can perform registration using OB-2DkV images. Recently, the 2D/3D image registration method has been reported for an isocentric linac system and was validated using artificial and animal phantoms [46-48]. A registration accuracy of 1.0 mm was achieved based on fiducial registration error (FRE) [46] and performance was enhanced using a graphics processing unit (GPU) [49]. In this paper, we assess the accuracy of 2D/3D registration in 6DOF using OB-2DkV in 4 anatomical sites under clinical conditions. Thirty-seven patients treated in single- or hypo-fraction SRS or SBRT were studied. CBCT was acquired for patient setup and OB-2DkV images were acquired for setup verification after CBCT shift. A head phantom experiment was conducted to evaluate the intrinsic registration accuracy as a control. The registration of CBCT/simCT was used as the gold standard to evaluate 2D/3D registration in 6DOF using OB-2DkV at 4 sites in the body, including the brain, head and neck (HN; clavicle [C-]spine), thorax (thoracic [T-]spine), and abdomen/pelvis (lumbar [L-]spine). Materials and Methods Patient and Phantom Image Acquisition and 2D/3D Registration Two patient datasets were used: (1) orthogonal OB-2DkV images and (2) CBCT images. Between the orthogonal OB-2DkV imaging (brief as 2DkV afterwards), there was 15-20 seconds time interval to rotate the gantry by 90°. Between CBCT for setup shift and 2DkV for setup verification, the time interval was within 5-10 minutes, including image acquisition, manual registration, and setup approval. Frameless stereotactic immobilization devices, which restrict motion within 1.0 mm, [50, 51] were used for all patients who were treated with fSRS or SBRT. The treatment sites included cranial (brain) and paraspinal (C-, T-, and L-spine) regions, covering the entire axial skeleton. Boney landmarks were used for alignment. The image datasets of 37 patients (55 fractions) were studied, including 17 cranial patients (19 fractions), 7 C-spine (10), 5 T-spine (11), and 8 L-spine (15). A head phantom was also studied. Full-fan CBCT was usually acquired with 2mm slice thickness, although half-fan CBCT was also used for thoracic and abdominal sites. The orthogonal 2DkV images were acquired at different combinations of gantry angles: 22 (270°, 0°), 5 (0°, 90°), 12 (315°, 45°), and 16 (135°, 225°). The CBCT/simCT (3D/3D) registration was used as the gold standard to evaluate 2DkV/DRR (2D/3D) registration. The 2D/3D registration program was written in C++ (GCC 4.6) with GPU (NVDIA CUDA toolkit v4.0 under Ubuntu 12.04, a LINUX operating system) parallel processing. A laptop computer (Intel i7 CPU - Q720 at 1.6GHz, 8GB RAM, in 64bit Windows 7 with NVDIA Quadro FX 880M) was used for the 2D/3D registration. The normalized mutual information was applied as the metric with 16 bins for the joint histogram and Powell NEWOUA derivative-free algorithm (InitRhoStart = 2 for controlling initial step size) was used as the optimizer with 2000 maximum iterations and a 1x10⁻⁶ function tolerance as stop
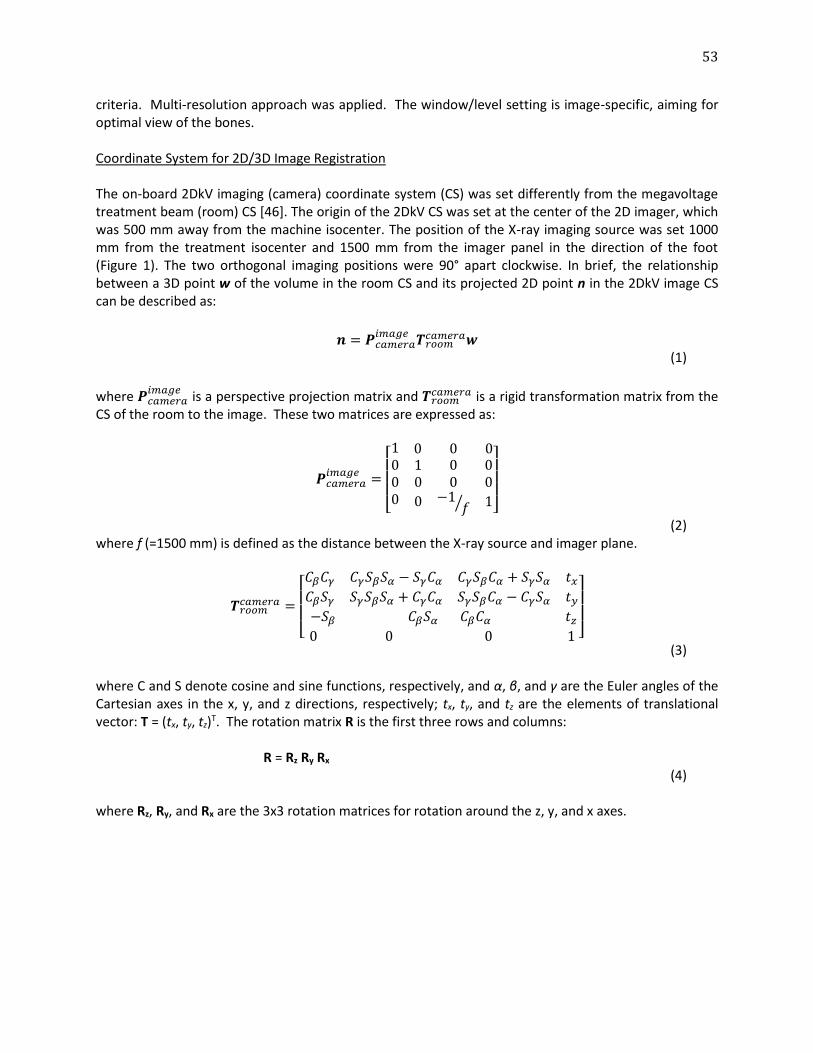
53
criteria. Multi-resolution approach was applied. The window/level setting is image-specific, aiming for optimal view of the bones. Coordinate System for 2D/3D Image Registration The on-board 2DkV imaging (camera) coordinate system (CS) was set differently from the megavoltage treatment beam (room) CS [46]. The origin of the 2DkV CS was set at the center of the 2D imager, which was 500 mm away from the machine isocenter. The position of the X-ray imaging source was set 1000 mm from the treatment isocenter and 1500 mm from the imager panel in the direction of the foot (Figure 1). The two orthogonal imaging positions were 90° apart clockwise. In brief, the relationship between a 3D point w of the volume in the room CS and its projected 2D point n in the 2DkV image CS can be described as:
𝒏 = 𝑷𝑐𝑎𝑚𝑒𝑟𝑎𝑖𝑚𝑎𝑔𝑒
𝑻𝑟𝑜𝑜𝑚𝑐𝑎𝑚𝑒𝑟𝑎𝒘
(1)
where 𝑷𝑐𝑎𝑚𝑒𝑟𝑎𝑖𝑚𝑎𝑔𝑒
is a perspective projection matrix and 𝑻𝑟𝑜𝑜𝑚𝑐𝑎𝑚𝑒𝑟𝑎 is a rigid transformation matrix from the
CS of the room to the image. These two matrices are expressed as:
𝑷𝑐𝑎𝑚𝑒𝑟𝑎𝑖𝑚𝑎𝑔𝑒
=
[ 1 0 0 0000
1 0 00 0 0
0 −1𝑓⁄ 1]
(2) where f (=1500 mm) is defined as the distance between the X-ray source and imager plane.
𝑻𝑟𝑜𝑜𝑚𝑐𝑎𝑚𝑒𝑟𝑎 =
[ 𝐶𝛽𝐶𝛾 𝐶𝛾𝑆𝛽𝑆𝛼 − 𝑆𝛾𝐶𝛼
𝐶𝛽𝑆𝛾 𝑆𝛾𝑆𝛽𝑆𝛼 + 𝐶𝛾𝐶𝛼
𝐶𝛾𝑆𝛽𝐶𝛼 + 𝑆𝛾𝑆𝛼 𝑡𝑥𝑆𝛾𝑆𝛽𝐶𝛼 − 𝐶𝛾𝑆𝛼 𝑡𝑦
−𝑆𝛽 𝐶𝛽𝑆𝛼
0 0
𝐶𝛽𝐶𝛼 𝑡𝑧 0 1 ]
(3) where C and S denote cosine and sine functions, respectively, and α, β, and γ are the Euler angles of the Cartesian axes in the x, y, and z directions, respectively; tx, ty, and tz are the elements of translational vector: T = (tx, ty, tz)T. The rotation matrix R is the first three rows and columns:
R = Rz Ry Rx
(4) where Rz, Ry, and Rx are the 3x3 rotation matrices for rotation around the z, y, and x axes.
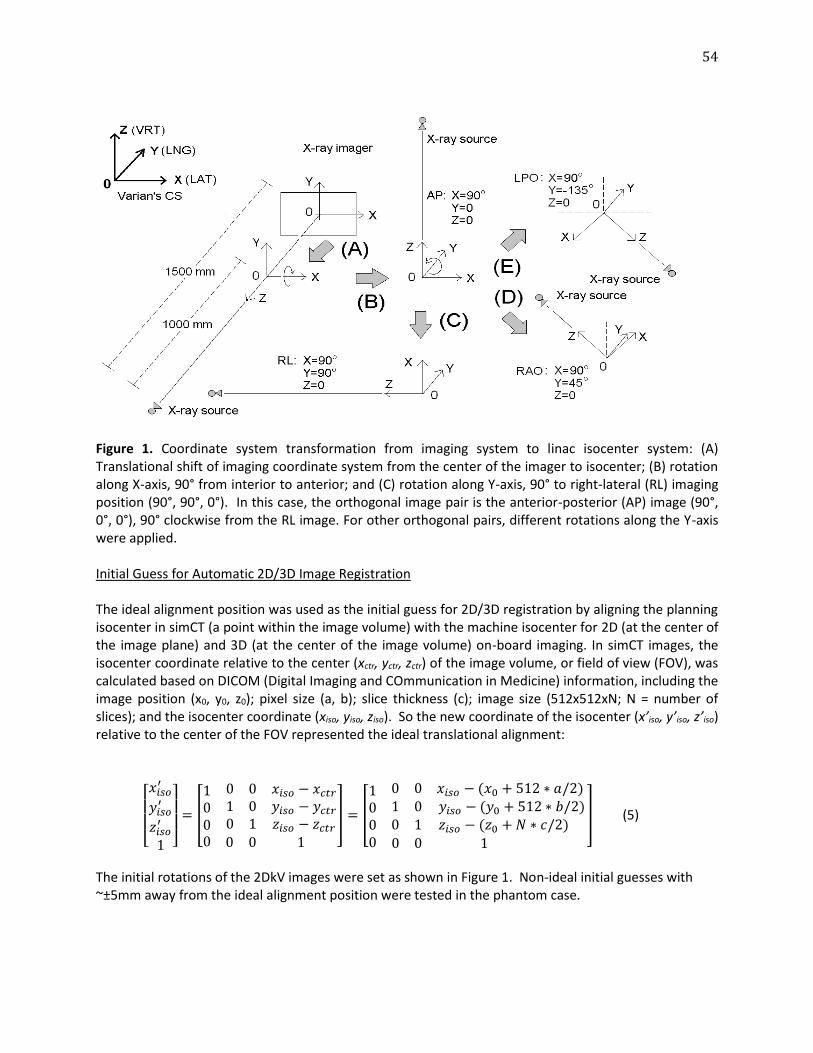
54
Figure 1. Coordinate system transformation from imaging system to linac isocenter system: (A) Translational shift of imaging coordinate system from the center of the imager to isocenter; (B) rotation along X-axis, 90° from interior to anterior; and (C) rotation along Y-axis, 90° to right-lateral (RL) imaging position (90°, 90°, 0°). In this case, the orthogonal image pair is the anterior-posterior (AP) image (90°, 0°, 0°), 90° clockwise from the RL image. For other orthogonal pairs, different rotations along the Y-axis were applied. Initial Guess for Automatic 2D/3D Image Registration The ideal alignment position was used as the initial guess for 2D/3D registration by aligning the planning isocenter in simCT (a point within the image volume) with the machine isocenter for 2D (at the center of the image plane) and 3D (at the center of the image volume) on-board imaging. In simCT images, the isocenter coordinate relative to the center (xctr, yctr, zctr) of the image volume, or field of view (FOV), was calculated based on DICOM (Digital Imaging and COmmunication in Medicine) information, including the image position (x0, y0, z0); pixel size (a, b); slice thickness (c); image size (512x512xN; N = number of slices); and the isocenter coordinate (xiso, yiso, ziso). So the new coordinate of the isocenter (x’iso, y’iso, z’iso) relative to the center of the FOV represented the ideal translational alignment:
[ 𝑥𝑖𝑠𝑜
′
𝑦𝑖𝑠𝑜′
𝑧𝑖𝑠𝑜′
1 ] = [
100
0 0 𝑥𝑖𝑠𝑜 − 𝑥𝑐𝑡𝑟
1 0 𝑦𝑖𝑠𝑜 − 𝑦𝑐𝑡𝑟
0 1 𝑧𝑖𝑠𝑜 − 𝑧𝑐𝑡𝑟
0 0 0 1
] = [
100
0 0 𝑥𝑖𝑠𝑜 − (𝑥0 + 512 ∗ 𝑎/2) 1 0 𝑦𝑖𝑠𝑜 − (𝑦0 + 512 ∗ 𝑏/2)0 1 𝑧𝑖𝑠𝑜 − (𝑧0 + 𝑁 ∗ 𝑐/2)
0 0 0 1
] (5)
The initial rotations of the 2DkV images were set as shown in Figure 1. Non-ideal initial guesses with ~±5mm away from the ideal alignment position were tested in the phantom case.
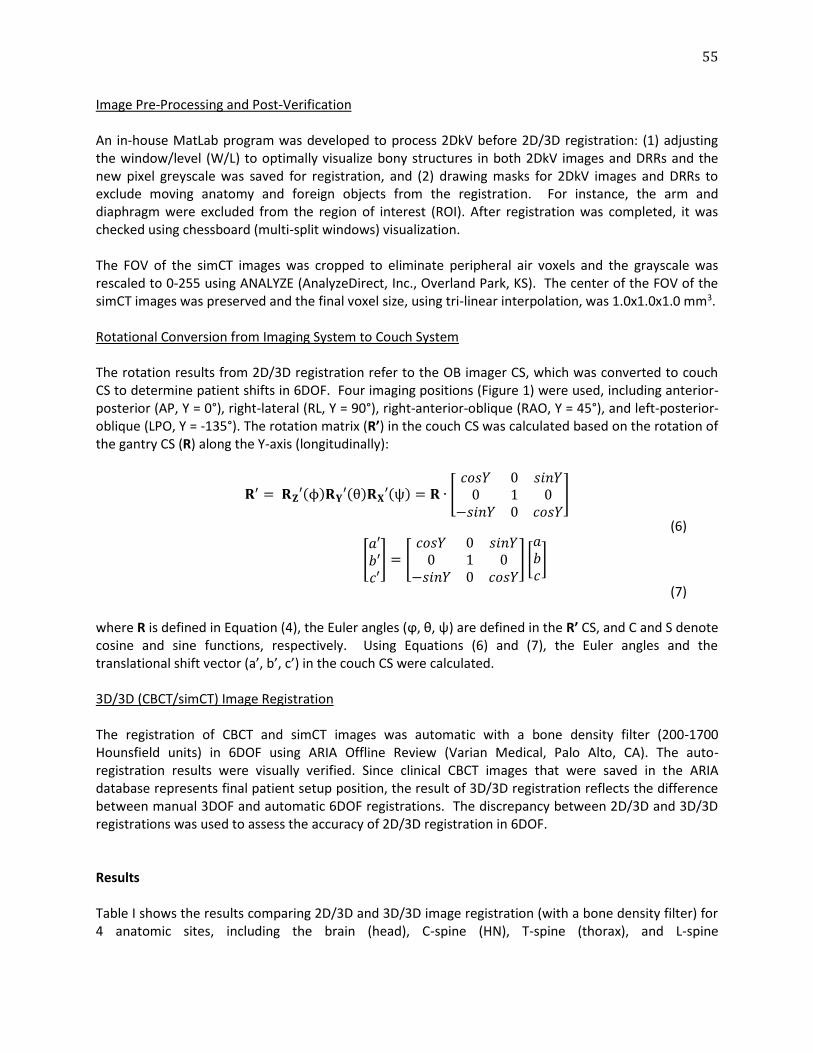
55
Image Pre-Processing and Post-Verification An in-house MatLab program was developed to process 2DkV before 2D/3D registration: (1) adjusting the window/level (W/L) to optimally visualize bony structures in both 2DkV images and DRRs and the new pixel greyscale was saved for registration, and (2) drawing masks for 2DkV images and DRRs to exclude moving anatomy and foreign objects from the registration. For instance, the arm and diaphragm were excluded from the region of interest (ROI). After registration was completed, it was checked using chessboard (multi-split windows) visualization. The FOV of the simCT images was cropped to eliminate peripheral air voxels and the grayscale was rescaled to 0-255 using ANALYZE (AnalyzeDirect, Inc., Overland Park, KS). The center of the FOV of the simCT images was preserved and the final voxel size, using tri-linear interpolation, was 1.0x1.0x1.0 mm3.
Rotational Conversion from Imaging System to Couch System The rotation results from 2D/3D registration refer to the OB imager CS, which was converted to couch CS to determine patient shifts in 6DOF. Four imaging positions (Figure 1) were used, including anterior-posterior (AP, Y = 0°), right-lateral (RL, Y = 90°), right-anterior-oblique (RAO, Y = 45°), and left-posterior-oblique (LPO, Y = -135°). The rotation matrix (R’) in the couch CS was calculated based on the rotation of the gantry CS (R) along the Y-axis (longitudinally):
𝐑′ = 𝐑𝐙′(ϕ)𝐑𝐘′(θ)𝐑𝐗′(ψ) = 𝐑 ∙ [𝑐𝑜𝑠𝑌 0 𝑠𝑖𝑛𝑌
0 1 0−𝑠𝑖𝑛𝑌 0 𝑐𝑜𝑠𝑌
]
(6)
[𝑎′𝑏′𝑐′
] = [𝑐𝑜𝑠𝑌 0 𝑠𝑖𝑛𝑌
0 1 0−𝑠𝑖𝑛𝑌 0 𝑐𝑜𝑠𝑌
] [𝑎𝑏𝑐]
(7) where R is defined in Equation (4), the Euler angles (ϕ, θ, ψ) are defined in the R’ CS, and C and S denote cosine and sine functions, respectively. Using Equations (6) and (7), the Euler angles and the translational shift vector (a’, b’, c’) in the couch CS were calculated. 3D/3D (CBCT/simCT) Image Registration The registration of CBCT and simCT images was automatic with a bone density filter (200-1700 Hounsfield units) in 6DOF using ARIA Offline Review (Varian Medical, Palo Alto, CA). The auto-registration results were visually verified. Since clinical CBCT images that were saved in the ARIA database represents final patient setup position, the result of 3D/3D registration reflects the difference between manual 3DOF and automatic 6DOF registrations. The discrepancy between 2D/3D and 3D/3D registrations was used to assess the accuracy of 2D/3D registration in 6DOF. Results Table I shows the results comparing 2D/3D and 3D/3D image registration (with a bone density filter) for 4 anatomic sites, including the brain (head), C-spine (HN), T-spine (thorax), and L-spine
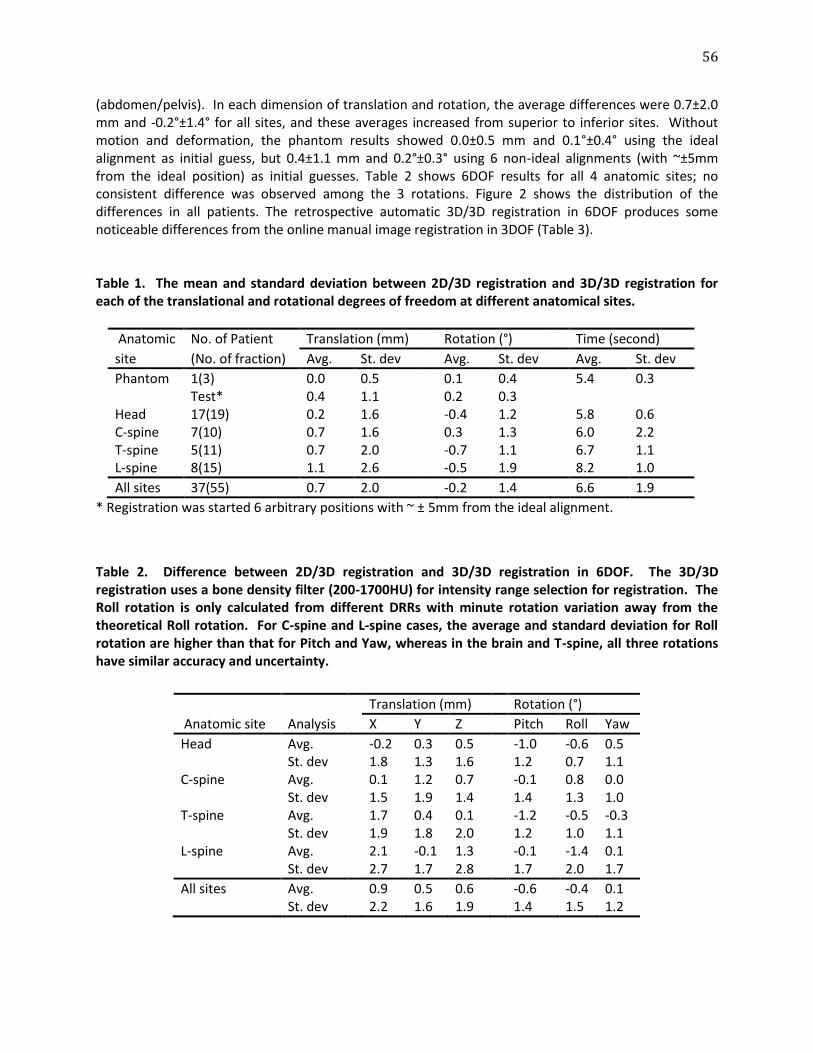
56
(abdomen/pelvis). In each dimension of translation and rotation, the average differences were 0.7±2.0 mm and -0.2°±1.4° for all sites, and these averages increased from superior to inferior sites. Without motion and deformation, the phantom results showed 0.0±0.5 mm and 0.1°±0.4° using the ideal alignment as initial guess, but 0.4±1.1 mm and 0.2°±0.3° using 6 non-ideal alignments (with ~±5mm from the ideal position) as initial guesses. Table 2 shows 6DOF results for all 4 anatomic sites; no consistent difference was observed among the 3 rotations. Figure 2 shows the distribution of the differences in all patients. The retrospective automatic 3D/3D registration in 6DOF produces some noticeable differences from the online manual image registration in 3DOF (Table 3). Table 1. The mean and standard deviation between 2D/3D registration and 3D/3D registration for each of the translational and rotational degrees of freedom at different anatomical sites.
Anatomic No. of Patient Translation (mm) Rotation (°) Time (second)
site (No. of fraction) Avg. St. dev Avg. St. dev Avg. St. dev
Phantom 1(3) 0.0 0.5 0.1 0.4 5.4 0.3
Test* 0.4 1.1 0.2 0.3
Head 17(19) 0.2 1.6 -0.4 1.2 5.8 0.6 C-spine 7(10) 0.7 1.6 0.3 1.3 6.0 2.2 T-spine 5(11) 0.7 2.0 -0.7 1.1 6.7 1.1 L-spine 8(15) 1.1 2.6 -0.5 1.9 8.2 1.0
All sites 37(55) 0.7 2.0 -0.2 1.4 6.6 1.9
* Registration was started 6 arbitrary positions with ~ ± 5mm from the ideal alignment.
Table 2. Difference between 2D/3D registration and 3D/3D registration in 6DOF. The 3D/3D registration uses a bone density filter (200-1700HU) for intensity range selection for registration. The Roll rotation is only calculated from different DRRs with minute rotation variation away from the theoretical Roll rotation. For C-spine and L-spine cases, the average and standard deviation for Roll rotation are higher than that for Pitch and Yaw, whereas in the brain and T-spine, all three rotations have similar accuracy and uncertainty.
Anatomic site Analysis
Translation (mm) Rotation (°)
X Y Z Pitch Roll Yaw
Head Avg. -0.2 0.3 0.5 -1.0 -0.6 0.5
St. dev 1.8 1.3 1.6 1.2 0.7 1.1
C-spine Avg. 0.1 1.2 0.7 -0.1 0.8 0.0
St. dev 1.5 1.9 1.4 1.4 1.3 1.0
T-spine Avg. 1.7 0.4 0.1 -1.2 -0.5 -0.3
St. dev 1.9 1.8 2.0 1.2 1.0 1.1
L-spine Avg. 2.1 -0.1 1.3 -0.1 -1.4 0.1
St. dev 2.7 1.7 2.8 1.7 2.0 1.7
All sites Avg. 0.9 0.5 0.6 -0.6 -0.4 0.1 St. dev 2.2 1.6 1.9 1.4 1.5 1.2
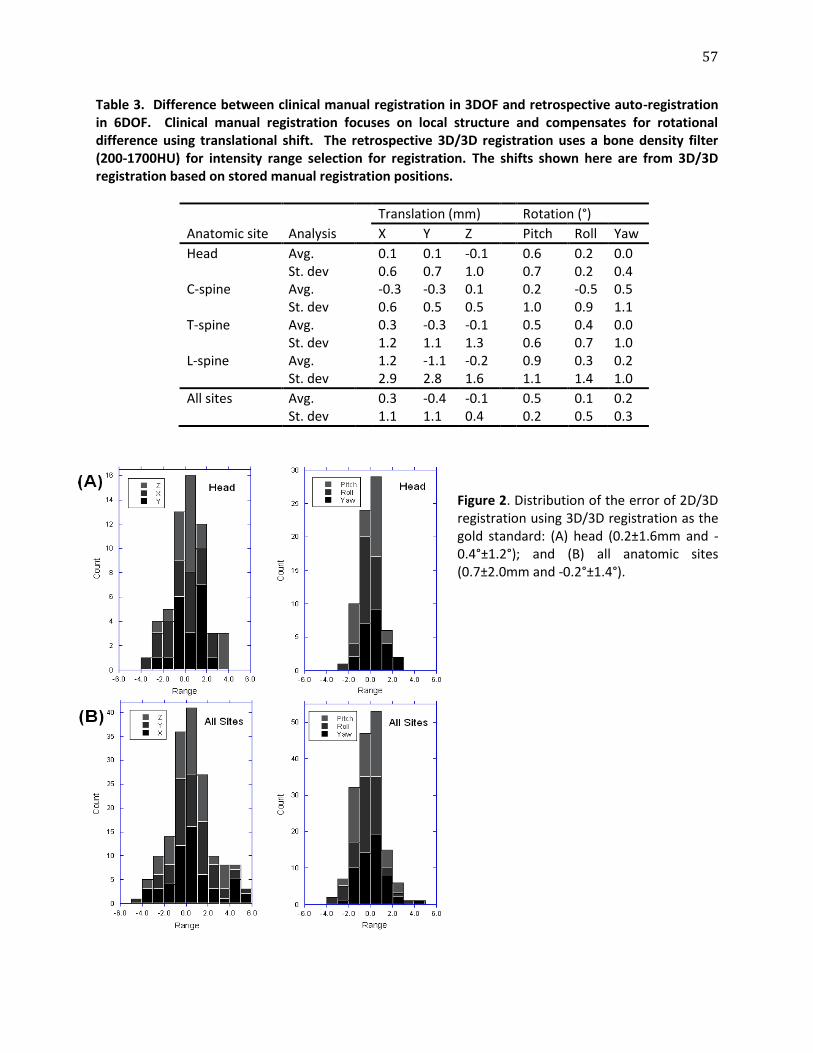
57
Table 3. Difference between clinical manual registration in 3DOF and retrospective auto-registration in 6DOF. Clinical manual registration focuses on local structure and compensates for rotational difference using translational shift. The retrospective 3D/3D registration uses a bone density filter (200-1700HU) for intensity range selection for registration. The shifts shown here are from 3D/3D registration based on stored manual registration positions.
Anatomic site Analysis
Translation (mm) Rotation (°)
X Y Z Pitch Roll Yaw
Head Avg. 0.1 0.1 -0.1 0.6 0.2 0.0
St. dev 0.6 0.7 1.0 0.7 0.2 0.4
C-spine Avg. -0.3 -0.3 0.1 0.2 -0.5 0.5
St. dev 0.6 0.5 0.5 1.0 0.9 1.1
T-spine Avg. 0.3 -0.3 -0.1 0.5 0.4 0.0
St. dev 1.2 1.1 1.3 0.6 0.7 1.0
L-spine Avg. 1.2 -1.1 -0.2 0.9 0.3 0.2
St. dev 2.9 2.8 1.6 1.1 1.4 1.0
All sites Avg. 0.3 -0.4 -0.1 0.5 0.1 0.2 St. dev 1.1 1.1 0.4 0.2 0.5 0.3
Figure 2. Distribution of the error of 2D/3D registration using 3D/3D registration as the gold standard: (A) head (0.2±1.6mm and -0.4°±1.2°); and (B) all anatomic sites (0.7±2.0mm and -0.2°±1.4°).
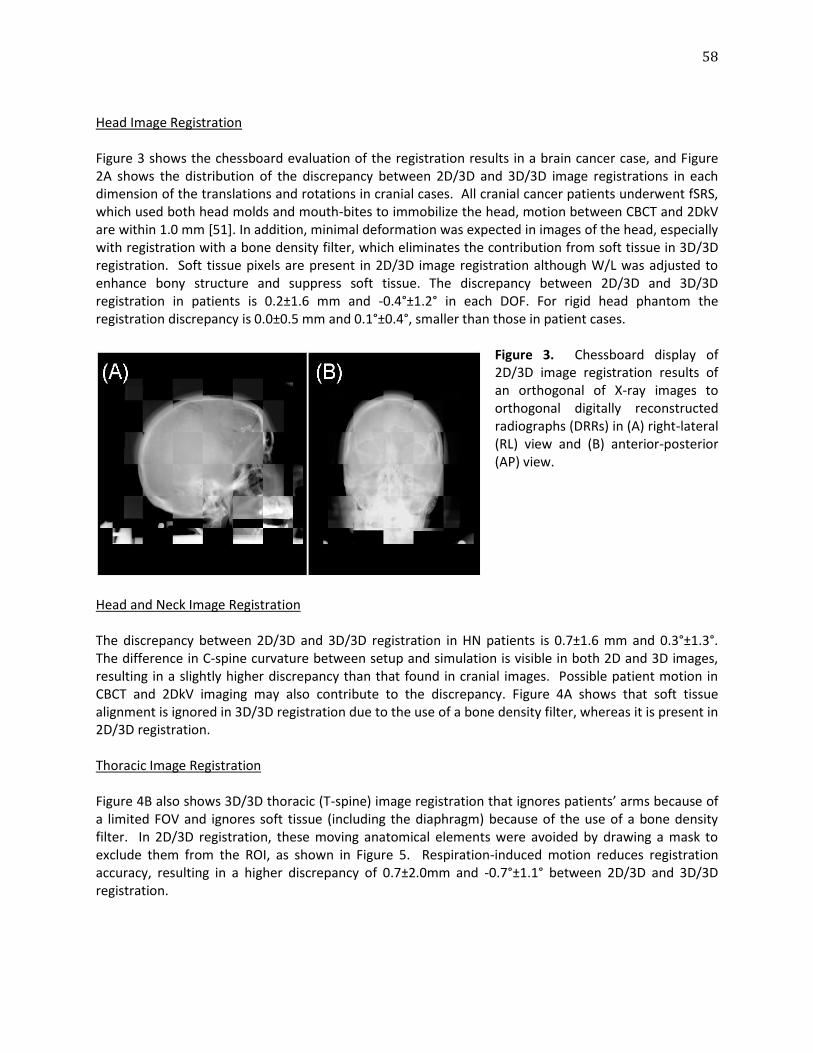
58
Head Image Registration Figure 3 shows the chessboard evaluation of the registration results in a brain cancer case, and Figure 2A shows the distribution of the discrepancy between 2D/3D and 3D/3D image registrations in each dimension of the translations and rotations in cranial cases. All cranial cancer patients underwent fSRS, which used both head molds and mouth-bites to immobilize the head, motion between CBCT and 2DkV are within 1.0 mm [51]. In addition, minimal deformation was expected in images of the head, especially with registration with a bone density filter, which eliminates the contribution from soft tissue in 3D/3D registration. Soft tissue pixels are present in 2D/3D image registration although W/L was adjusted to enhance bony structure and suppress soft tissue. The discrepancy between 2D/3D and 3D/3D registration in patients is 0.2±1.6 mm and -0.4°±1.2° in each DOF. For rigid head phantom the registration discrepancy is 0.0±0.5 mm and 0.1°±0.4°, smaller than those in patient cases.
Figure 3. Chessboard display of 2D/3D image registration results of an orthogonal of X-ray images to orthogonal digitally reconstructed radiographs (DRRs) in (A) right-lateral (RL) view and (B) anterior-posterior (AP) view.
Head and Neck Image Registration The discrepancy between 2D/3D and 3D/3D registration in HN patients is 0.7±1.6 mm and 0.3°±1.3°. The difference in C-spine curvature between setup and simulation is visible in both 2D and 3D images, resulting in a slightly higher discrepancy than that found in cranial images. Possible patient motion in CBCT and 2DkV imaging may also contribute to the discrepancy. Figure 4A shows that soft tissue alignment is ignored in 3D/3D registration due to the use of a bone density filter, whereas it is present in 2D/3D registration.
Thoracic Image Registration Figure 4B also shows 3D/3D thoracic (T-spine) image registration that ignores patients’ arms because of a limited FOV and ignores soft tissue (including the diaphragm) because of the use of a bone density filter. In 2D/3D registration, these moving anatomical elements were avoided by drawing a mask to exclude them from the ROI, as shown in Figure 5. Respiration-induced motion reduces registration accuracy, resulting in a higher discrepancy of 0.7±2.0mm and -0.7°±1.1° between 2D/3D and 3D/3D registration.
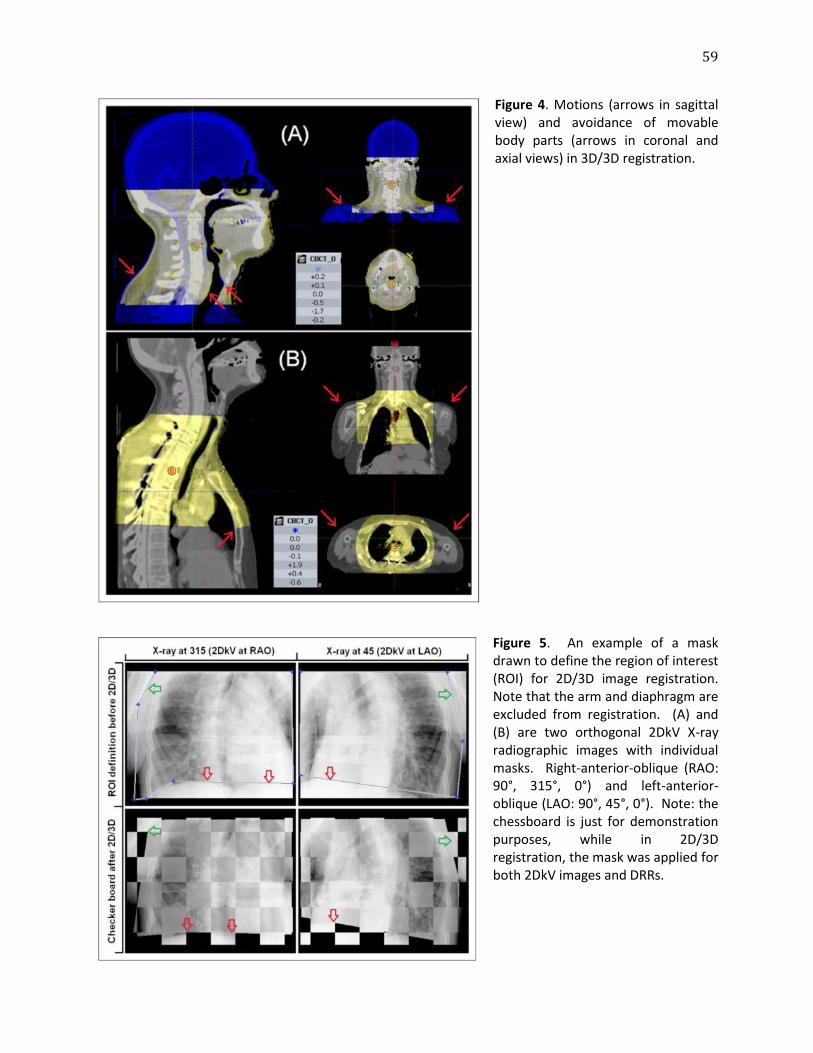
59
Figure 4. Motions (arrows in sagittal view) and avoidance of movable body parts (arrows in coronal and axial views) in 3D/3D registration.
Figure 5. An example of a mask drawn to define the region of interest (ROI) for 2D/3D image registration. Note that the arm and diaphragm are excluded from registration. (A) and (B) are two orthogonal 2DkV X-ray radiographic images with individual masks. Right-anterior-oblique (RAO: 90°, 315°, 0°) and left-anterior-oblique (LAO: 90°, 45°, 0°). Note: the chessboard is just for demonstration purposes, while in 2D/3D registration, the mask was applied for both 2DkV images and DRRs.
60
Abdominal and Pelvic Image Registration The 2D/3D image registration in abdominal and pelvic sites (L-spine) has the highest discrepancy, when compared with 3D/3D registration: 1.1±2.6 mm and -0.5°±1.9°, primarily resulting from different degrees of soft tissue involvement, deformation, and bone positioning variation. Discussion and Conclusion In this retrospective study, we have demonstrated that on-board 2DkV images can be used via 2D/3D registration to provide 6DOF for patient setup at the 4 major sites. Although on-board imaging can produce CBCT images for a 6-DOF setup, CBCT imaging exposes patients to a much higher dose of radiation and has a smaller FOV than orthogonal 2DkV imaging. We have evaluated 37 patients, 55 treatments, and 4 different anatomic sites and the discrepancy between 2D/3D and 3D/3D image registration was found to increase slightly from cranial to C-spine to T-spine to L-spine sites. As Table III shows, patient rotation is present within a range (2σ) of ~3° in extra-cranial cases and ~1° in intra-cranial cases using manual adjustment. Residual rotation can lead to potential adverse effects in dose delivery for tumor with irregular shape and/or nearby a critical structure. In the presence of rotation, manual registration relies on local bony structure for target localization, but this is subjective and user-dependent. Assessment of 2D/3D Registration Using 3D/3D Registration as Gold Standard Despite the restrictive fSRS or SBRT immobilization devices, inter- and intra-fractional, voluntary (within 1.0 mm) and involuntary (respiratory and digestive) motions are expected to occur between two imaging acquisitions. Therefore, possible anatomical differences between 2DkV and CBCT images are expected under clinical conditions, resulting in 2D/3D and 3D/3D registrations, as shown in Table I, Table II, and Figure 2. Thus, these results more likely represent the upper limits of uncertainty of the 2D/3D registration under the clinical conditions. In prospective studies, orthogonal image projections could be obtained from the CBCT scans to minimize the time gap to within 1 minute between imaging; however, such projections are lost in a retrospective study as the raw scanning data are not saved after 48 hours. The result from head phantom data as a control shows a better registration result in the absence of deformation (0.0±0.5mm and 0.1°±0.4°). It also illustrates that the importance of using the ideal alignment as initial guess in 2D/3D registration, as the accuracy and uncertainty are degraded to 0.5±1.1mm in translation while similar (0.2°±0.3°) in rotation, suggesting that a locally optimal result could occur. There is an intrinsic difference between 2D/3D and 3D/3D image registration: the contribution from soft tissue, which is more likely to be deformable. In 3D/3D registration, a bone density filter (200-1700 HU) was applied so that only bony structures were used for alignment, whereas 2D/3D registration is not equipped with such a filter. Although the W/L of both 2DkV and DRRs are manually adjusted for optimal visualization of the bony structure, some soft tissues are included in the registration, as shown in Figures 3 and 5. Soft tissue, which comes with dramatic contrast and possible motion, such as air in the bowels, heart-lung and diaphragm-lung interfaces, and skin surface, would deviate 2D/3D registration from bony alignment. In fact, we observed that the difference between 3D/3D registrations with and without the
61
bone density filter is around 0.2±0.2 mm or 0.1°±0.1° on average. This effect is patient and site dependent. Similar observations were reported before [52-54]. Deformation within the ROI plays a significant role in both 2D/3D and 3D/3D image registration. The head phantom results show the intrinsic uncertainty of the 2D/3D registration (0.5mm and 0.3°), which are better than patient results in the cranial site (1.6 mm and 1.2°). Because whole head is used as ROI in both phantom and patient cases, inclusion of lower jaw (Figure 3) elevates uncertainty from the differences in jaw position and associated soft tissue deformation in patient cases. Selective ROI definition can improve the accuracy [54, 55]. Furthermore, both 2D/3D and 3D/3D registrations are rigid and therefore not accurate in handling images deformed between simCT and pre-treatment CBCT or 2DkV. Thus, 3D/3D registration itself may not be completely reliable and accurate. In fact, the precision of 3D/3D registration is only 1.0 mm. Using CBCT/simCT registration as the gold standard has an uncertainty of at least 0.5 mm (half of the precision) in deformable anatomy. Although the deformation effect has been minimized as much as possible by masking out specific mobile structures, such as the arm and diaphragm (Figure 5), deformation is inevitable and will affect registration in both methods, causing patient-related discrepancies that go beyond method-related discrepancies [56]. This could explain the increasing discrepancy in sites from the head to abdomen/pelvis, as shown in Table I. Finally, the imaging isocenter between 2DkV and CBCT differs by 0.5 mm in our Trilogy machine, based on the Winston-Lutz test. Therefore, this intrinsic discrepancy also affects the difference between 2D/3D and 3D/3D registration, since the two imaging isocenters were not perfectly aligned.
Different Uncertainties in 2D/3D Registration for Different Anatomical Sites In a previous study [46, 47], a pig’s head with fiducial markers was used as a non-rigid phantom to assess this 2D/3D image registration and its accuracy was assessed based on FRE. A mean FRE of 1.3mm was reported, showing the absolute accuracy for fiducial matching. Although a different endpoint for comparison was chosen in this study, the standard deviation in head registration (0.2±1.6 mm and -0.4°±1.2° for cranial anatomy) is roughly on the same level. Head motion is minimized since the frameless stereotactic immobilization system was used to fix the patient for fSRS treatment [51], restricting head motion within a millimeter. For other treatment sites, SBRT immobilization utilizing a body cradle and an indexed box [57] was used. As the body immobilization decreases and mobility increases, the motion plays an increasing role from HN to the thorax and to the abdomen, which was observed from this registration study, as shown in Table I. Previously, we evaluated volumetric image registration in the thoracic and abdominal regions and observed a similar trend of increasing uncertainty in the direction of superior to inferior [54, 58, 59]. Drawing a mask to eliminate interference objects, including movable tissue and foreign devices, is essential for an accurate 2D/3D image registration, especially the non-axial bones and moving diaphragm. The registration dependency on ROI selection has been reported [54, 55]. In the thorax, the spine and rib cage have a fixed geometric relationship, except for slight breathing motion at anterior sides. Movable tissues, such as the humeral bone and diaphragm, were excluded from both 2DkV and CBCT images using masking and a small FOV, respectively, as shown in Figures 4 and 5. In the abdomen, the spine and iliac crest bone could be slightly twisted from the simulation position, causing more deformation. Moreover, air in the digestive tract produces high contrast and introduces substantial
62
image variations [56], which cannot be easily eliminated from 2DkV images. In addition, unlike the thorax where the lung density is low, the organs in the abdomen/pelvis are dense and contribute more pixel intensity in 2D/3D registration. Therefore, the difference between the 2D/3D and 3D/3D registrations in the abdominal site produced the largest deviations among all 4 sites (Table I).
Potential for Using On-Board 2DkV Imaging for 6-DOF Patient Setup This study shows the accuracy of 2D/3D registration is dependent on anatomic sites, due to the degree of deformation at each site and the inability of current 2D/3D registration to eliminate the contribution of pixel intensity from soft tissue. This deformation includes higher potential body motion in the body than cranial case, since the SBRT body cradle is less stringent than the fSRS immobilization device. The current 2D/3D registration is sensitive to the W/L of 2DkV images, which determines bone-to-soft-tissue contrast used in the registration. In the 2D/3D registration program, the CT greyscale was scaled down to 1 byte (0-255) from 2 bytes (0-4095) to match that of 2DkV. Further study toward implementing a pseudo-bone density filter for 2DkV imaging may be a key to improving the consistency between 2D/3D and 3D/3D registrations, while auto-masking could be implemented to automatically determine the ROI [60]. Deformation in the bony landmarks, however, is an intrinsic uncertainty for any rigid image registration and cannot be easily corrected. It is worthwhile to compare manual 3DOF and automatic 6DOF results (Table III). The noticeable difference between these two results suggests for the importance of rotational adjustment. In addition, under our clinical setup procedure for stereotactic treatment, the rotation factor is generally limited to within 3° on average in the 4 sites. Clinically, it is desirable to further minimize patient rotation at setup, and 2D/3D registration using on-board 2DkV has the potential to provide an imaging guidance alternative to CBCT for patient rotation correction. The current 2D/3D registration assumes that patient does not move between two orthogonal 2DkV imaging, which is 15-20 seconds apart. Respiratory motion will likely produces 2 2DkV images at different respiratory phases. Such involuntary motion affects soft tissues mostly, with some impacts on the anterior ribs, which are not fully accounted for in 2D/3D registration. In addition, it is critical to have automation in the 2D/3D registration pipeline, replacing the current manual preparation, to facilitate clinical workflow. This study has demonstrated that on-board 2DkV images can be used to achieve 6DOF image registration with an uncertainty of 1.5 mm and 1.2° for cranial anatomy in patients. A quantified difference between phantom and patient results demonstrates elevated the magnitude of uncertainty in clinical patient setup using 2D/3D registration. For the 4 anatomical sites, the uncertainty of 2D/3D registration increases from the superior to inferior sites, primarily due to patient anatomy. On-board 2DkV could be used to control the 6D couch for 6DOF patient setup via 2D/3D image registration, although there is room for further improvement.
63
References
1. Jaffray D, Kupelian P, Djemil T et al. Review of image-guided radiation therapy. Expert Review of Anticancer Therapy 2007; 7:89-103. 2. Li G, Mageras G, Dong L et al. Image-Guided Radiation Therapy. 3rd edn, Vol. Chapter 14 229-258 (Lippincott Williams & Wilkins, 2011). 3. Kim J, Jin JY, Walls N et al. Image-guided localization accuracy of stereoscopic planar and volumetric imaging methods for stereotactic radiation surgery and stereotactic body radiation therapy: a phantom study. Int J Radiat Oncol Biol Phys 2011; 79: 1588-1596. 4. Peng LC, Kahler D, Samant S et al. Quality assessment of frameless fractionated stereotactic radiotherapy using cone beam computed tomography. Int J Radiat Oncol Biol Phys 2010; 78: 1586-1593. 5. Murphy MJ. An automatic six-degree-of-freedom image registration algorithm for image-guided frameless stereotaxic radiosurgery. Med Phys 1997; 24: 857-866. 6. Adler JR, Jr., Murphy MJ, Chang SD et al. Image-guided robotic radiosurgery. Neurosurgery 1999; 44: 1299-1306. 7. Ma J, Chang Z, Wang Z et al. ExacTrac X-ray 6 degree-of-freedom image-guidance for intracranial non-invasive stereotactic radiotherapy: comparison with kilo-voltage cone-beam CT. Radiother Oncol 2009; 93: 602-608. 8. Lei S, Piel N, Oermann EK et al. Six-Dimensional Correction of Intra-Fractional Prostate Motion with CyberKnife Stereotactic Body Radiation Therapy. Frontiers in Oncology 2011; 1: 1-7. 9. Ackerly T, Lancaster CM, Geso M et al. Clinical accuracy of ExacTrac intracranial frameless stereotactic system. Med Phys 2011; 38: 5040-5048. 10. Wurm RE, Gum F, Erbel S et al. Image guided respiratory gated hypofractionated Stereotactic Body Radiation Therapy (H-SBRT) for liver and lung tumors: Initial experience. Acta Oncol 2006; 45: 881-889. 11. Jin JY, Yin FF, Tenn SE et al. Use of the BrainLAB ExacTrac X-Ray 6D system in image-guided radiotherapy. Medical Dosimetry 2008; 33: 124-134. 12. Verbakel WF, Lagerwaard FJ, Verduin AJ et al. The accuracy of frameless stereotactic intracranial radiosurgery. Radiother Oncol 2010; 97: 390-394. 13. Kim J, Wen N, Jin JY et al. Clinical commissioning and use of the Novalis Tx linear accelerator for SRS and SBRT. Journal of applied clinical medical physics / American College of Medical Physics 2012; 13: 3729. 14. Pawiro SA, Markelj P, Pernus F et al. Validation for 2D/3D registration: A new gold standard data set. Med Phys 2011; 38: 1481-1490. 15. Gendrin C, Markelj P, Pawiro SA et al. Validation for 2D/3D registration. II: The comparison of intensity- and gradient-based merit functions using a new gold standard data set. Med Phys 2011; 38: 1491-1502. 16. Birkfellner W, Wirth J, Burgstaller W et al. A faster method for 3D/2D medical image registration--a simulation study. Physics in Medicine and Biology 2003; 48: 2665-2679. 17. Spoerk J, Bergmann H, Wanschitz F et al. Fast DRR splat rendering using common consumer graphics hardware. Med Phys 2007; 34: 4302-4308. 18. Yenice KM, Lovelock DM, Hunt MA et al. CT image-guided intensity-modulated therapy for paraspinal tumors using stereotactic immobilization. Int J Radiat Oncol Biol Phys 2003; 55: 583-593. 19. Li G, Ballangrud A, Kuo LC et al. Motion monitoring for cranial frameless stereotactic radiosurgery using video-based three-dimensional optical surface imaging. Med Phys 2011; 38: 3981-3994. 20. Boswell S, Tome W, Jeraj R et al. Automatic registration of megavoltage to kilovoltage CT images in helical tomotherapy: an evaluation of the setup verification process for the special case of a rigid head phantom. Med Phys 2006; 33: 4395-4404.
64
21. Forrest LJ, Mackie TR, Ruchala K et al. The utility of megavoltage computed tomography images from a helical tomotherapy system for setup verification purposes. Int J Radiat Oncol Biol Phys 2004; 60: 1639-1644. 22. Li G, Xie H, Ning H et al. A feasibility study of image registration using volumetrically classified, motion-free bony landmarks in thoracic 4DCT images for image-guided patient setup. Int J Biomed Eng Tech 2012; 8: 259-273. 23. Ren L, Godfrey DJ, Yan H et al. Automatic registration between reference and on-board digital tomosynthesis images for positioning verification. Med Phys 2008; 35: 664-672. 24. Kim J, Kumar S, Liu C et al. A novel approach for establishing benchmark CBCT/CT deformable image registrations in prostate cancer radiotherapy. Physics in Medicine and Biology 2013; 58: 8077-8097. 25. Lovelock DM, Hua C, Wang P et al. Accurate setup of paraspinal patients using a noninvasive patient immobilization cradle and portal imaging. Med Phys 2005; 32: 2606-2614. 26. Li G, Xie H, Ning H et al. A novel 3D volumetric voxel registration technique for volume-view-guided image registration of multiple imaging modalities. Int J Radiat Oncol Biol Phys 2005; 63: 261-273. 27. Li G, Ning H, Brown A et al. Image Guided, Motion-free Patient Body Setup using 3D Volumetric Image Registration of Classified Stable Bony Landmarks Int J Radiat Oncol Biol Phys 2008; 72, S535. 28. Steininger P, Neuner M, Weichenberger H et al. Auto-masked 2D/3D image registration and its validation with clinical cone-beam computed tomography. Physics in Medicine and Biology 2012; 57: 4277-4292.

65
Chapter 6
Discussion and Future Directions, Summary
Modified from: Yang TJ, Tao R, Elkhuizen PHM et al. Tumor Bed Delineation for External Beam Accelerated Partial Breast Irradiation: A Systematic Review. Radiotherapy and Oncology 108(2): 181-9 (2013).
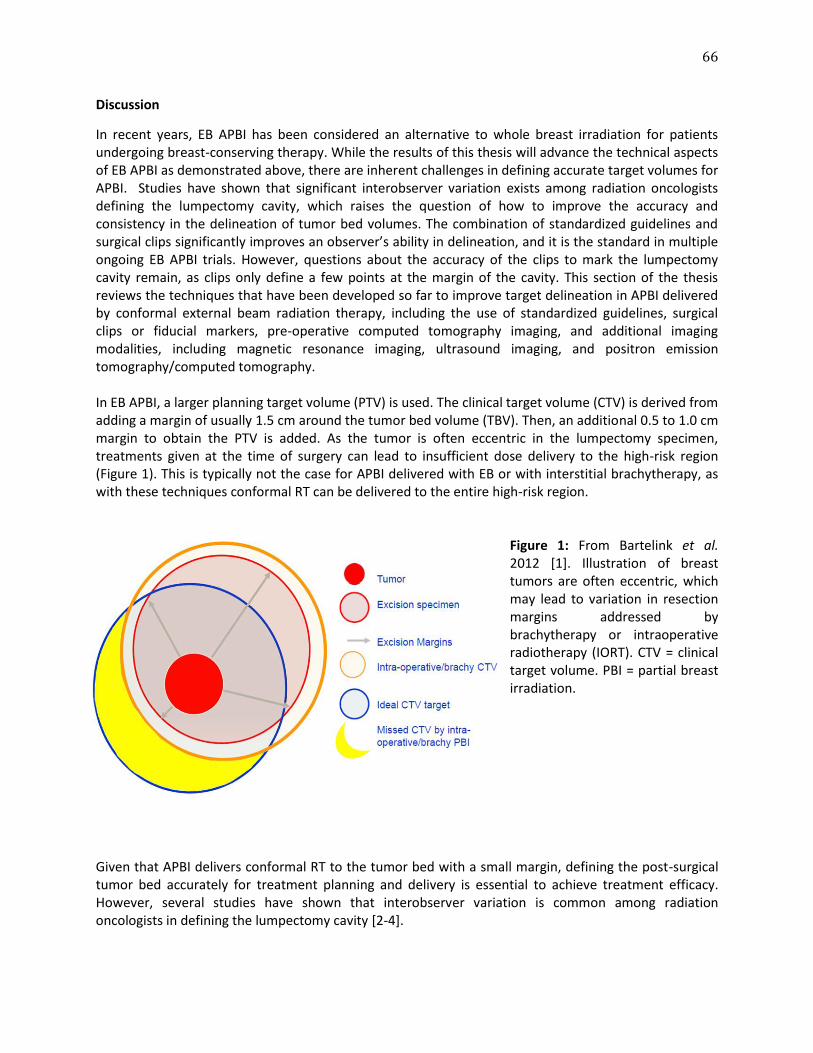
66
Discussion
In recent years, EB APBI has been considered an alternative to whole breast irradiation for patients undergoing breast-conserving therapy. While the results of this thesis will advance the technical aspects of EB APBI as demonstrated above, there are inherent challenges in defining accurate target volumes for APBI. Studies have shown that significant interobserver variation exists among radiation oncologists defining the lumpectomy cavity, which raises the question of how to improve the accuracy and consistency in the delineation of tumor bed volumes. The combination of standardized guidelines and surgical clips significantly improves an observer’s ability in delineation, and it is the standard in multiple ongoing EB APBI trials. However, questions about the accuracy of the clips to mark the lumpectomy cavity remain, as clips only define a few points at the margin of the cavity. This section of the thesis reviews the techniques that have been developed so far to improve target delineation in APBI delivered by conformal external beam radiation therapy, including the use of standardized guidelines, surgical clips or fiducial markers, pre-operative computed tomography imaging, and additional imaging modalities, including magnetic resonance imaging, ultrasound imaging, and positron emission tomography/computed tomography. In EB APBI, a larger planning target volume (PTV) is used. The clinical target volume (CTV) is derived from adding a margin of usually 1.5 cm around the tumor bed volume (TBV). Then, an additional 0.5 to 1.0 cm margin to obtain the PTV is added. As the tumor is often eccentric in the lumpectomy specimen, treatments given at the time of surgery can lead to insufficient dose delivery to the high-risk region (Figure 1). This is typically not the case for APBI delivered with EB or with interstitial brachytherapy, as with these techniques conformal RT can be delivered to the entire high-risk region.
Figure 1: From Bartelink et al. 2012 [1]. Illustration of breast tumors are often eccentric, which may lead to variation in resection margins addressed by brachytherapy or intraoperative radiotherapy (IORT). CTV = clinical target volume. PBI = partial breast irradiation.
Given that APBI delivers conformal RT to the tumor bed with a small margin, defining the post-surgical tumor bed accurately for treatment planning and delivery is essential to achieve treatment efficacy. However, several studies have shown that interobserver variation is common among radiation oncologists in defining the lumpectomy cavity [2-4].
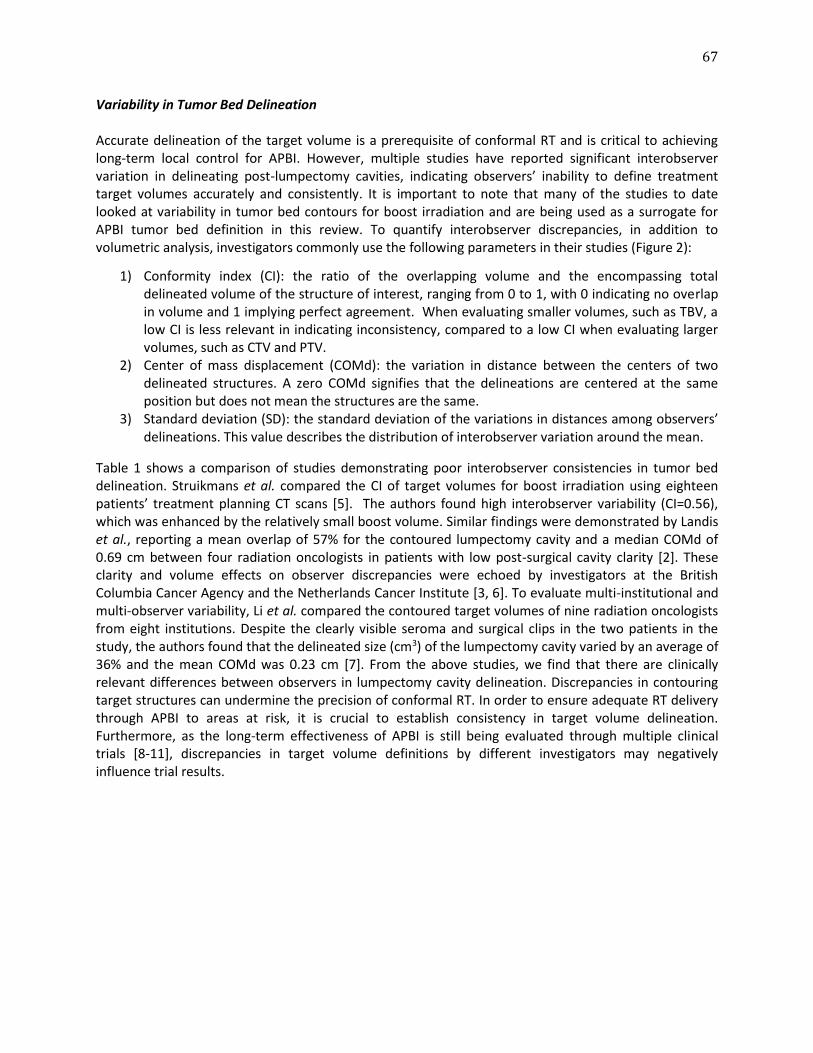
67
Variability in Tumor Bed Delineation Accurate delineation of the target volume is a prerequisite of conformal RT and is critical to achieving long-term local control for APBI. However, multiple studies have reported significant interobserver variation in delineating post-lumpectomy cavities, indicating observers’ inability to define treatment target volumes accurately and consistently. It is important to note that many of the studies to date looked at variability in tumor bed contours for boost irradiation and are being used as a surrogate for APBI tumor bed definition in this review. To quantify interobserver discrepancies, in addition to volumetric analysis, investigators commonly use the following parameters in their studies (Figure 2):
1) Conformity index (CI): the ratio of the overlapping volume and the encompassing total delineated volume of the structure of interest, ranging from 0 to 1, with 0 indicating no overlap in volume and 1 implying perfect agreement. When evaluating smaller volumes, such as TBV, a low CI is less relevant in indicating inconsistency, compared to a low CI when evaluating larger volumes, such as CTV and PTV.
2) Center of mass displacement (COMd): the variation in distance between the centers of two delineated structures. A zero COMd signifies that the delineations are centered at the same position but does not mean the structures are the same.
3) Standard deviation (SD): the standard deviation of the variations in distances among observers’ delineations. This value describes the distribution of interobserver variation around the mean.
Table 1 shows a comparison of studies demonstrating poor interobserver consistencies in tumor bed delineation. Struikmans et al. compared the CI of target volumes for boost irradiation using eighteen patients’ treatment planning CT scans [5]. The authors found high interobserver variability (CI=0.56), which was enhanced by the relatively small boost volume. Similar findings were demonstrated by Landis et al., reporting a mean overlap of 57% for the contoured lumpectomy cavity and a median COMd of 0.69 cm between four radiation oncologists in patients with low post-surgical cavity clarity [2]. These clarity and volume effects on observer discrepancies were echoed by investigators at the British Columbia Cancer Agency and the Netherlands Cancer Institute [3, 6]. To evaluate multi-institutional and multi-observer variability, Li et al. compared the contoured target volumes of nine radiation oncologists from eight institutions. Despite the clearly visible seroma and surgical clips in the two patients in the study, the authors found that the delineated size (cm3) of the lumpectomy cavity varied by an average of 36% and the mean COMd was 0.23 cm [7]. From the above studies, we find that there are clinically relevant differences between observers in lumpectomy cavity delineation. Discrepancies in contouring target structures can undermine the precision of conformal RT. In order to ensure adequate RT delivery through APBI to areas at risk, it is crucial to establish consistency in target volume delineation. Furthermore, as the long-term effectiveness of APBI is still being evaluated through multiple clinical trials [8-11], discrepancies in target volume definitions by different investigators may negatively influence trial results.
68
Figure 2: From Petersen et al. 2007 with authors’ permission [3]. (a) Illustration of the conformity index (CI) defined as a ratio of overlapping volume to encompassing delineated volume: representations of 0%, 50%, and 100% concordance. (b) Case demonstrating variation in seroma contouring by three observers. CI= conformity index. Methods for Improving Delineation Consistency Different approaches in improving delineation uniformity have been tested and used by various groups. Overall, these studies can be separated into four categories: utilization of standardized guidelines, surgical clips and/or fiducial markers, pre-operative CT scans, and additional imaging modalities in treatment planning. Many investigators used more than one of the above techniques in their studies. The results and limitations of each method are discussed in this section.
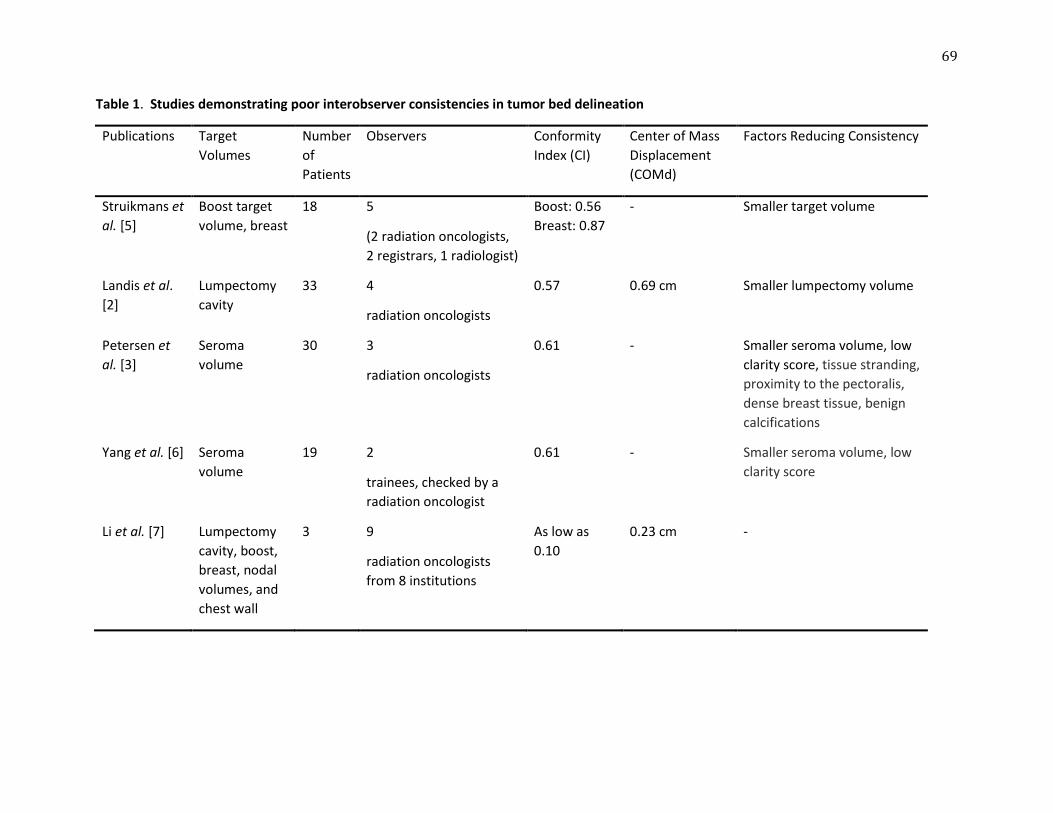
69
Table 1. Studies demonstrating poor interobserver consistencies in tumor bed delineation
Publications Target
Volumes
Number
of
Patients
Observers Conformity
Index (CI)
Center of Mass
Displacement
(COMd)
Factors Reducing Consistency
Struikmans et
al. [5]
Boost target
volume, breast
18 5
(2 radiation oncologists,
2 registrars, 1 radiologist)
Boost: 0.56
Breast: 0.87
- Smaller target volume
Landis et al.
[2]
Lumpectomy
cavity
33 4
radiation oncologists
0.57 0.69 cm Smaller lumpectomy volume
Petersen et
al. [3]
Seroma
volume
30 3
radiation oncologists
0.61 - Smaller seroma volume, low
clarity score, tissue stranding,
proximity to the pectoralis,
dense breast tissue, benign
calcifications
Yang et al. [6] Seroma
volume
19 2
trainees, checked by a
radiation oncologist
0.61 - Smaller seroma volume, low
clarity score
Li et al. [7] Lumpectomy
cavity, boost,
breast, nodal
volumes, and
chest wall
3 9
radiation oncologists
from 8 institutions
As low as
0.10
0.23 cm -
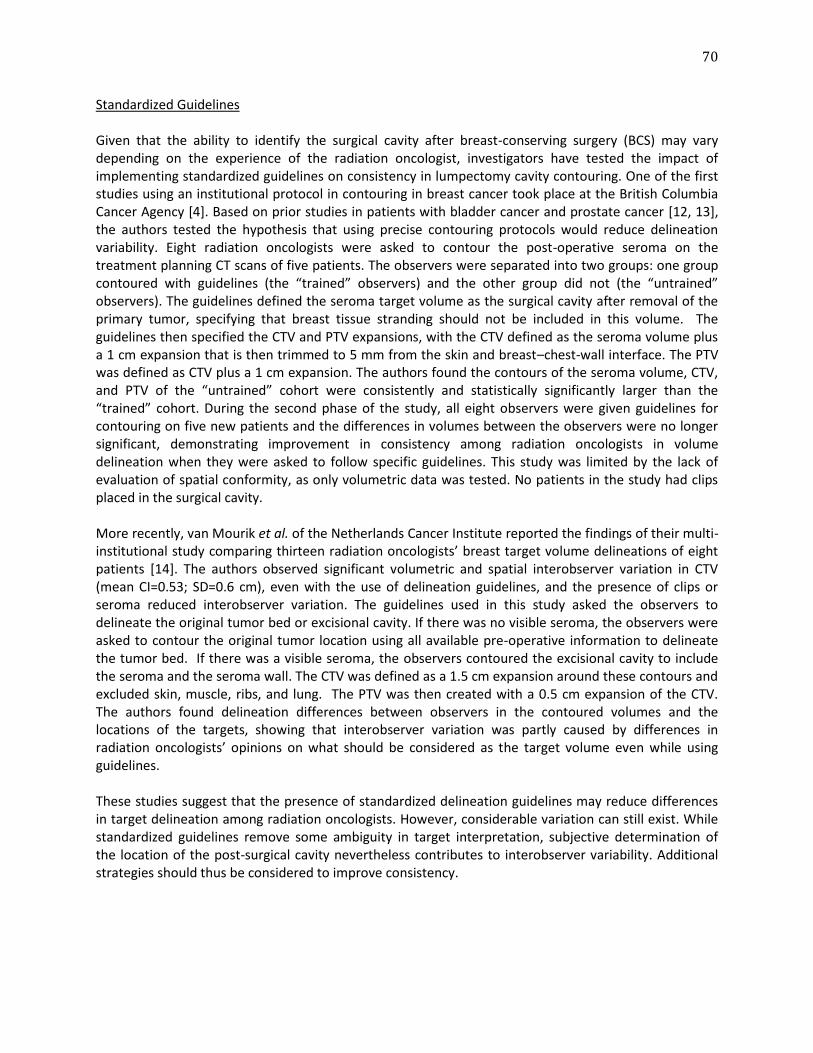
70
Standardized Guidelines Given that the ability to identify the surgical cavity after breast-conserving surgery (BCS) may vary depending on the experience of the radiation oncologist, investigators have tested the impact of implementing standardized guidelines on consistency in lumpectomy cavity contouring. One of the first studies using an institutional protocol in contouring in breast cancer took place at the British Columbia Cancer Agency [4]. Based on prior studies in patients with bladder cancer and prostate cancer [12, 13], the authors tested the hypothesis that using precise contouring protocols would reduce delineation variability. Eight radiation oncologists were asked to contour the post-operative seroma on the treatment planning CT scans of five patients. The observers were separated into two groups: one group contoured with guidelines (the “trained” observers) and the other group did not (the “untrained” observers). The guidelines defined the seroma target volume as the surgical cavity after removal of the primary tumor, specifying that breast tissue stranding should not be included in this volume. The guidelines then specified the CTV and PTV expansions, with the CTV defined as the seroma volume plus a 1 cm expansion that is then trimmed to 5 mm from the skin and breast–chest-wall interface. The PTV was defined as CTV plus a 1 cm expansion. The authors found the contours of the seroma volume, CTV, and PTV of the “untrained” cohort were consistently and statistically significantly larger than the “trained” cohort. During the second phase of the study, all eight observers were given guidelines for contouring on five new patients and the differences in volumes between the observers were no longer significant, demonstrating improvement in consistency among radiation oncologists in volume delineation when they were asked to follow specific guidelines. This study was limited by the lack of evaluation of spatial conformity, as only volumetric data was tested. No patients in the study had clips placed in the surgical cavity. More recently, van Mourik et al. of the Netherlands Cancer Institute reported the findings of their multi-institutional study comparing thirteen radiation oncologists’ breast target volume delineations of eight patients [14]. The authors observed significant volumetric and spatial interobserver variation in CTV (mean CI=0.53; SD=0.6 cm), even with the use of delineation guidelines, and the presence of clips or seroma reduced interobserver variation. The guidelines used in this study asked the observers to delineate the original tumor bed or excisional cavity. If there was no visible seroma, the observers were asked to contour the original tumor location using all available pre-operative information to delineate the tumor bed. If there was a visible seroma, the observers contoured the excisional cavity to include the seroma and the seroma wall. The CTV was defined as a 1.5 cm expansion around these contours and excluded skin, muscle, ribs, and lung. The PTV was then created with a 0.5 cm expansion of the CTV. The authors found delineation differences between observers in the contoured volumes and the locations of the targets, showing that interobserver variation was partly caused by differences in radiation oncologists’ opinions on what should be considered as the target volume even while using guidelines. These studies suggest that the presence of standardized delineation guidelines may reduce differences in target delineation among radiation oncologists. However, considerable variation can still exist. While standardized guidelines remove some ambiguity in target interpretation, subjective determination of the location of the post-surgical cavity nevertheless contributes to interobserver variability. Additional strategies should thus be considered to improve consistency.
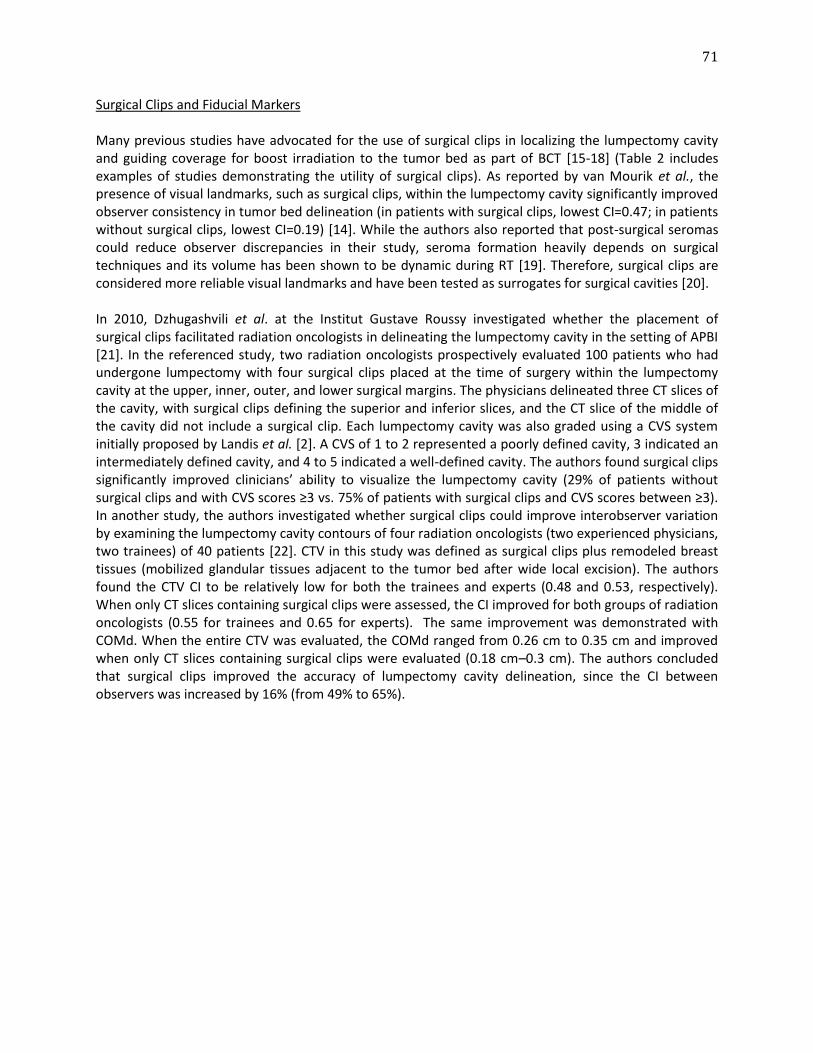
71
Surgical Clips and Fiducial Markers Many previous studies have advocated for the use of surgical clips in localizing the lumpectomy cavity and guiding coverage for boost irradiation to the tumor bed as part of BCT [15-18] (Table 2 includes examples of studies demonstrating the utility of surgical clips). As reported by van Mourik et al., the presence of visual landmarks, such as surgical clips, within the lumpectomy cavity significantly improved observer consistency in tumor bed delineation (in patients with surgical clips, lowest CI=0.47; in patients without surgical clips, lowest CI=0.19) [14]. While the authors also reported that post-surgical seromas could reduce observer discrepancies in their study, seroma formation heavily depends on surgical techniques and its volume has been shown to be dynamic during RT [19]. Therefore, surgical clips are considered more reliable visual landmarks and have been tested as surrogates for surgical cavities [20]. In 2010, Dzhugashvili et al. at the Institut Gustave Roussy investigated whether the placement of surgical clips facilitated radiation oncologists in delineating the lumpectomy cavity in the setting of APBI [21]. In the referenced study, two radiation oncologists prospectively evaluated 100 patients who had undergone lumpectomy with four surgical clips placed at the time of surgery within the lumpectomy cavity at the upper, inner, outer, and lower surgical margins. The physicians delineated three CT slices of the cavity, with surgical clips defining the superior and inferior slices, and the CT slice of the middle of the cavity did not include a surgical clip. Each lumpectomy cavity was also graded using a CVS system initially proposed by Landis et al. [2]. A CVS of 1 to 2 represented a poorly defined cavity, 3 indicated an intermediately defined cavity, and 4 to 5 indicated a well-defined cavity. The authors found surgical clips significantly improved clinicians’ ability to visualize the lumpectomy cavity (29% of patients without surgical clips and with CVS scores ≥3 vs. 75% of patients with surgical clips and CVS scores between ≥3). In another study, the authors investigated whether surgical clips could improve interobserver variation by examining the lumpectomy cavity contours of four radiation oncologists (two experienced physicians, two trainees) of 40 patients [22]. CTV in this study was defined as surgical clips plus remodeled breast tissues (mobilized glandular tissues adjacent to the tumor bed after wide local excision). The authors found the CTV CI to be relatively low for both the trainees and experts (0.48 and 0.53, respectively). When only CT slices containing surgical clips were assessed, the CI improved for both groups of radiation oncologists (0.55 for trainees and 0.65 for experts). The same improvement was demonstrated with COMd. When the entire CTV was evaluated, the COMd ranged from 0.26 cm to 0.35 cm and improved when only CT slices containing surgical clips were evaluated (0.18 cm–0.3 cm). The authors concluded that surgical clips improved the accuracy of lumpectomy cavity delineation, since the CI between observers was increased by 16% (from 49% to 65%).
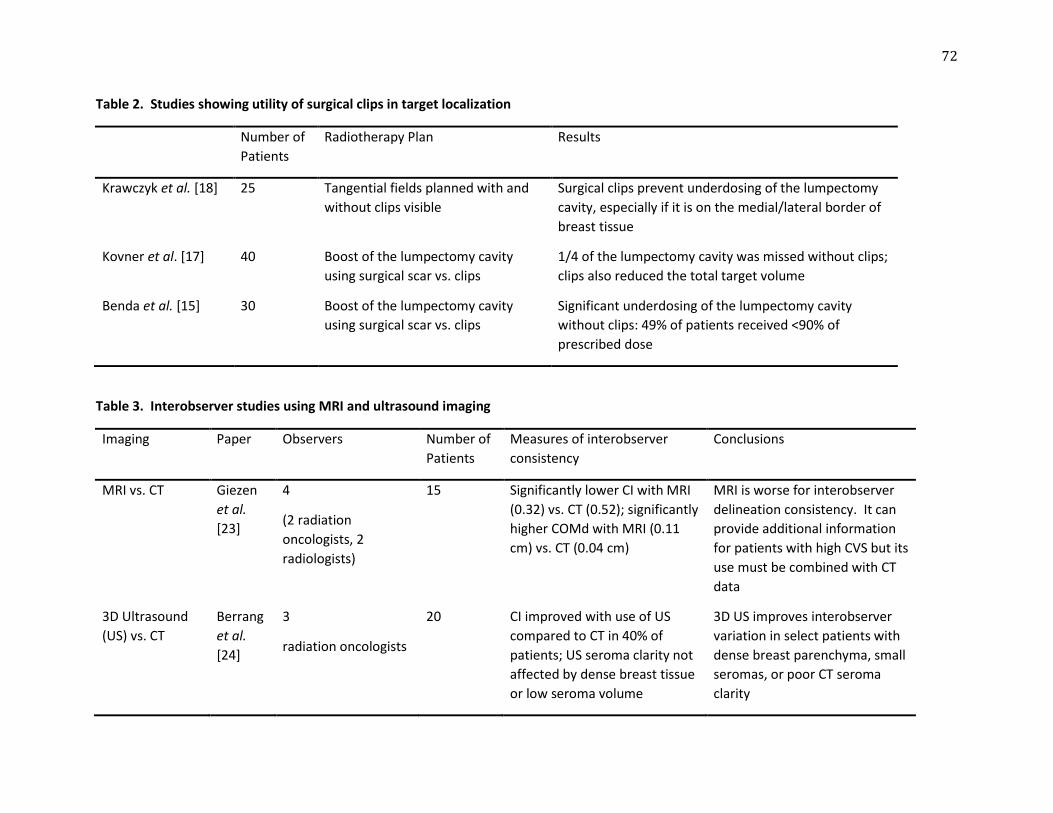
72
Table 2. Studies showing utility of surgical clips in target localization
Number of
Patients
Radiotherapy Plan Results
Krawczyk et al. [18] 25 Tangential fields planned with and
without clips visible
Surgical clips prevent underdosing of the lumpectomy
cavity, especially if it is on the medial/lateral border of
breast tissue
Kovner et al. [17] 40 Boost of the lumpectomy cavity
using surgical scar vs. clips
1/4 of the lumpectomy cavity was missed without clips;
clips also reduced the total target volume
Benda et al. [15] 30 Boost of the lumpectomy cavity
using surgical scar vs. clips
Significant underdosing of the lumpectomy cavity
without clips: 49% of patients received <90% of
prescribed dose
Table 3. Interobserver studies using MRI and ultrasound imaging
Imaging Paper Observers Number of
Patients
Measures of interobserver
consistency
Conclusions
MRI vs. CT Giezen
et al.
[23]
4
(2 radiation
oncologists, 2
radiologists)
15 Significantly lower CI with MRI
(0.32) vs. CT (0.52); significantly
higher COMd with MRI (0.11
cm) vs. CT (0.04 cm)
MRI is worse for interobserver
delineation consistency. It can
provide additional information
for patients with high CVS but its
use must be combined with CT
data
3D Ultrasound
(US) vs. CT
Berrang
et al.
[24]
3
radiation oncologists
20 CI improved with use of US
compared to CT in 40% of
patients; US seroma clarity not
affected by dense breast tissue
or low seroma volume
3D US improves interobserver
variation in select patients with
dense breast parenchyma, small
seromas, or poor CT seroma
clarity
73
A limitation of surgical clips is that they may not be easily identified on portal images. Because of this, gold fiducial markers have been used because they have the advantage of better visibility, which allows for tracking the lumpectomy cavity during RT through image guidance [25]. Shaikh et al. recently investigated whether gold fiducial markers would improve interobserver accuracy in surgical cavity delineation in the setting of APBI [26]. In the referenced study, 22 patients were enrolled and eleven of them received four to six gold fiducial markers during lumpectomy. The post-lumpectomy cavities, CTV, and PTV were contoured independently by three radiation oncologists. Before defining the tumor bed, the physicians were required to give each tumor bed a CVS according to guidelines established by Smitt et al. [27]. The authors found that a physician’s ability to visualize the cavity significantly improved with fiducial markers (mean CVS=2.5 without markers vs. 3.6 with markers). Also significantly improved, as compared to patients without gold fiducial markers, were the mean CTV CI (0.43 without markers vs. 0.70 with markers; p < 0.0001) and COMd (0.56 cm vs. 0.24 cm; p < 0.001), indicating that physicians were able to identify the lumpectomy cavity more consistently. Although visual landmarks, such as surgical clips and gold fiducial markers, are able to improve consistency in lumpectomy cavity delineation, their accuracy in representing the original tumor site is a matter of debate. Yang et al. recently reported that surgical clips are not always consistent with the tumor bed’s edge and therefore, may not accurately represent the original tumor site. The authors demonstrated that the seroma on CT scans can extend beyond clips by 0.5 cm [28]. Similar findings were reported by Goldberg et al. [29], who found that the lumpectomy cavity on CT scans exceeded the clips by 0.7 cm medially. These results suggest that the standardization of clip placement should be considered as an important part of surgical protocol to ensure RT accuracy. It is important to keep in mind that each surgical clip marks only a single point within the surgical bed, requiring observers to interpolate the border of the cavity, which can contribute to inaccuracy in target delineation. In some cases, the clips may be placed beyond of the edges of the tumor bed, as surgeons may manipulate them into more structurally stable tissue. For gold seeds, the standard gold seed applicator buries the seed into the tissue, rather than placing it at the immediate edge of the tissue. Furthermore, surgical clips and fiducial markers may help define the border of the excised tissue, but they do not give us any information concerning the distance of the tumor from the border, as the location of the tumor within the excised specimen varies among patients, leading to variable margins [1]. Pre-operative CT Scan The use of a pre-operative CT scan in the RT treatment position matched with a post-operative treatment planning CT scan to guide clinicians in identifying lumpectomy cavities was first described by Kirova et al. [30] The pre-surgical CT scan was performed 1 week prior to BCS with the administration of intravenous contrast and the postsurgical CT scan was performed 4 to 5 weeks after lumpectomy. Rigid image registration was then performed, matching different types of anatomical structures. The primary tumor was seen and delineated on the pre-operative CT scan (gross tumor volume [GTV]), and a region including surgical clips and the GTV was then contoured on the post-operative CT scan and was defined as the CTV. While the authors demonstrated the feasibility of identifying post-lumpectomy treatment volumes after registration of the pre- and post-operative CT scans, the influence of the pre-operative CT on delineation was not analyzed in this study. More recently, the use of deformable registration of pre- and post-operative CT scans has been shown to add value in defining the post-operative tumor bed, especially in the setting of oncoplastic surgery, where the breast tissue can be remodeled extensively [31].
74
In a multi-institutional study, Boersma et al. investigated whether using contrast-enhanced pre-operative CT scanning in combination with a standardized delineation protocol could decrease interobserver variation in boost irradiation target volumes. The CT images of 26 patients enrolled in the study were contoured by five radiation oncologists [32]. First, the observers contoured the TBV and the CTV (1.5 cm expansion of TBV) on the post-operative planning CT scan. Then, they contoured the tumor on the pre-operative CT scan (GTV). The observers were presented with anatomy-matched scans of the pre-operative CT showing the GTV and the post-operative planning CT showing the TBV and CTV. With pre-operative volume data, the observers were asked to adjust the TBV and CTV delineations for each patient as needed. The authors found that using pre-operative CT as part of CTV delineation resulted in smaller mean boost-CTVs (a decrease from 42 cc to 36 cc; p=0.005) and a significant but modest reduction of the COMd of the CTV delineations (from 1.1 cm to 1.0 cm; p < 0.001), without significant change in CI and SD. The authors concluded that incorporating pre-operative CT scans in tumor bed delineation, in addition to standardized guidelines, resulted in a significant reduction of interobserver variation. Interestingly, the authors reported a low mean CI in the study (0.36), which was attributed to ambiguity in standardized guidelines regarding excision cavity delineation. As the CI is highly dependent on the absolute volume, a low CI value could also be attributed to the small volumes reported in the study. Although the addition of pre-operative CT scans to standardized guidelines in tumor bed delineation appears to further reduce interobserver discrepancy, there are limitations to this method. First, not all breast tumors can be reliably and easily identified on the pre-operative CT scan. In the multi-institutional study cited above, one observer had difficulty identifying the correct GTV on three patients. Second, because of different surgical margins used, the relationship between the tumor volume and TBV may vary. Third, due to post-surgical breast changes, it can often be difficult to reliably match the pre- and post-operative CT scans through rigid registration. While the pre-operative tumor information is a good reference, it is still important to consider other techniques in helping clinicians to dependably identify the post-operative tumor bed to ensure that APBI is accurately delivered. Additional Imaging Modalities As shown in several studies, interobserver variation in lumpectomy cavity delineation on CT scan is heavily influenced by the clarity of the surgical cavity [2, 21], and visual landmarks within the surgical bed improve delineation consistency [6, 14]. For patients with poor seroma clarity or dense breast parenchyma, it is particularly challenging to differentiate the tumor bed from normal breast tissue, given the lack of contrast seen on CT scans [3]. Several investigators have addressed the use of additional imaging modalities, either in conjunction with CT or direct comparison against CT for better defining the lumpectomy cavity. Magnetic resonance imaging (MRI), ultrasound (US), and positron emission tomography (PET) are means to provide images of soft tissue definition and inflammatory changes around the surgical site, which would be useful in defining the tumor bed. Using deformable registration to guide observers in tumor bed definition is an ongoing area of research. MR Imaging: In 2008, Whipp et al. investigated the appearances of post-operative cavities in 100 women who underwent BCS using MRI and found the cavities tend to be heterogeneous in signal, suggesting the formation of granulation tissue and that the true boundary of the surgical cavity may be outside the seroma–tissue interface. Thus, they proposed that an MRI scan may be superior to a CT
75
scan in defining the tumor bed [33]. To investigate whether the addition of MRI to CT and surgical clips improves delineation, Kirby et al. enrolled 30 patients with 6 to 12 titanium clips placed in the excision cavity at the time of BCS and who underwent CT followed by MRI [34]. The lumpectomy cavity was first delineated on the CT scan and then, on the MRI at least 2 weeks later by a single observer. The MRI- and CT-defined TBVs were then fused using regions of interest corresponding to the midpoint of each surgical clip to create a single MRCT-defined lumpectomy cavity. The CTV was created by adding a 1.5 cm margin to the tumor bed. The authors found a CI of 0.54 between CT and MRCT for the tumor bed and 0.84 for the CTV, concluding that intra-observer variation in tumor bed delineation was significantly higher with CT scan. However, the resulting clinical target volumes were sufficiently in concordance, as the expansion of the margin resulted in larger volumes and an increase in CI. Given these findings, the authors did not feel the addition of MRI to CT and surgical clips would be needed in tumor bed delineation for APBI. More recently, interobserver variability in delineating the lumpectomy cavity using MRI and CT scans was evaluated by Giezen et al. [23]. In their study, fifteen patients underwent RT treatment planning CT scans and immediately afterward, an MRI scan was performed in the treatment position. Four observers (two radiation oncologists and two radiologists) assessed the CVS according to Smitt et al. [27] and delineated the lumpectomy cavity on each scan. Two patients did not receive surgical clips at the time of BCS and the rest of the patients had 4 to 6 clips placed within the tumor bed. The authors found that MRI resulted in a significantly lower CI (0.32 for MRI vs. 0.52 for CT) and higher COMd (0.11 cm with MRI vs. 0.04 cm with CT). They also found that MRI was inadequate in tumor bed localization in the setting of low CVS as surgical clip visibility on MRI was too low. The authors concluded that MRI added no further information to CT for patients with low CVS and while MRI may provide more information for patients with high CVS, it must be combined with CT/surgical clip data for optimal tumor bed delineation. Ultrasound Imaging: In 2000, Robinovitch et al. published one of the earliest studies using 2-dimensional ultrasound (2D US) in visualizing the lumpectomy cavity [35]. The authors compared surgical bed dimensions determined by US to that determined by the evaluation of plain film of 5 to 6 surgical clips and found measurements derived by US were significantly smaller than that derived of clips. The authors concluded that US is highly inaccurate in identifying the lumpectomy cavity. Conflicting results were found by Ringash et al., where the authors reported that US localization in lumpectomy cavities was adequate in 65% of patients and that it could be used when surgical clips are not available [36]. A major disadvantage of these studies was that no 3D imaging was used in the visualization of the tumor bed. In 2007, Coles et al. conducted a direct comparison of tumor bed delineation of 3D US co-registered with CT, 2D US and CT, surgical clips and CT, and CT alone [37]. Confirming previous findings, the authors found US (both 2D and 3D) showed a smaller lumpectomy cavity volume than surgical clips, possibly due to tissue changes at the edge of the cavity. Clips could also be pushed into the breast tissue, leading to an increased volume marked by clips. It was concluded that US, compared with the use of surgical clips and CT for localization, defines different volumes as post-surgical remodeling occurs. Interobserver consistency in lumpectomy delineation using US was evaluated at the British Columbia Cancer Agency [24]. After BCS, twenty patients underwent 3D US and treatment planning CT, and three radiation oncologists contoured the post-operative seroma on each image set. The authors found that, compared to CT alone, the addition of 3D US was associated with a higher CI in 40% of cases, especially in patients with low seroma clarity on CT alone and extremely dense breast parenchyma. Use of 3D US may be useful in improving interobserver variation in selected patients. However, if surgical clips on CT scan are considered the gold standard, US may underestimate the TBV, as demonstrated above (Table 3 summarizes the two interobserver studies for US and MRI).
76
PET/CT Imaging: In 2008, Ford et al. at Johns Hopkins University [38] first used this imaging technique for lumpectomy cavity definition. Since [18F]-fluorodeoxyglucose (FDG) uptake in PET/CT has been shown to be high in areas with inflammatory cell response [39, 40], the authors hypothesized that the lumpectomy cavity, due to surgery, would exhibit inflammation and, therefore, result in greater FDG uptake. Twelve patients were enrolled in their study with a median time from surgery to PET/CT of 49 days. The lumpectomy cavity was contoured on the CT scan by a radiation oncologist and on the PET/CT scan by both a radiation oncologist and nuclear medicine physician. The authors found the lumpectomy cavity was visualized well on PET/CT, but the PET/CT volumes were larger than the CT volumes in all patients (median ratio, 1.68). It is unclear if the PET/CT contour is more representative of the actual extent of the lumpectomy cavity or if it is due to peri-surgical inflammation. The authors concluded that TBV would likely be overestimated using PET/CT. However, to date, there is no study evaluating interobserver variations using these imaging methods. Alternatives to Post-lumpectomy Radiation In order to eliminate issues of inaccurate lumpectomy cavity delineation and interobserver variability, trials with APBI using pre-operative EBRT followed by BCS are currently recruiting at various institutions [41, 42]. At a trial at the Netherlands Cancer Institute, patients with early-stage breast cancer first undergo a 12-day course of APBI and then, the lumpectomy six weeks later. The extent of the primary tumor is identified on treatment planning imaging, thus eliminating the question as to what extent of the post-surgical cavity represents the primary tumor location. Although the accuracy of CT-defined tumor volume compared to MRI or US requires more investigation, a comparative study on 41 patients with early-stage breast cancer by Nichols et al. showed that the PTV delineated from pre-lumpectomy CT was consistently smaller than that delineated from post-lumpectomy CT [43]. Furthermore, the type of surgical closure technique can influence the post-operative TBV. Therefore, using pre-lumpectomy PTV for EB APBI will lead to smaller treatment volumes and, possibly, improved long-term cosmetic outcome. The drawback of treating patients with pre-operative RT is that there is the potential to delay definitive surgical management and that radiation can cause tissue changes that render surgery more difficult. Although a novel approach can potentially change the treatment of early-stage breast cancer, this shift in paradigm needs to be validated with the long-term outcome that has already been established for the current paradigm of BCS followed by adjuvant radiation. Palta et al. recently conducted a dosimetric study of single-fraction pre-operative APBI by creating virtual plans for seventeen patients with unifocal stage T1 breast cancer [41]. A contrast-enhanced MRI was used for treatment planning with the preoperative tumor defined as the GTV. CTV was a 1.5 cm expansion around the GTV, and PTV was created as a uniform 3 mm expansion of CTV minus the first 5 mm of the subcutaneous tissue. The prescription dose to the PTV was 15 Gy. Compared to 27 postoperative PBI patients, the V100% and V50% (defined as the volume that receives more than the percentage of the stated dose) were approximately 4 folds smaller in the pre-operative APBI. The authors conclude that, in addition to accurate coverage of the target volume, significant normal breast tissue sparing was achieved. A prospective phase I trial is ongoing to evaluate this technique.
77
Interfractional Variations In addition to improving the accuracy and consistency in tumor bed delineation, it is also important to use modern image guidance techniques to minimize interfractional variations of EB APBI treatments. The lumpectomy tumor bed is dynamic and shrinks post-surgically. Studies have shown that that the lumpectomy cavity stabilizes approximately eight weeks post-operatively [19, 44], and radiotherapy was found to hinder seroma reduction. These results suggest that redefining target volumes and modifying treatment plans is needed during breast irradiation, especially for EB APBI, to appropriately determine the post-operative target volume. The change in the post-operative cavity can significantly impact the target volume for EB APBI, leading to risk of overtreatment of normal tissue causing long-term toxicities, such as fibrosis. The dosimetric impact of tumor bed shrinkage has been demonstrated in boost irradiation, and simultaneous integrated boost not accounting for lumpectomy volume decrease overtime often results in significantly larger irradiated volume as compared to sequential boost [45]. On-board cone-beam CT (CBCT) is effective in monitoring seroma reduction overtime, especially in patients with seroma clarity of 3 or greater on the treatment planning CT [6]. Therefore, for patients undergoing EB APBI, CBCT can be used and should be recommended to monitor tumor bed changes. If significant volume change is observed during EB APBI, then the treatment plan should be modified to reflect the change to allow for most accurate treatment delivery. In addition to aiding the ability to monitor seroma reduction, CBCT is also instrumental in improving patient setup through 3D anatomical matching, therefore significantly reducing setup variations between fractions of EB APBI. At institutions where CBCT is not available as an image guidance technique for EB APBI, on-board orthogonal kilovoltage images obtained at each treatment registered with treatment planning CT (2D/3D registration) has been shown to be a promising approach in substituting CBCT in providing setup accuracy. Matching to thoracic spine and boney anatomy, Li et al. showed that when registered with treatment planning CT, 2D-kV orthogonal images used for patient setups resulted in differences of 0.2 ± 1.6mm in translation -0.7 ± 1.1° in rotation among 5 patients receiving thoracic spine irradiation over 11 treatment fractions [46]. Given that CBCT may not be routinely available in the United States for breast irradiation, frequently due to lack of insurance coverage, using orthogonal 2D-kV imaging for setup should be prospectively investigated. This is currently in development at Memorial Sloan Kettering Cancer Center, which 2D/3D registration using boney anatomy and surgical clips will be performed prospectively for patients undergoing EB APBI. Future Directions and Recommendations So far, four general strategies have been investigated to reduce interobserver discrepancies among radiation oncologists. These approaches improve the consistency of tumor bed delineation, but each has its own limitations. A delineation guideline is designed to be implemented by individual clinicians with their own interpretation and judgment and, therefore, the results can be subjective. Surgical clips are often regarded as a clinical standard, but there are questions concerning their accuracy in defining the lumpectomy cavity, as clips only define a few points around the cavity’s border, which is highly deformable, and require subjective interpolation, resulting in delineation inaccuracies. Multimodal imaging only detects tumor bed surrogates, such as the original tumor in pre-operative CT, electromagnetic features of the tumor bed in MRI, seroma in the lumpectomy cavity in US, and inflammatory tissue around the excision site in PET. These surrogates may not necessarily represent the true tumor bed, and as a consequence, the size of the TBV delineated from these images varies with the imaging modalities [24, 34, 37, 43, 47].
78
The current standard in multiple ongoing trials use the combination of standardized guidelines and surgical clips or fiducial markers to improve an observer’s ability in delineation and observers consistency [14]. At Memorial Sloan Kettering Cancer Center, this strategy was adopted in tumor bed delineation for APBI. However, these strategies do not necessarily address the accuracy of tumor bed definition. While some studies have correlated pathology to multimodal imaging [47-49] and others have addressed inter-/intra-fractional TBV variations [10, 50-52], these studies mostly focus on tumor bed margins required for EB APBI and have been conducted with small patient series. There is a need for a systemic, multidisciplinary investigation involving radiology, surgery, pathology, radiation oncology, and medical physics. First, it is important to find out what is the most appropriate pre-operative imaging modality in defining the tumor extended by pathologic correlation. A direct comparison of pre-operative imaging to tumor involvement in the lumpectomy specimen is required. Second, surgical techniques can heavily influence the shape and size of the lumpectomy cavity, studies are required to better define the benefit in the standardization of surgical clip placement. Furthermore, as clips can be displaced with the expansion and contraction of the surgical bed, studies correlating intraoperative imaging and serial post-operative imaging may be valuable to better understand clip displacement before treatment planning. Lastly, a need for further investigations in deformable image registration to aid physicians in better defining the most appropriate treatment volume was demonstrated. It is currently a challenge to reliably utilize deformable image registration techniques to register images of two different imaging modalities, such as CT and MRI [52-54], possibly due to the lack of internal landmarks in breast imaging to serve as anchor points for deformable registration. Additional work is required to produce dependable results with deformable image registration for physicians to compare pre-operative tumor volume with post-operative TBV and treatment planning volume.
As APBI continues to gain popularity, accurate definition of the lumpectomy cavity is crucial. EB APBI is being investigated in multiple ongoing studies. As interobserver variability is indicative of observers’ abilities to accurately define the treatment target volumes, variation in tumor bed delineation can potentially influence the results of the ongoing trials. Using surgical clips placed in the lumpectomy cavity at the time of BCS to guide tumor bed delineation on CT is the method of choice in ongoing APBI studies [9-11]. Although a similar CTV margin is being used in the ongoing trials (1.5 cm), the expansion of CTV to PTV varies (0.5-1.5 cm) [46]. In addition to improving tumor bed delineation accuracy and reproducibility, the optimal margin required for CTV and PTV for EB APBI continues to be an area of active investigation. As stated above, a tumor is often eccentric in a lumpectomy specimen. Studies correlating tumor bed and the original tumor location may help clinicians better understand whether a concentric expansion of the lumpectomy cavity is suitable in defining the clinical target volume, and studies of various 2D and 3D image guidance techniques for EB APBI delivery may provide further insight on the appropriate margin needed for PTV to account for daily setup variations. Concluding Remarks In summary, this thesis has demonstrated that the postoperative tumor bed volume changes significantly after breast conserving surgery. This change impacts the amount of normal breast tissue included in the EB APBI treatment volume and influences treatment dosimetry considerable. CBCT is an effective method in monitoring tumor bed changes during breast irradiation, and 2D KV imaging has been developed and is being tested as a surrogate for CBCT for patient positioning with relation to lumpectomy cavity to detect changes. In addition, observer variability in tumor bed delineation was

79
recognized as a significant variable in the accurate delivery of image-guided EB APBI. Standardized guidelines coupled with CT/surgical clips remains the current gold standard in limiting observers’ variability. Nonetheless, this approach may be insufficient in specific patients, such as those with a closed cavity. Further investigations are needed to explore approaches for specific patient populations, and the integration of MRI or US in addition to CT/surgical clips may be beneficial for those with dense breast parenchyma or poorly visualized cavities.
80
References
1. Bartelink H, Bourgier C, Elkhuizen P. Has partial breast irradiation by IORT or brachytherapy been prematurely introduced into the clinic? Radiother Oncol 2012; 104: 139-142. 2. Landis DM, Luo W, Song J et al. Variability among breast radiation oncologists in delineation of the postsurgical lumpectomy cavity. Int J Radiat Oncol Biol Phys 2007; 67: 1299-1308. 3. Petersen RP, Truong PT, Kader HA et al. Target volume delineation for partial breast radiotherapy planning: clinical characteristics associated with low interobserver concordance. Int J Radiat Oncol Biol Phys 2007; 69: 41-48. 4. Wong EK, Truong PT, Kader HA et al. Consistency in seroma contouring for partial breast radiotherapy: impact of guidelines. Int J Radiat Oncol Biol Phys 2006; 66: 372-376. 5. Struikmans H, Warlam-Rodenhuis C, Stam T et al. Interobserver variability of clinical target volume delineation of glandular breast tissue and of boost volume in tangential breast irradiation. Radiother Oncol 2005; 76: 293-299. 6. Yang TJ, Minkema D, Elkhuizen PH et al. Clinical applicability of cone-beam computed tomography in monitoring seroma volume change during breast irradiation. Int J Radiat Oncol Biol Phys 2010; 78: 119-126. 7. Li XA, Tai A, Arthur DW et al. Variability of target and normal structure delineation for breast cancer radiotherapy: an RTOG Multi-Institutional and Multiobserver Study. Int J Radiat Oncol Biol Phys 2009; 73: 944-951. 8. Herskind C, Wenz F. Radiobiological comparison of hypofractionated accelerated partial-breast irradiation (APBI) and single-dose intraoperative radiotherapy (IORT) with 50-kV X-rays. Strahlenther Onkol 2010; 186: 444-451. 9. Park SS, Grills IS, Chen PY et al. Accelerated partial breast irradiation for pure ductal carcinoma in situ. Int J Radiat Oncol Biol Phys 2011; 81: 403-408. 10. Wong P, Muanza T, Reynard E et al. Use of three-dimensional ultrasound in the detection of breast tumor bed displacement during radiotherapy. Int J Radiat Oncol Biol Phys 2011; 79: 39-45. 11. Yeo SG, Kim J, Kwak GH et al. Accelerated partial breast irradiation using multicatheter brachytherapy for select early-stage breast cancer: local control and toxicity. Radiat Oncol 2010; 5: 56. 12. Berthelet E, Liu MC, Agranovich A et al. Computed tomography determination of prostate volume and maximum dimensions: a study of interobserver variability. Radiother Oncol 2002; 63: 37-40. 13. Logue JP, Sharrock CL, Cowan RA et al. Clinical variability of target volume description in conformal radiotherapy planning. Int J Radiat Oncol Biol Phys 1998; 41: 929-931. 14. Van Mourik AM, Elkhuizen PH, Minkema D et al. Multiinstitutional study on target volume delineation variation in breast radiotherapy in the presence of guidelines. Radiother Oncol 2010; 94: 286-291. 15. Benda RK, Yasuda G, Sethi A et al. Breast boost: are we missing the target? Cancer 2003; 97: 905-909. 16. Harrington KJ, Harrison M, Bayle P et al. Surgical clips in planning the electron boost in breast cancer: a qualitative and quantitative evaluation. Int J Radiat Oncol Biol Phys 1996; 34: 579-584. 17. Kovner F, Agay R, Merimsky O et al. Clips and scar as the guidelines for breast radiation boost after lumpectomy. Eur J Surg Oncol 1999; 25: 483-486. 18. Krawczyk JJ, Engel B. The importance of surgical clips for adequate tangential beam planning in breast conserving surgery and irradiation. Int J Radiat Oncol Biol Phys 1999; 43: 347-350. 19. Yang TJ, Elkhuizen PH, Minkema D et al. Clinical factors associated with seroma volume reduction in breast-Conserving Therapy for early-stage breast cancer: a multi-institutional analysis. Int J Radiat Oncol Biol Phys 2010; 76: 1325-1332.
81
20. Weed DW, Yan D, Martinez AA et al. The validity of surgical clips as a radiographic surrogate for the umpectomy cavity in image-guided accelerated partial breast irradiation. Int J Radiat Oncol Biol Phys 2004; 60: 484-492. 21. Dzhugashvili M, Pichenot C, Dunant A et al. Surgical clips assist in the visualization of the lumpectomy cavity in three-dimensional conformal accelerated partial-breast irradiation. Int J Radiat Oncol Biol Phys 2010; 76: 1320-1324. 22. Dzhugashvili M, Tournay E, Pichenot C et al. 3D-conformal accelerated partial breast irradiation treatment planning: the value of surgical clips in the delineation of the lumpectomy cavity. Radiat Oncol 2009; 4: 70. 23. Giezen M, Kouwenhoven E, Scholten AN et al. MRI- versus CT-based volume delineation of lumpectomy cavity in supine position in breast-conserving therapy: an exploratory study. Int J Radiat Oncol Biol Phys 2012; 82: 1332-1340. 24. Berrang TS, Truong PT, Popescu C et al. 3D ultrasound can contribute to planning CT to define the target for partial breast radiotherapy. Int J Radiat Oncol Biol Phys 2009; 73: 375-383. 25. Coles CE, Harris EJ, Donovan EM et al. Evaluation of implanted gold seeds for breast radiotherapy planning and on treatment verification: a feasibility study on behalf of the IMPORT trialists. Radiother Oncol 2011; 100: 276-281. 26. Shaikh T, Chen T, Khan A et al. Improvement in interobserver accuracy in delineation of the lumpectomy cavity using fiducial markers. Int J Radiat Oncol Biol Phys 2010; 78: 1127-1134. 27. Smitt MC, Birdwell RL, Goffinet DR. Breast electron boost planning: comparison of CT and US. Radiology 2001; 219: 203-206. 28. Yang Z, Chen J, Hu W et al. Planning the breast boost: how accurately do surgical clips represent the CT seroma? Radiother Oncol 2010; 97: 530-534. 29. Goldberg H, Prosnitz RG, Olson JA, Marks LB. Definition of postlumpectomy tumor bed for radiotherapy boost field planning: CT versus surgical clips. Int J Radiat Oncol Biol Phys 2005; 63: 209-213. 30. Kirova YM, Fournier-Bidoz N, Servois V et al. How to boost the breast tumor bed? A multidisciplinary approach in eight steps. Int J Radiat Oncol Biol Phys 2008; 72: 494-500. 31. Kirova YM, Servois V, Reyal F et al. Use of deformable image fusion to allow better definition of tumor bed boost volume after oncoplastic breast surgery. Surg Oncol 2011; 20: e123-125. 32. Boersma LJ, Janssen T, Elkhuizen PH et al. Reducing interobserver variation of boost-CTV delineation in breast conserving radiation therapy using a pre-operative CT and delineation guidelines. Radiother Oncol 2012; 103: 178-182. 33. Whipp EC, Halliwell M. Magnetic resonance imaging appearances in the postoperative breast: the clinical target volume-tumor and its relationship to the chest wall. Int J Radiat Oncol Biol Phys 2008; 72: 49-57. 34. Kirby AM, Yarnold JR, Evans PM et al. Tumor bed delineation for partial breast and breast boost radiotherapy planned in the prone position: what does MRI add to X-ray CT localization of titanium clips placed in the excision cavity wall? Int J Radiat Oncol Biol Phys 2009; 74: 1276-1282. 35. Rabinovitch R, Finlayson C, Pan Z et al. Radiographic evaluation of surgical clips is better than ultrasound for defining the lumpectomy cavity in breast boost treatment planning: a prospective clinical study. Int J Radiat Oncol Biol Phys 2000; 47: 313-317. 36. Ringash J, Whelan T, Elliott E et al. Accuracy of ultrasound in localization of breast boost field. Radiother Oncol 2004; 72: 61-66. 37. Coles CE, Cash CJ, Treece GM et al. High definition three-dimensional ultrasound to localise the tumour bed: a breast radiotherapy planning study. Radiother Oncol 2007; 84: 233-241. 38. Ford EC, Lavely WC, Frassica DA et al. Comparison of FDG-PET/CT and CT for delineation of lumpectomy cavity for partial breast irradiation. Int J Radiat Oncol Biol Phys 2008; 71: 595-602.
82
39. de Prost N, Tucci MR, Melo MF. Assessment of lung inflammation with 18F-FDG PET during acute lung injury. AJR Am J Roentgenol 2010; 195: 292-300. 40. Hiari N, Rudd JH. FDG PET imaging and cardiovascular inflammation. Curr Cardiol Rep 2011; 13: 43-48. 41. Palta M, Yoo S, Adamson JD et al. Preoperative single fraction partial breast radiotherapy for early-stage breast cancer. Int J Radiat Oncol Biol Phys 2012; 82: 37-42. 42. Nissen HD, Appelt AL. Improved heart, lung and target dose with deep inspiration breath hold in a large clinical series of breast cancer patients. Radiotherapy and Oncology 2013; 106: 28-32. 43. Nichols EM, Dhople AA, Mohiuddin MM et al. Comparative analysis of the post-lumpectomy target volume versus the use of pre-lumpectomy tumor volume for early-stage breast cancer: implications for the future. Int J Radiat Oncol Biol Phys 2010; 77: 197-202. 44. Kader HA, Truong PT, Pai R et al. When is CT-based postoperative seroma most useful to plan partial breast radiotherapy? Evaluation of clinical factors affecting seroma volume and clarity. Int J Radiat Oncol Biol Phys 2008; 72: 1064–1069. 45. Alderliesten T, den Hollander S, Yang TJ et al. Dosimetric impact of post-operative seroma reduction during radiotherapy after breast-conserving surgery. Radiotherapy and Oncology 2011; 100: 265-270. 46. Li G, Yang TJ, Furtado H et al. Clinical assessment of 2D/3D registration accurary in 4 major anatomic sites using on-board 2D kilovoltage images for 6D patient setup. Technology in Cancer Research and Treatment 2015; 14: 305-214. 47. Zeggelink WF, Deurloo EE, Bartelink H et al. Reproducibility of the assessment of tumor extent in the breast using multiple image modalities. Med Phys 2003; 30: 2919-2926. 48. Schmitz AC, van den Bosch MA, Loo CE et al. Precise correlation between MRI and histopathology - exploring treatment margins for MRI-guided localized breast cancer therapy. Radiother Oncol 2010; 97: 225-232. 49. Kirby AM, Coles CE, Yarnold JR. Target volume definition for external beam partial breast radiotherapy: clinical, pathological and technical studies informing current approaches. Radiother Oncol 2010; 94: 255-263. 50. Morrow NV, Stepaniak C, White J et al. Intra- and interfractional variations for prone breast irradiation: an indication for image-guided radiotherapy. Int J Radiat Oncol Biol Phys 2007; 69: 910-917. 51. Chopra S, Dinshaw KA, Kamble R, Sarin R. Breast movement during normal and deep breathing, respiratory training and set up errors: implications for external beam partial breast irradiation. Br J Radiol 2006; 79: 766-773. 52. Ahunbay EE, Robbins J, Christian R et al. Interfractional target variations for partial breast irradiation. Int J Radiat Oncol Biol Phys 2012; 82: 1594-1604. 53. Brock KK. Results of a multi-institution deformable registration accuracy study (MIDRAS). Int J Radiat Oncol Biol Phys 2010; 76: 583-596. 54. Reed VK, Woodward WA, Zhang L et al. Automatic segmentation of whole breast using atlas approach and deformable image registration. Int J Radiat Oncol Biol Phys 2009; 73: 1493-1500.
83
Summary With the increased use of external beam accelerated partial breast irradiation (EB APBI), technical
advancements are needed to ensure accurate delivery of targeted radiation therapy (RT) to the tumor
bed. Inaccurate treatment not only can lead to overtreatment of normal tissues, thus enhancing short-
term and long-term toxicities, it can also compromise long-term oncologic care if the subclinical disease
is not adequately addressed. The optimal strategy in determining the EB APBI treating volume is through
understanding factors that would influence seroma development and change after breast-conserving
surgery and utilizing on treatment imaging to evaluate tumor bed change during breast irradiation
(Chapter 1).
This thesis demonstrated the following significant results and contributed to the field of breast radiation
oncology in various ways:
First, in Chapter 2 this thesis showed that the lumpectomy cavity volume is dynamic after
surgery and stabilizes approximately 8 weeks post-operatively. Radiotherapy was found to
hinder seroma reduction. These results suggest that redefining target volumes and modifying
treatment plans are needed during breast irradiation, especially for EB APBI, to appropriately
determine the post-operative target volume. The change in the post-operative cavity can
significantly impact the target volume for EB APBI, leading to risk of overtreatment of normal
tissue causing long-term toxicities, such as fibrosis.
Second, in Chapter 3 this thesis showed that cone-beam computed tomography (CBCT) could be
used in place of CT in detecting seroma reduction. Seroma clarity can influence an observer’s
ability to contour seroma; however, this effect was equally observed on both CT and CBCT. The
results included in this thesis suggest that CBCT is a good clinical surrogate for CT in monitoring
seroma reduction during breast RT, especially for patients with seroma scoring 3 or higher in
clarity on CBCT. Therefore, for patients undergoing EB APBI, CBCT can be used and should be
recommended to monitor tumor bed changes. If significant volume change is observed during
EB APBI, then the treatment plan should be modified to reflect the change to allow for most
accurate treatment delivery.
Third, in Chapter 4 this thesis demonstrated the dosimetric impact of the shrinking tumor bed in
the breast conserving therapy setting (whole breast irradiation with boost). These results
showed that a significant change in the tumor bed volume can lead to excessive irradiation of
normal breast tissue during EB APBI, which reflects the importance of monitoring seroma
reduction during RT.
Fourth, since CBCT may not always be available as an image-guided radiation therapy (IGRT)
modality for EB APBI in all institutions, feasibility of two-dimensional IGRT with on-board
kilovoltage (2D-kV) x-rays using external landmarks outside of the lumpectomy cavity, such as
the thoracic spine and boney structures, was investigated in Chapter 5. It was found that when
registered with treatment planning CT, 2D-kV orthogonal images used for patient setups for
thoracic spine irradiation resulted in the small differences of 0.2 ± 1.6mm in translation -0.7 ±
1.1° in rotation. The promising results demonstrated in chapter 5 have led to the development
of a pilot study at the Memorial Sloan Kettering Cancer Center for breast irradiation.
Lastly, Chapter 6 describes a thorough literature review in the optimal target definition of EB
APBI. These investigations made a cohesive argument for the importance of understanding and

84
monitoring tumor bed change after surgery in the setting of EB APBI, utilizing landmark outside
the lumpectomy cavity for IGRT delivery, and a strong recommendation in better defining the
target volume for future studies.
85
List of Publications Original Articles
Adams R, Pope T, Yang TJ. Registration and Fusion Imaging in Radiation Therapy. Radiation Therapist
13(1):41-51 (2004).
Adams R, Yang TJ, Rosenman J. A Demographic Analysis of Global Radiation Therapy Treatment.
Radiation Therapist 14(2):81-90 (2005).
Yang TJ, Yang Q, Haffty BG, Moran MS. Prognosis for Mammographically Occult, Early-Stage Breast
Cancer Patients Treated with Breast-Conservation Therapy. International Journal of Radiation
Oncology*Biology*Physics 76(1):79-84 (2010).
Yang TJ, Elkhuizen PH, Minkema D, Heemsbergen W, van Mourik AM, Cassee J, Hurkman C, van Vliet-
Vroegindeweij C. Clinical Factors Associated with Seroma Volume Reduction in Breast-Conserving
Therapy for Early-Stage Breast Cancer: A Multi-Institutional Analysis. International Journal of Radiation
Oncology*Biology*Physics 76(5):1325-32 (2010).
Yang TJ, Aukema TS, van Tinteren H, Burgers S, Valdes Olmos R, Verheij M. Predicting Early
Chemotherapy Response with Technetium-99m SPECT/CT in Advanced Non-Small Cell Lung Cancer.
Molecular Imaging and Biology 12(2):174-80 (2010).
Yang TJ, Minkema D, Elkhuizen PH, Heemsbergen W, van Mourik AM, Vliet-Vroegindeweij C. Clinical
Applicability of Cone-Beam Computed Tomography in Monitoring Seroma Volume Change During Breast
Irradiation. International Journal of Radiation Oncology*Biology*Physics 78(1):119-26 (2010).
Alderliesten T, den Hollander S, Yang TJ, Elkhuizen PH, van Mourik AM, Hurkmans C, Remeijer P, van
Vliet-Vroegindeweij C. Dosimetric Impact of Post-Operative Seroma Reduction During Radiotherapy
After Breast-Conserving Surgery. Radiotherapy and Oncology 100(2):265-70 (2011).
Moran MS, Ma S, Jagsi R, Yang TJ, Higgins SA, Weidhass JB, Wilson LD, Lloyd S, Peschel R, Gaudreau B,
Rockwell S. A Prospective Multicenter Study of Complementary/Alternative Medicine (CAM) Utilization
During Definitive Radiation for Breast Cancer. International Journal of Radiation
Oncology*Biology*Physics 85(1):40-6 (2013).
Yang TJ, Oh JH, Son CH, Apte A, Deasy JO, Wu A, Goodman KA. Predictors of Acute Gastrointestinal
Toxicity During Pelvic Radiotherapy. Gastrointestinal Cancer Research 6(5):129-36 (2013).
Brennan C*, Yang TJ*, Hilden P, Zhang Z, Chan K, Yamada Y, Chan TA, Lymberis SC, Narayana A, Tabar V,
Gutin PH, Ballangrud A, Lis E, Beal K. A Phase 2 Trial of Stereotactic Radiosurgery Boost After Surgical
Resection for Brain Metastases. International Journal of Radiation Oncology*Biology*Physics 88(1):130-
6 (2014). *Co-first Authors
Yang TJ, Oh JH, Folkert M, Gupta G, Shi W, Zhang Z, Morikawa A, Seidman A, Brennan C, Yamada Y, Chan
TA, Beal K. Outcomes and Prognostic Factors in Women with 1 to 3 Breast Cancer Brain Metastases
Treated with Definitive Stereotactic Radiosurgery. International Journal of Radiation
Oncology*Biology*Physics 90(3):518-25 (2014).
86
Yang TJ, Oh JH, Apte A, Son CH, Deasy JO, Goodman KA. Clinical and Dosimetric Predictors of Acute
Hematologic Toxicity in Rectal Cancer Patients Undergoing Chemoradiotherapy. Radiotherapy and
Oncology 113(1):29-34 (2014).
Li G*, Yang TJ*, Furtado H, Birkfellner W, Ballangrud A, Powell SN, Mechalakos J. Clinical Assessment of
2D/3D Registration Accuracy in 4 Major Anatomic Sites Using On-Board 2D Kilovoltage Images for 6D
Patient Setup. Technology in Cancer Research and Treatment 14(3):305-14 (2015). *Co-first Authors
Son CH, Law E, Oh JH, Apte A, Yang TJ, Riedel E, Wu AJ, Deasy JO, Goodman KA. Dosimetric Predictors of
Radiation-Induced Vaginal Stenosis After Pelvic Radiation Therapy for Rectal and Anal Cancer.
International Journal of Radiation Oncology*Biology*Physics 92(3);548-54 (2015).
Kohutek ZA, Chan TA, Yamada Y, Zhang Z, Brennan CB, Tabar V, Gutin P, Yang TJ, Rosenblum MK,
Ballangrud A, Young RJ, Zhang Z, Beal K. Long-term Risk of Radionecrosis and Imaging Changes after
Stereotactic Radiosurgery for Brain Metastases. Journal of Neuro-Oncology 125(1):149-56 (2015).
Yang TJ, Morrow M, Modi S, Zhang Z, Krause K, Siu C, McCormick B, Powell SN, Ho AY. The Effect of
Molecular Subtype and Residual Disease on Locoregional Recurrence in Breast Cancer Patients Treated
with Neoadjuvant Chemotherapy and Postmastectomy Radiation. Annals of Surgical Oncology 22(3):
495-501 (2015).
Hatzoglou V*, Yang TJ*, Omuro A, Gavrilovic I, Ulaner G, Rubel J, Schneider T, Woo K, Zhang Z, Beal, K,
Young R. A Prospective Trial of Dynamic Contrast Enhanced (DCE) MRI Perfusion and Flourine-18 FDG
PET-CT in Differentiating Brain Tumor Progression From Radiation Injury After Cranial Irradiation. Neuro-
Oncology. In Press PMID: 26688076 (2015). *Co-first Authors
Sperduto PW, Yang TJ, Beal K, Pan H, Brown PD, Bangdiwala A, Shanley R, Yeh N, Gaspar LE, Braunstein
S, Sneed P, Boyle J, Kirkpatrick JP, Mak K, Shih HA, Engleman A, Roberge D, Arvold ND, Alexander B,
Awad MM, Contessa J, Chiang V, Hardie J, Ma D, Lou M, Sperduto W, Mehta M. The Effect of Gene
Alterations, Race and Tyrosine Kinase Inhibition on Survival and Cause of Death in Patients with
Adenocarcinoma of the Lung and Brain Metastases. Journal of Clinical Oncology. Submitted on
1/25/2016.
Ng SY, Colborn KL, Cambridge L, Hajj C, Yang TJ, Wu AJ, Goodman KA. Acute Toxicity with Intensity
Modulated Radiotherapy Versus 3-Dimensional Conformal Radiotherapy During Preoperative
Chemoradiation for Locally Advanced Rectal Cancer. International Journal of Radiation
Oncology*Biology*Physics. Submitted on 3/20/2016.
Review Articles
Yang TJ, Adams R. The 25 Most Important Cancer Treatment Trends. Radiation Therapist 13(1):61-4
(2004).
Yang TJ, Haimovitz-Friedman A, Verheij M. Anticancer Therapy and Apoptosis. Experimental Oncology
34(3):1-8 (2012).

87
Haimovitz-Friedman A, Yang TJ, Thin TH, Verheij M. Imaging Radiotherapy-Induced Apoptosis. Radiation
Research 177(4): 467-82 (2012).
Yang TJ, Rao R, Elkhuizen PH, van Vliet-Vroegindeweij C, Li G, Powell SN. Tumor Bed Delineation for
External Beam Accelerated Partial Breast Irradiation: A Systematic Review. Radiotherapy and Oncology
108(2): 181-9 (2013).
Yang TJ, Goodman KA. Predicting Complete Response: Is There a Role for Non-Operative Management
of Rectal Cancer? Journal of Gastrointestinal Oncology 6(2):241-6 (2015).
Yang TJ, Wu AJ. Cranial Irradiation in Patients with EGFR-mutant Non-Small-Cell Lung Cancer Brain
Metastases. Translational Lung Cancer Research 5(1):134-7 (2016).
Book Chapters
Adams R, Yang TJ. Mathematical Concepts for Medical Dosimetrists. Stanford University Online Medical
Dosimetry Project. http://www.dosimetritrainingtool.com/, Palo Alto, California, 2004.
Dharmarajan K, Yang TJ, Yamada J. Oncologic Emergencies. In Pocket Oncology. Postow M and Drilon A
(Editors). Lippincott Williams & Wilkins-Wolters Kluwer Health, Philadelphia, 2013.
Yang TJ, Ho AY. Radiation Therapy for Breast Cancer. In Surgical Clinics of North America- Surgeon’s Role
in Multidisciplinary Breast Management. Fuhrman GM and King TA (Editors). Elsevier Publishers,
Philadelphia, 2013.
Tao R, Yang TJ, Brown P, Rhines LD, Settle SH. In Controversies in Stereotactic Radiosurgery. Sheehan J
and Gerszten P (Editors). Thieme Medical Publishers, New York, 2014.
Hajj C, Yang TJ, Goodman KA. In Cancer Series, 2nd edition. Morikawa A (Editor). Editora Atheneu, Sao
Paulo, 2014.
Yang TJ, Powell SN. Breast Cancer. In Principle and Practice of Radiation Therapy, 4th edition.
Washington CM and Leaver D (Editors), Elsevier Publishers, Philadelphia, 2015.
88
Acknowledgement “I am a success today because I had a friend who believed in me and I didn’t have the heart to let him down.” - Abraham Lincoln This has always been one of my favorite quotes, not because I compare myself to President Lincoln, but, like Lincoln, I have had friends in life who have helped me succeed. These friends are my mentors who believed in me and motivated me to excel academically. I worked as a radiation therapy technologist before attending medical school. During my time as a technologist, I sought out and embraced challenges. I was not satisfied with just delivering treatments; I also wanted to learn the medical decision making process behind my job, and how the treatment plan was generated. My mentors, Dr. Joel Tepper and Dr. Robert Adams of University of North Carolina at Chapel Hill (UNC), strongly urged me to pursue a career in medicine. Dr. Tepper, at the time the Chairman of Department of Radiation Oncology at UNC, even allowed me to take courses at the University while I was working as a radiation technologist to complete the courses I needed to apply to medical school. At Yale School of Medicine, I continue to develop an interest in radiation oncology and was given the unique opportunity to pursue a research fellowship at the Netherlands Cancer Institute (NKI) through Dr. Lynn Wilson and Dr. Marcel Verheij. There, I investigated tumor bed changes and image-guided breast irradiation for women with early stage breast cancer who underwent lumpectomy. I excelled in my research through the guidance and encouragement of Dr. Verheij, Dr. Paula Elkhuizen and Dr. Corine van Vliet-Vroegindeweij, who helped me solidify my goal of becoming a radiation oncologist. Dr. Verheij, Dr. Elkhuizen and Dr. Corine van Vliet-Vroegindeweij also supported me in pursuing a PhD based on my work at the NKI. After returning to Yale to finish my doctorate degree in medicine, I joined Memorial Sloan Kettering Cancer Center (MSKCC) as a resident physician training in radiation oncology. At MSKCC, I was fortunate to be able to work with Dr. Simon Powell early in my training. I share Dr. Powell’s passion in advancing the care of women with breast cancer. Dr. Powell is my advisor at MSKCC for this Thesis, which detailed improvements in the technical aspects of radiation delivery. He not only inspired me to continue to develop the technological front of breast cancer treatments, he also encouraged me to incorporate tumor biology in my research. With Dr. Powell’s encouragement, I started to work with Dr. Lewis Cantley at Weill Cornell Medical College to study breast cancer metabolism and DNA damage. Through Dr. Powell and Dr. Cantley’s mentorships, I chose a career as an academic radiation oncologist with a focus on translational research and developing early Phase trials for patients at high risk of recurrence after radiation therapy. I believe the future of radiation oncology is the personalization of radiation therapy through advancements in our understanding of tumor biology and development of highly precise treatment delivery methods. Because of my mentors and the experiences they had encouraged me to pursue, I understand the importance of advancing both the biological and technical aspects of radiation oncology and thus in the best position to improve the care of my patients through sound and logical research. I would also like to acknowledge my parents Bob and Grace, my sister Connie, and my husband Mark who never stopped believing in me, even when I questioned myself.
89
Curriculum Vitae T. Jonathan Yang investigated tumor bed changes and image-guided breast irradiation for patients with early stage breast cancer who underwent lumpectomy. His work is significantly applicable to today’s treatment for early stage breast cancer, especially in the setting of partial breast irradiation. Jonathan joined NKI in 2008 as a research fellow. He was a medical doctorate candidate studying medicine at Yale University School of Medicine at the time. Prior to medical school, he worked as a radiation therapy technologist at the University of North Carolina between 2003 and 2006, where he performed simulations and delivered radiation treatments for his patients on a daily basis. During his time as a radiation therapy technologist, he decided to pursue a career as a radiation oncologist. After receiving his medical doctorate degree, Jonathan joined Memorial Sloan Kettering Cancer Center as a resident physician and received transitional year/internal medicine training between 2011 and 2012, followed by radiation oncology training between 2012 and 2016. He currently serves as a Chief Resident and will be completing his training in June 2016. He has accepted a position as an attending faculty member at Memorial Sloan Kettering Cancer Center Department of Radiation Oncology and will begin this role in August 2016. In addition to his clinical work at Memorial Sloan Kettering, he is also conducting translational research on cancer metabolism and DNA damage under the guidance of Dr. Lewis Cantley at Weill Cornell Medical College.


![Research Article Quantification of Protoporphyrin IX ...downloads.hindawi.com/archive/2014/405360.pdf · phyrin IX (PpIX) [ ]. e presence of PpIX uorescence within the tumor bed allows](https://static.fdocuments.in/doc/165x107/5e69f9ad0131ec4571477f74/research-article-quantification-of-protoporphyrin-ix-phyrin-ix-ppix-e.jpg)