The dual role of Andean topography in primary divergence ...
16
RESEARCH ARTICLE Open Access The dual role of Andean topography in primary divergence: functional and neutral variation among populations of the hummingbird, Metallura tyrianthina Phred M. Benham 1,2* and Christopher C. Witt 1 Abstract Background: The ridges and valleys of the Andes create physical barriers that limit animal dispersal and cause deterministic local variation in rainfall. This has resulted in physical isolation of animal populations and variation in habitats, each of which has likely contributed to the evolution of high species diversity in the region. However, the relative influences of geographic isolation, ecoclimatic conditions, and their potential interactions remain poorly understood. To address this, we compared patterns of genetic and morphological diversity in Peruvian populations of the hummingbird Metallura tyrianthina. Results: Phylogenetic and variation partitioning analyses showed that geographic isolation rather than climatic dissimilarity explained the greatest proportion of genetic variance. In contrast, bill length variation was explained by climatic seasonality, but not by genetic divergence. We found that mutation-scaled migration rate (m) between persistently humid and semi-humid environments was nearly 20 times higher when the habitats were contiguous (m= 39.9) than when separated by a barrier, the Cordillera de Vilcanota (m= 2.1). Moreover, the population experiencing more gene flow exhibited a lesser degree of bill length divergence despite similar differences in climate. Conclusions: Geographic isolation is necessary for genetic divergence. Ecological differences, represented here by climate characteristics, are necessary for functional divergence. Gene flow appears to hinder the evolution of functional traits toward local adaptive optima. This suggests that functional diversification requires geographic isolation followed or accompanied by a shift in ecological conditions. Andean topography causes both isolation and climatic variation, underscoring its dual role in biotic diversification. Keywords: Andes, Ecological speciation, Geographic speciation, Bill morphology, Trochilidae Background The tropical Andes harbor a significant fraction of global diversity (e.g., 15 % of land plant species), with half this diversity comprised of regional endemics [1]. In contrast to other diverse montane regions (e.g. the Himalayas [2]), a major fraction of Andean diversity is derived from line- ages that have radiated extensively in situ [3–9]. Thus, identifying the historical and landscape characteristics that foster speciation in the Andes will be crucial for under- standing the mechanisms that have made the region a diversification hotspot. The topographically complex Andean landscape seems to drive diversification in two ways [10]. First, topographic barriers can fragment the narrow distributions of montane taxa and promote diver- gence via allopatric speciation [11–15]. Second, topog- raphy creates climate variation over small spatial scales that can drive ecological divergence, leading to reproduct- ive isolation [16–18] and/or accelerated niche divergence [19]. Although some evidence for both mechanisms oper- ating in the Andes exists, the relative importance of each * Correspondence: [email protected] 1 Department of Biology and Museum of Southwestern Biology, University of New Mexico, 167 Castetter Hall MSC03 2020, 1 University of New Mexico, Albuquerque, NM 87131, USA 2 Present address: Division of Biological Sciences, University of Montana, 32 Campus Dr. HS104, Missoula, MT 59812, USA © 2016 Benham and Witt. Open Access This article is distributed under the terms of the Creative Commons Attribution 4.0 International License (http://creativecommons.org/licenses/by/4.0/), which permits unrestricted use, distribution, and reproduction in any medium, provided you give appropriate credit to the original author(s) and the source, provide a link to the Creative Commons license, and indicate if changes were made. The Creative Commons Public Domain Dedication waiver (http://creativecommons.org/publicdomain/zero/1.0/) applies to the data made available in this article, unless otherwise stated. Benham and Witt BMC Evolutionary Biology (2016) 16:22 DOI 10.1186/s12862-016-0595-2
Transcript of The dual role of Andean topography in primary divergence ...

RESEARCH ARTICLE Open Access
The dual role of Andean topography inprimary divergence: functional and neutralvariation among populations of thehummingbird, Metallura tyrianthinaPhred M. Benham1,2* and Christopher C. Witt1
Abstract
Background: The ridges and valleys of the Andes create physical barriers that limit animal dispersal and causedeterministic local variation in rainfall. This has resulted in physical isolation of animal populations and variationin habitats, each of which has likely contributed to the evolution of high species diversity in the region. However,the relative influences of geographic isolation, ecoclimatic conditions, and their potential interactions remainpoorly understood. To address this, we compared patterns of genetic and morphological diversity in Peruvianpopulations of the hummingbird Metallura tyrianthina.
Results: Phylogenetic and variation partitioning analyses showed that geographic isolation rather than climaticdissimilarity explained the greatest proportion of genetic variance. In contrast, bill length variation was explainedby climatic seasonality, but not by genetic divergence. We found that mutation-scaled migration rate (m) betweenpersistently humid and semi-humid environments was nearly 20 times higher when the habitats were contiguous(m = 39.9) than when separated by a barrier, the Cordillera de Vilcanota (m= 2.1). Moreover, the population experiencingmore gene flow exhibited a lesser degree of bill length divergence despite similar differences in climate.
Conclusions: Geographic isolation is necessary for genetic divergence. Ecological differences, represented here byclimate characteristics, are necessary for functional divergence. Gene flow appears to hinder the evolution of functionaltraits toward local adaptive optima. This suggests that functional diversification requires geographic isolation followedor accompanied by a shift in ecological conditions. Andean topography causes both isolation and climatic variation,underscoring its dual role in biotic diversification.
Keywords: Andes, Ecological speciation, Geographic speciation, Bill morphology, Trochilidae
BackgroundThe tropical Andes harbor a significant fraction of globaldiversity (e.g., 15 % of land plant species), with half thisdiversity comprised of regional endemics [1]. In contrastto other diverse montane regions (e.g. the Himalayas [2]),a major fraction of Andean diversity is derived from line-ages that have radiated extensively in situ [3–9]. Thus,identifying the historical and landscape characteristics that
foster speciation in the Andes will be crucial for under-standing the mechanisms that have made the region adiversification hotspot. The topographically complexAndean landscape seems to drive diversification in twoways [10]. First, topographic barriers can fragment thenarrow distributions of montane taxa and promote diver-gence via allopatric speciation [11–15]. Second, topog-raphy creates climate variation over small spatial scalesthat can drive ecological divergence, leading to reproduct-ive isolation [16–18] and/or accelerated niche divergence[19]. Although some evidence for both mechanisms oper-ating in the Andes exists, the relative importance of each
* Correspondence: [email protected] of Biology and Museum of Southwestern Biology, University ofNew Mexico, 167 Castetter Hall MSC03 2020, 1 University of New Mexico,Albuquerque, NM 87131, USA2Present address: Division of Biological Sciences, University of Montana, 32Campus Dr. HS104, Missoula, MT 59812, USA
© 2016 Benham and Witt. Open Access This article is distributed under the terms of the Creative Commons Attribution 4.0International License (http://creativecommons.org/licenses/by/4.0/), which permits unrestricted use, distribution, andreproduction in any medium, provided you give appropriate credit to the original author(s) and the source, provide a link tothe Creative Commons license, and indicate if changes were made. The Creative Commons Public Domain Dedication waiver(http://creativecommons.org/publicdomain/zero/1.0/) applies to the data made available in this article, unless otherwise stated.
Benham and Witt BMC Evolutionary Biology (2016) 16:22 DOI 10.1186/s12862-016-0595-2

mechanism working independently or in concert duringthe diversification process remains poorly understood.Topographic barriers are frequently associated with
phenotypic and genetic discontinuities in Andean species,providing evidence for the importance of physical isolationin Andean diversification (e.g., [20–22]). However, if phys-ical isolation across topographic barriers were the soledriver of Andean speciation, species-level differences wouldbe expected to accumulate via neutral processes. Substan-tial empirical evidence supports non-neutral mechanismsof speciation [23], although the overall tempo of diversifica-tion in the tree of life has recently been interpreted asevidence of neutral diversification [24]. Discordant patternsof phenotypic and genetic diversity are frequently foundin Andean lineages, in contrast to neutral expectations([4, 25–27], but see [22]). Moreover, coalescent simula-tions of plumage evolution in Arremon brushfinches indicatethat plumage differentiation proceeds at a much faster ratethan expected via neutral divergence [28]. In sum, it seemsthat range fragmentation alone is an insufficient mechanismfor explaining the generation of Andean diversity.Ecological speciation occurs when ecological factors,
regardless of gene flow, catalyze reproductive isolation bynatural selection [18]. In the Andes, higher diversificationrates are associated with climatic-niche shifts indicatingthat ecoclimatic variation may be an important driver oflineage proliferation [29]. Several studies of Andean taxahave found morphometric and functional divergence aris-ing among populations distributed along ecological gradi-ents in the face of ongoing gene flow [30–35]. Althoughthese results suggest that ecological mechanisms might bethe primary drivers of divergence in the region, abundantevidence from outside the Andes indicates that rates ofphenotypic divergence and evolution of reproductive iso-lation will be slower in populations experiencing gene flowrelative to those that are more isolated (e.g., [17, 36–38]).Indeed, studies examining whether sister species replaceone another along ecological gradients in the Andeshave been inconclusive, with some sister species foundto replace one another along ecological gradients inAndean butterflies [6] and frogs [39], but not in Andeanbirds or mammals [40–44].Given the lack of clear support for an exclusive role of
geographic isolation or ecological speciation in drivingAndean diversification, a better understanding of the speci-ation process in the Andes will likely come from addressinghow geographic and ecological isolation operate in concert[12, 15]. The topographic complexity of the region shouldallow for interactions between these two processes.Topographic barriers promote the reduction of geneflow, while the increased climatic variation associatedwith topography potentially increases the tempo of di-vergence via differential selection pressures [19, 45, 46].One approach to test whether divergence is associated with
topographic relief will be to assay divergence among popu-lation pairs that (i) occupy similar climates on either side ofa topographic barrier, (ii) occupy different climates oneither side of a topographic barrier, and (iii) occupydifferent climates in the absence of a topographic barrier.In particular, comparing patterns of spatial variation ineffectively neutral genetic markers and functional traits willprovide a means to understand the relative influence ofgeographic and ecological isolation in promoting geneticstructure and divergence in ecologically relevant traits.We focus on Peruvian populations of the Andean hum-
mingbird Metallura tyrianthina to understand the driversof spatial diversity in functional morphology and genetics.The geological history of the Peruvian Andes generated atopographically complex landscape, with glaciated cordil-leras >5000 m in elevation interspersed with deep rivervalleys [47]. These landscape features generated habitat dis-continuities in the elevational distribution of M. tyrianthina(1900–4200 m [48]). Final uplift of the central Andes overthe last ~10 Myr also dramatically altered the climate [49],generating a steep rainfall gradient from the wet easternslope to the desert-like western slope [50]. M. tyrianthinalikely colonized Peru from northern populations ~2 Maand presently spans several topographic barriers and steepclimatic gradients in the Peruvian Andes [51]. Three sub-species of Metallura tyrianthina occur in Peru: M. t. tyr-ianthina north and west of the Marañón valley in humidmontane forests and edge habitat; M. t. septentrionalis insemi-humid montane scrub along the Western Cordilleraof Peru south to the department of Lima; and M. t. smarag-dinicollis throughout the eastern Andes of Peru in humidforests along east-facing slopes and in semi-humid scrubon west-facing and rain-shadowed slopes (Fig. 1a [48]).We compared spatial patterns of variation in bill length
and effectively neutral DNA sequences in M. tyrianthina totest predictions derived from models of geographic speci-ation, ecological speciation, or a combination. (1) If geo-graphic isolation drives divergence then we will expect tofind a concordant relationship between phenotypic andgenetic divergence across topographic barriers. However, (2)if divergence is primarily driven by ecological factors thenwe expect to find linked phenotypic and genetic divergencein association with ecological dissimilarities, independent ofgeographic isolation. Finally, (3) if topographic barriers andecological differences interact to drive divergence then weexpect to find phenotypic divergence between different envi-ronments, but only when a topographic barrier that reducesgene flow separates those environments.
MethodsSamplingTissue samples of Metallura tyrianthina were obtainedfrom frozen tissue collections at natural history mu-seums, primarily the Museum of Southwestern Biology
Benham and Witt BMC Evolutionary Biology (2016) 16:22 Page 2 of 16

(110 individuals). Collection of these samples was approvedby the University of New Mexico Institutional Animal Careand Use Committee (protocol no. 08UNM033-TR-100117)and permitted by Peruvian management authorities (permitnos. 76-2006-INRENA-IFFS-DCB, 004-2007-INRENA-IFFS-DCB, 135-2009-AG-DGFFS-DGEFFS, 0377-2010-AG-DGFFS-DGEFFS, 0199-2012-AG-DGFFS-DGEFFS, and006-2013-MINAGRI-DGFFS/DGEFFS). The geographicbreadth of sampling was increased through tissue loansof an additional 26 individuals from other naturalhistory collections (Additional file 1: Table S1). Fromall 136 individuals, we extracted genomic DNA frompectoral muscle that was either frozen or preserved inRNAlater® (Life Technologies) using a Qiagen DNeasyblood and tissue kit and following the manufacturer’sprotocols (Qiagen, Valencia, CA, USA). The mitochon-drial gene NADH dehydrogenase, subunit 2 (ND2) wassequenced for all 136 individuals. For all of the 47 individ-uals sampled in the department of Cusco we sequencedan additional two nuclear introns: Adenylate Kinase,intron 5 (AK1) and β-fibrinogen, intron 7 (Bfib7); and theZ-linked locus Muscle, Skeletal, Tyrosine Receptor Kinase(MUSK). Primers and sequencing protocols were identicalto those used in Benham et al. [51]. All sequences were
manually assembled and edited using Sequencer v. 4.10.1(Gene Codes Corporation, Ann Arbor, MI, USA) andaligned using MUSCLE v. 3.7 [52]. Haplotype reconstruc-tion for nuclear loci with multiple double peaks was con-ducted using the program PHASE v. 2.1.1 [53, 54].The size and shape of hummingbird bills vary in associ-
ation with floral resources [55, 56] and competitive interac-tions with other hummingbirds [57]. The hummingbirdbill is an ideal trait in which to examine functional diversi-fication across the Andean landscape due to its functionalimportance and the fact that bill characteristics tend to behighly heritable [58]. We measured bill length (exposedculmen) to the nearest 0.01 mm using digital calipers on245 museum specimens collected from throughout Peru(Fig. 1a; Additional file 1: Table S1). All specimensincluded in this study were associated with precise localityand mass data and all measurements were made on driedspecimens to avoid increased error from specimen shrink-age [59]. Sexual dimorphism in bill length and shape iswidely encountered within Trochilidae [60, 61]; however,using a two-tailed t-test for the entire dataset, we did notdetect any significant differences between the sexes in billlength; accordingly, males and females were pooledfor subsequent analyses. All statistical analyses were
Pillahuata
Paucartambo
Carrizales
Urubamba
85km
60km
5 10Kilometers (km)
PillahuataPaucartamboUrubamba Carrizales
Cordillera Vilcanota Manu Road
15 20 2 3 4 51
Ele
vatio
n (m
)
5000
4500
4000
3500
3000
2500
20km 5km
Manu RoadCordillera Vilcanota
0-500 500-1500 1500-2500 2500-4000 4000-6000
Elevation (m)
M. t. tyrianthina M. t. septentrionalis M. t. smaragdinicollis
a b
c
Humid
Semi-humid
Fig. 1 a Map illustrating the distribution of all three Metallura tyrianthina subspecies that occur in Peru. Circles denote sampling sites for both geneticand bill length data; squares represent sampling sites for bill length data only. Blue points are sites where the habitat was characterized as humidmontane forest and brown points semi-humid montane scrub. b Map of sampling sites from the department of Cusco, Peru. One pair of sites wasfrom the humid (Carrizales) and drier (Urubamba) sides of the Cordillera de Vilcanota, separated by ~20 km. A second pair of sites was along the ManuRoad, with a humid (Pillahuata) and drier (Paucartambo) site ~5 km apart. c Topographic profile of the Cordillera de Vilcanota, which exceeds 5000 m,and the Manu Road where a cordillera less than 4000 m in elevation separates the two sites along the Manu Road
Benham and Witt BMC Evolutionary Biology (2016) 16:22 Page 3 of 16
conducted using the open source program R (http://www.r-project.org/).To assess environmental differences among all specimen
localities we obtained bioclimatic data at 30-s resolutionfrom the WorldClim dataset [62]. Using coordinates foreach sampling locality we extracted data from gridfiles ofthe BioClim variables within the program DIVA-GIS(http://www.diva-gis.org/). The climatic data includes 19variables related to measures of temperature, precipitationand seasonality (Additional file 1: Table S2). These dataare derived from interpolated climate surfaces availablefor the entire globe at 30-arc sec spatial resolution andwere gathered from several independent sources between1950 and 2000 [62]. Although the WorldClim dataset maybe error-prone in montane regions due to interpolation[62], such error is likely to be random with respect to ourhypotheses. The WorldClim dataset has been used suc-cessfully in a number of modeling and morphologicalstudies of Andean birds (e.g., [63–65]). WorldClim datahas also been used successfully at fine spatial scales toguide surveys for range-restricted Andean humming-bird species [66]. We divided the 19 BioClim variablesinto three groups each corresponding to variables relatedto temperature, precipitation, and seasonality. Secondly, weperformed a principal components analysis on each of thethree groups and used the first components of temperature(83.7 % of the variance), precipitation (78.0 %), and season-ality (82.9 %), respectively, for analyses (Additional file 1:Table S2).
Influence of topographic barriers on divergenceTo assess the association of genetic structure with topo-graphic barriers we constructed a phylogeny of allMetallura tyrianthina ND2 samples using Bayesianmethods in MrBayes v. 3.1 [67] on the CIPRES ScienceGateway [68]. For an outgroup we obtained ND2 data ofMetallura phoebe from GenBank (Ascension number:EU042569.1). A GTR + I + Γ model was selected as themost appropriate substitution model based on AkaikeInformation Criteria [69] estimated in jmodeltest v. 0.1[70, 71]. We also partitioned the dataset by codon pos-ition following McGuire et al. [5]. The MCMC analysisran for 40 million generations sampling every 1000generations and consisted of four simultaneous runs offour chains each with a temperature for heated chains of0.175. We assessed convergence using the programAWTY [72] and discarded the first 10 % of trees asburnin. To further evaluate patterns of genetic structure wecalculated the number of haplotypes for ND2 in DNaSP[73] and visualized these as a haplotype network using amedian-joining method in NETWORK v. 4.6.10 [74].We evaluated the proportion of genetic diversity ex-
plained by topographic barriers as identified with phylo-genetic and network analyses in Peruvian Metallura
tyrianthina using an AMOVA analysis. For this analysiswe divided the sampled individuals into six groups eachdivided by a topographic barrier. These barriers include:the North Peru Low, high Andean ridgeline, the Mantarovalley, the Apurímac valley, and the Cordillera de Vilcanota(Fig. 2c). These barriers also correspond to phenotypic andgenetic discontinuities in other Andean bird species(e.g., [20, 75]). Degree of divergence among clades wasassessed with Fst values and Nei’s average correctedpairwise differences (DA [76]), which accounts for intra-population polymorphism with the equation DA = dxy - 0.5(dx-dy), where x and y are the two populations comparedand d is the average uncorrected genetic differences. Foreach of the clades identified using the above analyses wealso calculated standard indices of molecular diversity,including nucleotide and haplotype diversity. Finally, wecalculated Tajima’s D and Fu’s F (1000 simulations) todetermine whether any of the ND2 clades exhibit devia-tions from neutrality. All population genetic analyses wereperformed in the program Arlequin v. 3.5 [77].
Concordance between genetic and morphologicaldivergenceTo test for concordance between patterns of geneticdivergence and bill length variation we compared billlength differences to two measures of genetic divergence,DA and linearized Fst (equal to Fst/1-Fst [78]), acrosssixteen sampling localities. These measures of geneticdistance were compared to the average difference in billlength between each pair of sampling localities. We useda series of linear regression analyses to compare geneticand bill length differences among all pairwise comparisonsof populations, among populations in humid montaneforest habitats, in semi-humid montane scrub habitats,and among populations distributed in different habitattypes (Fig. 1a).
Climatic drivers of divergencePopulations distributed across different climatic regimescould experience adaptive divergence that will have a nega-tive influence on gene flow leading to reproductive isola-tion and genetic divergence even at neutral loci, a processreferred to as isolation by environment (IBE [18, 79–81]).We test for IBE in Metallura tyrianthina by comparing therelative roles of climatic distance and geographic distancein shaping patterns of genetic variation using a variationpartitioning method in the R-package ‘vegan’ [82].Variation partitioning utilizes canonical redundancyanalysis to dissect the contributions of different explana-tory factors (e.g. climate, geographic distance) to variationin a response variable (e.g., genetic distance [83]). Variationpartitioning has been shown to perform similarly to otherrecently developed tests for teasing apart spatially autocor-related drivers of genetic diversity [80] and performs better
Benham and Witt BMC Evolutionary Biology (2016) 16:22 Page 4 of 16

than partial Mantel tests, which can exhibit a high type Ierror rate when considering spatially autocorrelated data[81, 84, 85]. For M. tyrianthina we assessed the influenceof environmental variation on genetic distance as measuredby DA and linearized Fst. We used Euclidean geographicdistances among sampling localities to assess the role ofgeographic isolation. To assess the role of climate, we per-formed principal components analysis on all 19 BioClimvariables from the 16 sampling sites for which we had bothgenetic and bill length data to reduce these variables totwo principal components. The first principle componentexplained 93.13 % of BioClim variation, with theheaviest loading linked to annual precipitation. Thesecond principle component explained 4.55 % of Bio-Clim variation, with the heaviest loading associatedwith precipitation in the wettest quarter (Additionalfile 1: Table S3). As alternative climatic variables, weused the first principle components of the BioClimvariables for temperature, seasonality, and precipita-tion, respectively. Using either DA or linearized Fstwe performed a series of variation partitioning ana-lyses using all potential combinations of climaticprincipal components plus geographic distance asthe explanatory variables (Table 1). We then testedwhether the fraction of variation explained by eachclimatic variable was significant when conditionedfor geography, and vice versa, using a permutation
analysis with the ‘anova’ function in the vegan pack-age (10,000 permutations).We tested the influence of different climatic vari-
ables on bill length variation throughout Peru usingan information-theoretic approach. We performedregression analyses with bill length as the dependentvariable and PC1 of temperature, precipitation, andseasonality, respectively, as explanatory variables. Wealso explored the possibility of using PC1 and PC2 ofall 19 BioClim variables as predictors; however, PC1and PC2 were found to be strongly correlated withseasonality and temperature, respectively (correlationcoefficient >0.95 for both). Consequently, we excludedPC1 and PC2 predictors to avoid issues associated withmulti-collinearity in downstream analyses. Finally, we alsoinclude body mass in this analysis as another potentialpredictor of bill length variation. We evaluated 15 modelsrepresenting all possible main effect combinations of pre-dictor variables and included an additional six models toevaluate all possible pairwise interactions between the fourvariables. The likelihood of all 21 models was evaluatedusing an Akaike Information Criterion corrected forsample size (AICc). Each model was ranked usingΔAICc and Akaike weights [86] to determine whichof our hypothesized climatic models best explainsbill length variation in Peru. We discarded modelsfrom consideration if a nested model (containing a
0-500 500-1500 1500-2500 2500-4000 4000-6000
Elevation (m)
M. t. tyrianthina M. t. septentrionalis M. t. smaragdinicollisA
B
C
D
F
E0.96
0.35
0.27
0.3
*
*
*
*
*
*
A
E
B
C
F
D
A
B
C
F ED
North Peru Low
High Andes
Mantaro Valley
Cordillera Vilcanota
Valley
*
a b c
Humid
Semi-humid
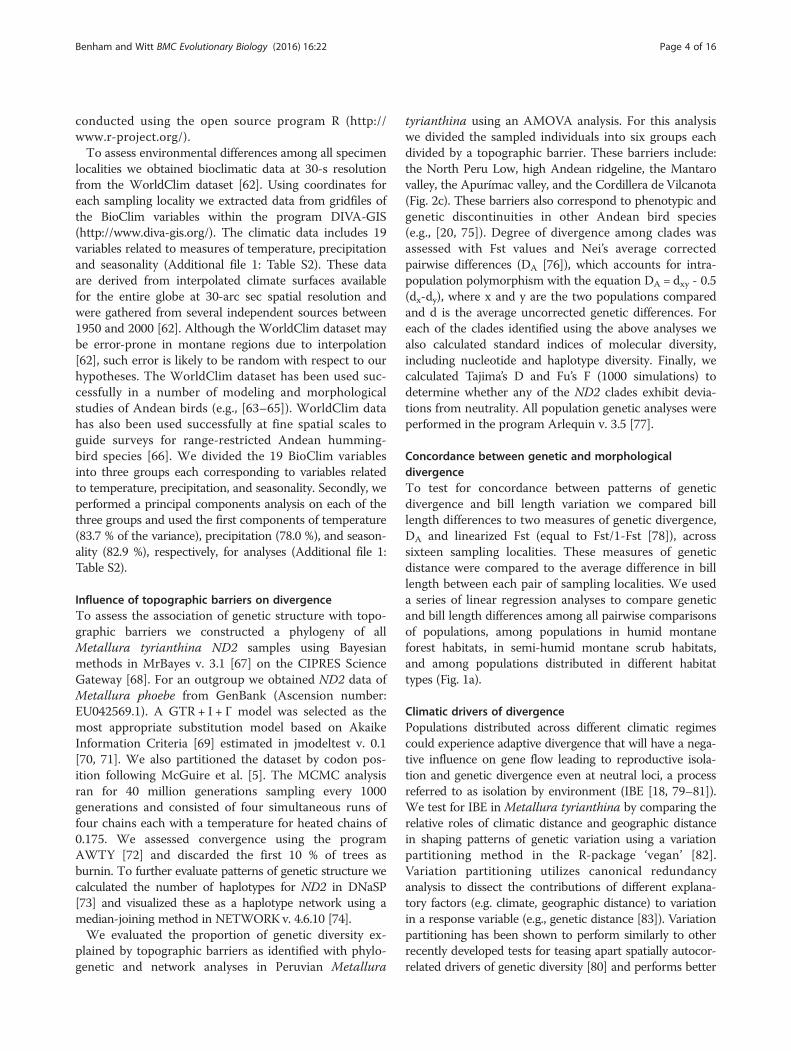
Fig. 2 a ND2 Bayesian phylogeny for Peruvian populations of Metallura tyrianthina. Posterior probabilities for each node printed abovebranches (* signifies 1.0 pp). The six geographically structured clades are lettered on all figures. Each clade is colored by subspecies as inpanel c. b Median-joining haplotype network of ND2. Brown color indicates semi-humid montane scrub habitat; blue indicates humid montane forest.c Geographic distribution of each clade (A-F). Red dotted lines signify putative physical barriers that isolate the six clades
Benham and Witt BMC Evolutionary Biology (2016) 16:22 Page 5 of 16

subset of the same parameters) had a better AICcscore [87].
Dual influence of topography on divergenceWe assess the combined influence of topographicbarriers and climatic differences in shaping patterns ofgenetic and morphological divergence across two pairsof populations in which the members of each pair areadjacent but occur in different environments (Fig. 1b).The first pair of populations were 20 km apart on eitherside of the Cordillera de Vilcanota with one populationsampled in the semi-humid scrub of the Urubambavalley (n = 21; elevation range 3380–4200 m) and thesecond within humid montane forest near the town ofCarrizales (n = 6; elevation: 3201–3552 m). A second pairof populations was distributed along the Manu Road only5 km apart with birds sampled in the semi-humid scrubnear the town of Paucartambo (n = 7; elevation 3360 m)and in humid montane forest near Pillahuata (n = 13; ele-vation 2500–3350 m). The Cordillera de Vilcanota is glaci-ated and exceeds 5000 m elevation, with passes as low as4300 m; whereas the pass separating humid and semi-humid populations along the Manu Road is only 3900 m(Fig. 1c). Given that the typical elevational distribution ofM. tyrianthina is 1900–4200 m [46] the Cordillera deVilcanota likely imposes a more significant barrier to geneflow then any ridge along the Manu Road. We used a one-way ANOVA and TukeyHSD test to examine differencesin bill length among the four sites. To determine howour small sample sizes for the Carrizales (n = 6) andPaucartambo (n = 7) populations would impact ourstatistical power, we performed a power analysis in theR package pwr (https://cran.r-project.org/web/packages/pwr/index.html). For this analysis we first performed two
t-tests comparing bill length differences across theCordillera de Vilcanota and the Manu Road. The re-sults of these t-tests were used to estimate the effectsize of bill length divergence between both humid andsemi-humid population pairs. Given the calculatedeffect of habitat on bill length divergence across bothpopulation pairs we confirmed that the statistical powerusing our small sample sizes exceeded the a priori definedthreshold of 0.8 (i.e., >80 % probability of rejecting the nullhypothesis if it is false).To assess patterns of genetic divergence among sam-
pling localities we calculated all pairwise Fst-valuesacross the four sampled populations for each of thefour loci in Arlequin v.3.5 [77]. Secondly, we deter-mined levels of gene flow among the four populationsusing the program IMa2 [88]. IMa2 is a coalescentgenealogy sampler that simultaneously estimates effect-ive population size, migration rates, and divergencetimes within the framework of an isolation with migrationmodel [89]. The IMa2 program assumes no recombinationand before analyses we assessed patterns of recombinationin the nuclear loci using the four-gamete test [90] in DnaSp[73]. This test detected recombination in regions of bothAK1 and Bfib7. We saved the longest segment of each geneexhibiting no evidence of recombination, leaving segmentsof 232 bp for AK1 and 313 bp for Bfib7. We conductedpairwise comparisons between humid and semi-humidpopulations distributed along the Manu Road and acrossthe Cordillera de Vilcanota. Additionally, we ran analysescomparing the two humid populations and the twosemi-humid populations. For each locus we specified amutation rate with error (equal to mutations per locusper year (μ/l/y)) derived from a multi-locus datasetanalyzed in *BEAST using both geological and fossil
Table 1 Proportion of genetic variance explained by geographic or climatic variation
DA Fst/(1-Fst)
Model Geography Climate Shared Geography Climate Shared
geog + [clim1,clim2] 0.4001 −0.0278 0.0660 0.1557 0.0078 0.0969
geog + clim1 0.4838* 0.0102 −0.0176 0.2332 0.0578 0.0194
geog + clim2 0.3392* −0.0841 0.1270 0.1010 −0.1316 0.1516
geog + [temp,seas,prec] 0.8526*** 0.4035* −0.3864 0.2404 0.1287 0.0122
geog + prec 0.4832* 0.0095 −0.0170 0.2321 0.0569 0.0205
geog + seas 0.4865* 0.054 −0.0204 0.3068 0.0545 −0.0545
geog + temp 0.4917* −0.0295 −0.0256 0.2047 −0.0928 0.0479
geog + [prec,seas] 0.3636 −0.047 0.1026 0.1007 −0.0349 0.1518
geog + [prec,temp] 0.5093 −0.0238 −0.0432 0.1870 −0.0294 0.0655
geog + [seas,temp] 0.6909*** 0.2009 −0.2248 0.3160 0.0240 −0.0635
Geographic distance (geog) is the Euclidean distance among sampling sites and climate is the proportion of variance explained by the different climatic variables includedin each model. Clim1 and clim2 are the first two principal components of the entire 19 variable BioClim dataset, explaining 97 % of the variance in total. Temp, seas, andprec are the first principal components for temperature, seasonality, and precipitation BioClim variables, respectively. The proportion of variance shared by both geographyand climate is reported in the columns labeled ‘shared’. High ‘shared’ values would indicate collinearity between ecological and geographic parameters; negative values arean artifact of subtracting adjusted R2 values to derive the shared proportion of variance [83]*p < 0.5; **p < 0.01; ***p < 0.001
Benham and Witt BMC Evolutionary Biology (2016) 16:22 Page 6 of 16

calibrations for hummingbirds [51]. These mutation rateswere: ND2: 9.5 × 10⁻⁶ μ/l/y (95 % HPD: 7.5 × 10−6,1.2 × 10−5 μ/l/y); AK1: 1.0 × 10⁻⁶ μ/l/y (95 % HPD:7.0 × 10⁻⁷, 1.3 × 10⁻⁶ μ/l/y); Bfib7: 1.3 ×10⁻⁶ μ/l/y(95 % HPD: 8.5 × 10⁻⁷, 1.6×10⁻⁶ μ/l/y); and MUSK:9.8 × 10⁻⁷ μ/l/y (95 % HPD: 6.4 × 10⁻⁷, 1.2 × 10⁻⁶ μ/l/y).We applied inheritance scalars to each locus (ND2: 0.25;MUSK: 0.75; AK1: 1.0; Bfib7: 1) to account for variation ineffective population sizes. Benham et al. [51] hypothesizedthat Metallura tyrianthina colonized southern Peru ~2 Ma(95 % HPD: ~1-3 Ma) based on a time-calibrated phyl-ogeny. We use the upper bound of the 95 % HPD from thisprevious analysis to set the prior for divergence time in allanalyses as t = 3 Ma. We constrained the migration rateparameter m to be symmetric to reduce the number ofparameters, as preliminary analyses estimating asymmetricmigration rates were poorly resolved. We also ran severalpreliminary runs with large, flat priors to estimate migra-tion rate and population size [91]. Based on these prelimin-ary analyses, we set the upper bound of a uniform priorthat included the entire posterior distribution of eachparameter (Additional file 1: Table S4). Preliminary analyseswere unable to resolve q for the ancestral population (θA);accordingly, we followed Peters et al. [92] by setting theupper bound of θA to be greater than the sum of θ for thetwo sampled populations. For all four comparisons, we ranthree independent MCMC analyses to ensure convergenceon similar parameter estimates. We also evaluated sta-tionarity of the MCMC analyses by checking whetherESS was >150 for all parameters and examining plotsgenerated by the program for Log [P(G) + P(D|G)] forevidence of long term trends. Runs ran for 105 steps ofburnin and at least 107 steps post-burnin, samplingevery 100 steps to generate 105 genealogies. For allruns, we employed a geometric heating scheme with 50heated chains.
ResultsSequence characteristicsND2 sequences were 1041 bp in length and included 76informative sites (7.3 %). A 90 bp indel in the AK1 intronand a 15 bp indel found in the Bfib7 intron were removedbefore any analyses were conducted, leaving: 337 bp ofAK1 (four informative sites–1.2 %), 629 bp of Bfib7 (fiveinformative sites–0.8 %), and 594 bp of MUSK (four in-formative sites–0.7 %). There were no internal stop codons,indels, or anomalous substitution patterns in the ND2sequences that might indicate amplification of pseudo-genes. However, we excluded one sample (FMNH 433155)because it did not align with other sequences and BLASTreturned ambiguous matches with a variety of humming-bird species. Mitochondrial and nuclear intron sequencedata have been deposited on GenBank, accession numbers:KU527140-KU527416.
Geographic isolationSeven well-supported mitochondrial clades (posteriorprobability > 0.9) were recovered in the Bayesian phyl-ogeny (Fig. 2a). This structure only corresponds to thepopulations sampled in Peru and more extensive phy-logeographic structure exists within this species in thenorthern Andes [51]. The nominate subspecies consists ofone clade (A) isolated by the North Peru Low and >2 %divergent from all other populations (Additional file 1:Table S5). Topographic barriers were associated withphylogenetic structure among all other clades, including:M. t. septentrionalis, on the west side of the central Andes(clade B), which is 0.24 % divergent from a northern cladeof M. t. smaragdinicollis on the east side of the centralAndes (clade C); clade D of southeastern Peru, which isisolated from clade E (0.91 % divergent), of the upperApurímac and Urubamba valleys, by the Cordillera deVilcanota; and finally, an Ayacucho population (clade F)that is bounded by the Mantaro River to the north (0.67 %divergent) and the Aprurímac River to the south (0.79-1.04 % divergent). Some structure was also detectedwithin clade C potentially due to the influence of theHuallaga Valley or isolation by distance. Fst values largelycorresponded to corrected pairwise differences amongclades (Additional file 1: Table S5). A single individualfrom the same locality as clade D showed closer affinitiesto an extra-limital haplogroup from Bolivia (see [51]).Haplotype networks reaffirmed the prominent role ofphysical barriers in structuring neutral genetic diversity.Haplotype structure between the humid montane forestand semi-humid montane scrub habitats only existed inconjunction with physical barriers. Within clade D, birdsfrom both humid and semi-humid habitats shared identi-cal mtDNA haplotypes (Fig. 2b). Finally, using anAMOVA analysis we found that 88.1 % (d.f. 6; sum ofsquares 735.2; variance 6.8) of the genetic variance withinPeruvian M. tyrianthina corresponds to the barriershighlighted in red (Fig. 2c) and only 9.4 % (d.f. 120; sum ofsquares 86.7; variance 7.2) of the genetic variation is foundwithin groups between topographic barriers (Additionalfile 1: Table S6). Nucleotide diversity was highest in cladesA and C. Only clade D exhibited significant deviationsfrom neutrality based on both Fu’s F and Tajima’s D. CladeB also exhibited significant Fu’s F and clades A and C ex-hibited significant Tajima’s D (Additional file 1: Table S7).Deviations from neutrality in these clades may reflect therecent expansion of the species into the central Andes[51] or subtle geographic structure among sampling local-ities within these clades.
Ecological divergenceResults of variation partitioning analyses corroborated astrong role for isolation by geographic distance, but notecological isolation, in shaping patterns of genetic variation
Benham and Witt BMC Evolutionary Biology (2016) 16:22 Page 7 of 16

in Peruvian Metallura tyrianthina. When DA was used asa metric for genetic distance, 33.9–85.3 % of the variancewas explained by geographic isolation alone compared tothe 0.9–40.3 % attributable to certain climatic dissimilar-ities among localities. In no instance did climatic variationexplain patterns of genetic variation better than geographicdistance (Table 1). Moreover, the genetic variance ex-plained by geographic distance alone was found to be sig-nificant when each of the different climatic models wereaccounted for using permutation tests. The highest level ofgenetic variance explained by climate was when PC1 oftemperature, precipitation, and seasonality were all in-cluded in a model (40.3 %). This was also the only combin-ation of climatic variables found to explain a significantproportion of the genetic variance using the permutationtest; however, there was also a high degree of collinearitybetween geography and climate when all climate parame-ters were included in the model (shared proportion of vari-ance: −0.386). Patterns for linearized Fst values wereconsistent with those found for DA, in that geographic iso-lation always explained a greater proportion of the variance(10.07–31.60 %) than climate (0.78–12.87 %). However, lessof the overall variance was explained by geographicisolation and, using the same permutation test, none ofthe variance explained by geographic distance wasfound to be significant when climate was accountedfor (and vice versa).A simple linear regression of bill length versus body
mass indicated a weak, positive relationship (p = 0.015;R2 = 0.024); however, body mass was also found tocontribute very little to bill length variation in M. tyr-ianthina relative to climatic factors in an AICc analysis(Table 2). Given the weak relationship between bodymass and bill length we use length measurements uncor-rected for variation in body mass for all subsequentanalyses. Divergence in mean bill length was greater incomparisons between habitats than comparisons withinhabitats (TukeyHSD test; p < 0.001; Fig. 3). Bill lengthdivergence was comparable among humid and semi-humid population comparisons, respectively (p > 0.1; Fig. 3c).There were no relationships between genetic distance and
bill length divergence, regardless of whether we comparedall populations, populations within the same habitat, or pop-ulations between habitats (for all p > 0.1; Fig. 3).The model including an interaction between PC1 of
seasonality and PC1 of precipitation, plus their maineffects, was the single best model explaining bill lengthvariation, containing 77.8 % of the Akaike weight. Thesecond best model consisted solely of the PC1 of season-ality (22.2 % Akaike weight; ΔAICc =2.50). Although anumber of models were competitively ranked with PC1 ofseasonality (i.e., ΔAICc < 2) all of these models includePC1 of seasonality as a nested component and were thusconsidered uninformative (Table 2; [87]). We additionallyquantified the relative importance of each predictor vari-able by adding together the model weights for each modelin which the variable appeared [93]. This analysishighlighted the overwhelming influence of seasonality(1.0) relative to precipitation (0.55), temperature (0.35), orbody mass (0.37). Linear regression of bill length versusPC1 of seasonality was also highly significant (p < 0.0001;R2 = 0.44; Fig. 4). Seasonality remained a significantexplanatory variable of bill length variation after account-ing for spatial autocorrelation by incorporating data onlatitude and longitude from each sampling site into a non-linear mixed effects model in the R package nlme (https://cran.r-project.org/web/packages/nlme/index.html).
Dual influence of topography on divergenceND2, AK1 and MUSK all exhibited significant diver-gence in Fst across the Cordillera de Vilcanota betweenUrubamba and Carrizales, Fst for Bfib7 was non-significant(Table 3). Significant Fst structure along the Manu Roadwas only found for the AK1 intron, which also had a lowerFst value (0.184) than across the Cordillera de Vilcanota(0.336). Significant genetic structure was also foundbetween the two humid sites (Carrizales and Pillahuata)across all loci and for ND2 and AK1 between the two driersites (Urubamba and Paucartambo).IMa2 analyses of populations separated by the Cordillera
de Vilcanota and between the two semi-humid samplinglocalities showed good evidence of convergence with ESSvalues >150 and all three runs exhibiting similar values forall parameters. By contrast, analyses of the populationsalong the Manu Road and comparisons between the twohumid-site populations did not exhibit evidence for con-vergence (ESS values <100) after sampling 250,000 geneal-ogies despite similar results being obtained across each ofthe three independent runs. Migration rates (m) based onall four loci across both humid to semi-humid comparisonswere found to be greater than zero (Fig. 5a; Table 4); how-ever, average migration rates along the Manu Road (39.92;95 % HPD: 6.31–150) were estimated to be over 19 timesgreater than the average migration rate across theCordillera de Vilcanota (2.10; 95 % HPD: 0.38–9.76).
Table 2 The two best models predicting bill length variationbased on AICc analysis: (1) seasonality, precipitation and theirinteraction; and (2) seasonality alone
Model logL k AICc ΔAICc Model weights
[seas][prec][seas*prec] −310.02 5 630.29 0 0.7776
[seas] −313.34 3 632.79 2.50 0.2224
[mass] −379.04 3 764.18 133.89 0
The 21 models we evaluated include all 15 possible combinations of body mass,PC1 of seasonality (seas), PC1 of precipitation (prec), PC1 of temperature (temp)as well as all six pairwise interactions among the four predictor variables. Relativevariable importance (the sum of model weights in which a particular variableappears) was much greater for seasonality (1.0) than precipitation (0.55),temperature (0.35), or body mass (0.37)
Benham and Witt BMC Evolutionary Biology (2016) 16:22 Page 8 of 16

Within habitat migration rates were greater on averagebetween the two humid sites (39.70; 95 % HPD: 1.51–100) than between the two semi-humid sites (3.38;95 % HPD: 0.68–36.50). Estimated average divergencetimes were greater between the Urubamba populationand all others (0.74–0.94 Ma) than they were betweenthe two Manu Road populations (0.03 Ma) or betweenthe two humid-climate populations (0.03 Ma; Table 4).However, the 95 % HPDs of all divergence time esti-mates overlapped and resolution of this parameter wasgenerally poor, with a peak found in the distribution oft followed by either a long plateau or the values of tdecreasing in probability but plateauing at a low non-zero value. The poor resolution of dates was most likelydue to insufficient data. θ was generally low, varyingfrom 0.14 to 1.40 in all well-resolved populations (Table 4).The posterior distribution of θA was always poorly re-solved as was θ for the population sampled at Pillahuatawith estimates exhibiting long non-zero tails within thespecified prior distribution. Again, we think that this isdue to insufficient data to resolve these estimates ratherthan an inappropriate designation of the upper bound ofthe prior given that all other population sizes were muchsmaller than the upper bound (see above).Cusco populations on the drier, west-facing slopes had
longer bills than those on the humid, east-facing slopes(Fig. 5b). Bill length in Urubamba was significantly lon-ger than all three of the other populations (p < 0.0001).Although bill length in Paucartambo was slightly longer(average 0.47 mm) than birds from the adjacent humidslopes at Pillahuata, this result was not significant whencorrected for multiple comparisons (p = 0.216). Therewere no differences in bill length between the twohumid sites (p > 0.4).
DiscussionGeographic isolation promotes genetic divergencePhylogenetic, network, and AMOVA analyses all point toan important role for topographic barriers in structuringgenetic diversity in Metallura tyrianthina, a result consist-ent with studies of the Genus Metallura as a whole [51, 94]and many other Andean taxa (e.g. [9, 21, 40, 95–97]). Wefound the North Peru Low, Apurímac Valley and highAndean ridges to be associated with genetic structure in M.tyrianthina as in many other taxa [20, 97, 98]. We alsofound the Cordillera de Vilcanota to be an important
0 5 10 15 20
0.00
0.05
0.10
0.15
0.20
0.25
D
Bill
leng
th d
iver
genc
e (m
m)
0 10 20 30 40 50 60
0.00
0.05
0.10
0.15
0.20
0.25
Fst/(1-Fst)
humid:humid semihumid:semihumid humid:semihumid
Bill
leng
th d
iver
genc
e (m
m)
humid: semihumid
0.00
0.05
0.10
0.15
0.20
0.25
Habitat comparison
Bill
leng
th d
iver
genc
e (m
m)
Humid: Humid
Semihumid: Semihumid
a
b
c
A
Fig. 3 Linear regression of bill length versus a pairwise geneticdifferences (DA) and b linearized Fst among all populations. Nosignificant relationships were found across all comparisons. c Boxplotof mean divergence in bill length between all humid sites, semi-humidsites, and among sites in different habitats. Mean divergence betweenhabitats was significantly greater than that between habitats, whereaswithin habitat divergence did not differ
Benham and Witt BMC Evolutionary Biology (2016) 16:22 Page 9 of 16

landscape feature structuring genetic and phenotypic diver-sity; the same cordillera was linked to an older phenotypicand genetic divergence in the hummingbird Adelomyiamelanogenys [65]. Topographic barriers were implicated ingenerating neutral genetic divergence, but not divergencein bill length (Fig. 3; [22]). This suggests that hummingbirdbill morphology does not evolve steadily over time, but di-verges only in response to differential ecological pressures.Although we found discordant patterns of genetic and
morphological divergence in M. tyrianthina, patterns ofplumage variation in the species appear to vary in asso-ciation with topographic barriers and the degree of gen-etic divergence. A high Andean ridge separates thesimilar looking subspecies M. t. smaragdinicollis and M.t. septentrionalis, and the Marañón valley corresponds toturnover between the red-tailed subspecies, M. t. tyr-ianthina, and the two purple-tailed subspecies occupy-ing the rest of Peru [48]. Plumage variation among thesesubspecies cannot be explained by the climatic charac-teristics of the regions in which they are distributed.Instead, plumage divergence generally corresponds withtime since divergence. The two similar purple-tailed
subspecies, which occupy different environments, werefound to be only 0.24 % divergent at the ND2 locus;whereas divergence between red and purple-tailed sub-species distributed in similar environments across theMarañón valley was ~2.2 %. Concordance between tailcolor and genetic divergence in M. tyrianthina is con-sistent with the positive correlation between the extentof plumage and mtDNA divergence across the Marañónvalley, based on multiple passerine genera [22]. Plumagedivergence rate appears to be linked to neutral geneticdivergence and decoupled from functional trait diver-gence (but see [28]).
Bill length varies in association with climatePopulations of Metallura tyrianthina occupying habitatscharacterized by semi-humid montane scrub were foundto have significantly longer bills than birds in humid foresthabitats (Fig. 3c). This marked morphological divergencewas not associated with neutral genetic divergence; rather,we found a strong relationship between climatic and billlength variation, with a model of seasonality, precipitationand their interaction being the strongest predictor of billvariation (Table 1) and seasonality being the most import-ant single predictor (Fig. 4). Our estimate of the strengthof this relationship (r2 = 0.44) is likely conservative consid-ering that the climate data is coarsely interpolated fromunevenly distributed weather stations in the PeruvianAndes. In the Andes, consistent patterns of morphologicaldivergence occurring in association with ecologicaldissimilarities have been found in Adelomyia humming-birds [26, 65] and Glyphorhynchus woodcreepers [32, 64].A similar relationship between bill length and climate wasfound in the hummingbird Adelomyia melanogenys,where 57 % of the variance in bill length was explained byprecipitation seasonality, minimum temperature of the
-3 -2 -1 0 1 2 3
101
112
1314
PC1 Seasonality
Bill
leng
th (
mm
)
More Less
M. t. smaragdinicollis
M. t. septentrionalis
M. t. tyrianthina
Fig. 4 Bill length as a function of PC1 of seasonality (82.9 % of the variation). The linear regression model was highly significant (p < 0.0001) withan R2 of 0.44
Table 3 Fst-values among pairwise comparisons of all fourCusco localities (Fig. 1b)
Vilcanota Manu Road Humid Semi-humid
ND2 0.802*** −0.051ns 0.167* 0.814***
AK1 0.336*** 0.184* 0.290*** 0.245***
Bfib7 −0.055ns −0.0387ns 0.281* −0.012ns
MUSK 0.368*** −0.055ns 0.229* −0.069ns
Vilcanota and Manu Road columns each represent a comparison between a pair ofhumid and semi-humid environments. Humid comparisons are between Carrizalesand Pillahuata populations, semi-humid comparisons are between Urubamba andPaucartambo populationsnsp > 0.05; *p < 0.05; **p < 0.01; ***p < 0.001
Benham and Witt BMC Evolutionary Biology (2016) 16:22 Page 10 of 16

coldest month, and mean elevation [65]. These resultssuggest that climatic variables or other ecological factorscorrelated with climate (see below) may play importantroles in shaping the impressive diversity of hummingbirdbill morphology in the Andes. Concordance betweenecological variation and morphological variation is welldocumented in organisms [99] especially birds wherebill morphology responds readily to climatic and dietarychange [100–102]. Patterns of bill morphology in M.tyrianthina contribute to mounting evidence that theecological differences generated by the topographicallycomplex Andean landscape play an important role in
promoting local adaptation and functional diversity inAndean taxa [28, 30, 32, 33, 65].The variation partitioning approach we used to test for
IBE revealed that geographic distance, not climatic vari-ation, explained the greatest proportion of genetic variance.These results provide additional evidence for an exclusiverole of geographic isolation in promoting genetic diver-gence at the neutral loci studied. Our results resemble asimilar study in Trinidadian guppies where no influence ofecological dissimilarity on genetic variation was detected[103]. However, both a study of Caribbean Anolis species[80] and a meta-analysis [79] found consistent roles for
a
b
11
1213
1415
Bill
leng
th (
mm
)
***
5 10
Kilometers (km)
PillahuataPaucartamboUrubamba Carrizales
Cordillera Vilcanota Manu Road
15 20 2 3 4 51
Ele
vatio
n (m
)
5000
4500
4000
3500
3000 m=2.1 m=39.9
UrubambaCarrizales Pillahuata Paucartambo
Manu RoadCordillera Vilcanota
Fig. 5 a Topographic profiles of the two cordilleras separating sampling sites in the Vilcanota region and along the Manu Road (see Fig. 1c).Arrows with red lettering indicate mean migration rates (m) estimated from IMa2 analyses (Table 4). b Bill length differences among the fourCusco localities. Blue represents the two humid sites and brown the two drier sites. Asterisks indicate p-values for the comparisons of bill lengthbetween two pairs of adjacent populations in humid and semi-humid environments (* < 0.05; ** < 0.001; *** < 0.0001)
Table 4 Parameter estimates for θ (4Neμ), divergence time (t), and symmetrical migration rates (m) inferred from IMa2 analyses
Transect θ1 θ2 θ ancestral t m
Vilcanota 0.321(0.103–0.903) 0.807(0.205–3.117) 0.06(0.00–4.00) 0.7985(0.295–3.0) 2.098(0.383–9.759)
Manu Road 1.402(0.027–0.379) 4.00(0.140–4.00) 1.521(0.00–4.00) 0.031(0.016–2.998) 39.922(6.308–150)
Humid 6.000(0.042–6.0) 0.140(0.036–0.499) 0.587(0–6.00) 0.026(0.001–2.998) 39.702(1.513–100)
Semi-humid 0.260(0.062–0.973) 0.77(0.039–1.199) 1.746(0.0–4.00) 0.939(0.052–2.998) 3.379(0.676–36.501)
95 % HPD range for each parameter presented in parentheses. Mean parameter estimates represent the average across the three independent runs performed forall four comparisons. θ1 refers to estimates of θ for the semi-humid comparison for Vilcanota and Manu Road and θ2 for the humid site. For between humid sitesand semi-humid site comparisons θ1 refers to sites from the Manu Road and θ2 the Vilcanota
Benham and Witt BMC Evolutionary Biology (2016) 16:22 Page 11 of 16

ecologically mediated genetic divergence when comparingthe influence of geographic and ecological distance on pat-terns of genetic variation. In the Andes, similar analysesassaying genetic variation among populations of the wood-creeper Glyphorynchus spirurus in Ecuador found that theAndean ridge separating eastern and western populationsplayed the largest role in structuring genetic divergence.Whereas genetic variance within eastern or western popu-lations was explained largely by ecological variation [64].Although we do not find evidence for isolation by environ-ment in M. tyrianthina, negative results for this test can bedifficult to interpret due to factors such as insufficient timefor divergence to occur at neutral loci or inappropriate eco-logical variables selected [18]. Other distance estimates,such as resistance-based distances [104], consistently ex-plain a greater proportion of the variance in genetic diver-sity than Euclidean geographic distance [80]. Thus, our useof Euclidean distances likely resulted in a conservative esti-mate of the effect of geographic features on genetic diver-gence. In general, the results of our variation partitioningand phylogeographic analyses implicate geographic isola-tion as the major driver of neutral genetic divergence in thisspecies, with little or no additional divergence attributableto ecological differences.
Barriers facilitate functional divergenceIn a wide array of taxa, mismatches between morph-ology and neutral genetic diversity have been interpretedas evidence for phenotypic divergence with gene flow[26, 32, 105–108]. These studies have generally com-pared morphology of adjacent populations in differentenvironments versus isolated populations in similar envi-ronments; however, they do not assess the extent to whichgene flow might prevent populations from achieving localadaptive optima. We compared patterns of gene flow andmorphological divergence between pairs of populations inhumid and semi-humid environments that were either iso-lated by a topographic barrier (Cordillera de Vilcanota) ornot (Manu Road; Fig. 5a). This allowed us to assess how in-teractions between barriers and climate might facilitatefunctional diversification. At all four loci, we found greaterFst-values across the Cordillera de Vilcanota than theManu Road, with only a single locus exhibiting an Fstsignificantly different from zero along the Manu Road(Table 3). Coalescent-based analyses in IMa2 confirmedthat migration rates across the Manu Road were signifi-cantly greater than across the Cordillera de Vilcanota(Fig. 5a; Table 4). Furthermore, migration rates alongthe Manu Road were found to be equal to or greaterthan rates between the two humid sites or between thetwo semi-humid sites. Although MCMC searches insome IMa2 analyses exhibited uncertain convergence,three independent runs always indicated higher migra-tion rates along the Manu Road than across the
Vilcanota, and Fst values corroborated patterns sug-gested by IMa2 analysis.We found an inverse relationship between bill length
divergence and gene flow, with greater divergence in billlength found across the Cordillera de Vilcanota than theManu Road (Fig. 5b). A similar relationship between geneflow and adaptive divergence has been found in numerousnon-Andean taxa [17, 36–38, 109]. Although this patternhas frequently been interpreted as the result of gene flowconstraining adaptive divergence, adaptive divergencecould also restrict gene flow to the extent that it reinforcesreproductive isolation. Teasing apart these mechanisms isa widely recognized challenge [17, 110]. In the presentcase, the fact that landscape features appear to explainlevels of gene flow (Fig. 5a) suggests that adaptive diver-gence is constrained by gene flow, rather than the reverse.An alternative explanation for differences in bill length
between Urubamba and Paucartambo is that they reflectdifferences in the amount of time spent in semi-humid en-vironments. In support of this possibility, migration-rateestimates from IMa2 can be spuriously high, according totwo recent simulation studies [111, 112]. Both studiesfound that in cases of recent divergence (i.e. low Fst), data-sets with few loci exhibited high false-positive rates fornon-zero migration. Given that we only sequenced fourunlinked loci, it is possible that this bias could have con-flated the migration rates that we found along the ManuRoad. However, we think it is likely that low Fst betweenpopulations distributed along the Manu Road was due, atleast in part, to ongoing gene flow. These populations areonly 5 km apart and the intervening area contains agradual habitat transition from semi-humid scrub tohumid forest. Secondly, the uplift of the Cordilleradividing the two sampled populations along the ManuRoad occurred >4 Ma before M. tyrianthina colonizedthe central Andes from the north [45, 51, 113]. Althoughwe consider high gene flow to be the most likely interpret-ation of low genetic divergence across the Manu Road,our relative estimates of gene flow and divergence timeshould be interpreted with caution. The most conservativeinterpretation of our results is that bill length similarity isassociated with genetic similarity at the population level,regardless of whether that similarity is due to recent diver-gence or ongoing connectivity.Although subtle morphological divergence in the face
of gene flow has been demonstrated in other Andeanbirds (e.g. Glyphorynchus spirurus [32]), phylogeneticanalyses have failed to find a pattern of sister species re-placement along ecological gradients [42, 43, 51]. Our re-sults potentially reconcile these contradictory patterns aswe find that adaptive divergence with gene flow is possible,but severely constrained. In Andean birds, it appears thatallopatry is a pre-requisite or co-requisite for functional di-versification and likely the completion of speciation.
Benham and Witt BMC Evolutionary Biology (2016) 16:22 Page 12 of 16

Selection for longer billsRepeated evolution of longer bills in drier, more seasonalhabitats suggests adaptation by natural selection, althoughthe mechanism by which increased bill length mayincrease fitness in these environments has yet to be tested.Given that climatic variation likely covaries with a numberof other potential ecological pressures, pinpointing themechanistic basis of inter-population variation in billlength would require rigorous field observations andexperimentation. Climate could play a direct role in driv-ing bill length differences; however, bill length variation inM. tyrianthina and other Metallura species [114] directlycontradicts Allen’s Rule [100]. Additionally, even thoughincreased bill size can be a key mechanism for sheddingexcess heat while conserving water in drier environments[102, 115, 116] hummingbirds acquire large volumes ofwater from their nectarivorous diets and as a consequencedo not suffer from water limitations to the same degree asother birds [117]. Instead, biotic interactions representmore likely drivers of geographic variation in bill length inMetallura tyrianthina. First, longer bills in drier, lessdiverse environments could be caused by competitiverelease, analogous to bird populations on depauperateislands which tend to exhibit divergent bill morphologiesas part of a more generalist phenotype [118–120]. M. tyr-ianthina has a shorter bill than most other hummingbirdspecies in the humid forests of east-facing Andean slopes.Longer bills might allow M. tyrianthina to exploit agreater variety of flowers on rain-shadowed slopes thatharbor fewer competing nectarivore species. Second,diversifying selection on bill length could be exerted byflower species that have different corolla shapes, a co-evolutionary process that has been well-documented inother hummingbird species [55–57, 121]; this is plaus-ible for M. tyrianthina because striking floral speciesturnover coincides with the climatic gradients alongwhich it occurs.
ConclusionsAndean ridges and valleys hinder connectivity amongpopulations and also create local climatic variation thatimposes differential selection pressures [10, 46]. We in-vestigated this dual role of topography for its effects ondiversity in a widespread hummingbird species, Metal-lura tyrianthina. Across the Peruvian distribution ofthis species, we found that topographic barriers playthe dominant role in structuring effectively neutralgenetic diversity, whereas climatic variation shapespatterns of bill morphology. Moreover, analyses acrossfour sites in the department of Cusco indicated that top-ography promotes genetic structure even across smallspatial scales (<20 km) and bills are longer on rain-shadowed, west-facing slopes. This fine-scale analysis alsorevealed how gene flow constrains functional divergence,
suggesting that topography and climatic variation interactto promote Andean diversification. If functional diver-gence driven by climatic variation permits coexistenceupon secondary contact [19], it could potentially contrib-ute to the evolution of reproductive isolation at laterstages of divergence [18]. These processes could increasethe overall tempo of diversification [122, 123]. Based onour results from Metallura, the east-to-west precipitationgradient may have played an important role in the diversi-fication of several avian genera that contain narrowlydistributed and geographically variable taxa in the centralAndes (e.g. Ochthoeca, Anairetes, Atlapetes, Cranioleuca,Spinus). Indeed, analyses comparing speciation ratesamong Andean and adjacent lowland lineages have foundoverall higher speciation rates in the Andes, a patterndriven in part by genera such as Cranioleuca [124, 125]and Spinus [125, 126]. Topographic barriers and eco-logical variation have clearly interacted to produce highspecies diversification rates in Andean birds. The currentresults suggest that rates of functional diversificationshould also be accelerated when physical landscape fea-tures coincide with ecoclimatic variation.
Availability of supporting dataThe bill length dataset supporting the results of thisarticle are included within the article (and its additionalfile(s)). Mitochondrial and nuclear intron sequence datahave been deposited on GenBank, accession numbers:KU527140-KU527416.
Additional file
Additional file 1: Table S1. Museum specimens and tissues used instudy, sampling localities, bill length measurements, and body mass.Table S2. Loadings from principal component analysis of temperature,precipitation, and seasonality Bioclim variables. Table S3. Loadings fromprincipal components analysis of all 19 BioClim variables. Table S4. Parametersettings for each of the four IMa2 analyses. Table S5. Corrected pairwisedifferences and Fst values among all populations. Table S6. Results of AMOVAanalysis. Table S7. Standard indices of molecular diversity for each cladebased on ND2. (DOCX 174 kb)
Competing interestsThe authors declare that they have no competing interests.
Authors’ contributionsPMB and CCW designed the research and wrote the paper. P.M.B. collected andanalyzed the data. Both authors have read and approved the final version ofthe manuscript.
AcknowledgementsWe thank the following museums and individuals for providing access totissues and specimens: Centro de Ornitologia y Biodiversidad (CORBIDI: T.Valqui, W. Nuñez); Lousiana State University Museum of Natural Science(LSUMZ: D. Dittmann, R. T. Brumfield); Field Museum of Natural History(FMNH: D. Willard); the Museum of Southwestern Biology of the University ofNew Mexico (MSB: A.B. Johnson). Labwork, fieldwork, and logistics were onlypossible with the help of R.W. Dickerman, E. J. Beckman, S. G. DuBay, N. A.Wright, L. M. Flores, A. Quiñonez Z., E. Bautista, S. Figueroa, S. M. McNew, C. J.Schmitt, A. B. Johnson, M. J. Lelevier, M. R. Jones, T. Valqui, and personnel at
Benham and Witt BMC Evolutionary Biology (2016) 16:22 Page 13 of 16

DGFFS (now SERFOR) in Peru. This work was funded in part by the followinggrants: F. M. Chapman Memorial Fund of the AMNH, UNM BiologyDepartment Scholarships, NSF grant DEB-1146491, and a seed grant fromthe UNM Center of Evolutionary and Theoretical Immunology.
Received: 16 October 2015 Accepted: 18 January 2016
References1. Myers N, Mittermeier RA, Mittermeier CG, da Fonesca GAB, Kent J.
Biodiversity hotspots for conservation priorities. Nature. 2000;403:853–8.2. Price TD, Hooper DM, Buchanan CD, Johansson US, Tietze DT, Alström P,
et al. Niche filling slows the diversification of Himalayan songbirds. Nature.2014;509:222–5.
3. Hall JPW. Montane speciation patterns in Ithomiola butterflies (Lepidoptera:Riodinidae): are they consistently moving up in the world? Proc Roy SocLond B. 2005;272:2457–66.
4. Roberts JL, Brown JL, May RV. Genetic divergence and speciation in lowlandand montane Peruvian poison frogs. Mol Phylogenet Evol. 2006;41:149–64.
5. McGuire JA, Witt CC, Altshuler DL, Remsen Jr JV. Phylogenetic systematicsand biogeography of hummingbirds: Bayesian and maximum likelihoodanalyses of partitioned data and selection of an appropriate partitioningstrategy. Syst Biol. 2007;56:837–56.
6. Elias M, Joron M, Willmott K, Silva-Brandão KL, Kaiser V, Arias CF, et al. Out ofthe Andes: patterns of diversification in clearwing butterflies. Mol Ecol. 2009;18:1716–29.
7. Sedano RE, Burns KJ. Are the northern Andes a species pump for Neotropicalbirds? Phylogenetics and biogeography of a clade of Neotropical tanagers(Aves: Thraupini). J Biogeogr. 2010;37:325–43.
8. Hutter CR, Guayasamin JM, Wiens JJ. Explaining Andean megadiversity: theevolutionary and ecological causes of glassfrog elevational richness patterns.Ecol Lett. 2013;16:1135–44.
9. Pocco ME, Posadas P, Lange CE, Cigliano MM. Patterns of diversification in thehigh Andean Ponderacris grasshoppers (Orthoptera: Acrididae: Melanoplinae).Syst Entomol. 2013;38:365–89.
10. Ruggiero A, Hawkins BA. Why do mountains support so many species ofbirds? Ecography. 2008;31:306–15.
11. Jordan DS. The origin of species through isolation. Science. 1905;22:545–62.12. Mayr E. Systematics and the origin of species. New York: Columbia University
Press; 1942.13. Mayr E. Animal species and evolution. Cambridge: Belknap Press of Harvard
University Press; 1963.14. Graves GR. Elevational correlates of speciation and intraspecific geographic
variation in Andean forest birds. Auk. 1985;103:556–79.15. Price TD. Speciation in Birds. Greenwood Village: Roberts & Company; 2008.16. Via S. Sympatric speciation in animals: the ugly duckling grows up. Trends
Ecol Evol. 2001;16:381–90.17. Räsänen K, Hendry AP. Disentangling interactions between adaptive
divergence and gene flow when ecology drives diversification. Ecol Lett.2008;11:624–36.
18. Nosil P. Ecological Speciation. Oxford: Oxford University Press; 2012.19. Price TD. The roles of time and ecology in the continental radiation of the
Old World leaf warblers (Phylloscopus and Seicercus). Philos T Roy Soc B.2010;365:1749–62.
20. Cracraft J. Historical biogeography and patterns of differentiation within theSouth American avifauna: areas of endemism. Ornithol Monogr. 1985;36:49–84.
21. Picard D, Sempere T, Plantard O. Direction and timing of uplift propagationin the Peruvian Andes deduced from molecular phylogenetics of highlandbiotaxa. Earth Planet Sc Lett. 2008;271:326–36.
22. Winger BM, Bates JM. The tempo of trait divergence in geographic isolation:avian speciation across the Marañon Valley of Peru. Evolution. 2015;69:772–82.
23. Coyne JA, Orr HA. Speciation. Sunderland: Sinauer Associates, Inc.; 2004.24. Hedges SB, Marin J, Suleski M, Paymer M, Kumar S. Tree of life reveals
clock-like speciation and diversification. Mol Biol Evol. 2015;32:835–45.25. Cadena CD, Klicka J, Ricklefs RE. Evolutionary differentiation in the
Neotropical montane region: molecular phylogenetics and phylogeography ofBuarremon brush- finches (Aves, Emberizidae). Mol Phylogenet Evol. 2007;44:993–1016.
26. Chaves JA, Pollinger JP, Smith TB, LeBuhn G. The role of geography andecology in shaping the phylogeography of the speckled hummingbird(Adelomyia melanogenys) in Ecuador. Mol Phylogenet Evol. 2007;43:795–807.
27. Weir JT, Bermingham E, Miller MJ, Klicka J, González MA. Phylogeographyof a morphologically diverse Neotropical montane species, the commonbush-tanager (Chlorospingus opthalmicus). Mol Phylogenet Evol. 2008;47:650–64.
28. Cadena CD, Cheviron ZA, Funk WC. Testing the molecular and evolutionarycauses of a ‘leapfrog’ pattern of geographical variation in coloration. J EvolutionBiol. 2011;24:402–14.
29. Kozak KH, Wiens JJ. Accelerated rates of climatic-niche evolution underlierapid species diversification. Ecol Lett. 2010;13:1378–89.
30. Cheviron ZA, Brumfield RT. Migration-selection balance and local adaptationof mitochondrial haplotypes in rufous-collared sparrows (Zonotrichiacapensis) along an elevational gradient. Evolution. 2009;63:1593–605.
31. McCracken KG, Barger CP, Bulgarella M, Johnson KP, Kuhner MK, Moore AV,et al. Signatures of high-altitude adaptation in the major hemoglobin of fivespecies of Andean dabbling ducks. Am Nat. 2009;174:631–50.
32. Milá B, Wayne RK, Fitze P, Smith TB. Divergence with gene flow and fine-scale phylogeographical structure in the wedge-billed woodcreeper,Glyphorynchus spirurus, a Neotropical rainforest bird. Mol Ecol. 2009;18:2979–95.
33. Wilson RE, Peters JL, McCracken KG. Genetic and phenotypic divergencebetween low- and high-altitude populations of two recently divergedcinnamon teal subspecies. Evolution. 2012;67:170–84.
34. Gutiérrez-Pinto N, McCracken KG, Alza L, Tubaro P, Kopuchian C, Astie A,et al. The validity of ecogeographic rules is context dependent: testing forBergmann’s and Allen’s rules by latitude and elevation in a widespreadAndean duck. Biol J Linn Soc. 2014;111:850–62.
35. Galen SC, Natarajan C, Moriyama H, Weber RE, Fago A, Benham PM, et al.Contribution of a mutational hotspot to hemoglobin adaptation in high-altitude Andean house wrens. Proc Nat Acad Sci USA. 2015. doi:10.1073/pnas.1507300112.
36. Nosil P, Crespi BJ. Does gene flow constrain adaptive divergence or viceversa? A test using ecomorphology and sexual isolation in Timema cristinaewalking-sticks. Evolution. 2004;58:102–12.
37. Postma E, van Noordwijk AJ. Gene flow maintains a large genetic differencein clutch size at a small spatial scale. Nature. 2005;433:65–8.
38. Nosil P. Ernst Mayr and the integration of geographic and ecological factorsin speciation. Biol J Linn Soc. 2008;95:26–46.
39. Graham CH, Ron SR, Santos JC, Schneider CJ, Moritz C. Integrating phylogeneticsand environmental niche models to explore speciation mechanisms indendrobatid frogs. Evolution. 2004;58:1781–93.
40. Patton JL, Smith MF. mtDNA phylogeny of Andean mice: a test ofdiversification of across ecological gradients. Evolution. 1992;46:174–83.
41. Ribas CC, Moyle RG, Miyaki CY, Cracraft J. The assembly of montane biotas:linking Andean tectonics and climatic oscillations to independent regimesof diversification in Pionus parrots. Proc Roy Soc Lond B. 2007;274:2399–408.
42. Parra JL, Remsen Jr JV, Alvarez-Reballedo M, McGuire JA. Molecularphylogenetics of the hummingbird genus Coeligena. Mol Phylogenet Evol.2009;53:425–34.
43. Quintero E, Ribas CC, Cracraft J. The Andean Hapalopsittaca parrots (Psittacidae,Aves): an example of montane-tropical lowland vicariance. Zool Scr. 2013;42:28–43.
44. Freeman BG. Competitive interactions upon secondary contact driveelevational divergence in tropical birds. Am Nat. 2015;186:470–9.
45. Schluter D. Evidence for ecological speciation and its alternative. Science.2009;323:737–41.
46. Graves GR. Bergmann’s rule near the equator: latitudinal clines in body sizeof an Andean passerine bird. Proc Nat Acad Sci USA. 1991;88:2322–5.
47. Gregory-Wodzicki KM. Uplift history of the central and northern Andes: areview. Geol Soc Am Bull. 2000;112:1091–105.
48. Schulenberg TS, Stotz DS, Lane DF, O’Neill JP, Parker III TA. Birds of Peru.Princeton: Princeton University Press; 2007.
49. Hoorn C, Isselingh FP, ter Steege H, Bermudz MA, Mora A, Sevink J, et al.Amazonia through time: Andean uplift, climate change, landscapeevolution, and biodiversity. Science. 2010;330:927–31.
50. Rech JA, Currie BS, Shullenberger ED, Dunagan SP, Jordan TE, Blanco N,et al. Evidence for the development of the Andean rain shadow from aNeogene isotopic record in the Atacama Desert. Chile Earth Planet Sc Lett.2010;292:371–82.
51. Benham PM, Cuervo AM, McGuire JA, Witt CC. Biogeography of the Andeanmetaltail hummingbirds: contrasting evolutionary histories of tree line andhabitat-generalist clades. J Biogeogr. 2015;42:763–77.
Benham and Witt BMC Evolutionary Biology (2016) 16:22 Page 14 of 16

52. Edgar RC. MUSCLE: multiple sequence alignment with high accuracy andhigh throughput. Nucleic Acids Res. 2004;32:1792–7.
53. Stephens M, Smith NJ, Donnely P. A new statistical method for haplotypereconstruction from population data. Am J Hum Genet. 2001;68:978–89.
54. Stephens M, Donnely P. A comparison of Bayesian methods for haplotypereconstruction. Am J Hum Genet. 2003;73:1162–9.
55. Temeles EJ, Koulouris CR, Sander SE, Kress WJ. Effect of flower shape andsize on foraging performance and trade-offs in a tropical hummingbird.Ecology. 2009;90:1147–61.
56. Nattero J, Sérsic AN, Cocucci AA. Geographic variation of floral traits inNicotiana glauca: relationships with biotic and abiotic factors. Acta Oecol.2010;37:503–11.
57. Temeles EJ, Kress WJ. Adaptation in a plant-hummingbird association.Science. 2003;300:630–3.
58. Grant PR, Price TD. Population variation in continuously varying traits as anecological genetics problem. Amer Zool. 1981;21:795–811.
59. Winker K. Specimen Shrinkage in Tennessee Warblers and “Traill’s”Flycatchers. J Field Ornithol. 1993;64:331–6.
60. Bleiweiss R. Joint effects of feeding and breeding behavior on trophicdimorphism in hummingbirds. Proc Roy Soc Lond B. 1999;266:2491–7.
61. Temeles EJ, Miller JS, Rifkin JL. Evolution of sexual dimorphism in bill sizeand shape of hermit hummingbirds (Phaethornithinae): a role for ecologicalcausation. Philos T Roy Soc B. 2010;365:1053–63.
62. Hijmans RJ, Cameron SE, Parra JL, Jones PG, Jarvis A. Very high resolutioninterpolated climate surfaces for global land areas. Int J Climatol. 2005;25:1965–78.
63. Graham CH, Silva N, Velásquez-Tibatá J. Evaluating the potential causes ofrange limits of birds of the Colombian Andes. J Biogeogr. 2010;37:1863–75.
64. Thomassen HA, Buermann W, Milá B. Modeling environmentally associatedmorphological and genetic variation in a rainforest bird, and its applicationto conservation prioritization. Evol Appl. 2010;3:1–16.
65. Chaves JA, Smith TB. Evolutionary patterns of diversification in the Andeanhummingbird genus Adelomyia. Mol Phylogenet Evol. 2011;60:207–18.
66. Tinoco BA, Astudillo PX, Latta SC, Graham CH. Distribution, ecology andconservation of an endangered Andean hummingbird: the violet-throatedmetaltail (Metallura baroni). Bird Conserv Int. 2009;19:63–76.
67. Ronquist F, Huelsenbeck JP. MRBAYES 3: Bayesian phylogenetic inferenceunder mixed models. Bioinformatics. 2003;19:1572–4.
68. Miller MA, Pfeiffer W, Schwartz T. Creating the CIPRES science gateway forinference of large phylogenetic trees. Proceedings of the Gateway ComputingEnvironments Workshop (GCE). 2010;1–8.
69. Akaike H. A new look at the statistical model identification. IEEE T AutomatContr. 1974;19:716–23.
70. Posada D. jModelTest: Phylogenetic model averaging. Mol Biol Evol. 2008;25:1253–6.
71. Guindon S, Gascuel O. A simple, fast, and accurate method to estimatelarge phylogenies by Maximum Likelihood. Syst Biol. 2003;52:696–704.
72. Nylander JAA, Wilgenbusch JC, Warren DL, Swofford DL. AWTY (are wethere yet?): a system for graphical exploration MCMC convergence inBayesian phylogenetics. Bioinformatics. 2008;24:581–3.
73. Librado P, Roza J. DnaSP v5: a software for comprehensive analysis of DNApolymorphism data. Bioinformatics. 2009;25:1451–2.
74. Bandelt HJ, Forster P, Rohl A. Median-joining networks for inferring intraspecificphylogenies. Mol Biol Evol. 1999;16:37–48.
75. Weir JT. Implications of genetic differentiation in Neotropical montaneforest birds. Ann Mo Bot Gard. 2009;96:410–33.
76. Nei M, Li WH. Mathematical model for studying genetic variation in termsof restriction endonucleases. Proc Nat Acad Sci USA. 1979;76:5269–73.
77. Excoffier L, Laval G, Schneider S. Arlequin ver. 3.0: An integrated softwarepackage for population genetics data analysis. Evol Bioinformatics Online.2005;1:47–50.
78. Slatkin M. Inbreeding coefficients and coalescence times. Genet Res. 1991;58:167–75.
79. Shafer ABA, Wolf JBW. Widespread evidence for incipient ecological speciation: ameta- analysis of isolation-by-ecology. Ecol Lett. 2013;16:940–50.
80. Wang IJ, Glor RE, Losos JB. Quantifying the roles of ecology and geographyin spatial genetic divergence. Ecol Lett. 2012;16:175–82.
81. Wang IJ, Bradburd GS. Isolation by environment. Mol Ecol. 2014;23:5649–62.82. Oksanen J, Kindt R, Legendre P, Ohara B, Stevens MHH. Vegan: community
ecology package. R package version 1.8.8. 2007. http://r-forge.r-project.org/projects/vegan.
83. Peres-Neto PR, Legendre P, Dray S, Borcard D. Variation partitioning ofspecies data matrices: Estimation and comparison of fractions. Ecology.2006;87:2614–25.
84. Legendre P, Fortin MJ. Comparison of the Mantel test and alternativeapproaches for detecting complex multivariate relationships in the spatialanalysis of genetic data. Mol Ecol Resources. 2010;10:831–44.
85. Legendre P, Fortin MJ, Borcard D. Should the Mantel test be used in spatialanalysis? Methods Ecol Evol. 2015. doi:10.1111/2041-210X.12425.
86. Johnson JB, Omland KS. Model selection in ecology and evolution. TrendsEcol Evol. 2004;19:101–8.
87. Arnold TW. Uninformative parameters and model selection using Akaike’sinformation criterion. J Wildlife Manage. 2010;74:1175–8.
88. Hey J. Isolation with migration models for more than two populations. MolBiol Evol. 2010;27:905–20.
89. Hey J, Nielsen R. Integration within the Felsenstein equation for improvedMarkov chain Monte Carlo methods in population genetics. Proc Nat AcadSci USA. 2007;104:2785–90.
90. Hudson RR, Kaplan NL. Statistical properties of the number of recombinationevents in the history of a sample of DNA sequences. Genetics. 1985;111:147–64.
91. Won YJ, Hey J. Divergence Population Genetics of Chimpanzees. Mol BiolEvol. 2004;22:297–307.
92. Peters JL, Zhuravlev Y, Fefelov I, Logie A, Omland KE. Nuclear loci andcoalescent methods support ancient hybridization as cause of mitochondrialparaphyly between gadwall and falcated duck (Anas spp.). Evolution. 2007;61:1992–2006.
93. Burnham KP, Anderson DR. Model selection and multimodel inference. NewYork: Springer; 2002.
94. García-Moreno J, Arctander P, Fjeldså J. Strong diversification at the treelineamong Metallura hummingbirds. Auk. 1999;116:702–11.
95. Gutiérrez-Pinto N, Cuervo AM, Miranda J, Pérez-Emán J, Brumfield RT,Cadena CD. Non- monophyly and deep genetic differentiation acrosslow-elevation barriers in a Neotropical montane bird (Basileuterus tristriatus;Aves: Parulidae). Mol Phylogenet Evol. 2012;64:56–165.
96. Valderrama E, Pérez-Emán JL, Brumfield RT, Cuervo AM, Cadena CD. Theinfluence of the complex topography and dynamic history of the montaneNeotropics on the evolutionary differentiation of a cloud forest bird(Premnoplex brunnescens, Furnariidae). J Biogeogr. 2014;41:1533–46.
97. Parker III TA, Schulenberg TS, Graves GR, Braun MJ. The avifauna of theHuancabamba region. Northern Peru Ornithological Monographs. 1985;36:169–97.
98. Bates JM, Zink RM. Evolution into the Andes: molecular evidence for speciesrelationships in the genus Leptopogon. Auk. 1994;111:507–15.
99. Smith FA, Betancourt JL, Brown JH. Evolution of body size in the woodratover the past 25,000 years of climate change. Science. 1995;270:2012–4.
100. Zink RM, Remsen Jr JV. Evolutionary processes and patterns of geographicvariation in Birds. In: Johnton RF, editor. Current Ornithology. New York:Plenum Press; 1986. p. 1–69.
101. Francis CD, Guralnick RP. Fitting the bill: do different winter food resourcesinfluence juniper titmouse (Baeolophus ridgwayi) bill morphology? Biol JLinn Soc. 2010;101:667–79.
102. Greenberg R, Danner R, Olsen B, Luther D. High summer temperatureexplains bill size variation in salt marsh sparrows. Ecography. 2011;34:001–7.
103. Crispo E, Bentzen P, Reznick DN, Kinnison MT, Hendry AP. The relativeinfluence of natural selection and geography on gene flow in guppies. MolEcol. 2006;15:49–62.
104. McRae BH, Beier P. Circuit theory predicts gene flow in plant and animalpopulations. Proc Nat Acad Sci USA. 2007;104:19885–90.
105. Schneider CJ, Smith TB, Larison B, Moritz C. A test of alternative models ofdiversification in tropical rainforests: ecological gradients vs. rainforestrefugia. Proc Nat Acad Sci USA. 1999;96:13869–73.
106. Smith TB, Calsbeek R, Wayne RK, Holder KH, Pires D, Bardeleben C. Testingalternative mechanisms of evolutionary divergence in an African rain forestpasserine bird. J Evolution Biol. 2004;18:257–68.
107. Smith TB, Thomassen HA, Freedman AH, Sehgal RNM, Buermann W, SaatchiS, et al. Patterns of divergence in the olive sunbird Cyanomitra olivacea(Aves: Nectariniidae) across the African rainforest-savanna ecotone. Biol JLinn Soc. 2011;103:821–35.
108. Kirschel A, Slabbekoorn H, Blumstein DT. Testing alternative hypotheses forevolutionary diversification in an African songbird: rainforest refugia versusecological gradients. Evolution. 2011;65:3162–74.
109. Smith TB, Wayne RK, Girman DJ, Bruford MJ. A role for ecotones ingenerating rainforest biodiversity. Science. 1997;276:1855–7.
Benham and Witt BMC Evolutionary Biology (2016) 16:22 Page 15 of 16

110. Garant D, Forde SE, Hendry AP. The multifarious effects of dispersal andgene flow on contemporary adaptation. Funct Ecol. 2007;21:434–43.
111. Cruickshank TE, Hahn MW. Reanalysis suggests that genomic islands ofspeciation are due to reduced diversity, not reduced gene flow. Mol Ecol.2014;23:3133–57.
112. Hey J, Chung Y, Sethuraman A. On the occurrence of false positives in testsof migration under an isolation-with-migration model. Mol Ecol. 2015;24:5078–83.
113. Garzione CN, Hoke GD, Libarkin JC, Withers S, MacFadden B, Eiler J, et al.Rise of the Andes. Science. 2008;320:1304–7.
114. Heindl M, Schuchmann KL. Biogeography, geographical variation andtaxonomy of the Andean hummingbird genus Metallura GOULD, 1847.J Ornithol. 1998;139:425–73.
115. Hagan AA, Heath JE. Regulation of heat loss in the duck by vasomotion inthe bill. J Therm Biol. 1980;5:95–101.
116. Tattersall GJ, Andrade DV, Abe AS. Heat exchange from the toucan billreveals a controllable vascular thermal radiator. Science. 2009;325:468–70.
117. Beuchat CA, Calder III WA, Braun EJ. The integration of osmoregulation andenergy balance in hummingbirds. Physiol Zool. 1990;63:1059–81.
118. Grant PR, Grant BR. How and why species multiply: the radiation of Darwin’sfinches. Princeton: Princeton University Press; 2008.
119. Lomolino MV, van der Geer AA, Lyras GA, Palombo MR, Sax DF, Rozzi R. Ofmice and mammoths: generality and antiquity of the island rule. J Biogeogr.2013;40:1427–39.
120. van der Geer AA, Lyras GA, Lomolino MV. Body size evolution of palaeo-insularmammals: temporal variations and interspecific interactions. J Biogeogr. 2013;40:1440–50.
121. Temeles EJ, Linhart YB, Masonjones M, Masonjones HD. The role of flowerwidth in hummingbird bill length‐flower length relationships. Biotropica.2002;34:68–80.
122. Weir JT, Price TD. Limits to speciation inferred from times to secondary sympatryand ages of hybridizing species along a latitudinal gradient. Am Nat. 2012;177:462–9.
123. Rabosky DL. Diversity-Dependence, Ecological speciation, and the role ofcompetition in macroevolution. Annu Rev Ecol Syst. 2013;44:481–502.
124. García-Moreno J, Arctander P, Fjeldså J. A case of rapid diversification in theneotropics: phylogenetic relationships among Cranioleuca spinetails (Aves:Furnaraiidae). Mol Phylogenet Evol. 1999;12:273–81.
125. Weir JT. Divergent timing and patterns of species accumulation in lowlandand highland Neotropical birds. Evolution. 2006;60:842–55.
126. Beckman EJ, Witt CC. Phylogeny and biogeography of the New Worldsiskins and goldfinches: rapid, recent radiation in the Central Andes. MolPhylogenet Evol. 2015;87:28–45.
• We accept pre-submission inquiries
• Our selector tool helps you to find the most relevant journal
• We provide round the clock customer support
• Convenient online submission
• Thorough peer review
• Inclusion in PubMed and all major indexing services
• Maximum visibility for your research
Submit your manuscript atwww.biomedcentral.com/submit
Submit your next manuscript to BioMed Central and we will help you at every step:
Benham and Witt BMC Evolutionary Biology (2016) 16:22 Page 16 of 16