
IVMS Shaping Professionalism: AMA Medical Professionalism II
The Office of Public Services Reform
The Drivers of Satisfaction with Public Services
Research Study Conducted for the Office of Public Services Reform
April - May 2004


The Drivers of Satisfaction with Public Services for the Office of Public Services Reform
Contents
Introduction 1
Executive Summary 3
Key Drivers of Satisfaction 6
Performance on Key Drivers 11
Additional Key Drivers Analysis 26
Expectations of the Public and Private Sector 28
Methods of Contact 32
Conclusions 33
Appendices
Note on weighting
Statistical reliability
Social class definitions

The Drivers of Satisfaction with Public Services for the Office of Public Services Reform
1
Introduction This report contains the findings of research study conducted by the MORI Social Research Institute on behalf of the Office of Public Service Reform (OPSR) at the Cabinet Office.
MORI SRI has conducted a review of approaches to measuring and understanding customer satisfaction with public services, which summarised existing research and literature on the subject for the OPSR.
This report builds on the body of research reviewed, and ultimately aims to develop a list of key drivers of satisfaction across a range of services, which could be used in general customer satisfaction surveys carried out in different public services.
Objectives
In order to improve the quality of public services, it is important to understand what elements are most important in determining satisfaction with a public service transaction – the key drivers. While there have been some studies in individual departments and sectors to identify these factors, little has been done in this country to understand the generic drivers of satisfaction across the public sector. The main objective of this research was to identify a set of elements that might have an impact on satisfaction with different public services, and to use the experiences of a representative sample of the general public to ask whether a generic set of key drivers can be found.
In addition, the survey also asked overall attitudes towards the public sector, and comparisons with the private sector, and measured expectations of response times, which can be tracked over time.
Methodology MORI interviewed a representative sample of 1,502 members of the general public aged 16+. This includes 287 booster interviews about education. The sample for the survey was drawn using Random Digit Dialling (RDD) and results were recorded using Computer Assisted Telephone Interviewing (CATI). Fieldwork for the survey took place between 23 April – 5 May 2004.
Quotas Quotas were set on age, gender, country/region and work status. Data was weighted by ethnicity, social class and working status to reflect the known profile of Great Britain. Additional weighting was carried out on part of the data to correct for extra interviews about education. (Please refer to the Note on Weighting section appended to this report for more details.)

The Drivers of Satisfaction with Public Services for the Office of Public Services Reform
2
Presentation and Interpretation of the Data Because a sample, not the entire population of Great Britain has been interviewed, all results are subject to sampling tolerances. This means that both are accurate to within certain limits, and that not all differences between sub-groups are statistically significant. (Please refer to the Statistical Reliability section appended to this report for more details). Where percentages do not add up to 100, this may be due to multiple responses, computer rounding or the exclusion of ‘Don’t know/Not stated’ responses. Throughout the report an asterisk (*) denotes a value of less than half a per cent, but more than zero.
Publication of Data
Our standard Terms and Conditions apply to this, as to all studies we carry out. Compliance with the MRS Code of Conduct and our clearing of any copy or data for publication, web-siting or press release which contains any data derived from MORI research is necessary. This is to protect our client’s reputation and integrity as much as our own. We recognise that it is in no one’s best interests to have survey findings published which could be misinterpreted, or could appear to be inaccurately, or misleadingly, presented.

The Drivers of Satisfaction with Public Services for the Office of Public Services Reform
3
Executive Summary Key Drivers of Satisfaction This research has identified a powerful set of five factors that drive satisfaction across public services. This model should be seen as a tool to help all those involved in delivering public services identify and monitor the areas that are important to their customers (the techniques used in this study are also transferable). Individual public services will also have different elements they will need to cover, but these five factors should be applicable to all. The key drivers, in order of their impact, are:
1. Delivery - the service delivers the outcome it promised and manages to deal with any problems that may arise.
2. Timeliness – the service responds immediately to the initial customer contact and deals with the issue at the heart of it quickly and without passing it on between staff.
3. Professionalism – staff are competent and treat customers fairly.
4. Information - the information given out to customers is accurate and comprehensive and they are kept informed about progress.
5. Staff attitude - staff are friendly, polite and sympathetic to customers’ needs.
Source: MORI
Satisfaction with service
30%
Delivery
18%
16%
Information
12%
Staff attitude
24%Timeliness
Professionalism
Drivers
Key drivers of satisfaction
This model explains 67% of the variation in satisfaction
Main elementsThe final outcomeThe way the service kept its promisesThe way the service handled any problems
Competent staffBeing treated fairly
AccuracyComprehensivenessBeing kept informed about progress
Polite and friendly staffHow sympathetic staff were to your needs
Initial waitHow long it takes overallNumber of times had to contact the service
Among people who visit offices in person, there is a sixth key driver – the physical environment (whether offices are clean and comfortable, and the appearance of staff). However, it is not as strong as the five identified above. Access is also a

The Drivers of Satisfaction with Public Services for the Office of Public Services Reform
4
factor affecting people’s satisfaction with public services (made up of the choice of different ways there is to access a service and how easy it is to access a service, including opening hours). However, it does not come out as a significant driver of satisfaction in this analysis.
We are also able to identify the key drivers of satisfaction with health services and education specifically. In both cases, the same five key drivers, in the same order, are important in driving customer views.
Performance Performance on key drivers, reflecting overall satisfaction, tends to be high – especially on ratings of staff. However, satisfaction with public service delivery and timeliness, the top two key drivers, is relatively lower than on the other service aspects.
In particular, areas that are crucial to customers which currently receive lower satisfaction scores are the service’s ability to keep customers ‘informed about progress’ and the way the service ‘handles problems’. Information provision is traditionally an area where public services could improve, but what this highlights is the importance of keeping people up-to-date throughout the process, not just providing them with information at the initial contact. Additionally, over one in five people are dissatisfied with the ‘overall time’ it took to deal with the reason of contact.
Satisfaction with public services tends to be highest among:
• users of health and education services;
• older people; and
• those who contact services in person.
This is not unusual; health and education services often receive high ratings, and older people tend to be more satisfied with services generally. There is also some overlap here: older people are more likely to contact health services, and less likely to use the phone.
For different reasons, the most dissatisfied groups are found among:
• the middle classes (higher expectations); and
• those who have contacted public services by letter (more likely to be complaining).
Local government is the worst performing service by some margin.

The Drivers of Satisfaction with Public Services for the Office of Public Services Reform
5
Expectations of the public and private sector Comparing the public and private sector, generally people think the private sector performs better at providing services (particularly men, younger people and the middle classes), and have higher expectations in terms of response times. There is some evidence from this survey that people expect lower response times from public services than they did five years ago.
Contacting public services Personal contact and telephone are the most frequent and preferred methods of contact with public services. More people would prefer to use telephone to contact public services than is currently the case (though it should be noted that people who use the phone tend to be more dissatisfied, so increasing the use of telephone contact may have some implications). Nevertheless, it will remain crucial to offer a range of methods of contact – for example, people tend to prefer the telephone when contacting health services, the police and local councils, but would rather contact education and transport services in person.
Conclusions As has been discovered in other countries, there is a coherent framework of key drivers of satisfaction across public services (even if individual services will have their own particular drivers as well). This framework should provide a useful tool for public service managers and policy makers to focus their efforts on improving customer service, and to demonstrate what needs to be monitored to evaluate the impact of these changes on the customer experience.
©MORI/J22127 Ben Page
Gideon Skinner Darcy Vasickova

The Drivers of Satisfaction with Public Services for the Office of Public Services Reform
6
Key Drivers of Satisfaction Memorable Public Services Experience On average, people have contacted six public services in the past 12 months. When asked to pick a particularly memorable experience (either good or bad), half choose a health service and they were mostly satisfied with the service they received. Around one in ten choose a memorable contact with a local government service (such as local council or local leisure centres) or identifies education services. Other frequently used services are the police, transport and post offices.
Source: MORI
Memorable public services experience
50%10%
7%7%7%
4%3%3%
2%2%2%
1%1%
1%
Base: All (1,502)
Health servicesEducation services
The policeTransportPost OfficeInland RevenueLibrarySocial ServicesLocal authority sports/leisure centreCouncil housing servicesJob Centre PlusPassport Agency
Other
Your local council
Overall satisfaction with public services Three times as many people are satisfied with their memorable experience of public services than dissatisfied. Perhaps because we asked people to think of a memorable experience, feelings tend to be concentrated on the more extreme ends of the satisfaction scale – more are very satisfied or very dissatisfied than just satisfied or dissatisfied.
Dissatisfaction tends to be higher among young people, the middle classes and people living in London.

The Drivers of Satisfaction with Public Services for the Office of Public Services Reform
7
Source: MORI
48%
26%
3%
9%
14%
Overall satisfaction
Neither satisfied nor dissatisfied
Very satisfied
Dissatisfied
Base: All respondents (1,502)
Satisfied
Very dissatisfied
Q Overall, how satisfied or dissatisfied were you with the serviceyou received?
Those with health or education related experiences are significantly more likely to be satisfied with the service they received than those who are referring to the police, local council or transport.
Source: MORI
33%
20%
28%
30%
25%
26%
21%
57%
11%
14%
7%
7%
8%
9%
28%
36%
29%
6%
8%
14% 48%
21%
32%
56%
Overall satisfaction with the public service used
All services
Q Overall, how satisfied or dissatisfied were you with the service you received?
Very satisfiedSatisfiedDissatisfiedVery dissatisfied
Base: All services (1,502): Health (612), Education (389), Police (87), Local council (84), Transport (85)
Health services
Education services
The Police
Local council
Transport
% saying the most memorable
experience
100%
50%
10%
7%
7%
7%
The Drivers of Satisfaction with Public Services for the Office of Public Services Reform
8
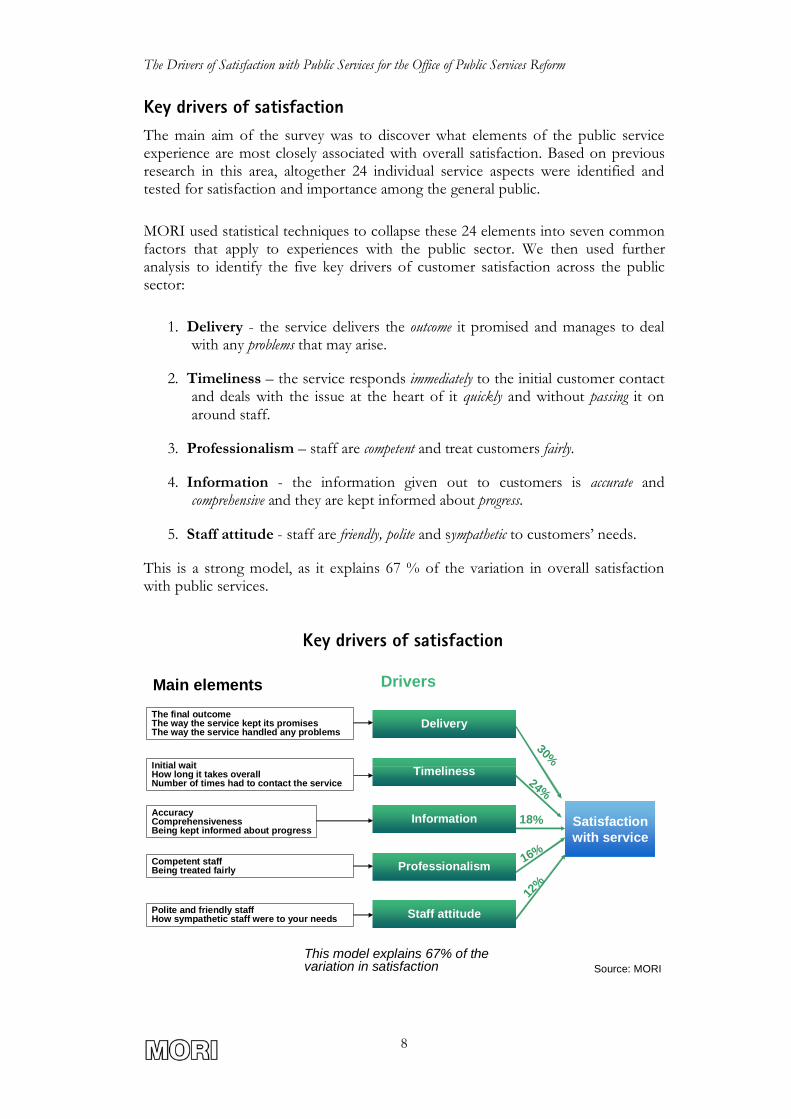
Key drivers of satisfaction The main aim of the survey was to discover what elements of the public service experience are most closely associated with overall satisfaction. Based on previous research in this area, altogether 24 individual service aspects were identified and tested for satisfaction and importance among the general public.
MORI used statistical techniques to collapse these 24 elements into seven common factors that apply to experiences with the public sector. We then used further analysis to identify the five key drivers of customer satisfaction across the public sector:
1. Delivery - the service delivers the outcome it promised and manages to deal with any problems that may arise.
2. Timeliness – the service responds immediately to the initial customer contact and deals with the issue at the heart of it quickly and without passing it on around staff.
3. Professionalism – staff are competent and treat customers fairly.
4. Information - the information given out to customers is accurate and comprehensive and they are kept informed about progress.
5. Staff attitude - staff are friendly, polite and sympathetic to customers’ needs.
This is a strong model, as it explains 67 % of the variation in overall satisfaction with public services.
Source: MORI
Satisfaction with service
30%
Delivery
18%
16%
Information
12%
Staff attitude
24%Timeliness
Professionalism
Drivers
Key drivers of satisfaction
This model explains 67% of the variation in satisfaction
Main elementsThe final outcomeThe way the service kept its promisesThe way the service handled any problems
Competent staffBeing treated fairly
AccuracyComprehensivenessBeing kept informed about progress
Polite and friendly staffHow sympathetic staff were to your needs
Initial waitHow long it takes overallNumber of times had to contact the service

The Drivers of Satisfaction with Public Services for the Office of Public Services Reform
9
For people who visit offices in person, there is a sixth key driver – the physical environment. However, the five key drivers identified above are still the most important factors to take into account.
Source: MORI
Satisfaction with service
28%
18%
14%
13%
21%
Drivers
Key drivers of satisfaction – personal contact only
This model explains 66% of the variation in satisfaction
Main elements
Clean and comfortable premisesThe appearance of staff Physical environment
6%
Delivery
Information
Professionalism
Timeliness
Staff attitude
The final outcomeThe way the service kept its promisesThe way the service handled any problems
Polite and friendly staffHow sympathetic staff were to your needs
AccuracyComprehensivenessBeing kept informed about progress
Competent staffBeing treated fairly
Initial waitHow long it takes overallNumber of times had to contact the service

The Drivers of Satisfaction with Public Services for the Office of Public Services Reform
10
Reasons for satisfaction and dissatisfaction When asked to explain why they are satisfied or dissatisfied with the service they received, the five key factors identified above compare well with what people express in their own words. The key four issues on top of people’s minds are the overall service, its efficiency, quality of staff and the information provided to customers.
Source: MORI
Reasons for service satisfactionQ Why were you satisfied? Q Why were you dissatisfied?
43%
32%
30%
12%
41%
30%
21%
7%
% reason for dissatisfaction% reason for satisfaction
Base: All satisfied with service (1143). All dissatisfied with service (311).
StaffGood/polite/helpful/kind/caring/friendly staffPoor/rude/unhelpful/incompetent/bad attitude
ServiceExcellent/good serviceAppalling/poor service
Efficiency/TimelinessQuick/prompt/efficient serviceLong/slow/inefficient service
InformationAnswered all queries/provided good informationPoor communication/contact

The Drivers of Satisfaction with Public Services for the Office of Public Services Reform
11
Performance on Key Drivers Key Driver 1: Delivery Three quarters are satisfied with the outcome of their contact, but fewer are satisfied with the way the service kept its promises and handled any problems. Handling problems in particular is one of the lowest ratings out of all the different aspects measured. Other research has shown that ‘learning from mistakes’ is a key driver of trust in public services.
Source: MORI
65%
69%
74%
16%
15%
15%
Delivery
Base: All respondents (1,502)
The final outcome
% Satisfied
Q How satisfied or dissatisfied were you with..?
The way the service kept its promises
The way the service handled any problems
% Dissatisfied

The Drivers of Satisfaction with Public Services for the Office of Public Services Reform
12
People who contact the service in person tend to be most satisfied, as are those who contact health and education services. Younger people and those using telephone or a letter to contact public services are most dissatisfied.
The final outcome
The way the service kept its
promises
The way the service
handled any problems
Base
Satis-fied
Dis-satis-fied
Satis-fied
Dis-satis-fied
Satis-fied
Dis-satis-fied
% % % % % % Type of service
Health services (612) 79 11 77 8 74 10
Education services (389) 82 9 76 10 71 10
Local council (84) 58 23 40 43 45 35
The Police (87) 54 35 52 25 53 30
Transport (85) 54 35 52 31 38 31
Method of contact
Personally (812) 78 13 73 11 70 12
Telephone (525) 69 21 64 22 61 22
Letter (78) 64 11 60 23 48 25
Email (39) 83 11 66 17 55 22
Source: MORI

The Drivers of Satisfaction with Public Services for the Office of Public Services Reform
13
Key Driver 2: Timeliness Most customers are satisfied with the speed the public service deals with them. However, more effort may need to be put into the overall time it takes to get things done, as this is the area of highest dissatisfaction among all 24 service aspects measured.
Source: MORI
70%
71%
75%18%
21%
16%
Timeliness
Base: All respondents (1,502)
How long you had to wait before someone responded to you initially
% Satisfied
Q How satisfied or dissatisfied were you with..?
How long it took overall to deal with the reason you contacted
The number of times you had to get in touch with the service before somebody could deal with the reason for your contact
% Dissatisfied

The Drivers of Satisfaction with Public Services for the Office of Public Services Reform
14
Older people are more satisfied with these aspects of service delivery, as are those who deal with health or education services and those who made the contact in person. Those using a letter to contact public services are most dissatisfied, together with those using local councils which receive the lowest scores for timeliness.
How long you had to wait
before someone
responded to you initially
How long it took overall to deal with the reason you contacted
The number of times you had to get in touch with the service
before somebody
could deal with the reason for your contact
Base
Satis-fied
Dis-satis-fied
Satis-fied
Dis-satis-fied
Satis-fied
Dis-satis-fied
% % % % % % Type of service
Health services (612) 80 15 78 16 78 9
Education services (389) 82 10 81 11 80 9
Local council (84) 56 38 45 47 48 45
The Police (87) 69 24 58 34 61 28
Transport (85) 52 23 53 23 46 17
Method of contact
Personally (812) 78 14 75 15 72 11
Telephone (525) 72 22 67 28 69 23
Letter (78) 64 28 58 31 61 28
Email (39) 66 20 54 27 64 23
Source: MORI

The Drivers of Satisfaction with Public Services for the Office of Public Services Reform
15
Key Driver 3: Information Most people are satisfied with the information they receive, but nearly one in five are dissatisfied with how the service keeps them informed about progress, one of two areas of lowest satisfaction among all 24 aspects (the other being the overall time it took to deal with the reason of contact).
Source: MORI
64%
79%
80%
86%8%
19%
13%
15%
Information
Base: All respondents (1,502)
The accuracy of the information you were given
% Satisfied
Q How satisfied or dissatisfied were you with..?
Being given all the information you needed
The way you were kept informed about progress
% Dissatisfied
How easy it was to understand the information you were given

The Drivers of Satisfaction with Public Services for the Office of Public Services Reform
16
Similar groups of people tend to be more satisfied with information as with the previous service aspects – older people, referring to health and education and those who contact the service in person. Those contacting a local council or using the telephone or a letter to contact public services are most dissatisfied.
How easy it was to
understand the
information you were
given
Being given all the
information you needed
The accuracy of
the information
you were given
The way you were kept informed
about progress
Base
Satis-fied
Dis-satis-fied
Satis-fied
Dis-satis-fied
Satis-fied
Dis-satis-fied
Satis-fied
Dis-satis-fied
% % % % % % Type of service
Health services (612) 91 6 87 9 87 8 73 13
Education services (389) 92 3 87 9 87 6 75 13
Local council (84) 72 16 53 39 56 32 36 43
The Police (87) 78 11 69 26 63 21 52 38
Transport (85) 71 15 68 24 59 29 33 31
Method of contact
Personally (812) 87 6 83 11 82 10 67 15
Telephone (525) 84 10 75 20 74 18 57 25
Letter (78) 82 15 77 19 74 12 63 28
Email (39) 89 5 81 14 83 14 66 26
Source: MORI

The Drivers of Satisfaction with Public Services for the Office of Public Services Reform
17
Key Driver 4: Professionalism There is high satisfaction with the competency of staff and most people feel they were treated fairly and their privacy was protected. Slightly fewer people consider the service reliable.
Source: MORI
78%
79%
83%
83%
11%
4%
16%
12%
Professionalism
Base: All respondents (1,502)
How competent staff were
% Satisfied
Q How satisfied or dissatisfied were you with..?
How fairly you were treated
How reliable the service was
% Dissatisfied
The way your privacy was protected

The Drivers of Satisfaction with Public Services for the Office of Public Services Reform
18
Younger people, those contacting the police, local council or transport and those who use a letter or telephone to contact public services are most dissatisfied.
How competent staff were
How fairly you were treated
The way your privacy
was protected
How reliable the service
was
Base
Satis-fied
Dis-satis-fied
Satis-fied
Dis-satis-fied
Satis-fied
Dis-satis-fied
Satis-fied
Dis-satis-fied
% % % % % % Type of service
Health services (612) 91 6 90 6 92 2 87 9
Education services (389) 89 7 86 6 76 4 84 8
Local council (84) 53 39 64 22 55 5 40 40
The Police (87) 77 19 75 22 68 10 62 28
Transport (85) 68 19 65 20 48 4 58 37
Method of contact
Personally (812) 88 8 86 8 80 5 83 12
Telephone (525) 78 17 78 15 79 3 72 23
Letter (78) 70 17 67 15 62 8 64 23
Email (39) 60 21 75 18 79 0 70 21
Source: MORI

The Drivers of Satisfaction with Public Services for the Office of Public Services Reform
19
Key Driver 5: Staff attitude Public services staff generally come across as polite and friendly and people are satisfied with how much time they spend with them. Relatively speaking, people are slightly less happy with how sympathetic staff are to their needs, although this still amounts to nearly eight out of ten people who are happy.
Source: MORI
78%
81%
88%
89%6%
6%
10%
14%
Staff attitude
Base: All respondents (1,502)
How polite staff were
% Agree
Q How satisfied or dissatisfied were you with..?
How friendly staff were
How sympathetic staff were to your needs
The amount of time staff spent with you
% Disagree
The Drivers of Satisfaction with Public Services for the Office of Public Services Reform
20
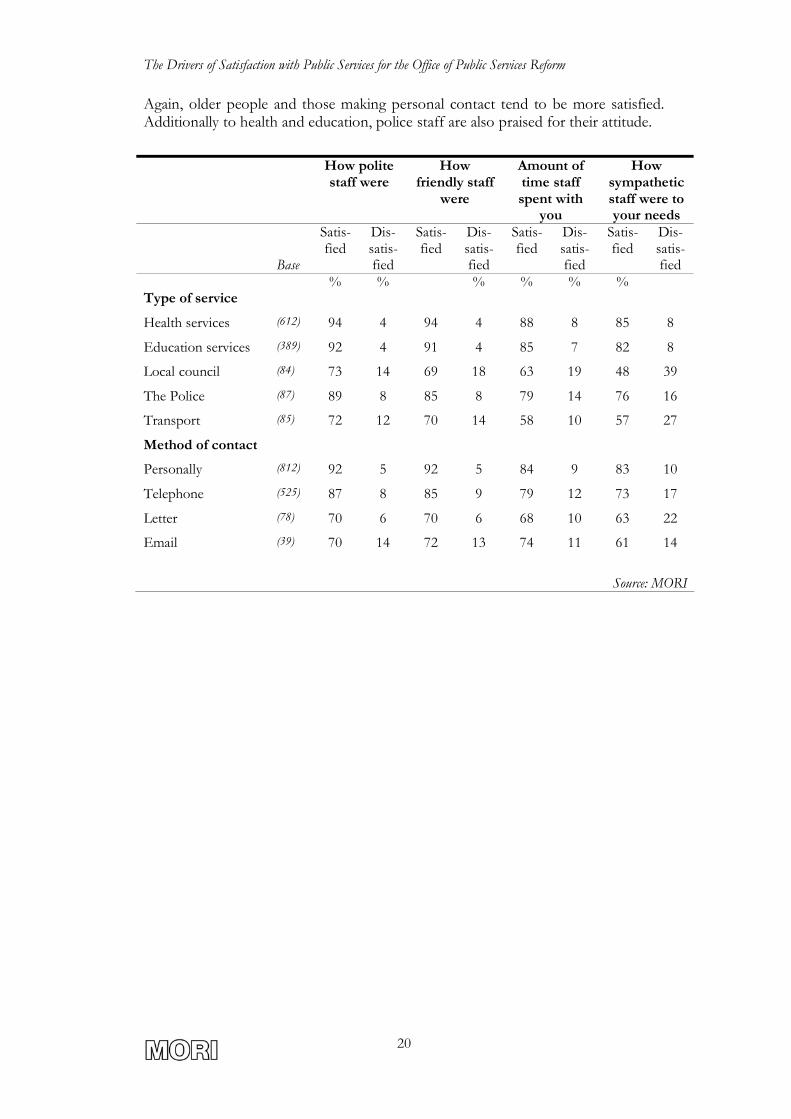
Again, older people and those making personal contact tend to be more satisfied. Additionally to health and education, police staff are also praised for their attitude.
How polite staff were
How friendly staff
were
Amount of time staff spent with
you
How sympathetic staff were to your needs
Base
Satis-fied
Dis-satis-fied
Satis-fied
Dis-satis-fied
Satis-fied
Dis-satis-fied
Satis-fied
Dis-satis-fied
% % % % % % Type of service
Health services (612) 94 4 94 4 88 8 85 8
Education services (389) 92 4 91 4 85 7 82 8
Local council (84) 73 14 69 18 63 19 48 39
The Police (87) 89 8 85 8 79 14 76 16
Transport (85) 72 12 70 14 58 10 57 27
Method of contact
Personally (812) 92 5 92 5 84 9 83 10
Telephone (525) 87 8 85 9 79 12 73 17
Letter (78) 70 6 70 6 68 10 63 22
Email (39) 70 14 72 13 74 11 61 14
Source: MORI
The Drivers of Satisfaction with Public Services for the Office of Public Services Reform
21
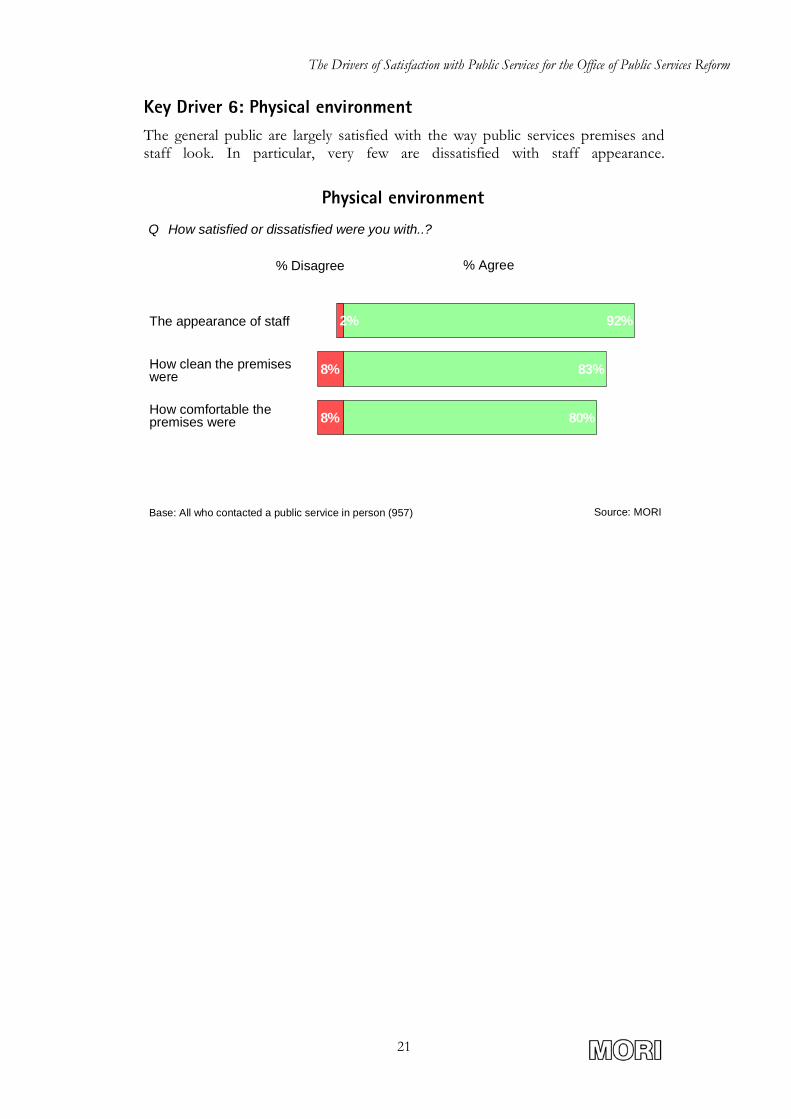
Key Driver 6: Physical environment The general public are largely satisfied with the way public services premises and staff look. In particular, very few are dissatisfied with staff appearance.
Source: MORI
80%
83%
92%2%
8%
8%
Physical environment
Base: All who contacted a public service in person (957)
How clean the premises were
% Agree
Q How satisfied or dissatisfied were you with..?
How comfortable the premises were
The appearance of staff
% Disagree
The Drivers of Satisfaction with Public Services for the Office of Public Services Reform
22
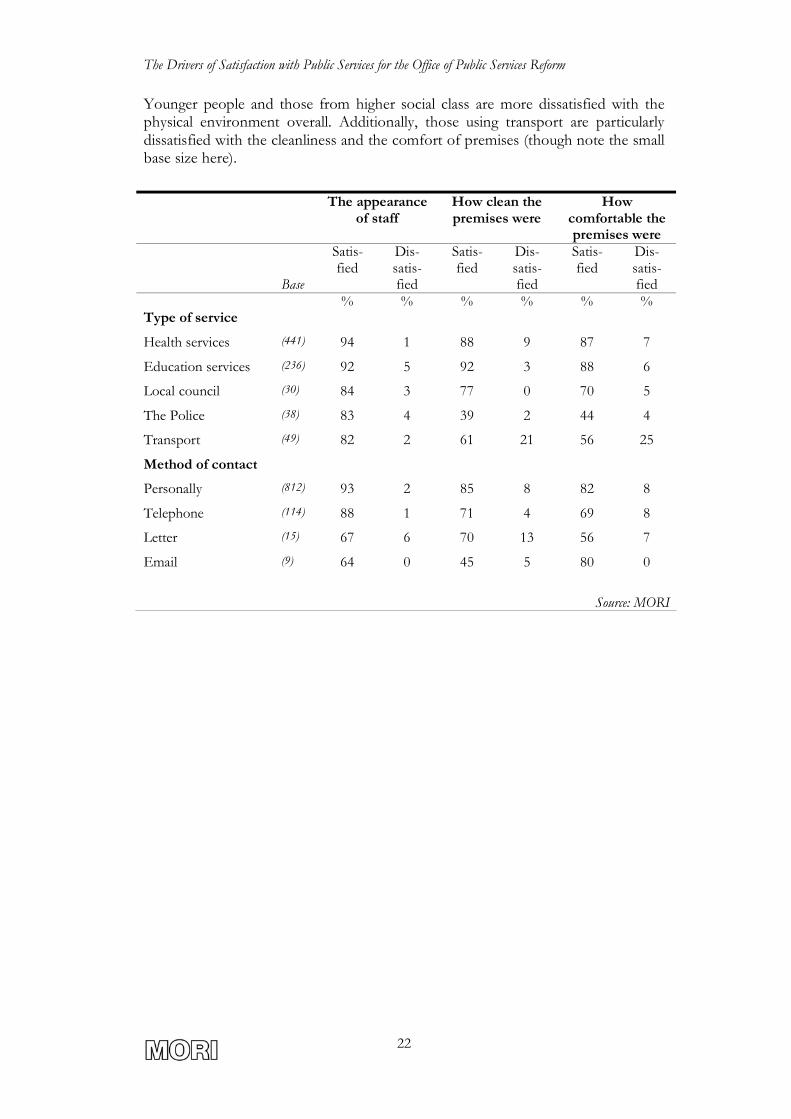
Younger people and those from higher social class are more dissatisfied with the physical environment overall. Additionally, those using transport are particularly dissatisfied with the cleanliness and the comfort of premises (though note the small base size here).
The appearance of staff
How clean the premises were
How comfortable the premises were
Base
Satis-fied
Dis-satis-fied
Satis-fied
Dis-satis-fied
Satis-fied
Dis-satis-fied
% % % % % % Type of service
Health services (441) 94 1 88 9 87 7
Education services (236) 92 5 92 3 88 6
Local council (30) 84 3 77 0 70 5
The Police (38) 83 4 39 2 44 4
Transport (49) 82 2 61 21 56 25
Method of contact
Personally (812) 93 2 85 8 82 8
Telephone (114) 88 1 71 4 69 8
Letter (15) 67 6 70 13 56 7
Email (9) 64 0 45 5 80 0
Source: MORI

The Drivers of Satisfaction with Public Services for the Office of Public Services Reform
23
Factor 7: Access Generally, people find it easy to access public services. However, there is slightly less satisfaction with the choice of different ways to access the service and with the opening hours.
Source: MORI
71%
76%
85%
9%
10%
10%
Access
Base: All respondents (1,502)
The choice of different ways you had to access the service
% Agree
Q How satisfied or dissatisfied were you with..?
How easy it was to access the service
The opening hours of the service
% Disagree

The Drivers of Satisfaction with Public Services for the Office of Public Services Reform
24
Younger people and those from higher social class are most dissatisfied with access issues (perhaps because they have less free time, or because they have higher expectations), as are those using telephone, letter or email to contact public services instead of a personal contact.
How easy it was to access the
service
The opening hours of the
service
The choice of different ways
you had to access the
service
Base
Satis-fied
Dis-satis-fied
Satis-fied
Dis-satis-fied
Satis-fied
Dis-satis-fied
% % % % % % Type of service
Health services (612) 88 7 80 10 70 7
Education services (389) 89 5 80 6 80 4
Local council (84) 74 16 71 16 70 14
The Police (87) 76 18 56 14 65 19
Transport (85) 78 14 66 14 66 14
Method of contact
Personally (812) 88 6 81 9 69 6
Telephone (525) 81 15 73 13 73 13
Letter (78) 77 16 63 11 75 6
Email (39) 72 16 68 15 90 3
Source: MORI

The Drivers of Satisfaction with Public Services for the Office of Public Services Reform
25
Summary of Performance on Key Drivers We created an overall average of performance for each factor and plotted it against the impact it has on satisfaction with public services, as shown on the chart below. The higher up on the chart a key driver is, the more satisfied people are with it and the further along a key driver is, the more impact it has on satisfaction with public services.
People are most satisfied with staff attitude, which has a relatively smaller impact on their overall satisfaction with public services. Delivery has a comparatively larger impact on overall satisfaction with public service but people are less satisfied with this aspect of public services – better information and timeliness are also priorities for improvement.
Source: MORI
Performance on Key Drivers of Satisfaction
3.5
3.7
3.9
4.1
4.3
4.5
5 10 15 20 25 30 35
Base: All respondents (1,502)
Average weighted satisfaction score (5= very satisfied, 1 = very dissatisfied)
% impact of driver
Delivery
Timeliness
Professionalism
Information
Staff attitude

The Drivers of Satisfaction with Public Services for the Office of Public Services Reform
26
Additional Key Drivers Analysis
Key driver analysis was also carried out on specific subgroups: those who have contacted education services, those who have contacted health services and those who have contacted other services (primarily local government, the police and transport).
In each case, the same factors, in broadly the same order, are key drivers of satisfaction. This suggests that even though there will be specific issues particular to each service, these five factors are important across the board.
Source: MORI
Satisfaction with service
34%
Delivery
17%
14%
Information12
%
Staff attitude
23%Timeliness
Professionalism
Drivers
Education services
This model explains 62% of the variation in satisfaction
Main elementsThe final outcomeThe way the service kept its promisesThe way the service handled any problems
Competent staffBeing treated fairly
AccuracyComprehensivenessBeing kept informed about progress
Polite and friendly staffHow sympathetic staff were to your needs
Initial waitHow long it takes overallNumber of times had to contact the service

The Drivers of Satisfaction with Public Services for the Office of Public Services Reform
27
Source: MORI
Satisfaction with service
28%
Delivery
19%
15%
Information
13%
Staff attitude
24%Timeliness
Professionalism
Drivers
Health services
This model explains 59% of the variation in satisfaction
Main elementsThe final outcomeThe way the service kept its promisesThe way the service handled any problems
Competent staffBeing treated fairly
AccuracyComprehensivenessBeing kept informed about progress
Polite and friendly staffHow sympathetic staff were to your needs
Initial waitHow long it takes overallNumber of times had to contact the service
Source: MORI
Satisfaction with service
31%
Delivery
18%
18%Information
10%
Staff attitude
23%Timeliness
Professionalism
Drivers
Other services
This model explains 72% of the variation in satisfaction
Main elements
The final outcomeThe way the service kept its promisesThe way the service handled any problems
Competent staffBeing treated fairly
AccuracyComprehensivenessBeing kept informed about progress
Polite and friendly staffHow sympathetic staff were to your needs
Initial waitHow long it takes overallNumber of times had to contact the service
The Drivers of Satisfaction with Public Services for the Office of Public Services Reform
28
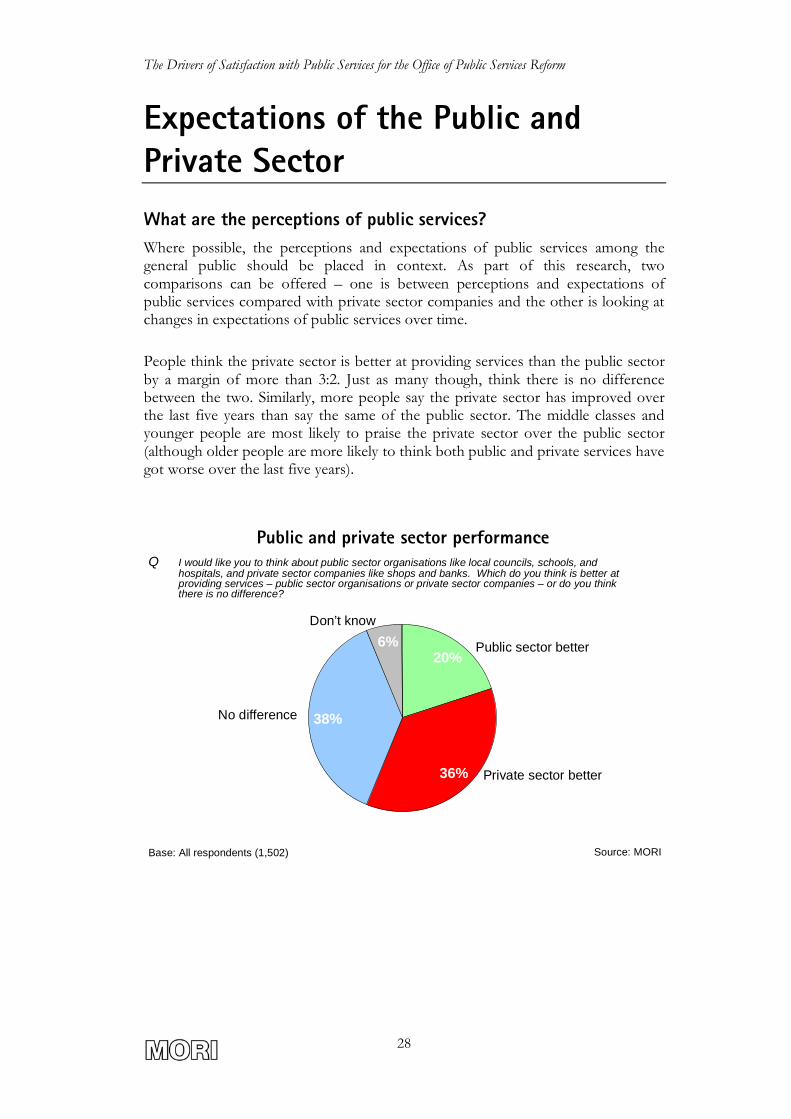
Expectations of the Public and Private Sector What are the perceptions of public services? Where possible, the perceptions and expectations of public services among the general public should be placed in context. As part of this research, two comparisons can be offered – one is between perceptions and expectations of public services compared with private sector companies and the other is looking at changes in expectations of public services over time.
People think the private sector is better at providing services than the public sector by a margin of more than 3:2. Just as many though, think there is no difference between the two. Similarly, more people say the private sector has improved over the last five years than say the same of the public sector. The middle classes and younger people are most likely to praise the private sector over the public sector (although older people are more likely to think both public and private services have got worse over the last five years).
Source: MORI
20%
36%
38%
6%
Public and private sector performance
No difference
Public sector better
Base: All respondents (1,502)
Private sector better
Don’t know
Q I would like you to think about public sector organisations like local councils, schools, and hospitals, and private sector companies like shops and banks. Which do you think is better at providing services – public sector organisations or private sector companies – or do you think there is no difference?

The Drivers of Satisfaction with Public Services for the Office of Public Services Reform
29
Source: MORI
Performance of Public Services
Base: 2004 - all respondents (1,502). 1998 – all respondents (5,064)
Q On balance, do you think public services like local councils, schools or hospitals / private sector companies like shops or banks have got better or worse over the last five years, or do you think they have stayed the same?
32
29
24
38
29
38
27
39
33
3
5
3
% Better % Stayed the same % Worse % Don’t know
Public services (1998)
Public services
Private sector
Since 1998, the proportion who say public services exceed their expectations has risen by five points. Unfortunately, there has been an even bigger, significant rise in those who say public services fail to meet their expectations (up 11 points). People are more likely to say the private sector meets their expectations (though this in itself does not prove whether people have higher or lower expectations of the private sector over the public sector).
Source: MORI
11
10
5
59
38
51
28
51
40
1
4
3
Expectations of Public Services
Public services (1998)
% Exceed % About what you expect % Fall short % Don’t know
Public services
Private sector
Q Thinking generally about what you expect of public services like local councils, schools or hospitals/private sector companies like shops or banks, would you say they greatly exceed or slightly exceed your expectations, are about what your expect, fall slightly short or fall a long way short of your expectations?
Base: 2004 - all respondents (1,502). 1998 – all respondents (5,064)

The Drivers of Satisfaction with Public Services for the Office of Public Services Reform
30
What are the expectations of responsiveness? There is an ongoing debate over whether how people perceive public services may be caused by changes in their expectations of public services. In particular, some believe that expectations have risen over the past few years, which may lead to greater dissatisfaction with the services currently provided, regardless of changes in service quality.
One of the ways we are able to measure any changes in expectations is to ask what people perceive to be an acceptable wait when they contact public and private sector services. Some shifts towards lower expectations of public services can be observed, as shown on the chart below.
When contacting a service in person, but without an appointment, or when a letter is sent, people have lower expectations of the speed of response public services should provide now then they did in 1999. They also expect a faster response from private sector companies than from public services.
Q
When you visit your local council or a government department / a private sector company like a shop or a bank without an appointment, how long do you think it is reasonable to wait before someone deals with your query or problem?
Public sector 1999
Public sector Private sector
Base (1,003) Base (753) Base (749 ) % % % Immediately 4 5 11 0-5 minutes 9 9 18 Over 5 minutes – 10 minutes 19 21 25 Over 10 minutes – 15
minutes 24 20 14
Over 15 minutes – 20 minutes
13 10 8
Over 20 minutes – 25 minutes
3 2 1
Over 25 minutes – 30 minutes
16 11 8
Over 30 minutes 8 14 11 Q.
When you send a letter to your local council or government department / a private sector company like a shop or a bank, how long do you think it is reasonable to wait for your letter to be answered?
% % % 1-3 working days 9 9 21 Over 3 working days – 1 week 62 55 59 Over 1 week – 2 weeks 23 27 16 Over 2 weeks – 3 weeks 4 4 2 Over 3 weeks – a month 1 1 * Over a month * 2 *
Source: MORI

The Drivers of Satisfaction with Public Services for the Office of Public Services Reform
31
When the contact is made by email, the private sector is again expected to provide a speedier response, but the expectations of how quickly public services should respond have remained the same between 1999 and 2004.
Q.
When you send an e-mail to your local council or government department / a private sector company like a shop or a bank, how long do you think it is reasonable to wait for your email to be answered?
Public sector 1999
Public sector Private sector
Base: all with email Base: all who use emails (116) (476) (475) % % % Answered immediately 1 4 4 Less than one hour 6 4 5 Over one hour – 2 hours 3 5 6 Over 2 hours – 4 hours 7 5 5 Over 4 hours – 8 hours 5 3 3 Over 8 hours – 24 hours 27 25 35 Over 1 – 2 working days 24 26 26 Over 2 – 3 working days 13 9 6 Over 3 – 5 working days 4 11 1 Over one week 5 2 1
Source: MORI
The expectations of the speed of response when contacting a public or private sector organisation by telephone are similar, without any significant changes in expectations of public services between 1999 and 2004.
Q.
When you contact your local council or government department/a private sector company like a shop or a bank, by telephone, how long do you think it is reasonable to wait for your call to be answered?
Public sector 1999
Public sector Private sector
Base (1,003) Base (753) Base (749 ) % % % Within 15 seconds (5 rings) 20 25 23 Within 30 seconds (10
rings) 31 24 25
Within 1 minute (20 rings) 18 18 20 Over 1 – 2 minutes 13 13 12 Over 2 minutes 16 19 19 Don’t know 2 2 1
Source: MORI

The Drivers of Satisfaction with Public Services for the Office of Public Services Reform
32
Methods of Contact Personal contact and telephone are the two most frequent methods of contact people used to get in touch with public services. Only a small proportion wrote letters or emails. Telephone and personal contact are also the two most preferred methods, but this time people would rather use the phone than face-to-face contact.
People contact health, education and transport services in person, but they are more likely to use the telephone to contact the police and transport. A letter is used primarily to contact a local council.
Telephone is the preferred method for contacting health services, the police and local councils, while more people would rather contact education and transport services in person. Younger people and the middle classes are slightly more likely to prefer email contact with public services.
Source: MORI
Methods of contactQ Still thinking about your contact with <service>, could you tell me how you
were in contact with the service?
Q And if you had to contact <service> again, how would you prefer to do it?
55%
36%
5%
2%
46%
52%
5%
3%
PreferredActual
Base: All respondents (1502). *All who use email (392)
Telephone
In person
Letter
E-mail*

The Drivers of Satisfaction with Public Services for the Office of Public Services Reform
33
Conclusions This study has derived a generic model of what drives satisfaction with public services. This is useful as it provides a framework for the public sector within which it can focus its efforts on improving customer service: when an organisation performs well on each of the key drivers, it will substantially improve its chances of receiving high satisfaction scores for the services it provides.
The key drivers, in order of their impact, are:
1. Delivery - the service delivers the outcome it promised and manages to deal with any problems that may arise.
2. Timeliness – the service responds immediately to the initial customer contact and deals with the issue at the heart of it quickly and without passing it on between staff.
3. Professionalism – staff are competent and treat customers fairly.
4. Information - the information given out to customers is accurate and comprehensive and they are kept informed about progress.
5. Staff attitude - staff are friendly, polite and sympathetic to customers’ needs.
By looking at the average performance for each factor and plotting it against the impact it has on satisfaction with public services, we are also able to indicate what the priorities for improvement should be. As described earlier, on the chart below the higher up a driver is, the higher its average satisfaction score, and the further to the right the more impact it has on overall satisfaction with public services.
Source: MORI
Performance on Key Drivers of Satisfaction
3.5
3.7
3.9
4.1
4.3
4.5
5 10 15 20 25 30 35
Base: All respondents (1,502)
Average weighted satisfaction score (5= very satisfied, 1 = very dissatisfied)
% impact of driver
Delivery
Timeliness
Professionalism
Information
Staff attitude

The Drivers of Satisfaction with Public Services for the Office of Public Services Reform
34
This indicates that while people are generally satisfied with the attitude and professionalism public sector staff demonstrate in their jobs, delivery in particular, but also timeliness (and to an extent information provision), should be priorities for public services.
Of course, given the very nature of public services, there are inevitably going to be occasions when the public sector does not provide what the customer wants, or in cases of regulatory or enforcement services can actually provide a ‘negative’ outcome (from the customer’s point of view). However, even in these situations, emphasis can be placed on the other components of “delivery” – keeping promises (which requires expectations of the outcome to be well managed at the outset), and dealing effectively with any problems that may arise.
Following on from this, good performance on the remaining four drivers of satisfaction can also begin to make up for dissatisfaction with the final outcome. Even negative outcomes can be handled without wasting the customers’ time, by friendly and polite staff who are competent at what they do and provide accurate and comprehensive information.
The drivers identified in this research form a useful starting point for managers and policy makers to direct service improvement where it will have the biggest impact on satisfaction. Additionally, individual public services should of course conduct research to identify the specific drivers for their services, but these five factors should be applicable to all.

Appendices

Key Drivers survey for Office of Public Services Reform
Note on Weighting
The results in the computer tables are weighted to reflect the demographic profile of the general public aged 16+ in Great Britain based on the Census 2001 data. In particular, weighting was carried out to match the profile in terms of age, country/region and work status.
A total of 1,502 interviews were conducted, 287 of which were ‘education booster’ interviews. These interviews followed special routing in the questionnaire which meant that respondents who declared a contact with education services in the last 12 months were then forced to answer questions on satisfaction with the service and importance of different aspects (Q14 – Q71) based on that experience with an education service, regardless of other services they may or may not have used.
This meant that the data from Q14 – Q71 had to be additionally weighted to correct for the effect of extra interviews conducted about education. In practice, this meant reducing the overall proportion of education interviews from an initial 25% within the sample to 10%. Only the results of Q14 – Q71 were affected by downweighting education interviews.

Key Drivers survey for Office of Public Services Reform
Statistical Reliability
The sample tolerances that apply to the percentage results for the MORI/OPSR survey are given in the table below. This table shows the possible variation that might be anticipated because a sample, rather than the entire population of the general public, was interviewed. As indicated, sampling tolerances vary with the size of the sample and the size of the percentage results.
For example, on a question where 50% of the people in a sample of 1,502 people respond with a particular answer, the chances are (95 in 100) that this result would not vary by more than three percentage points, plus or minus, from a complete coverage of the general public using the same procedures.
Approximate sampling tolerances applicable to percentages at or near these levels
(Adjusted to take account of weighting)
10% or 90% 30% or 70% 50%
Size of sample on which survey result is based
± ± ±
All respondents (1,502) 1.5 2.3 2.5
Source: MORI
Tolerances are also involved in the comparison of results from different parts of the sample. A difference, in other words, must be of at least a certain size to be considered statistically significant. The following table is a guide to the sampling tolerances applicable to comparisons.
Differences required for significance at or near these percentages
10% or 90% 30% or 70% 50%
Size of sample on which survey result is based
All satisfied with service (1,143) vs. all dissatisfied (311) 3.8 5.8 6.3
All female respondents (771) vs. all male respondents (731) 3.1 4.7 5.2
Health respondents (612) vs. Education respondents (389) 3.8 5.8 6.4
All Midlands respondents (381) vs. all respondents from Scotland (134)
5.9 9.0 9.9
Source: MORI

Key Drivers survey for Office of Public Services Reform
Social Class Definitions The grades detailed below are the social class definitions as used by the Institute of Practitioners in Advertising, and are standard on all surveys carried out by MORI (Market & Opinion Research International Limited).
Social Grades
Social Class Occupation of Chief Income Earner
Percentage of Population
A Upper Middle Class Higher managerial, administrative or professional
3.0
B Middle Class Intermediate managerial, administrative or professional
20.8
C1 Lower Middle Class
Supervisor or clerical and junior managerial, administrative or professional
27.3
C2 Skilled Working Class Skilled manual workers 21.2
D Working Class Semi and unskilled manual workers
17.4
E Those at the lowest levels of subsistence
State pensioners, etc, with no other earnings
10.3


![FREQUENTIS – for a safer world - International … Satisfaction “ … outstanding professionalism and commitment … “ [MET Police, UK] “ … high standards of quality and](https://static.fdocuments.in/doc/165x107/5b5ddca87f8b9a65028e895b/frequentis-for-a-safer-world-international-satisfaction-outstanding-professionalism.jpg)