The Domesday Economy of England, 1086Seminar University of Canterbury, NZ, April 2008 by John...
21
The Domesday Economy of England, 1086: Seminar University of Canterbury, NZ, April 2008 by John McDonald * Abstract Data collected in the Domesday Survey of 1086 can be used to reconstruct the eleventh century economy of England. The Survey contains high quality and detailed information on the inputs, outputs, and tax assessments of most English manors. In this seminar, I will describe the Survey, the contemporary institutional arrangements and the main features of Domesday agricultural production. I will show how frontier methods (DEA) can be used to assess the efficiency of production and measure the impact of the feudal and manorial systems on input productivities and output. The frontier analysis suggests that the average efficiency level of Domesday estates compares very favorably with that of more modern primary industry production. I also argue that input immobility, a consequence of the contemporary institutional fabric of feudalism and manorialism, resulted in wide variations in input productivities across estates, and led to a very significant reduction in overall output. More information on the Domesday Project can be found by going to my website http://business.flinders.edu.au/staff/mcdonald/ . Current research on Domesday Wiltshire is forthcoming in Applied Economics and papers discussing econometric problems associated with second stage efficiency analyses are with journals. * Professor of Business, Flinders Business School, Flinders University, GPO Box 2100, Adelaide 5001, Australia. Email: [email protected] . I would like to thank Eva Aker for excellent research assistance, and the Australian Research Grants Council and Flinders University for financial support. This paper is dedicated to S. Snap
Transcript of The Domesday Economy of England, 1086Seminar University of Canterbury, NZ, April 2008 by John...

The Domesday Economy of England, 1086:
Seminar University of Canterbury, NZ, April 2008
by John McDonald*
Abstract
Data collected in the Domesday Survey of 1086 can be used to reconstruct the eleventh century economy of England. The Survey contains high quality and detailed information on the inputs, outputs, and tax assessments of most English manors. In this seminar, I will describe the Survey, the contemporary institutional arrangements and the main features of Domesday agricultural production. I will show how frontier methods (DEA) can be used to assess the efficiency of production and measure the impact of the feudal and manorial systems on input productivities and output. The frontier analysis suggests that the average efficiency level of Domesday estates compares very favorably with that of more modern primary industry production. I also argue that input immobility, a consequence of the contemporary institutional fabric of feudalism and manorialism, resulted in wide variations in input productivities across estates, and led to a very significant reduction in overall output.
More information on the Domesday Project can be found by going to my website http://business.flinders.edu.au/staff/mcdonald/. Current research on Domesday Wiltshire is forthcoming in Applied Economics and papers discussing econometric problems associated with second stage efficiency analyses are with journals.
* Professor of Business, Flinders Business School, Flinders University, GPO Box 2100, Adelaide 5001, Australia. Email: [email protected]. I would like to thank Eva Aker for excellent research assistance, and the Australian Research Grants Council and Flinders University for financial support. This paper is dedicated to S. Snap

2
Introduction
Some 900 years ago, a remarkable survey was undertaken. The survey, which has become known as the Domesday Survey, was ordered by the King of England, William (the Conqueror). It covered most English manors in 1086. Landholders answered questionnaires and their responses, not regarded as confidential, were then publicly verified in local courts. The Survey provides surprisingly high quality and detailed information on manorial net incomes, resources and tax assessments. These data can be used to reconstruct the economy of the time -production and tax relationships can be estimated; and issues such as the efficiency of production, the fairness of the tax system, and the influence of the feudal and manorial systems on production investigated.
Publications describing this research include McDonald and Snooks (1985a, b, c), (1986), (1987a, b) and (2003), and McDonald (1996), (1997), (1998), (2002), (2004), (2005), (2006) and (2007).
In this seminar I review some of the findings relating to eleventh century production efficiency, explain the frontier method used to derive the results, and indicate the impact of the feudal and manorial systems on production.
The Domesday Survey
The results of the Domesday Survey were compiled into a document that later became known as Domesday Book. The Survey is thought to have had a dual fiscal and feudal purpose. It provided essential information to revise tax assessments and also documented the feudal structure - ‘who held what, and owed what, to whom’. For many years after William’s death Domesday Book was extensively used in the courts to resolve disputes over land title. It was only in this later period referred to as ‘Domesday Book’, the book of last judgement, for in land disputes there was no appeal beyond its pages – land rights could be traced to Domesday Book but no earlier.
The Survey and compilation of Domesday Book took about 20 months, from Christmas 1085 to the death of William in September 1087. The availability of Anglo-Saxon documents, particularly tax lists, helped to speed the work.
The English counties were grouped into seven circuits. A team of commissioners, consisting of lay barons, bishops and lawyers with few land holdings or other interests in the area, organised the survey in each circuit. The commissioners sent out a list of questions to land holders. The responses were then reviewed in county courts by local juries. Next, county and circuit returns were constructed. Finally, the Exchequer at Winchester received the circuit returns, summarised and edited them, and compiled Domesday Book.
Domesday Book consists of two volumes, Great (or Exchequer) Domesday and Little Domesday. Great Domesday is a summarised version of the returns for the first six circuits. Little Domesday is a more detailed survey circuit return for circuit VII, Essex, Norfolk and

3
Suffolk. It is thought that William died before this circuit return could be included in Great Domesday, and with his death the survey process was terminated.
The information in Domesday Book mainly consists of lists of information about manors or estates. The estate information is organised by county and within each county the estates of the king, ecclesiastical and lay lords are presented. A typical manorial entry lists the resources available on the estate in 1086, for example, the number of livestock, and various kinds of labour and ploughteams. It also gives the manorial net income (referred to as the ‘annual value’) and tax assessment. Often there is also data relating to 1066 and sometimes for an intermediate year.
Unlike modern surveys, the Domesday Survey was a public event. Individual questionnaire responses were not treated confidentially, but were verified in the courts by local land holders under oath. It is also thought that the work of the commissioners was monitored by agents of the king. Given these safeguards, it would seem there was little possibility of significant misrepresentation or falsification going undetected.
The Domesday scholar, H.C. Darby, described Domesday Book as ‘the most remarkable statistical document in the history of Europe’ (Darby, 1979, p. 12). It is remarkable as an historical record, but even in the modern era there can be few publicly available data bases that provide such comprehensive, detailed and carefully checked information on the performance of individual production units.1
Domesday England and Domesday Production
William invaded England when Duke of Normandy, 20 years prior to the Survey, in Autumn 1066. The invasion followed a dispute over succession to the English throne following the death of Edward (the Confessor). The English contender, Harold (son of Godwine) having just defeated an invasion force led by Harold Hardrada, King of Norway, at Stamfordbridge, marched south to block William’s northern advance from the Kentish coast. At the battle of Hastings, Harold was killed. William was victorious, later being crowned king in London on Christmas Day. Subsequently the Norman invaders faced a series of rebellions until 1075, including a major disturbance in the north during 1069-70 that was brutally put down by the king’s forces. To safeguard the realm a network of castles was constructed. Initially they were simple motte-and-bailey constructions. Later they were rebuilt in stone.
England in 1066 was one of the wealthiest countries in Northern Europe with an economy based on agriculture, wool and fisheries. It possessed a well-developed administrative system. The country was divided into shires or counties, which were subdivided into local areas called hundreds. There was an effective taxation system based on the county and hundred units and royal orders could be issued via the county and hundred courts. The Normans retained much of this local government structure but largely eliminated the English aristocracy, many of whom were killed or exiled.
Having dispossessed the English aristocracy, William took large estates for himself and redistributed land to his supporters. The lands of over four thousand English lords were seized
4
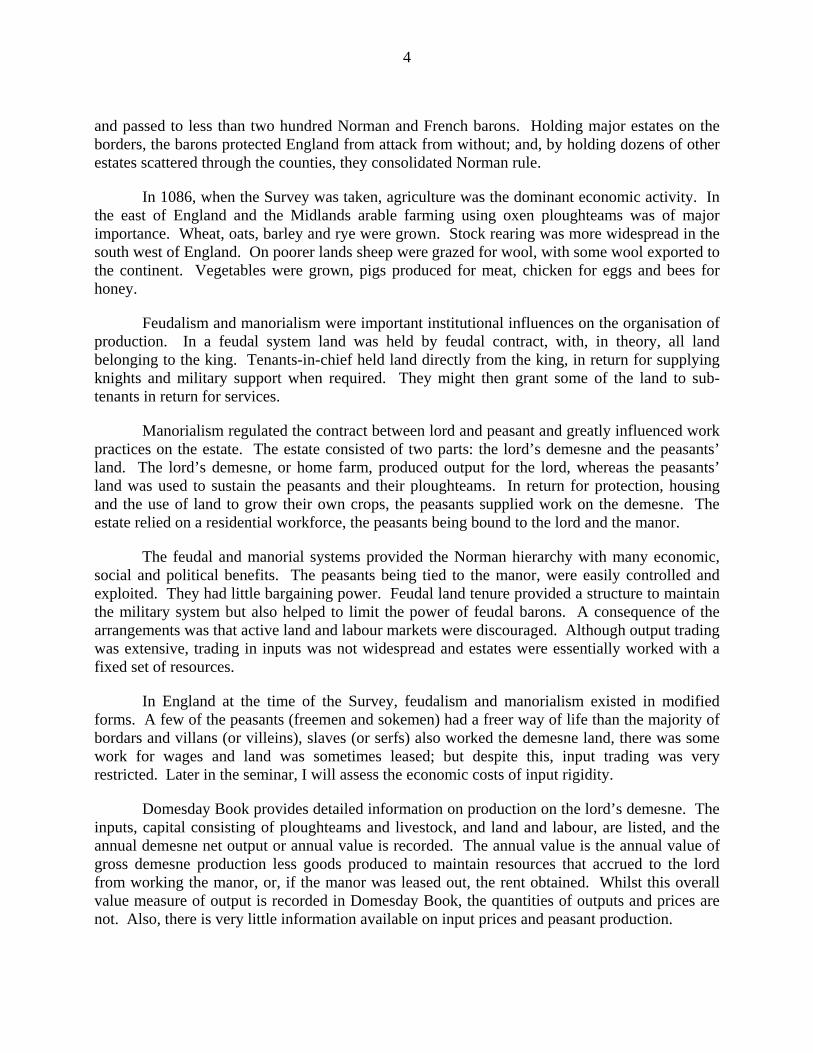
and passed to less than two hundred Norman and French barons. Holding major estates on the borders, the barons protected England from attack from without; and, by holding dozens of other estates scattered through the counties, they consolidated Norman rule.
In 1086, when the Survey was taken, agriculture was the dominant economic activity. In the east of England and the Midlands arable farming using oxen ploughteams was of major importance. Wheat, oats, barley and rye were grown. Stock rearing was more widespread in the south west of England. On poorer lands sheep were grazed for wool, with some wool exported to the continent. Vegetables were grown, pigs produced for meat, chicken for eggs and bees for honey.
Feudalism and manorialism were important institutional influences on the organisation of production. In a feudal system land was held by feudal contract, with, in theory, all land belonging to the king. Tenants-in-chief held land directly from the king, in return for supplying knights and military support when required. They might then grant some of the land to sub-tenants in return for services.
Manorialism regulated the contract between lord and peasant and greatly influenced work practices on the estate. The estate consisted of two parts: the lord’s demesne and the peasants’ land. The lord’s demesne, or home farm, produced output for the lord, whereas the peasants’ land was used to sustain the peasants and their ploughteams. In return for protection, housing and the use of land to grow their own crops, the peasants supplied work on the demesne. The estate relied on a residential workforce, the peasants being bound to the lord and the manor.
The feudal and manorial systems provided the Norman hierarchy with many economic, social and political benefits. The peasants being tied to the manor, were easily controlled and exploited. They had little bargaining power. Feudal land tenure provided a structure to maintain the military system but also helped to limit the power of feudal barons. A consequence of the arrangements was that active land and labour markets were discouraged. Although output trading was extensive, trading in inputs was not widespread and estates were essentially worked with a fixed set of resources.
In England at the time of the Survey, feudalism and manorialism existed in modified forms. A few of the peasants (freemen and sokemen) had a freer way of life than the majority of bordars and villans (or villeins), slaves (or serfs) also worked the demesne land, there was some work for wages and land was sometimes leased; but despite this, input trading was very restricted. Later in the seminar, I will assess the economic costs of input rigidity.
Domesday Book provides detailed information on production on the lord’s demesne. The inputs, capital consisting of ploughteams and livestock, and land and labour, are listed, and the annual demesne net output or annual value is recorded. The annual value is the annual value of gross demesne production less goods produced to maintain resources that accrued to the lord from working the manor, or, if the manor was leased out, the rent obtained. Whilst this overall value measure of output is recorded in Domesday Book, the quantities of outputs and prices are not. Also, there is very little information available on input prices and peasant production.

5
Peasants and slaves consumed goods produced on the estate, however, the lord consumed many high quality goods produced elsewhere. Goods, such as cereals, vegetables, cheese, meat, wool and honey, were traded for items such as agricultural tools, military hardware, glass, lead and other building materials, finely crafted furniture, textiles and fine clothing. In addition, estate output needed to be sold to pay the geld -–a major tax on the manor averaging about 15 percent of the annual value in 1086. In these circumstances a rational manorial lord would have attempted to organise production in a technically efficient way. There were limited opportunities for input substitution, as the estate was, in essence, run with a fixed set of inputs, but outputs could be chosen so as to maximise the net value of goods produced. The lord could then trade to maximise utility from consumption.2
Background to this Study
There is a long tradition of Domesday scholarship. Since Victorian times historians have used Domesday Book to study the political, institutional and social structures of eleventh century England, and the geography of Domesday England has been carefully documented. However, the early scholars tended to draw away from economic issues. They were unable to perceive that systematic economic relationships were present in the Domesday economy, and estate production and the tax system were viewed as ‘arbitrary’. Often manorial production was seen as being organised haphazardly according to local custom and tradition. In contrast to the Normans undoubted efficacy in civil administration and military matters, economic production was regarded as poorly organised (see McDonald and Snooks, 1985a, b and 1986, especially Ch 3).
H.C. Darby, for example, the authority on the geography of Domesday England, considered that there was no consistent relationship linking the manorial annual values and inputs. Referring to the estates of the county of Essex he concluded, ‘Generally speaking, the greater number of ploughteams and men on a holding, the higher its [annual] value, but it is impossible to discern any consistent relation between resources and value’. (Darby, 1952, pp. 228-9). Darby made similar statements for other Domesday counties (eg Darby and Maxwell, 1962, pp 43, 125, 199, 302-3, 352, etc).
One explanation why the Domesday scholars were unable to discover consistent relationships in the economy lies in the empirical method they adopted. Rather than examining the data as a whole using statistical techniques, conclusions were drawn by generalizing from a few (often atypical) cases. It is not surprising that no consistent pattern was evident when data were restricted to a few unusual observations. It would also appear that the researchers often did not have a firm grasp of economic theory (for example, seemingly being perplexed that the same annual value, that is, net income, could be generated by estates with different input mixes, see McDonald and Snooks, 1986, Ch 3).
In a series of studies (McDonald and Snooks, 1985a, b, c, 1986 and 1987 a, b), using modern economic and statistical methods, Graeme Snooks and I reanalysed manorial production and tax relationships. The studies show that strong relationships existed linking estate net output to inputs, and tax assessments to manorial income and resources. The evidence suggested that in many ways Domesday landholders operated in a manner similar to modern entrepreneurs. Unresolved by this research was the question of how similar was the pattern of medieval and modern economic activity.3

6
In particular, how well organised was estate production? Allowing for differences in technology and the institutional structure, was economic production as efficient (on average) in Domesday England as in more modern societies? To answer such questions, Farrell (1957, p 262) recommended comparing the structure of efficiency, and in the seminar I will compare the structure of efficiency of Domesday agricultural production with similar production activity in more recent times.
The first stage in the comparison is to calculate efficiency measures for Domesday production units. Once this is done a range of interesting questions can be investigated, such as which estates were efficient? And why? Were some tenants-in-chief more efficient (on average) than others? Were estates located near urban centres more efficient? What were the effects of different tenancy arrangements, soil conditions and the mix of agricultural production practised? And how did the dominant influences of feudalism and manorialism influence productivity across estates?
The remainder of the seminar addresses some of these issues. In the next section, the method used to measure estate efficiency is described. The method is used to calculate efficiency measures for the lay estates of Essex in 1086. Essex was chosen because more detailed data are available on the counties described in Little Domesday and the manorial entries for Essex are easier to interpret than those for Norfolk and Suffolk.4 The following section reviews some factors associated with efficiency. The structure of Domesday manorial efficiency is then compared with that of three more modern production environments, and finally, the question of the economic cost of input rigidities induced by the feudal and manorial systems is examined.
Measuring Domesday Manorial Efficiency
A frontier method was used to measure the efficiency of the Domesday estates. When there is only one input, the basic idea behind the method can be illustrated diagrammatically. In the Figure, output is measured along the vertical axis and the single input along the horizontal axis. The production of 3 estates A, B and C is described by the three points A, B and C. Estate A uses 3 units of input to produce 2 units of output; B, 6 units of input to produce 3 units of output and C, 6 units of input to produce 2 units of output. Now assume the production technology displays constant returns to scale (CRS). The way estate A operates can be thought of as a production process. With CRS, using A’s production process but half as much input, an estate could produce half as much output as A, producing at the point A*. Also, by using twice as much input as A, an estate could produce at A**, where output is twice that of A.
Using this argument, we can reason that with CRS an estate could produce at any point on the ray from the origin, 0, through A. It is clear that, for given input levels, output would be less if estate B or C’s production process were used, so the CRS frontier is the ray from 0 through A.
Once the frontier has been determined efficiency measures for each estate can be calculated. Defining efficiency, e, as the ratio of actual to frontier output, the efficiency of estate A, of estate B, and of C, ,12/2 ==Ae 4/3=Be == 4/2ce ½.

7
In some production situations the CRS assumption will be a poor approximation to reality. The frontier and efficiency measures can, however be constructed by using weaker technological assumptions. An example is variable returns to scale (VRS) technology, where it is assumed that production can be carried out by using the different observed estate production processes in combination.
For example, it is assumed that an estate could use A’s production process half of the time and estate B’s process half of the time. It would then produce on the dashed line half way between A and B. (1½ units of input using A’s process would produce 1 unit of output, and 3 units of input using B’s process would produce 1½ units of output, thus giving a total input level of 4½ units and total output of 2½ units). By using process A for part of the time and process B for the remainder, it can be argued that an estate could product at any point on the dashed line between A and B.
Also, if inputs can be left idle without cost, then an estate could produce at any point to the right of the dashed line AB, including points on the dashed horizontal line to the right from B. If output can be disposed of without cost, then an estate could produce at any point below the two dashed lines. With VRS technology (which allows free disposal of inputs and outputs) the frontier is the dashed line AB and the dashed horizontal line to the right of B.
Relative to this frontier, estate A’s efficiency, ,12/2 ==Ae estate B’s efficiency, and . Now estate B is judged (fully) efficient, and estate C more efficient
than when CRS technology was assumed. If we have a large sample of estate observations and the true frontier is the CRS frontier, we would expect the constructed VRS frontier to approximate the CRS frontier over observed input and output levels, and display approximately CRS. (See Debreu, 1951; Farrell, 1957; Farrell and Fieldhouse, 1962; Shephard, 1970, 1974; Afiat, 1972; Koopmans, 1977; Färe, Grosskopf and Lovell, 1983, 1985; Grosskopf, 1986 and McDonald 1996 and 1998, Ch 2, for further information on these methods).
13/3 ==Be 3/2=Ce
VRS and CRS frontiers were constructed using the 1086 Essex lay estate input and output data. Table 1 provides information on these data. Information is available on 577 estates. The net output measure, the annual value, was recorded in Domesday Book in pounds and shillings (20 shillings to the pound). Estate annual values ranged from three to 1200 shillings. The distribution of estate annual values is skewed to the right with the mean (108.5 shillings) considerably greater than the median (65 shillings). 75 percent of estates had an annual value of 30 shillings or more, and 25 percent an annual value of 140 shillings or more.
Turning to the inputs, arable farming relied on the use of ploughteams. All but nine estates had at least one demesne ploughteam (which were only employed on demesne land). The peasants also possessed ploughteams which they used to work the demesne when they gave service. Labour consisted of slaves (often associated with the demesne ploughteams) and peasants. Freeman and sokemen are recorded on about 10 percent of estates, bordars on over 90 percent, and villans and slaves on about 60 percent of estates. About 60 percent of estates list some livestock (sheep, swine, cattle and goats). Meadowland was present on about three quarters of estates and woodland and pasture were also recorded.5

8
The estimated frontiers suggest that CRS is a good description of Domesday production. The estimated VRS technology frontier indicates very mildly increasing, but very close to CRS (see McDonald, 1998, p. 112). Further empirical evidence supporting the CRS assumption is available from production function estimates. Constant elasticity of substitution and flexible form production functions estimated from Domesday production data also suggest close to CRS (see McDonald and Snooks 1986, Ch. 10, and McDonald 1998, Ch. 5). The nature of production confirms the plausibility of CRS. Production on large and small estates usually involved applying essentially the same process, but in different multiples. For example, arable agriculture was based on applying oxen ploughteams with their complement of manpower. CRS seems plausible because it is reasonable to expect that roughly twice as much land was ploughed with two ploughteams in a day as with one. There are strong reasons, then, for focussing the analysis on efficiency measures calculated assuming CRS technology.6
Factors Associated with Manorial Efficiency
Estate CRS efficiency measures ranged from .159 for Paglesham, an estate of Robert Corbutio in the hundred of Rochford, to 1 for 96 estates (located on the frontier). 25 percent of estates had an efficiency measure of .435 or less, the median value was .625, and 25 percent of estates had a measure of .861 or greater. Mean efficiency was .643 and the standard deviation .243. With over 25 percent of estates operating with less than 50 percent optimal efficiency, it might be thought that Domesday agriculture was indeed haphazardly organised. As will be shown in section 7, however, this variation in performance is usual in primary production.
In McDonald (1998, Ch 4.6) the efficiency measures are used to examine production on individual estates. The geographical location of almost all estates is known, and often there is a wealth of local information about an estate, as well as information from the Domesday Book entry. It is possible to compare the economic performance of estates with similar input levels and speculate as to why one estate appears more efficient than another. Such comparisons provide valuable insights into the nature and structure of Domesday production.
It is also possible to search more directly for factors associated with efficiency, and it would be interesting to know which tenants-in-chief ran efficient estates. We might expect that a tenant-in-chief would have operated his estates in a similar way based on his knowledge and experience. The average level of efficiency of the estates would then reflect the entrepreneurial ability of the tenant-in-chief.
Table 2 lists the mean efficiency of the estates of the 18 largest tenants-in-chief in Essex (all had at least 10 estates in Essex, although some had fewer than 10 estates in our sample). Eudo dapifer’s estates were the most efficient on average. Mean efficiency was .735, .092 greater than the overall mean for all estates of .643. Eudo dapifer held 25 estates in Essex (24 in our sample), a quarter of those in the sample were fully efficient. Count Eustace of Boulogne has the second largest mean efficiency (.704). Count Eustace held the largest number of estates in the county (81, with 72 in our sample), of those analysed 29 percent were fully efficient. Many of those who held less efficient estates such as Peter de Valognes, Roger de Ramis, Robert son of Corbutio, Count Alan of Brittany and John son of Waleram held fewer than 20 estates in Essex.

9
Interestingly, the tenants-in-chief holding the largest number of estates in Essex tended to hold more efficient estates. Of the nine tenants-in-chief holding most estates in the county, only two have mean efficiency values below the overall mean.
Statistical tests (McDonald 1998, Ch 4.8) indicate that estate efficiency values vary significantly with the tenant-in-chief, thus providing empirical support for the idea that tenants-in-chief did operate their estates at different efficiency levels according to their entrepreneurial flair.
High estate efficiency may result from location in an area with better transport, access to a town market, a better local climate or soil, a more favourable tenancy arrangement, production of a more profitable product, and many other reasons. Much of the available information on these factors is estate specific and not recorded on a uniform basis for all estates. Nevertheless, some measures can be calculated for all estates in the sample, and when this is the case, statistical methods can be used to assess whether estate efficiency is significantly related to the factors.
Five measurable factors are proximity to an urban centre, the economic size of the estate, the kind of agriculture practised, the tenure arrangement, and geographical (soil) region location.
A multiple regression of estate efficiency value on variables measuring these factors, the estate’s tenant-in-chief and hundred locations indicated that the tenant-in-chief, hundred location, size, and kind of agriculture effects were significant influences on efficiency, but the urban centre, tenure and soil region effects were not (see Table 3). The results indicated that larger estates tended to produce closer to the frontier (even though the frontier itself displays CRS), and estates specializing in grazing tended to be more efficient. In Essex sheep were the dominant livestock and the high efficiency levels for grazing estates would seem to reflect the high profitability of wool production at the time. This and other statistical analyses of factors affecting estate efficiency are discussed in detail in McDonald (1996), (1997) and (1998, Ch. 4.8).
How Efficient was Domesday Production?
Clearly, in an absolute sense Domesday estate production was inefficient. With modern technology, using, for example, motorised tractors, output could have been increased many-fold. A more interesting question is: Given the contemporary technology and institutions, how efficient was production?
The frontier measures best practice, given the economic environment, and one way of answering the question is to measure how far, on average, estate production was below the best practice frontier. Providing some estates were effectively organised, so that best practice was good practice, this will be a useful measure. If many estates were run haphazardly and ineffectively, average efficiency will be low and efficiency dispersion measures large. Comparisons with average efficiency levels in similar production situations will give an indication of whether Domesday average efficiency was unusually low.

10
A large number of efficiency studies have been reported in the literature (See McDonald 1998, Ch. 6.2). The studies show that average efficiency levels vary markedly not only with the production activity examined, but also the method used to measure efficiency and the level of aggregation of the production units. Three case studies with characteristics similar to Domesday production are Hall’s (1975) study of agriculture after the Civil War in the American South, Hall and LeVeen’s (1978) analysis of small Californian farms and Byrnes, Färe, Grosskopf and Lovell’s (1988) study of American surface coalmines. For all three studies the individual establishment is the production unit, the economic activity is unsophisticated primary production and CRS frontier methods are used to measure efficiency.
Hall’s (1975) study is based on 2117 farms in the American South during 1870-80. It is particularly interesting that, as with the Domesday study, the data refer to a period about two decades following invasion and major disruption to society (the American Civil War and the abolition of slavery). The main outputs on the farms were cotton and corn. Hall measured cotton in bales less the value of fertiliser (converted to units of cotton bales) and corn in bushels. The inputs were labour, measured physically in full-time equivalents; workstock, the number of horses, asses, mules and working oxen; the value of implements; total farm acres (used to measure the contribution to final output of land not actually producing crops); and a land quality index.
Hall measured mean technical efficiency on Southern farms to be .419 (or 42 percent), with a standard deviation of .203 (20 percent). This compares with a value for mean Domesday (overall) efficiency of .643 (or 64 percent) and standard deviation .243 (24 percent). Technical efficiency is only a component of overall efficiency. When Southern agriculture average efficiency is measured on a comparable basis, mean farm efficiency falls to 36 percent. These calculations suggest that Domesday estates were, on average, considerably more efficient than Southern farms.
In Hall and LeVeen’s (1978) study of 75 small Californian fruit and vegetable farms in the 1970s, farm output was the value of aggregate agricultural production and the inputs: acres of land, man-days of family labour, the dollar-value of hired labour, physical capital and material expenses. Mean farm technical efficiency was calculate to be 67 percent, and overall efficiency only 28 percent. Domesday mean overall efficiency (64 percent) is similar to Californian farm mean technical efficiency and much greater than mean overall efficiency.
The third study by Byrnes, Färe, Grosskopf and Lovell (1988) is of production of American surface coalmines. The activity, although not agriculture, is simple primary production. The data relate to 84 Midwestern mines in 1978 and 64 Western mines over all or part of 1975-8. Mean overall efficiency for both the Midwestern and Western mines was 61 percent, just marginally below the Domesday mean of 64 percent. Standard deviations were very similar in all three cases (approximately 24 percent).
The comparisons suggest that, on average, Domesday estate production was more efficient than production on post-bellum Southern farms and small Californian farms in the 1970s, and average efficiencies were very similar for Domesday estates and US surface coalmines. Certainly, the average Domesday estate efficiency level does not appear to be unusually low when compared with average efficiency levels in similar production situations.

11
The Output Cost of Feudalism and Manorialism
Largely through the influences of feudalism and manorialism, Domesday agriculture suffered from poorly developed factor markets and considerable immobility of inputs. Although there were exceptions to the rule, as a first approximation, manorial production can be characterized in terms of estates worked by a residential labour force using the resources which were available on the estate.
Input productivity depends on the mix of inputs used in production, and with estates endowed with widely different resource mixes, it is not surprising that input productivities varied widely across estates. It is true that even with input immobility, the processes of input substitution and output trading could result in similar input productivities across estates, but the opportunities for substitution of capital, labour and land inputs were limited, and conditions leading to equalization of factor productivities through output trading (such as low transport costs) were clearly not met in Domesday England.
Measures of input productivity on each estate are available from the Domesday frontier efficiency analysis. These input shadow prices indicate very considerable variation in the productivity of all inputs across estates. An estate’s input shadow price measures the increase in net output that can be achieved by an efficient estate, operating at the estate’s input level, when an extra unit of the input is used in production. The mean shadow price for a villan was 8.2 shillings (per annum). The standard deviation was 11.1 shillings and interquartile range 10.0 shillings. On some estates, the shadow price was zero. These statistics suggest a wide dispersion of villan productivity across estates. The shadow prices of other inputs also displayed wide dispersions (see McDonald 1998, Ch.4.9).
If the productivity of villans was higher on one estate than another, there was potential to increase total output by increasing use of villans on the more productive estate and reducing use on the less productive estate. The greater the difference in productivity on the estates, then the greater the possible increase in total output and the greater the economic cost of an institutional arrangement that discouraged mobility of inputs.
The frontier efficiency analysis allows us to estimate the economic cost of input rigidity induced by the feudal and manorial arrangements. An idea of the cost of factor rigidity can be obtained by estimating the total net output had all estates been run efficiently at the frontier, and comparing this total with the total net output achievable had production been at the frontier and input mixes variable.
The total net output that would have been generated had all estates produced at the frontier is equal to were is net output and the efficiency measure of the ith estate. ,1−∑ iieV iV ie
Because Domesday production was characterized by CRS, productivity did not vary with the scale of production, and the total net output had production been at the frontier and input mixes variable will be equal to the net output generated by a single estate operating at the frontier using input levels equal to the totals for the 577 Essex lay estates. The calculation indicates that

12
if inputs had been mobile an increase in total net output of 40.1 percent would have been possible. This potential loss in output is considerable. The frontier analysis indicates the loss in total net output resulting from estates not being fully efficient was 51.0 percent. The loss in output due to input rigidities is smaller, but of a similar order of magnitude.
Conclusion
Data generated by the Domesday Survey enable us to recreate the economy of the time. Production and tax relationships can be estimated, the production of individual estates examined, and issues such as the efficiency of Domesday estate production, the impact of feudalism and manorialism on production and the fairness of the tax system (see McDonald 1998, Ch.6.4-6.7) investigated. It is remarkable that so much can be discovered about the English economy in the first century of the second millenium, almost one thousand years ago.

13
Table 1. Summary statistics for data used in study. 577 Essex lay estates, 1086.
Variable Minimum Maximum Mean Median Standard
deviation
annual values 3.0 1200.0 108.5 65.0 131.8
demesne ploughteams 0 10.0 1.9 2.0 1.3
peasants’ ploughteams 0 37.5 2.3 1.0 4.1
livestock 0 3816.0 542.4 388.0 656.3
freemen & sokemen 0 37 0.6 0 2.8
villans 0 72 4.1 1 7.3
bordars 0 79 8.0 5 9.1
slaves 0 20 2.2 1 2.8
woodland 0 1500.0 105.9 30.0 189.0
meadow 0 120.0 12.2 6.0 16.2
pasture 0 1100.00 28.3 0 88.6
Note: Annual values are in shillings. Livestock is a weighted sum of cows, swine, sheep and goats (see note 5). Woodland is measured in terms of the number of swine that could be supported and pasture by the number of sheep that could be supported. Meadow is in acres. The other variables are measured by a count of their number.

14
Table 2. Mean efficiency of estates of 18 largest tenants-in-chief. Essex lay estates, 1086.
Tenants-in-chief Mean
efficiency
Standard
deviation of
mean
Deviation
from overall
mean
Number of
estates in
sample
Count Eustace .704 .031 .061 72
Suen of Essex .657 .030 .014 57
Geoffrey de Magna Villa .701 .037 .058 42
Robert Greno .519 .035 -.124 44
Richard son of Count Gilbert .649 .046 .006 29
Ranulf Peverel .677 .042 .034 37
Ralf Baignard .636 .040 -.007 29
Eudo dapifer .735 .042 .092 24
William de Warene .702 .055 .059 18
Ranulf brother of Ilger .615 .055 -.028 17
Hugh de Montfort .630 .055 -.013 18
Hamo dapifer .675 .057 .032 15
Peter de Valognes .454 .050 -.189 14
Aubrey de Ver .590 .051 -.054 16
Robert son of Corbutio .527 .069 -.117 11
Count Alan .542 .080 -.101 9
Roger de Ramis .471 .075 -.172 12
John son of Waleram .553 .087 -.090 8
Others .663 .023 .020 105

15
Table 3. Regression of efficiency % on estate characteristics.
577 Essex lay estates, 1086.
Variables p - values
tenant-in-chief 0.007**
hundred 0.005**
size (annual value) 0.000**
arable/livestock mix -0.007**
tenure 0.553
urban centre effect 0.450
geographical region (soil) 0.361
number of observations 577
⎯R2 0.20
Note: * indicates significant at the five percent and ** significant at the one percent level. No significant heteroskedasticity in the disturbances was detected in a battery of diagnostic tests.
The estate efficiency % was regressed on 18 binary tenant-in-chief variables, 21 binary hundred variables, the estate’s annual value (which indicates the size of the estate), a variable describing the arable/livestock mix of the estate (defined as livestock listed on the estate less cattle and beasts, which were associated with ploughing, divided by the number of ploughteams on the estate), a binary variable indicating whether or not the estate had a sub-tenant, a binary variable that indicated whether or not the estate was within 6 miles of Colchester or Maldon, and 2 binary variables that describe the main soil regions of Essex.
16
REFERENCES
Afriat, S. (1972), ‘Efficiency Estimation of Production Functions’. International Economic Review 13, 568-598.
Aston, T.H., ed. (1987). Landlords, Peasants and Politics in Medieval England. Cambridge: Cambridge University Press.
Ballard, A. (1906). The Domesday Inquest. London: Methuen.
Brittnell, R.H. and M.S. Campbell, eds. (1995). A Commercialising Economy: England 1086 to c. 1300. Manchester: Manchester University Press.
Brown, R. A. (1984). The Normans. Woodbridge: Boydell Press.
Byrnes, P., R. Färe, S. Grosskopf and C.A. K. Lovell (1988) ‘The Effect of Unions on Productivity: US Surface Mining of Coal’ Management Science, 34, 1037-53.
Clanchy, M.T. (1983), England and its Rulers, 1066-1272. Glasgow: Fontana.
Darby, H.C. (1952). The Domesday Geography of Eastern England. Reprinted 1971. Cambridge: Cambridge University Press.
Darby, H.C. (1977). Domesday England. Reprinted 1979. Cambridge: Cambridge University Press.
Darby, H.C. and I.S. Maxwell, eds. (1962). The Domesday Geography of Northern England. Cambridge: Cambridge University Press.
Debreu, G. (1951). ‘The Coefficient of Resource Utilization’. Review of Economic Studies 9, 300-312.
Färe, R., S. Grosskopf and C.A. K. Lovell. (1983). ‘The Structure of Technical Efficiency’. The Scandinavian Journal of Economics 85, 181-190.
Färe, R., S. Grosskopf and C.A. K. Lovell. (1985). The Measurement of Efficiency of Production. Boston: Kluwer-Nijhoff.
Farrell, M.J. (1957). ‘The Measurement of Productive Efficiency’. Journal of the Royal Statistical Society, Series A 120, 253-281.
Farrell, M.J. and M. Fieldhouse. (1962). ‘Estimating Efficient Production Functions under Increasing Returns to Scale’. Journal of the Royal Statistical Society, Series A 125(2), 252-267.
Galbraith, V.H. (1961). The Making of Domesday Book. Oxford: Clarendon Press.
Grosskopf, S. (1986). ‘The Role of the Reference Technology in Measuring Productive Efficiency’. The Economic Journal 96, 499-513.
17
Hall, A. R. (1975). ‘The Efficiency of Post-Bellum Southern Agriculture’, Ann Arbor, Michigan: University Microfilms International.
Hall, B. F. and E. P. LeVeen (1978) ‘Farm Size and Economic Efficiency: The Case of California’. American Journal of Agricultural Economics, 60, 589-600.
Hallam, H.E. (1981). Rural England 1066-1348. Brighton: Fontana.
Hallam, H.E., ed. (1988). The Agrarian History of England and Wales, II: 1042-1350. Cambridge: Cambridge University Press.
Hollister, C.W. (1965). The Military Organisation of Norman England. Oxford: Clarendon Press.
Holt, J. C., ed. (1987). Domesday Studies. Woodbridge: Boydell Press.
Koopmans, T. C. (1977). ‘Examples of production relations Based on Microdata’. In G.C. Harcourt, (ed.), The Microfoundations of Macroeconomicss. Vol. 6, London: McMillan.
Langdon, J. (1982). ‘The Economics of Horses and Oxen in Medieval England’. Agricultural History Review 30, 31-40.
Lennard, R. (1959). Rural England 1086-1135: A study of Social and Agrarian Conditions. Oxford: Clarendon Press.
Loyn, R. (1962). Anglo-Saxon England and the Norman Conquest. Reprinted 1981. London: Longman.
Loyn, R. (1965). The Norman Conquest. Reprinted 1981. London: Longman.
Loyn, R. (1983). The Governance of Anglo-Saxon England, 500-1087. London: Edward Arnold.
McDonald, J. (1996) A problem with the decomposition of technical inefficiency into scale and congestion components, Management Science, 42, 1996.
McDonald, J. (1997). Manorial Efficiency in Domesday England. Journal of Productivity Analysis, 8, 199-213.
McDonald, J. (1998). Production Efficiency in Domesday England. London: Routledge.
McDonald, J. (2002). Tax fairness in eleventh century England. The Accounting Historians Journal, 29 173-193.
McDonald, J. (2004). Economy of England at the time of the Norman Conquest, Online Encyclopedia of Economic History (EH.Net Encyclopedia), 1-6.
McDonald, J. (2005). Using William the Conqueror’s accounting record to assess manorial efficiency, Accounting History, 10, 125-145.

18
McDonald, J. (2006) Analysing historical data: A justification of the use of quantitative methods, Accounting History, 11 73-84.
McDonald, J. (2007) How fair were the tax assessments of Domesday England? in Flinders Essays in Economics and Economic History, ed Ralph Shlomowitz, Adelaide, Wakefield.
McDonald, J. and G. D. Snooks. (1985a). ‘Were the Tax Assessments of Domesday England Artificial? The Case of Essex’. Economic History Review 38, 353-373.
McDonald, J. and G. D. Snooks. (1985b). ‘The Determinants of Manorial Income in Domesday England: Evidence from Essex’. Journal of Economic History 45, 541-556.
McDonald, J. and G. D. Snooks. (1985c). ‘Statistical Analysis of Domesday Book (1086)’. Journal of the Royal Statistical Society, Series A 148, 147-160.
McDonald, J. and G. D. Snooks. (1986). Domesday Economy: A New Approach to Anglo-Norman History. Oxford: Clarendon Press.
McDonald, J. and G. D. Snooks. (1987a). ‘The Suitability of Domesday Book for Cliometric Analysis’. Economic History Review 40, 252-261.
McDonald, J. and G. D. Snooks. (1987b). ‘The Economics of Domesday England’. In A. Williams, (ed.), Domesday Book Studies. London: Alecto Historical Editions.
McDonald, J. and G. D. Snooks. (2003). Domesday Economy, Oxford Scholarship Online Edition, (with G. D. Snooks), Oxford University Press, Oxford.
Maitland, F.W. (1897). Domesday Book and Beyond. Reprinted 1921, Cambridge: Cambridge University Press.
Miller, E., and J. Hatcher. (1978). Medieval England: Rural Society and Economic Change 1086-1348. London: Longman.
Morris, J., gen. Ed. (1975). Domesday Book: A Survey of the Counties of England. Chichester: Phillimore.
Postan, M. M. (1966). Medieval Agrarian Society in its Prime, The Cambridge Economic History of Europe. Vol. 1, M. M. Postan, (ed.), Cambridge: Cambridge University Press.
Postan, M. M. (1972). The Medieval Economy and Society: An Economic History of Britain in the Middle Ages. London: Weidenfeld & Nicolson.
Raftis, J. A. (1957). The Estates of Ramsey Abbey: A Study in Economic Growth and Organisation. Toronto: Pontificial Institute of Medieval Studies.
Round, J. H. (1895). Feudal England: Historical Studies on the Eleventh and Twelfth Centuries. Reprinted 1964. London: Allen & Unwin.
Round, J. H. (1903). ‘Essex Survey’. In VCH Essex. Vol. 1, reprinted 1977. London: Dawson.

19
Shephard, R. W. (1970). The Theory of Cost and Production Functions. Princeton: Princeton University Press.
Shephard, R. W. (1974). Indirect Production Functions. Mathematical Systems in Economics, no. 10, Meisenheim Am Glad: Verlag Anton Hein.
Snooks, G. D. (1995). ‘The Dynamic Role of the Market in the Anglo-Saxon Economy and Beyond, 1086-1300’. In R. H. Brittnell and M. S. Campbell, (eds.), A Commercialising Economy: England 1086 to c. 1300. Manchester: Manchester University Press.
Stenton, D. M. (1951). English Society in the Middle Ages. Reprinted 1983. Harmondsworth: Penguin.
Stenton, F. M. (1943). Anglo-Saxon England. (reprinted 1975) Oxford: Clarendon Press.
Victoria County History. (1900-). London: Oxford University Press.
Williams, A., ed. (1987). Domesday Book Studies. London: Alecto Historical Editions.

20

21
1 Further background information on Domesday England is contained in McDonald and Snooks (1986, Ch. 1
and 2), (1985a), (1985b), (1987a), (1987b) and (2003) and McDonald (1996), (1997), (1998), (2002), (2004), (2005), (2006) and (2007). For more comprehensive accounts of the history of the period see Brown (1984), Clanchy (1983), Loyn (1962), (1965), (1983), Stenton (1943), and Stenton (1951). Other useful references include Ballard (1906), Darby (1952), (1977), Galbraith (1961), Hollister (1965), Lennard (1959), Maitland (1897), Miller and Hatcher (1978), Postan (1966), (1972), Round (1895), (1903), the articles in Williams (1987) and references cited in McDonald and Snooks (1986). The Survey is discussed in McDonald and Snooks (1986, sec. 2.2), the references cited there, and the articles in Williams (1987). The Domesday and modern surveys are compared in McDonald and Snooks (1985c).
2 The characterization of manorial production is discussed in more detail in McDonald and Snooks (1986, sec. 6.2 and 10.6).
3 Others who have made important contributions to our understanding of the Domesday economy include Miller and Hatcher (1978), Harvey e.g. (1983) and the contributors to the volumes edited by Aston (1987), Holt (1987), Hallam (1988) and Britnell and Campbell (1995) (especially, Snooks, 1995).
4 The data file was compiled by Eva Aker with the aid of a Flinders University research grant. The file was compiled directly from Domesday Book entries in the Victoria County History of Essex that were checked against a facsimile of the Latin transcript and an English translation in the so-called Phillimore edition (Morris 1975). A general rule of thumb was developed that only entries for which (1) net income (annual value) is positive, (2) either ploughteams or livestock entries are positive (or both), and (3) there is a positive entry for at least one labour variable, were retained for analysis. In addition, seven other entries were deleted either because they were implausible or incomplete. Further details are given in McDonald (1998).
5 All livestock, other than horses, were combined into one variable, using market values. The weights for livestock were: cows, 24; swine, 8; sheep, 5; and goats, 4. Sources for underlying market prices include Maitland (1921, p. 44), Ballard (1906, p. 27), Round (1903, p. 367) and Raftis (1957, p. 62). Horses were excluded because they were used largely for non-productive military and leisure purposes. It was not until the thirteenth and fourteenth centuries that ploughing with horses became common. Horses cost more to keep than oxen because of the cost of shoeing and the need for feed them oats in winter, whereas oxen could survive on hedge clippings, see Postan (1972, p. 80), Hallam (1981, p. 54) and Langdon (1982). Regression estimates that support the contention that horses did not have economic significance are reported in McDonald and Snooks (1985b). There is also patchy information on beehives, fisheries and other minor resources, but it is uncertain whether returns from these activities are contained in the estate annual values.
6 Estate efficiency measures based on other technological assumptions are analysed in McDonald (1998, Ch. 4.10).