The Dollar Hegemon? Evidence and Implications for Policy ...India, Malaysia, Pakistan and Singapore,...
40
The Dollar Hegemon? Evidence and Implications for Policy Makers Pierre-Olivier Gourinchas * UC Berkeley, NBER and CEPR [email protected] May 16, 2019 Abstract This paper reviews the central role of the US dollar in the global trade, financial and monetary systems. The dominance of the US dollar as an invoicing, issuance, anchor and reserve currency has increased over time, especially so and somewhat paradoxically since the end of the Bretton Woods system. The dollar is now the ‘hegemon’ currency. I propose an explanation based on the growing complemen- tarities between the role of the dollar for international trade and for international financial transactions. I also discuss the implications for policymakers of living in a ‘dollar world.’ The paper concludes with a discussion of some possible challenges to the dollar’s hegemony. * Prepared for the 6th Asian Monetary Policy Forum to be held on May 31, 2019 in Singapore.
Transcript of The Dollar Hegemon? Evidence and Implications for Policy ...India, Malaysia, Pakistan and Singapore,...

The Dollar Hegemon?Evidence and Implications for Policy Makers
Pierre-Olivier Gourinchas∗
UC Berkeley, NBER and [email protected]
May 16, 2019
Abstract
This paper reviews the central role of the US dollar in the global trade, financialand monetary systems. The dominance of the US dollar as an invoicing, issuance,anchor and reserve currency has increased over time, especially so and somewhatparadoxically since the end of the Bretton Woods system. The dollar is now the‘hegemon’ currency. I propose an explanation based on the growing complemen-tarities between the role of the dollar for international trade and for internationalfinancial transactions. I also discuss the implications for policymakers of living in a‘dollar world.’ The paper concludes with a discussion of some possible challenges tothe dollar’s hegemony.
∗Prepared for the 6th Asian Monetary Policy Forum to be held on May 31, 2019 in Singapore.
1 Introduction
In his insightful account of the Great Depression, Charles P. Kindleberger spelled out
the elements of a theory of ‘hegemonic stability’ for the intermational monetary system
(Kindleberger 1973).1 Writing in 1981, he summarized his view as follows:
‘I argue(d) that for the world economy to be stable, it needs a stabilizer,
some country that would undertake to provide a market for distress goods, a
steady if not countercyclical flow of capital, and a rediscount mechanism for
providing liquidity when the monetary system is frozen in panic. [...]
Britain, with frequent assistance from France, furnished coherence to the world
economy along these lines during the nineteenth century and through the “belle
époque.” The United States did so from 1945 (or perhaps 1936) to 1968 (or
1963 or 1971).’ Kindleberger (1981, p247)
According to Kindleberger, the benevolent leader or ‘hegemon’ actively stabilizes the
global system by supporting free trade and open capital markets, by coordinating macroe-
conomic and financial policies, and by acting as a lender of last resort providing much
needed international liquidity in times of crisis.2 The currency issued by the center coun-
try plays a critical role for each of these different functions. Since at least 1945, that
currency is the U.S. dollar.
First, the dollar is the currency of choice for trade invoicing, international security
issuance, or cross-border banking (Gourinchas, Rey and Sauzet 2019). Over the last half
century, this has greatly helped promote an open global environment for international1Kindleberger himself never used the term ‘hegemonic stability.’ The label was later coined by interna-
tional relation specialists, in part inspired by his work. According to Keohane (1980), hegemonic stabilitypostulates that “hegemonic structures of power, dominated by a single country, are most conducive tothe development of strong international regimes whose rules are relatively precise and well obeyed.”
2Historians of Greek antiquity establish a distinction between ‘hegemonia’, i.e. leadership via persua-sion and trust, and ‘arkhe’, i.e. leadership via force and power. See Coeuré (2018) for a recent analysisemphasizing this distinction in monetary affairs.
1

trade and financial transactions, facilitating international trade and exchange .
Second, in part because of its prominence in trade and financial transactions, the dol-
lar is also the main currency of intervention for central banks, as well as the currency in
which they accumulate the largest share of their official reserves. Not surprisingly, it is
also the dominant anchor currency, i.e. the currency against which central banks aim to
stabilize their own (Calvo and Reinhart 2002, Ilzetzki, Reinhart and Rogoff 2019). This
role of the dollar as both an intervention currency and an anchor currency helps propagate
U.S. monetary policy impulses from the center to the periphery, and provides a common
component to the global monetary environment. The spillovers of U.S. monetary policy
to the rest of the world are further strengthened by the importance of dollar funding for
global banks’ balance sheet, as well as the increasing length and complexity of global
supply chains (Bruno and Shin 2015, Bruno, Kim and Shin 2018, Kalemli-Özcan, Kim,
Shin, Sørensen and Yesiltas 2014).
Lastly, because the dollar is also viewed as the safest currency, it is a key determinant
of private investors’ demand for stores of value. In times of crisis, markets freeze and the
demand for dollar safe assets spikes. Preventing a full market collapse requires aggressive
provision of dollar liquidity. This can only be provided by the U.S. Federal Reserve, either
directly to domestic banks and the foreign subsidiaries of global banks via its discount or
repo windows, or indirectly via central bank swap lines (Farhi, Gourinchas and Rey 2011).
It follows that a proper analysis of the U.S. hegemon is an analysis of the dollar dominance
in international trade, finance and monetary affairs: the US hegemon is a dollar hegemon.
The simple reality is that we live in a dollar world: on the real side, where dollar
invoicing is dominant; on the financial side, where dollar funding is essential to global
banks and non-financial corporations; and on the policy side, where dollar anchoring and
2

dollar reserves are prevalent. If anything, this dominance of the dollar has increased
over time. Section 2 starts by reviewing the key historical developments that help us
understand the emergence of this dollar hegemon while Section 3 analyzes the current
roles of the dollar as an international currency. The dominance of the dollar has important
implications for policymakers which we discuss in Section 4. The dominance of the dollar
matters for the transmission of various shocks to to local economies. It matters for the
way in which monetary policy operates, and the choice of exchange rate regime. It matters
for the exposure to global financial shocks, and last but not least, it matters for the global
stability of the international financial system. Section 5 explores, speculatively, how the
system might evolve and concludes.
2 The Emergence of the Dollar Hegemon.
The introductory quote from Kindleberger makes clear that he viewed the suspension of
gold convertibility, first in 1968 for the private market, then in 1971 for foreign central
banks, as the beginning of the end of the era of uncontested U.S. monetary leadership.
Fig. 1 reports the value of the US dollar against the German Deutsche Mark, the Japanese
Yen, the Swiss Franc and the British pound between 1969 and 1989, rebased to 100 in
January 1969. The dollar depreciated nominally between 20 and 40% against the first
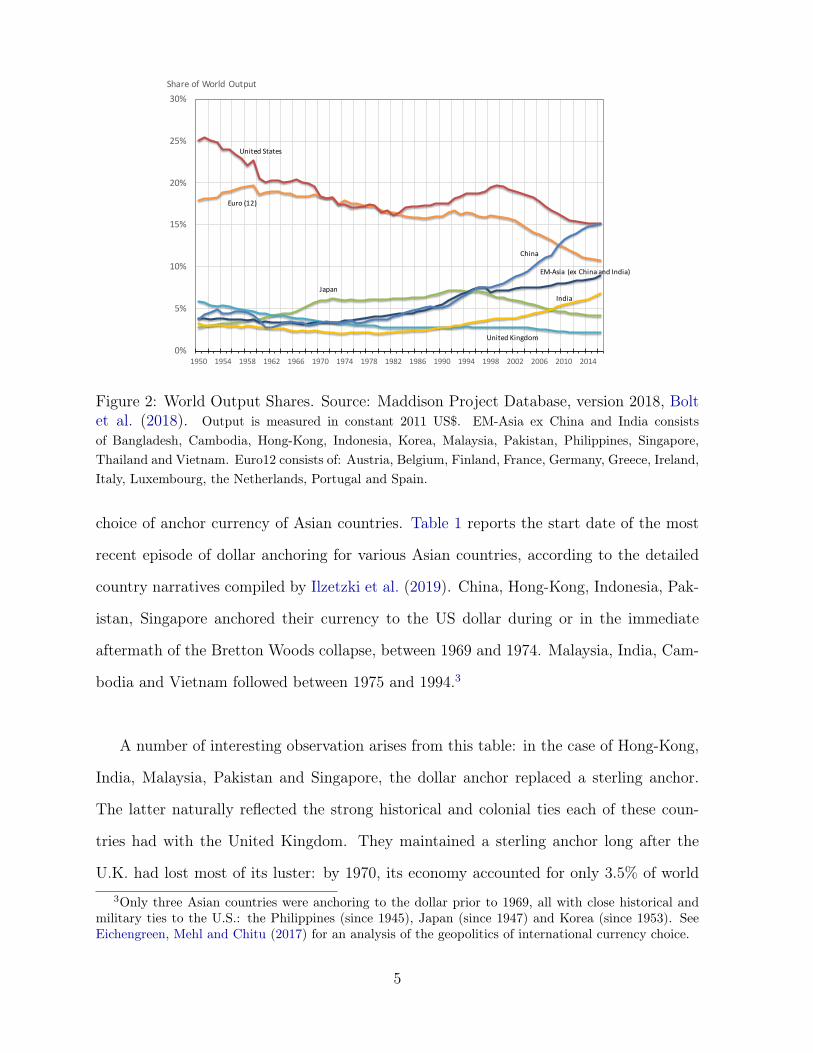
three currencies between 1971 and 1974. Fig. 2 reports the US share of world output
between 1950 and 2016. It declined from 25% in 1950 to 18% in 1971, mostly as West-
ern Europe and Japan, devastated by the destructions of the second world war, rebuild
their economies. Many contemporary observers shared similar worries: foreign exchange
volatility, coupled with a substantial decline in the value of the dollar against other po-
tential international currencies, rising US inflation in the 1970s and a decline in the share
of the US in world output could undermine confidence in the dollar as an international
currency (Aliber 1973, McKinnon 1974, Rueff 1971).
3

0
50
100
150
200
250
1969 1971 1973 1975 1977 1979 1981 1983 1985 1987 1989
Index
DEM JPY CHF GBP
Figure 1: Major Exchange Rates. Source: Global Financial Database. The figure reportsthe value of the US dollar in terms of the german Deutsche Mark (DEM), Japanese Yen (SPY), SwissFranc (CHF) and British pound (GBP). Exchange rates are normalized at 100 in Jan. 1969. A decreasein the index is a depreciation of the dollar.
Quite the opposite happened. As a number of scholars observed early on, the transition
to floating exchange rates had little impact on the use of the dollar as an international
currency (see Cooper 1973, McKinnon 1979, Mundell 1973, Whitman 1974 and Kenen
1983). Astonishingly, while the end of the Bretton Woods era was triggered by a run on
the dollar, it ushered in the era of the global dollar standard, of the dollar hegemon, that
is still with us to this day. Put simply, since 1971 the centrality and dominance of the
dollar has increased in all dimensions. In the words of Mundell (1973, p390), “the dollar
assumed greater monetary importance than gold.”
Part of the increased importance of the dollar reflects somewhat mechanically the col-
lapse of the soviet bloc in the late 1980s, and more generally, the transition of centrally
planned economies to market principles, with accompanying trade and financial liberal-
izations. Yet, it also goes beyond this simple accounting. As an illustration, consider the
4
0%
5%
10%
15%
20%
25%
30%
1950 1954 1958 1962 1966 1970 1974 1978 1982 1986 1990 1994 1998 2002 2006 2010 2014
Share of World Output
United States
Euro (12)
Japan
United Kingdom
China
India
EM-Asia (ex China and India)
Figure 2: World Output Shares. Source: Maddison Project Database, version 2018, Boltet al. (2018). Output is measured in constant 2011 US$. EM-Asia ex China and India consistsof Bangladesh, Cambodia, Hong-Kong, Indonesia, Korea, Malaysia, Pakistan, Philippines, Singapore,Thailand and Vietnam. Euro12 consists of: Austria, Belgium, Finland, France, Germany, Greece, Ireland,Italy, Luxembourg, the Netherlands, Portugal and Spain.
choice of anchor currency of Asian countries. Table 1 reports the start date of the most
recent episode of dollar anchoring for various Asian countries, according to the detailed
country narratives compiled by Ilzetzki et al. (2019). China, Hong-Kong, Indonesia, Pak-
istan, Singapore anchored their currency to the US dollar during or in the immediate
aftermath of the Bretton Woods collapse, between 1969 and 1974. Malaysia, India, Cam-
bodia and Vietnam followed between 1975 and 1994.3
A number of interesting observation arises from this table: in the case of Hong-Kong,
India, Malaysia, Pakistan and Singapore, the dollar anchor replaced a sterling anchor.
The latter naturally reflected the strong historical and colonial ties each of these coun-
tries had with the United Kingdom. They maintained a sterling anchor long after the
U.K. had lost most of its luster: by 1970, its economy accounted for only 3.5% of world3Only three Asian countries were anchoring to the dollar prior to 1969, all with close historical and
military ties to the U.S.: the Philippines (since 1945), Japan (since 1947) and Korea (since 1953). SeeEichengreen, Mehl and Chitu (2017) for an analysis of the geopolitics of international currency choice.
5
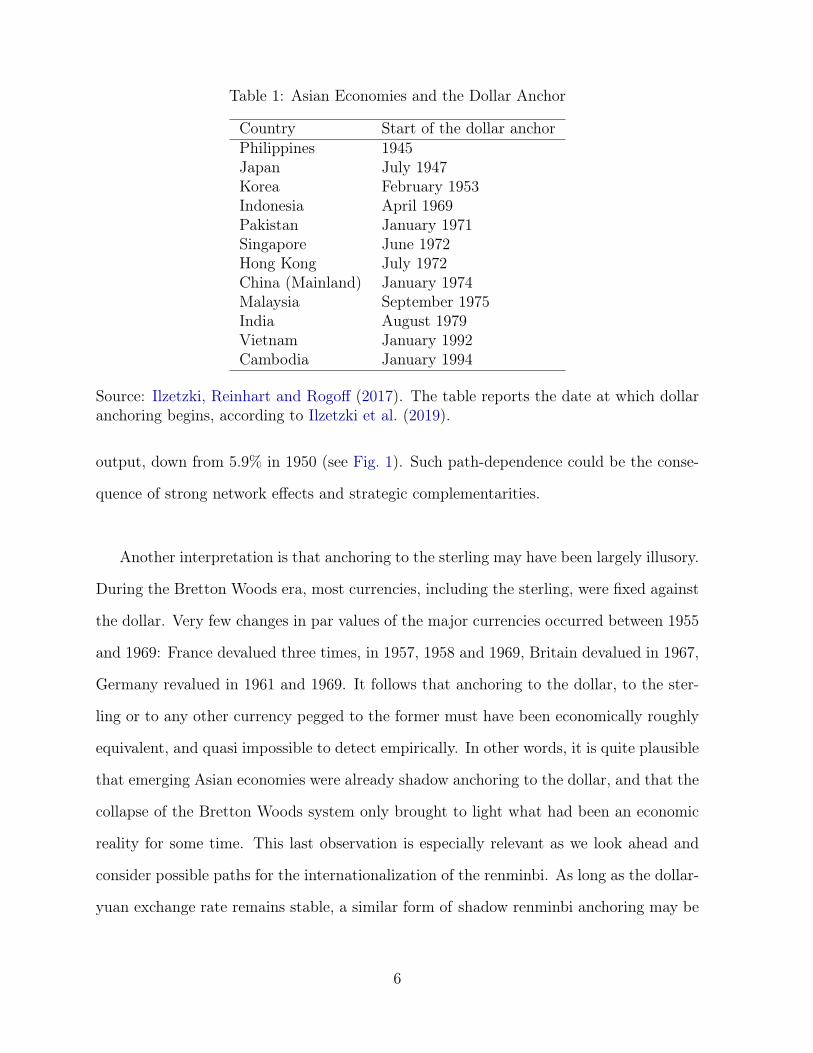
Table 1: Asian Economies and the Dollar Anchor
Country Start of the dollar anchorPhilippines 1945Japan July 1947Korea February 1953Indonesia April 1969Pakistan January 1971Singapore June 1972Hong Kong July 1972China (Mainland) January 1974Malaysia September 1975India August 1979Vietnam January 1992Cambodia January 1994
Source: Ilzetzki, Reinhart and Rogoff (2017). The table reports the date at which dollaranchoring begins, according to Ilzetzki et al. (2019).
output, down from 5.9% in 1950 (see Fig. 1). Such path-dependence could be the conse-
quence of strong network effects and strategic complementarities.
Another interpretation is that anchoring to the sterling may have been largely illusory.
During the Bretton Woods era, most currencies, including the sterling, were fixed against
the dollar. Very few changes in par values of the major currencies occurred between 1955
and 1969: France devalued three times, in 1957, 1958 and 1969, Britain devalued in 1967,
Germany revalued in 1961 and 1969. It follows that anchoring to the dollar, to the ster-
ling or to any other currency pegged to the former must have been economically roughly
equivalent, and quasi impossible to detect empirically. In other words, it is quite plausible
that emerging Asian economies were already shadow anchoring to the dollar, and that the
collapse of the Bretton Woods system only brought to light what had been an economic
reality for some time. This last observation is especially relevant as we look ahead and
consider possible paths for the internationalization of the renminbi. As long as the dollar-
yuan exchange rate remains stable, a similar form of shadow renminbi anchoring may be
6

at work, masquerading as a dollar anchoring. If, and when, the global economy is ready
for a competing renminbi standard, the latter may unveil itself suddenly and precisely at
a time of monetary instability between the U.S. and China.
The concept of ‘shadow anchoring’ also helps us understand how the dollar could prove
so resilient to the collapse of the Bretton Woods system. The traditional interpretation
emphasizes the lack of an alternative. For instance, Mundell writes:
“[T]he 1971 float of the dollar led to a brief period of confusion that exag-
gerated the weakness of the dollar. [...] By December 1971, however, when
the Smithsonian agreement was signed, there was a tacit (and reluctant) ac-
ceptance of a dollar standard. That the dollar could survive the crisis of
1971 as it did proved its growing secular strength despite its short-term weak-
ness.[...] [W]hen the United States suspended convertibility, the dollar was
still the world unit of account. That is why the system did not collapse in
1971 or, to be more exact, why countries went back to the dollar. There was
no alternative ready.” Mundell (1973, p390)
Yet this interpretation does not explain why the role of the dollar expanded as dra-
matically as it did in subsequent years. After all, between December 1971 and February
1973 when the Smithsonian agreement collapsed, the dollar depreciated by 14% against
the DM, 17% against the Yen and 22% against the Swiss franc (see Fig. 1). There is
little doubt that the transition to floating rates initially weakened the dollar as an inter-
national currency. But deeper forces were at play. In particular, one must consider the
key role that the center country plays in providing safe stores of value to the rest of the
world. This global provision of safe assets is one of the central aspects underpinning the
architecture of the international monetary and financial system. What defines the center
country is precisely that it is a net producer of safe assets, i.e. assets that deliver supe-
7
rior returns during global downturns.4 The provision of safe assets is intimately tied to
the level of development of financial markets, the fiscal capacity of the sovereign, as well
as the stability of its macroeconomic policies. A key insight from my work with Hélène
Rey, Ricardo Caballero and Emmanuel Farhi is that regardless of the formal ‘rules of the
game’ or formal exchange rate arrangements, the international monetary system naturally
evolves in an asymmetrical way, with large net global safe asset producers at its center
(see Gourinchas 2017, Gourinchas et al. 2019 and Caballero, Farhi and Gourinchas 2017b).
The architects of Bretton Woods system attempted to deal with this fundamental
asymmetry in two ways, one that proved fatal and one that helped albeit only temporar-
ily. First, by fixing the value of the dollar in terms of gold at $35/oz, the Bretton Woods
architects aimed to restore some symmetry in the system. The explicit aim was to in-
troduce an external constraint on U.S. policymakers, just as foreign policymakers faced
the external constraint of maintaining the par value of their currency against the dollar.
As Robert Triffin brilliantly observed in 1961 in what came to be known as the ‘Triffin
dilemma,’ the U.S. would ultimately be unable to simultaneously increase the supply of
dollars needed to meet the demand of a growing global economy, and maintain the dollar
price of gold.
Second, for most of its existence the Bretton Woods system of fixed parities operated
with severely limited capital mobility. Limited capital mobility helped curtail direct de-
mand for US safe assets originating with private foreign investors. Fixed parities meant
that a local alternative, almost as good as dollars, existed in the form of domestic central
bank liabilities and their substitutes such as local short-term government debt. As long
as the fixed parities remained credible and capital was not allowed to flow freely between
the center and the periphery, this allowed an elastic supply of local ‘quasi-safe’ assets by4Note that this definition is relative: all assets returns may decline in a global downturn. Safe assets
are those providing the strongest level of protection.
8
foreign central banks, partly backed by dollar reserve holdings. In other words, while local
financial institutions had little choice but to hold local assets instead of true US dollar
safe assets, the two were largely equivalent: local safe assets ‘shadowed’ dollar safe assets.
As long as dollars were scarce -acutely so in the immediate postwar period- this al-
lowed the global economy to ‘economize’ on dollar safe assets, alleviating their underlying
scarcity and letting the financial system operate smoothly. By the late 1960s, however, the
world economy faced instead a dollar glut, largely as a consequence of years of loose US
monetary policy. Under a fixed exchange rate system, this required foreign central banks
to accumulate dollar reserves, which propagated the glut to their local financial system.
This state of affairs was in some ways an inverted mirror image of the environment pre-
ceding the Global Financial Crisis (GFC) of 2008. In the 2000s, a global scarcity of safe
assets triggered the endogenous creation of public and private sector alternatives: ‘quasi-
safe’ assets that helped prop up the global economy in the years 2000-2007 (Bernanke,
Bertaut, DeMarco and Kamin 2011, Caballero, Farhi and Gourinchas 2008). The vul-
nerability was the lack of a proper backstop for quasi-safe assets: these would ultimately
buckle under stress and be vulnerable to runs, as their holders quickly tried to convert
them into true dollar safe assets (Gorton and Metrick 2012). In the late 1960s and early
1970s instead, an excessive supply of dollar assets was forced onto the global economy via
the fixed exchange rate system. The initial depreciation of the dollar between 1968 and
1973 was a corrective mechanism that reduced the market value of dollar safe assets and
equilibrated the market.
Interpreted in this light, the collapse of Bretton Woods first severed the link between
dollar and gold in 1969, resolving the original Triffin dilemma. The failure of the Smith-
sonian agreement in 1973 then officially severed the link between the dollar and other
currencies, in an environment marked by increasingly porous capital controls and the
9
emergence of offshore dollar markets. Ultimately, Triffin correctly analyzed the first con-
tradiction built into the Bretton Woods system, but did not address the second one. From
1973 onwards, the demand for safe assets relocated narrowly on dollar assets since the
US remained the sole provider of global safe assets. Increased capital mobility, currency
volatility and growth in the rest of the world -especially in emerging Asia which embarked
on an astonishingly rapid path of industrialization, further increased the demand for dol-
lar safe assets in subsequent years.5
3 The Dollar Hegemon Today
What is the current status of the dollar as an international currency? The short answer is
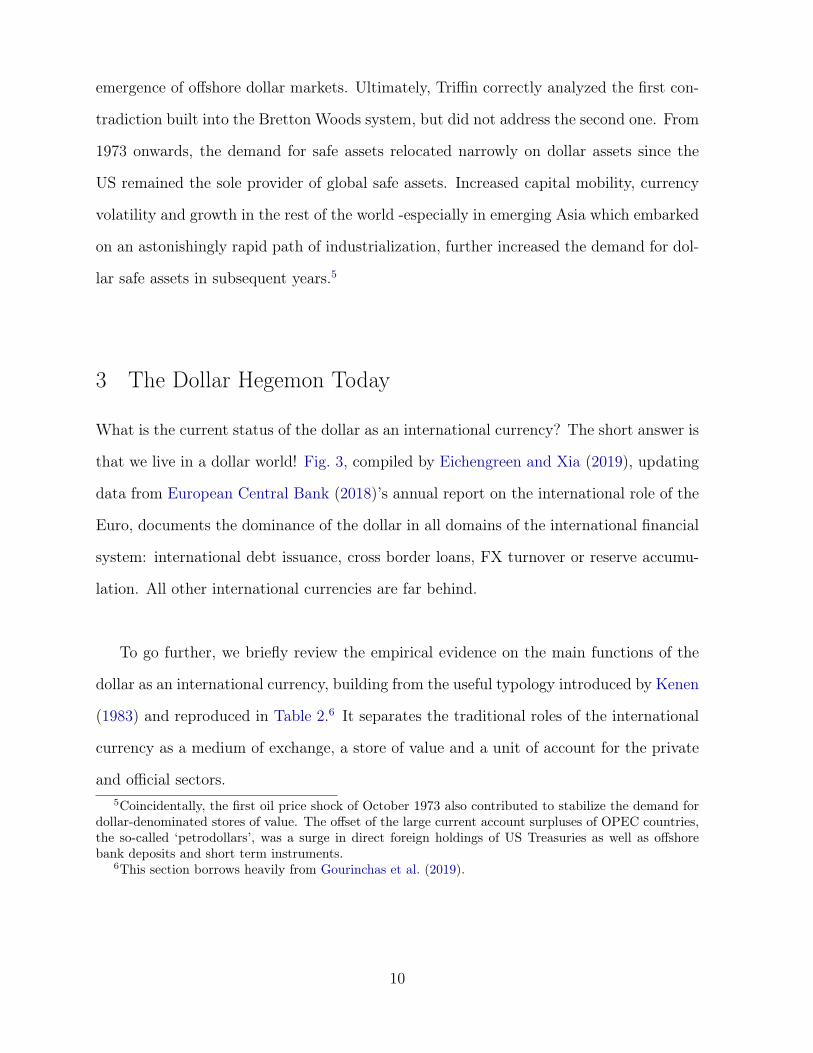
that we live in a dollar world! Fig. 3, compiled by Eichengreen and Xia (2019), updating
data from European Central Bank (2018)’s annual report on the international role of the
Euro, documents the dominance of the dollar in all domains of the international financial
system: international debt issuance, cross border loans, FX turnover or reserve accumu-
lation. All other international currencies are far behind.
To go further, we briefly review the empirical evidence on the main functions of the
dollar as an international currency, building from the useful typology introduced by Kenen
(1983) and reproduced in Table 2.6 It separates the traditional roles of the international
currency as a medium of exchange, a store of value and a unit of account for the private
and official sectors.5Coincidentally, the first oil price shock of October 1973 also contributed to stabilize the demand for
dollar-denominated stores of value. The offset of the large current account surpluses of OPEC countries,the so-called ‘petrodollars’, was a surge in direct foreign holdings of US Treasuries as well as offshorebank deposits and short term instruments.
6This section borrows heavily from Gourinchas et al. (2019).
10
44
16
11
6
2
63
22
30
59
21
4
62
20
54
2
40
34
4
7
2
0
10
20
30
40
50
60
70
USD EUR JPY GBP RMB USD EUR JPY RMB USD EUR JPY RMB USD EUR JPY GBP RMB USD EUR JPY GBP RMB
Foreignexchangeturnover
Internationaldebts
Internationalloans
Foreignexchangereserves
Global payment currency
percentage
Figure 3: The Dominance of the dollar. Source: Eichengreen and Xia (2019).
3.1 The Dollar as a Unit of Account
We begin with the dollar’s role as a unit of account. Thanks to the work of Goldberg and
Tille (2009) and Gopinath (2016), we have ample evidence on the extensive use of the
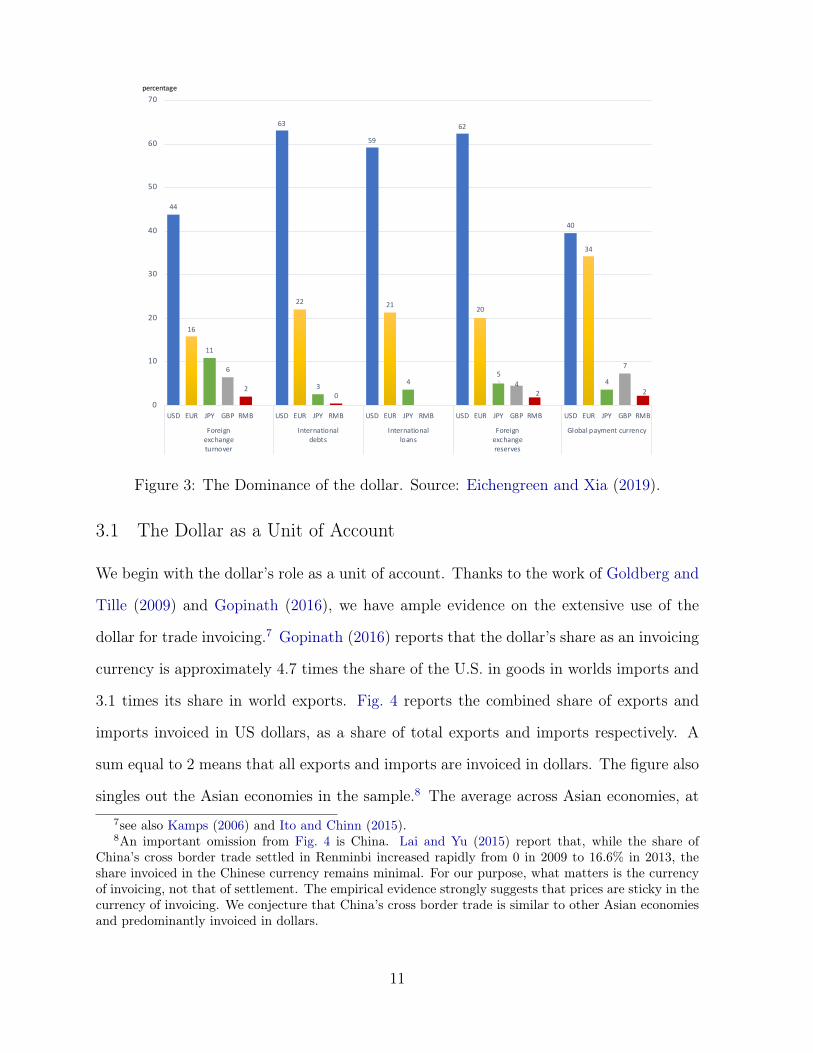
dollar for trade invoicing.7 Gopinath (2016) reports that the dollar’s share as an invoicing
currency is approximately 4.7 times the share of the U.S. in goods in worlds imports and
3.1 times its share in world exports. Fig. 4 reports the combined share of exports and
imports invoiced in US dollars, as a share of total exports and imports respectively. A
sum equal to 2 means that all exports and imports are invoiced in dollars. The figure also
singles out the Asian economies in the sample.8 The average across Asian economies, at7see also Kamps (2006) and Ito and Chinn (2015).8An important omission from Fig. 4 is China. Lai and Yu (2015) report that, while the share of
China’s cross border trade settled in Renminbi increased rapidly from 0 in 2009 to 16.6% in 2013, theshare invoiced in the Chinese currency remains minimal. For our purpose, what matters is the currencyof invoicing, not that of settlement. The empirical evidence strongly suggests that prices are sticky in thecurrency of invoicing. We conjecture that China’s cross border trade is similar to other Asian economiesand predominantly invoiced in dollars.
11

Table 2: International currrency
RolesMedium of exchange Store of value Unit of account
Vehicle currency Nominal securities issuance Denomination ofPrivate sector Liquid & safe asset Banking, cash hoarding securities
markets Trade invoicing
Official sector Intervention currency Reserves Exchange rate pegsLender of last resort Anchor currency
Note: Adapted from Kenen (1983).
1.61 is very high (the average across all countries is 0.94), placing Asian economies only
slightly behind Latin America (1.71).
From a theoretical perspective, the dominance of dollar invoicing arises naturally the
stronger the strategic complementarities between exporters, the more open the economy
is and the lower volatility of the dollar (Gopinath, Boz, Casas, Diez, Gourinchas and
Plagborg-Møller 2018, Mukhin 2017).
Turning to the official sector, Fig. 5 based on the important work of Ilzetzki et al.
(2019), documents the dramatic rise of the dollar zone between 1950 and 2015. According
to these authors, until 1970, about 30 percent of countries was anchored to the dollar,
with the rest split between UK pound, the French franc and the Soviet ruble. By 2015,
the dollar zone has expanded considerably, including not only the former Soviet bloc, but
also communist China, large parts of Asia, Africa and all of Latin America.
The dominant role of the dollar anchor reflects its importance both on the real and
financial side. On the real side, the dominance of dollar invoicing generates asymmetric
international spillovers that make it desirable to stabilize the dollar exchange rate (Egorov
12

0
0.2
0.4
0.6
0.8
1
1.2
1.4
1.6
1.8
2
Colo
mbi
aU
nite
d St
ates
Arge
ntin
aBr
azil
Paki
stan
Indo
nesi
aIn
dia
Sout
h Ko
rea
Thai
land
Mal
taU
krai
neCa
nada
Isra
elAu
stra
liaPe
ruJa
pan
Turk
eyLi
thua
nia
Cypr
usBu
lgar
iaG
reec
eN
orw
ayIc
elan
dU
nite
d Ki
ngdo
mSl
oven
iaLa
tvia
Finl
and
Spai
nN
ethe
rland
sPo
rtug
alEs
toni
aSw
eden
Den
mar
kIr
elan
dIta
lyPo
land
Rom
ania
Hun
gary
Ger
man
yFr
ance
Czec
h Re
publ
icSw
itzer
land
Belg
ium
Slov
akia
Aust
ria
Share of imports and exports invoiced in dollars
Imports USD Exports USD
Figure 4: Share of invoice of imports and exports in US dollars. We keep all the countriesfor which data on exports and imports are both available. Source: Gopinath (2016).
and Mukhin 2019). The intuition for this result is quite straightforward: In a world with
dollar pricing, domestic monetary policy cannot affect the demand for exports (whose
price in dollars is independent from the exchange rate). Instead, the monetary authority
will aim to stabilize the price of domestic goods. With imported intermediate inputs
also invoiced in dollars, this requires ‘leaning against the wind’ and stabilizing the dollar
exchange rate. On the financial side, another strand of the literature emphasizes the
spillovers of US monetary policy via asset markets. Dollar dominance in banking and
the dollarization of of cross border claims imply that US monetary policy impulses get
transmitted beyond US borders in international financial markets, contributing to a global
financial cycle (Avdjiev, N. and Shin 2015, Avdjiev, Du, Koch and Shin 2016, Miranda-
Agrippino and Rey 2018, Rey 2013).
13
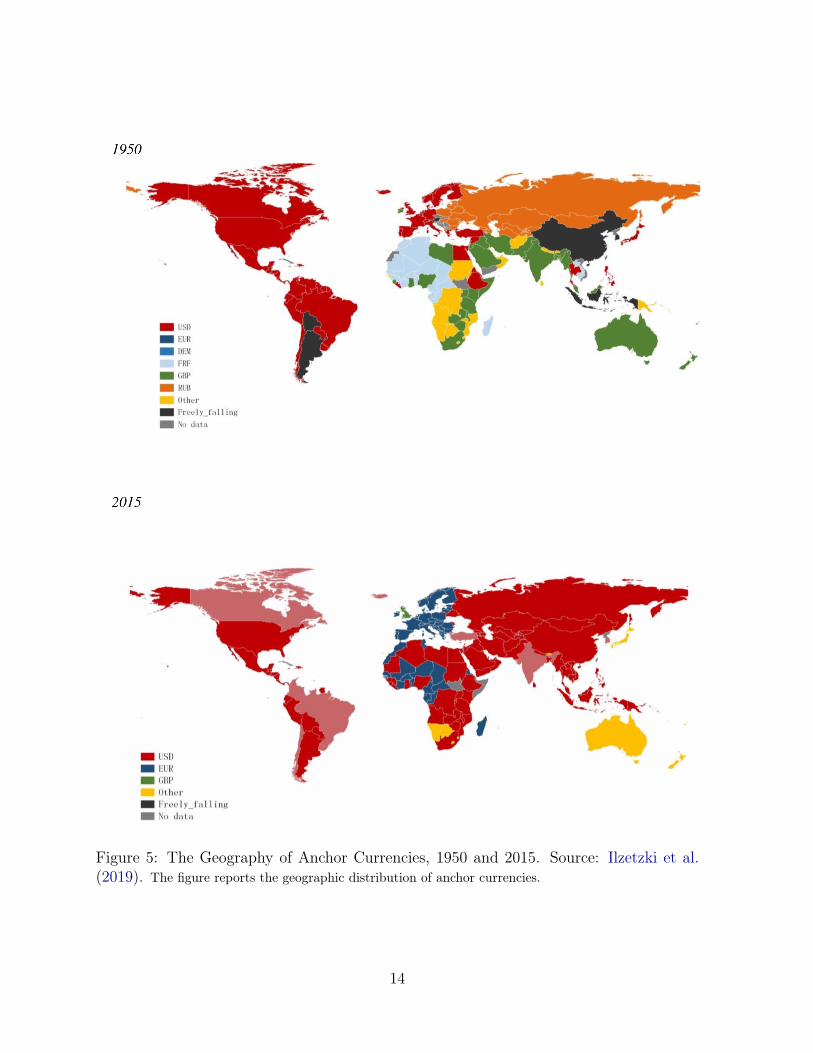
Figure 5: The Geography of Anchor Currencies, 1950 and 2015. Source: Ilzetzki et al.(2019). The figure reports the geographic distribution of anchor currencies.
14
3.2 The Dollar as a Means of Payment
Due to network externalities, few currencies emerge as vehicle currencies, that is, as in-
ternational means of payments. This vehicle currency role is closely tied to the liquidity
properties of the currency. Private investors around the world use dollars for their transac-
tions because they value the ability to conduct large transactions with minimum adverse
price impact. The depth and development of the dollar markets -not necessarily located
in the U.S. since most of the foreign exchange transactions are conducted in London–
is unparalleled. They are also more likely to use dollars if this is the currency in which
transactions are invoiced in the first place: currency of settlement and currency of invoic-
ing are often closely tied. As Fig. 3 documents, the dollar serves as the undisputed vehicle
currency.
Naturally, since the vehicle currency is used by most market participants, and is
the currency they need to obtain for emergency funding, it tends to be the intervention
currency, i.e. the currency used by central banks for their official interventions.
3.3 The Dollar as a Store of Value
International currencies also serve as store of value. Safety is a key attribute and the
demand for safe assets undergirds large parts of the international financial system. Private
investors use dollars for their short term investment needs as they are considered among
the safest instruments.
It follows that the currency of issuance of international assets is a key determinant
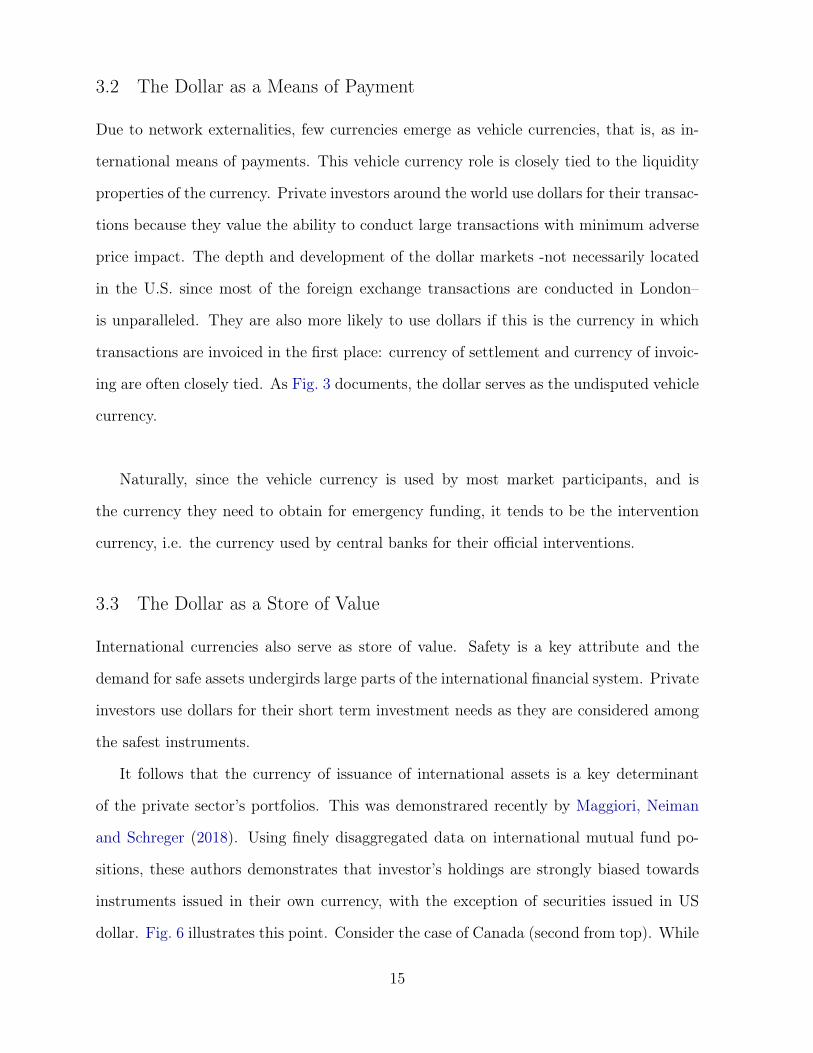
of the private sector’s portfolios. This was demonstrared recently by Maggiori, Neiman
and Schreger (2018). Using finely disaggregated data on international mutual fund po-
sitions, these authors demonstrates that investor’s holdings are strongly biased towards
instruments issued in their own currency, with the exception of securities issued in US
dollar. Fig. 6 illustrates this point. Consider the case of Canada (second from top). While
15
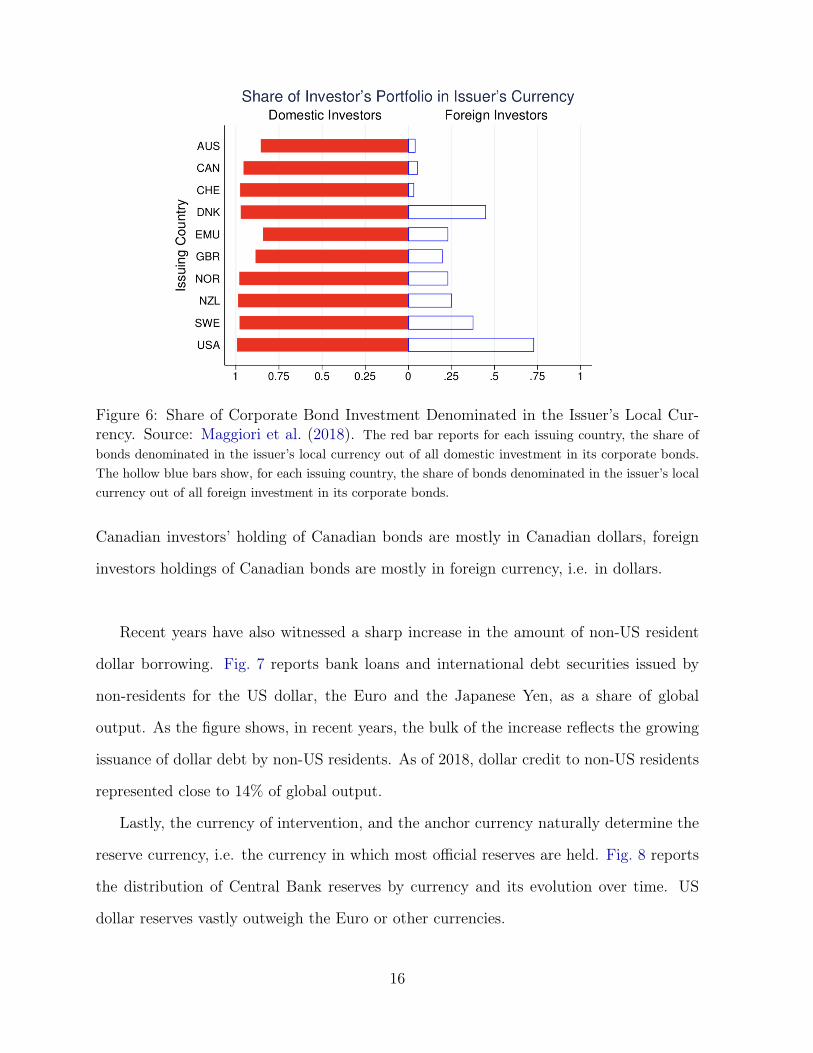
Figure 6: Share of Corporate Bond Investment Denominated in the Issuer’s Local Cur-rency. Source: Maggiori et al. (2018). The red bar reports for each issuing country, the share ofbonds denominated in the issuer’s local currency out of all domestic investment in its corporate bonds.The hollow blue bars show, for each issuing country, the share of bonds denominated in the issuer’s localcurrency out of all foreign investment in its corporate bonds.
Canadian investors’ holding of Canadian bonds are mostly in Canadian dollars, foreign
investors holdings of Canadian bonds are mostly in foreign currency, i.e. in dollars.
Recent years have also witnessed a sharp increase in the amount of non-US resident
dollar borrowing. Fig. 7 reports bank loans and international debt securities issued by
non-residents for the US dollar, the Euro and the Japanese Yen, as a share of global
output. As the figure shows, in recent years, the bulk of the increase reflects the growing
issuance of dollar debt by non-US residents. As of 2018, dollar credit to non-US residents
represented close to 14% of global output.
Lastly, the currency of intervention, and the anchor currency naturally determine the
reserve currency, i.e. the currency in which most official reserves are held. Fig. 8 reports
the distribution of Central Bank reserves by currency and its evolution over time. US
dollar reserves vastly outweigh the Euro or other currencies.
16

0
1
2
3
4
5
6
7
8
2000 2002 2004 2006 2008 2010 2012 2014 2016 2018
Percent of Global Output
USD EUR JPY
USD EUR JPYBank Loans International Debt Securities
Figure 7: International Credit to Non-Resident by Currency and Instrument, percent ofglobal GDP. Source: BIS Global Liquidity Indicators.
These are important complementarities between the different roles of an international
currency. For instance, more dollar invoicing, or longer supply chains involving dollar-
invoiced imported intermediates, are likely to increase the demand for dollar safe assets.
As analyzed by Gopinath and Stein (2018a), financial institutions are then likely to inter-
mediate these dollar assets into local dollar liabilities. In turn, more dollar debt issuance
by the non-financial corporate sector, or more dollar funding for local banks make it more
likely that the domestic central bank will monitor carefully the dollar exchange rate, in-
tervene on currency markets, or accumulate more dollar reserves (Gopinath and Stein
2018b). Conversely, a more stable dollar exchange rate, or a larger stock of dollar reserve
can make it more appealing to invoice in dollars, to borrow in foreign currency for banks
or nonbanks, or to lengthen the global supply chain by relying more on dollar-invoiced
foreign imported inputs.
17

0
2
4
6
8
10
12
14
19951996
19971998
19992000
20012002
20032004
20052006
20072008
20092010
20112012
20132014
20152016
2017
World - Foreign Exchange Reserves (USD Trillions)
USD EUR JPY GBP CHF AUD CAD CNY Other currencies Unallocated
Figure 8: Currency composition of Foreign Exchange Reserves for the World, in trillionsof US dollars. Source: IMF COFER as compiled by Gourinchas et al. (2019). The dateindicates the last quarter of each year.
4 Implications for Policymakers
This section explores the implications of the dollar dominance for policymakers. We begin
by discussing how dollar invoicing matters for the pass-through of exchange rates to local
prices and terms of trade. We then discuss how monetary policy transmission is affected
and how the value of the dollar affects global trade.9 Next, we consider how fluctuations
in the dollar may affect domestic financial frictions and the transmission of local and
US monetary policy. In this context, we revisit Rey (2013)’s argument that countries
face a dilemma, not a trilemma. Lastly, we consider the global implications of the dollar
standard for the scarcity of safe assets and the global stability of the international financial
system.9This discussion builds on Gopinath et al. (2018).
18

4.1 Exchange Rate Pass-Through, Expenditure Switching and the Effec-
tiveness of Flexible Exchange Rates
The combination of dollar invoicing, strategic complementarities in pricing and imported
intermediate inputs gives rise to a Dominant Currency Paradigm (DCP), explored in
detail empirically and theoretically in Gopinath et al. (2018). This paradigm forces us
to rethink a number of key predictions arising from standard models. For instance, in
the traditional New Keynesian framework prices are assumed to be set -and sticky- in
the producer’s currency (producer currency pricing or PCP). Under that assumption, a
depreciation of the local currency raises the price of imports relative to exports, a depre-
ciation of the terms of trade that shifts demand towards domestic produced goods and
away from foreign produced ones. This ‘expenditure switching effect’ of exchange rate
movements is a key argument in favor of flexible exchange rates. If all prices were set in
the producer’s currency, a 1% depreciation of the nominal exchange rate would depreciate
the terms of trade -defined as the ratio of the price of imports to the price of exports-
by 1% in the short term. Instead, under DCP, both imports and export prices are set in
dollar and a depreciation of the bilateral exchange rate has no effect on the terms of trade.
Empirically, Gopinath et al. (2018) put together aggregate data on harmonized an-
nual bilateral import and export unit values for a large number of countries pairs that
covers 91% of world trade. They confirm that non-commodities terms of trade are largely
uncorrelated with bilateral exchange rate movements (Table 3).
A second key implication of DCP is that the dollar exchange rate dominates bilat-
eral exchange rates in price pass-through and trade elasticity regressions. The first two
columns of Table 4 shows that the explanatory power of the the bilateral exchange rate
for import prices disappears once we control for the dollar exchange rate. The last two
columns of Table 4 show a similar result for trade volumes. Gopinath et al. (2018) also
19
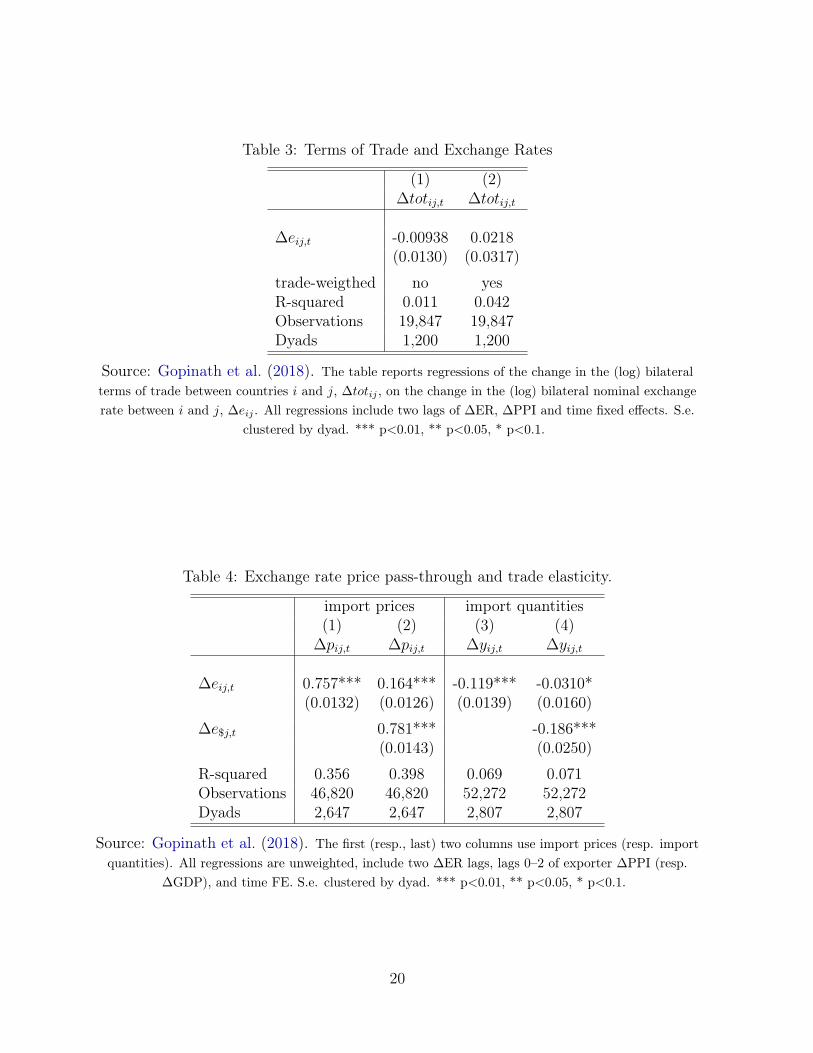
Table 3: Terms of Trade and Exchange Rates
(1) (2)∆totij,t ∆totij,t
∆eij,t -0.00938 0.0218(0.0130) (0.0317)
trade-weigthed no yesR-squared 0.011 0.042Observations 19,847 19,847Dyads 1,200 1,200
Source: Gopinath et al. (2018). The table reports regressions of the change in the (log) bilateralterms of trade between countries i and j, ∆totij , on the change in the (log) bilateral nominal exchangerate between i and j, ∆eij . All regressions include two lags of ∆ER, ∆PPI and time fixed effects. S.e.
clustered by dyad. *** p<0.01, ** p<0.05, * p<0.1.
Table 4: Exchange rate price pass-through and trade elasticity.
import prices import quantities(1) (2) (3) (4)
∆pij,t ∆pij,t ∆yij,t ∆yij,t
∆eij,t 0.757*** 0.164*** -0.119*** -0.0310*(0.0132) (0.0126) (0.0139) (0.0160)
∆e$j,t 0.781*** -0.186***(0.0143) (0.0250)
R-squared 0.356 0.398 0.069 0.071Observations 46,820 46,820 52,272 52,272Dyads 2,647 2,647 2,807 2,807
Source: Gopinath et al. (2018). The first (resp., last) two columns use import prices (resp. importquantities). All regressions are unweighted, include two ∆ER lags, lags 0–2 of exporter ∆PPI (resp.
∆GDP), and time FE. S.e. clustered by dyad. *** p<0.01, ** p<0.05, * p<0.1.
20
0 5 10 15 20-0.25
-0.2
-0.15
-0.1
-0.05
0
0.05
DCP PCP LCP
(a) Interest Rates
0 5 10 15 200
0.1
0.2
0.3
0.4
0.5
0.6
0.7
0.8
0.9
DCP PCP LCP
(b) Exchange Rate
0 5 10 15 20-0.05
0
0.05
0.1
0.15
0.2
0.25
DCP PCP LCP
(c) Inflation
0 5 10 15 200
0.2
0.4
0.6
0.8
1
DCP PCP LCP
(d) Output
0 5 10 15 20-0.2
0
0.2
0.4
0.6
0.8
1
1.2
DCP PCP LCP
(e) Export Quantity
0 5 10 15 20-0.6
-0.5
-0.4
-0.3
-0.2
-0.1
0
0.1
0.2
0.3
DCP PCP LCP
(f) Import Quantity
Figure 9: Impulse response to a 25bps domestic monetary policy easing in a Small OpenEconomy under different invoicing regimes: Producer Currency Pricing (PCP, dashed-black), Local Currency Pricing (LCP, dashed blue) and Dominant Currency Pricing (DCP,solid). Source: Gopinath et al. (2018).
document similar results using finely disaggregated product-firm level prices and quan-
tities for Colombian exports and imports. This result indicates that some expenditure
switching still operates, but only in response to the dollar exchange rate, and only on the
import margin.10
These findings suggest that flexible exchange rates will be less effective under DCP
than in standard New Keynesian models. Everything else equal, a unilateral depreciation
of the domestic currency against all currencies (including the dollar) will quickly pass-
through into the price of imported goods, but have a very limited impact on exports,10Exports will respond to movements in the destination country dollar exchange rate.
21
improving the trade balance mostly via a reduction in imports. It follows that local mon-
etary authorities will face a more adverse inflation-output trade-off.
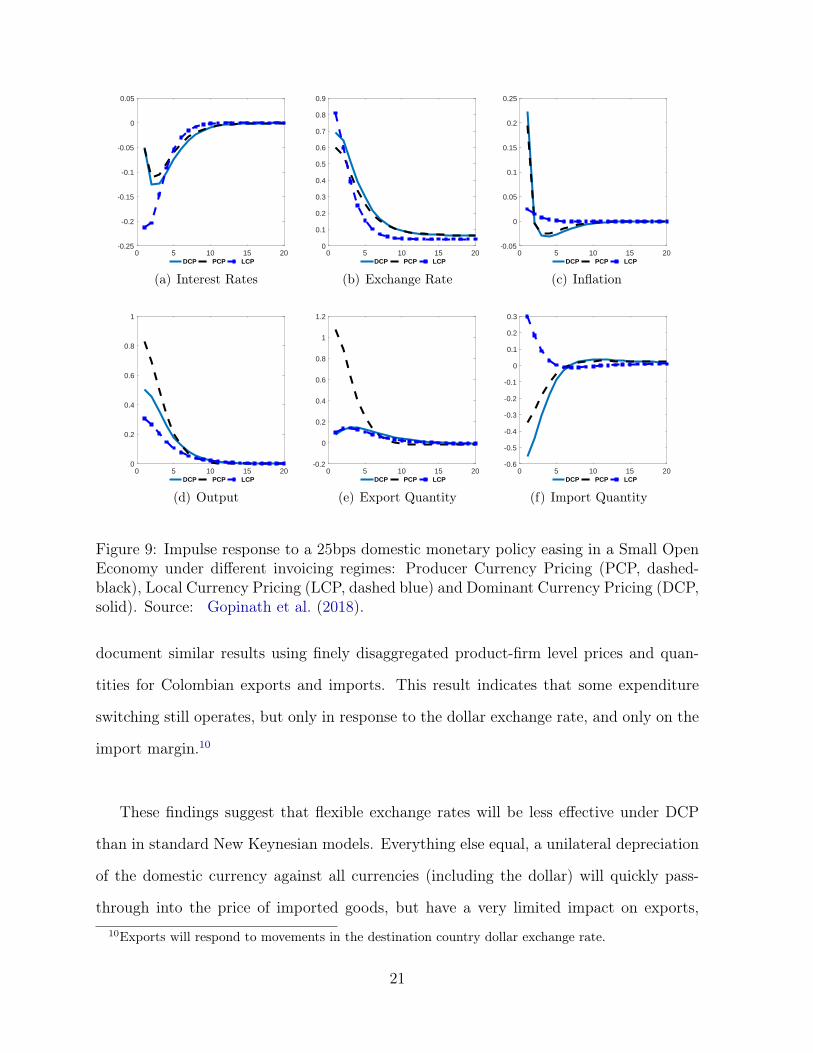
Fig. 9 illustrates this finding. It reports the theoretical responses of local interest
rates, the nominal exchange rate, consumer price inflation, output, export and import
quantities to a 25bps surprise reduction in the domestic policy rate, in a New Keynesian
model calibrated under three different pricing regimes: Producer Currency Pricing (PCP),
Local Currency Pricing (LCP) where the prices are invoiced and sticky in the destination
currency, and dollar pricing (DCP). This monetary impulse translates into roughly similar
depreciation under the three pricing regimes (panel (b)). However, the implications for
inflation (panel (c)) and output (panel (d)) dynamics are vastly different. Under PCP and
DCP, the depreciation increases the price of imports, increasing consumer price inflation.
However, the depreciation does not stimulate exports under DCP (panel (e)), hence the
increase in output remains more limited.11
To summarize, in a world of dollar invoicing, the gains to exchange flexibility are more
limited. As discussed by Egorov and Mukhin (2019) this also makes it more desirable to
stabilize the dollar exchange rate.
4.2 Dollar Factor and Global Trade
The converse is also true: when most trade is invoiced in dollars, U.S. monetary policy
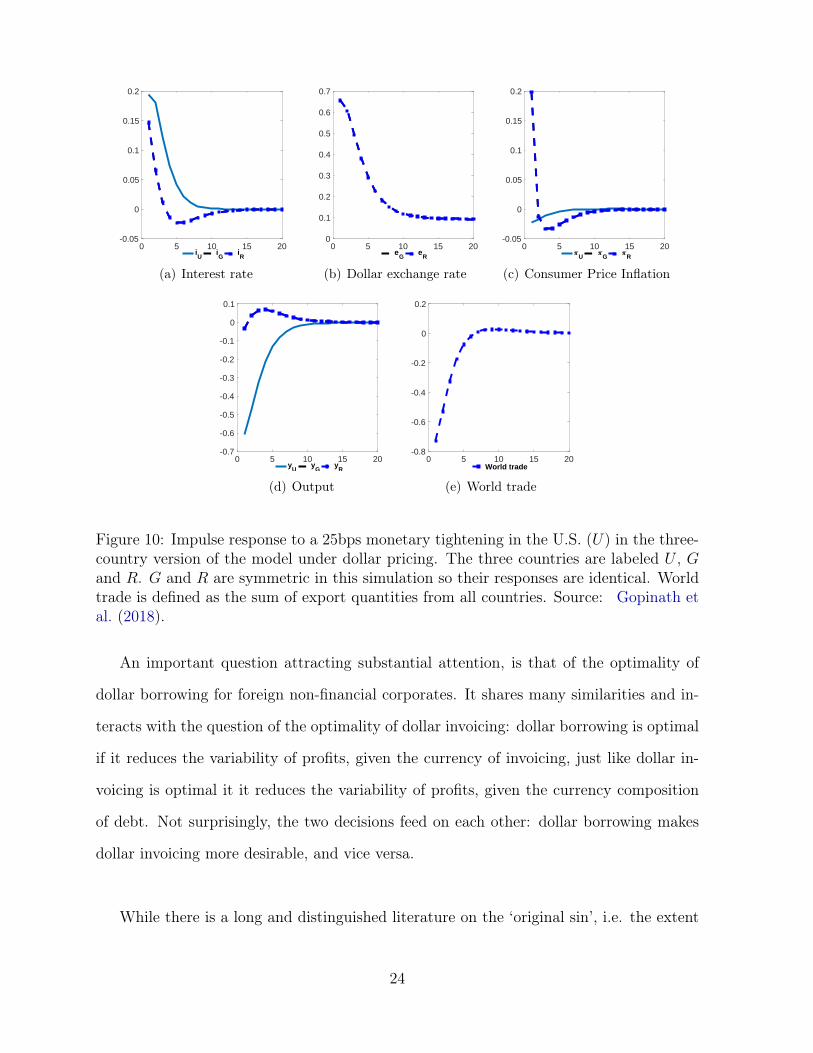
has a global reach. To illustrate this point, Fig. 10 reports the simulated impact of a
25bps U.S. monetary policy contraction in a stylized three-country version of a Gali and
Monacelli (2005) model with dollar pricing. As expected, a monetary tightening in the
U.S. appreciates the dollar (panel (b)), reduces US output (panel (d)) and lowers US in-11The model assumes a Taylor type rule for monetary policy, responding to consumer price inflation
and the output gap. This is why the behavior of policy rates in panel (a) is different under the threedifferent pricing regimes.
22

flation (panel (c)). However, under dollar pricing, US monetary policy has a very different
impact on the rest of the world than under standard models. First, under dollar pricing,
the appreciation of the dollar has only limited effects on US inflation: dollar pricing insu-
lates US inflation from movements in the dollar. Instead, the appreciation of the dollar
raises foreign import prices (and consumer price inflation) (panel (c)). Foreign central
banks aiming to stabilize inflation are then forced to raise their own policy rate (panel
(a)). Hence, a contractionary monetary impulse in the US triggers a contractionary more
globally. As a result, the appreciation of the dollar -which is typically expected to expand
output abroad via expenditure switching effects- fails to stimulate foreign output (panel
(d)). Instead, the dollar appreciation reduces exports for all countries, decreasing world
trade (panel (e)).
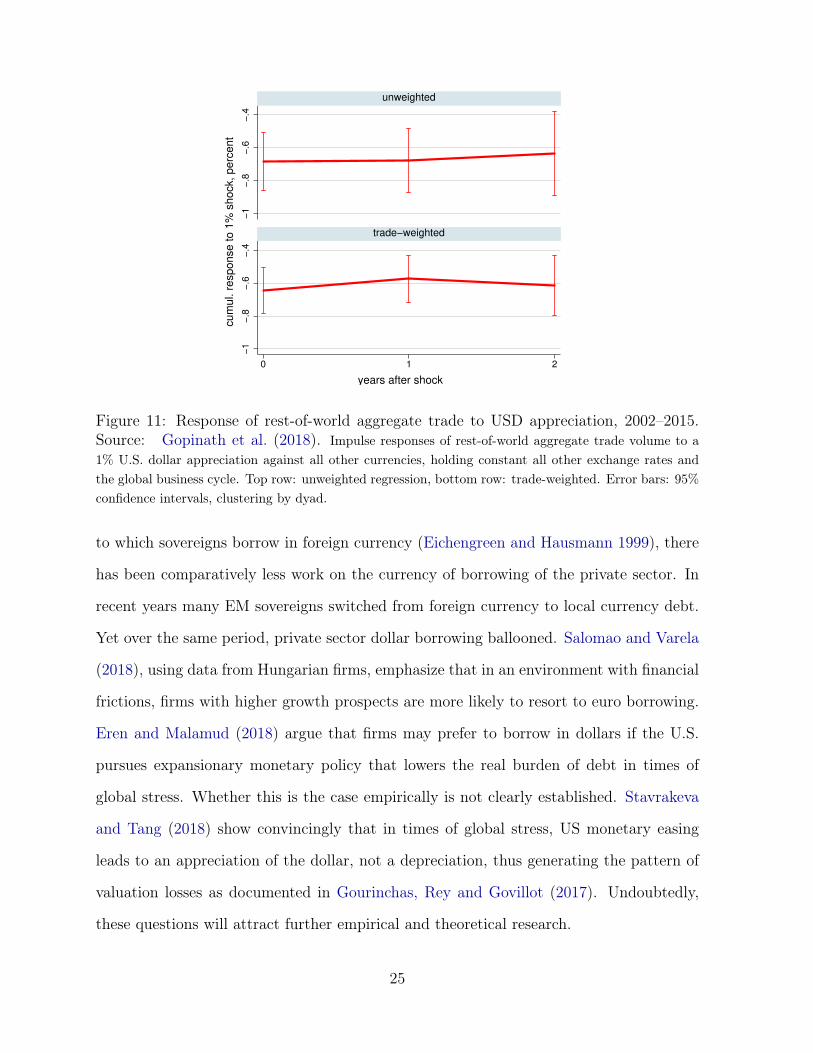
It follows that under dollar pricing, US monetary policy turns the dollar into an
important driver for global trade: as the dollar appreciates, trade volumes between non-
dollarized economies declines. Gopinath et al. (2018) explore this implication. Fig. 11
shows that a 1% appreciation of the dollar leads, ceteris paribus, to a 0.6% contraction
in trade volume in the rest of the world.
4.3 Financial Frictions, the Dollar and the Trilemma
While dollar pricing creates a link between global trade and the dollar, it is not the
only channel. Other factors could also explain why a dollar appreciation might cause
global trade to decline. One such factor is the currency of debt issuance. A dollar
appreciation mechanically increases the real debt burden of dollar borrowers. This could
cause foreign banks reliant on dollar funding to curtail domestic lending, or force non-
financial dollar borrowers to raise prices. A dollar appreciation tightens local financial
conditions, curtailing economic growth, and trade.
23
0 5 10 15 20-0.05
0
0.05
0.1
0.15
0.2
iU
iG
iR
(a) Interest rate
0 5 10 15 200
0.1
0.2
0.3
0.4
0.5
0.6
0.7
eG
eR
(b) Dollar exchange rate
0 5 10 15 20-0.05
0
0.05
0.1
0.15
0.2
U G R
(c) Consumer Price Inflation
0 5 10 15 20-0.7
-0.6
-0.5
-0.4
-0.3
-0.2
-0.1
0
0.1
yU
yG
yR
(d) Output
0 5 10 15 20-0.8
-0.6
-0.4
-0.2
0
0.2
World trade
(e) World trade
Figure 10: Impulse response to a 25bps monetary tightening in the U.S. (U) in the three-country version of the model under dollar pricing. The three countries are labeled U , Gand R. G and R are symmetric in this simulation so their responses are identical. Worldtrade is defined as the sum of export quantities from all countries. Source: Gopinath etal. (2018).
An important question attracting substantial attention, is that of the optimality of
dollar borrowing for foreign non-financial corporates. It shares many similarities and in-
teracts with the question of the optimality of dollar invoicing: dollar borrowing is optimal
if it reduces the variability of profits, given the currency of invoicing, just like dollar in-
voicing is optimal it it reduces the variability of profits, given the currency composition
of debt. Not surprisingly, the two decisions feed on each other: dollar borrowing makes
dollar invoicing more desirable, and vice versa.
While there is a long and distinguished literature on the ‘original sin’, i.e. the extent
24
−1
−.8
−.6
−.4
−1
−.8
−.6
−.4
0 1 2
unweighted
trade−weightedcum
ul. r
esponse to 1
% s
hock, perc
ent
years after shock
Figure 11: Response of rest-of-world aggregate trade to USD appreciation, 2002–2015.Source: Gopinath et al. (2018). Impulse responses of rest-of-world aggregate trade volume to a1% U.S. dollar appreciation against all other currencies, holding constant all other exchange rates andthe global business cycle. Top row: unweighted regression, bottom row: trade-weighted. Error bars: 95%confidence intervals, clustering by dyad.
to which sovereigns borrow in foreign currency (Eichengreen and Hausmann 1999), there
has been comparatively less work on the currency of borrowing of the private sector. In
recent years many EM sovereigns switched from foreign currency to local currency debt.
Yet over the same period, private sector dollar borrowing ballooned. Salomao and Varela
(2018), using data from Hungarian firms, emphasize that in an environment with financial
frictions, firms with higher growth prospects are more likely to resort to euro borrowing.
Eren and Malamud (2018) argue that firms may prefer to borrow in dollars if the U.S.
pursues expansionary monetary policy that lowers the real burden of debt in times of
global stress. Whether this is the case empirically is not clearly established. Stavrakeva
and Tang (2018) show convincingly that in times of global stress, US monetary easing
leads to an appreciation of the dollar, not a depreciation, thus generating the pattern of
valuation losses as documented in Gourinchas, Rey and Govillot (2017). Undoubtedly,
these questions will attract further empirical and theoretical research.
25
More broadly, dollar dominance in banking and the dollarization of cross-border claims
also imply that US monetary policy impulses get transmitted to the broader economy.
In a celebrated contribution, Rey (2013) argued that the induced global financial cycle
reduced the desirability of flexible exchange rates, turning the classic Trilemma into a
Dilemma. Yet, in Gourinchas (2018), I argued that in an environment with financial
spillovers, flexible exchange rates may become more, not less, desirable (see also Akinci
and Queralto 2018).
To see why this might be the case, suppose that it is indeed the case that a U.S.
monetary policy tightening is contractionary abroad, for instance because the incipient
appreciation of the dollar tightens local financial conditions for dollar borrowers. How lo-
cal monetary authorities should respond depends, in turn, on how local monetary policy
transmits to their own economy. It is a simple matter of logic to observe that, if a local
monetary policy easing is expansionary, as is usually assumed, then the optimal response
to the contractionary impulse originating from the center remains a local monetary easing.
It follows immediately that the local currency must be allowed to depreciate against the
dollar.
Stabilizing the exchange rate would be desirable if local monetary policy tightenings
were ‘perversely’ expansionary locally, instead of contractionary. Many EM policymakers
seem to think this is indeed the case. The resulting monetary policy dilemma is sometimes
called the ‘Tošovský dilemma’, in reference to Josef Tošovský, governor of the Czech Na-
tional Bank in the mid 1990s when capital inflows to Eastern European countries surged
(see Na 2019). Similar arguments have been made more recently by the central banks
of Iceland and Turkey (see Gudmundsson 2017 and Başçı, Özel and Sarıkaya 2008): a
local monetary tightening can become expansionary if the higher yields attract a massive
26

amount of foreign capital, and the appreciation of the local currency relaxes collateral con-
straints in the local economy. In that case, the contractionary impulse from the US should
be countered by tightening domestic monetary conditions, leaving the exchange rate more
or less unchanged. Obviously, this requires that financial spillovers are sufficiently strong:
the direct expansionary effects of an appreciation become so large that they overwhelm
the other and more usual contractionary channels of transmission of monetary policy.
To illustrate this possibility, Fig. 12 reports the impulse response of EM output for
a US monetary policy tightening, in a New Keynesian model calibrated to Chile, with
dominant currency pricing and financial spillovers from the exchange rate.12 For low levels
of financial spillovers (panel (a)), the model operates as a standard Mundell-Fleming or
Gali and Monacelli (2005) model: a monetary policy tightening in the US is expansionary
abroad, thanks to the depreciation of the local currency against the dollar. As we increase
the degree of financial spillovers, the depreciation tightens the financial constraints, hurt-
ing the local economy. For moderate or high levels of financial spillovers, a US tightening
contracts the local economy (panels (b) and (c)). Fig. 13 reports the calibrated impulse
responses to a domestic monetary policy tightening. The case of low financial spillovers,
as before, corresponds to the Mundell-Fleming case where a monetary tightening is con-
tractionary (panel (a)). For moderate levels of spillovers, a domestic tightening remains
contractionary, but less so: the appreciation of the local currency against the dollar re-
laxes borrowing constraints (panel (b)). Overall, though even if local monetary policy has
become less effective, the optimal response to a US tightening -which contracts the EM
economy- is to ease monetary policy. Finally, panel (c) considers the case of high financial
spillovers. In that case, the balance sheet effects of an appreciating currency are so strong
that the economy expands when the domestic policy rate is increased. A tightening of
domestic monetary policy becomes desirable precisely because it is expansionary.12The financial spillovers are modeled simply by assuming that some households are borrowing con-
strained and that their borrowing limit increases as the currency appreciates.
27

5 10 15
-0.01
-0.005
0
0.005
0.01
0.015
0.02Output
Manuf
Total
5 10 15
-0.03
-0.02
-0.01
0
0.01Consumption
Sav.
Bor.
5 10 15
-0.01
-0.005
0
0.005
0.01
0.015
0.02Employment
5 10 15
-5
0
5
10
1510
-3 CPI Inflation
5 10 15
-0.01
0
0.01
0.02
0.03Ext. Cost of Funds
5 10 15
0
1
2
3
4
5
610
-3 Policy Rate
5 10 15
-10
-5
0
510
-3 Terms of Trade
5 10 15
-0.02
-0.01
0
0.01
0.02
0.03
0.04Exchange Rate/P
5 10 15
Years
-1
-0.5
0
0.5
1Household Debt
5 10 15
Years
-0.02
0
0.02
0.04
0.06TB/GDP
US MonPol
5 10 15
-1
-0.5
0
0.5
1NFA/Y
(a) Low Spillovers
5 10 15
-0.02
-0.015
-0.01
-0.005
0
0.005
0.01Output
Manuf
Total
5 10 15
-0.1
-0.05
0
0.05Consumption
Sav.
Bor.
5 10 15
-0.02
-0.015
-0.01
-0.005
0
0.005
0.01Employment
5 10 15
-0.01
-0.005
0
0.005
0.01
0.015
0.02CPI Inflation
5 10 15
-0.01
0
0.01
0.02
0.03Ext. Cost of Funds
5 10 15
-4
-2
0
2
410
-3 Policy Rate
5 10 15
-0.01
-0.005
0
0.005
0.01Terms of Trade
5 10 15
-0.02
0
0.02
0.04
0.06Exchange Rate/P
5 10 15
Years
-0.3
-0.2
-0.1
0
0.1Household Debt
5 10 15
Years
-0.05
0
0.05
0.1TB/GDP
US MonPol
5 10 15
-0.3
-0.2
-0.1
0
0.1NFA/Y
(b) Intermediate Spillovers
5 10 15
-0.4
-0.3
-0.2
-0.1
0
0.1
0.2Output
Manuf
Total
5 10 15
-1
-0.5
0
0.5Consumption
Sav.
Bor.
5 10 15
-0.4
-0.3
-0.2
-0.1
0
0.1
0.2Employment
5 10 15
-0.02
-0.01
0
0.01
0.02
0.03
0.04CPI Inflation
5 10 15
0
0.005
0.01
0.015
0.02
0.025
0.03Ext. Cost of Funds
5 10 15
-0.1
-0.05
0
0.05Policy Rate
5 10 15
0
0.005
0.01
0.015Terms of Trade
5 10 15
-0.05
0
0.05
0.1Exchange Rate/P
5 10 15
Years
-1.5
-1
-0.5
0
0.5Household Debt
5 10 15
Years
-0.2
-0.1
0
0.1
0.2
0.3
0.4TB/GDP
US MonPol
5 10 15
-1.5
-1
-0.5
0
0.5NFA/Y
(c) High Spillovers
Figure 12: Impulse Response of EME output to a US Monetary Policy Tightening forvarious degrees of financial spillovers. Source: Gourinchas (2018). The figure reports theeffect of a US monetary tightening on EM’s output with various degrees of financial spillovers.
5 10 15
-0.06
-0.04
-0.02
0
0.02Output
Manuf
Total
5 10 15
-0.06
-0.05
-0.04
-0.03
-0.02
-0.01
0Consumption
Sav.
Bor.
5 10 15
-0.06
-0.04
-0.02
0
0.02Employment
5 10 15
-10
-5
0
510
-3 CPI Inflation
5 10 15
0
0.5
1
1.510
-4 Ext. Cost of Funds
5 10 15
-5
0
5
10
1510
-3 Policy Rate
5 10 15
-4
-3
-2
-1
0
1
210
-3 Terms of Trade
5 10 15
-0.02
-0.015
-0.01
-0.005
0
0.005
0.01Exchange Rate/P
5 10 15
Years
-1
-0.5
0
0.5
1Household Debt
5 10 15
Years
-0.1
-0.05
0
0.05TB/GDP
Chile MonPol
5 10 15
-1
-0.5
0
0.5
1NFA/Y
(a) Low Spillovers
5 10 15
-0.04
-0.03
-0.02
-0.01
0
0.01
0.02Output
Manuf
Total
5 10 15
-0.04
-0.03
-0.02
-0.01
0
0.01
0.02Consumption
Sav.
Bor.
5 10 15
-0.04
-0.03
-0.02
-0.01
0
0.01
0.02Employment
5 10 15
-10
-5
0
510
-3 CPI Inflation
5 10 15
0
0.5
1
1.5
210
-4 Ext. Cost of Funds
5 10 15
-0.01
-0.005
0
0.005
0.01
0.015
0.02Policy Rate
5 10 15
-10
-5
0
510
-3 Terms of Trade
5 10 15
-0.03
-0.02
-0.01
0
0.01Exchange Rate/P
5 10 15
Years
-0.05
0
0.05
0.1Household Debt
5 10 15
Years
-0.1
-0.05
0
0.05TB/GDP
Chile MonPol
5 10 15
-0.05
0
0.05
0.1NFA/Y
(b) Intermediate Spillovers
5 10 15
-0.2
-0.15
-0.1
-0.05
0
0.05
0.1Output
Manuf
Total
5 10 15
-0.4
-0.2
0
0.2
0.4Consumption
Sav.
Bor.
5 10 15
-0.2
-0.15
-0.1
-0.05
0
0.05
0.1Employment
5 10 15
-0.01
-0.005
0
0.005
0.01CPI Inflation
5 10 15
0
0.5
1
1.5
210
-4 Ext. Cost of Funds
5 10 15
-0.02
0
0.02
0.04
0.06Policy Rate
5 10 15
-0.01
-0.008
-0.006
-0.004
-0.002
0Terms of Trade
5 10 15
-0.04
-0.02
0
0.02
0.04Exchange Rate/P
5 10 15
Years
-0.5
0
0.5Household Debt
5 10 15
Years
-0.2
-0.1
0
0.1
0.2TB/GDP
Chile MonPol
5 10 15
-0.5
0
0.5NFA/Y
(c) High Spillovers
Figure 13: Impulse Response of EME output to an EME Monetary Policy Tightening forvarious degrees of financial spillovers. Source: Gourinchas (2018). The figure reports theeffect of a domestic monetary tightening on domestic output for various degrees of financial spillovers.
The upshot is that, while financial spillovers and dollar invoicing reduce the effec-
tiveness of flexible exchange rates, they do not necessarily make flexible exchange rate
less desirable for emerging market economies. In other words, the Trilemma may be re-
inforced, not weakened, by the global financial cycle. Whether this is the case or not
depends, crucially, on the strength of financial spillovers from the exchange rate, and on
the transmission of US and local monetary policy. These are empirical questions of the
first importance to which we have, so far, few definitive answers.
28

4.4 Safe Asset Scarcity, Safety Traps and Currency Wars
The transition to a dollar standard limited the supply of global safe assets to dollar safe
assets. While dollars safe assets may have initially been in abundant supply, increases
in capital mobility, rapid economic growth in emerging markets ahead of their level of
financial development, and new regulations in the wake of the global financial crisis have
created and perpetuated a global scarcity of safe assets (Caballero et al. 2017b). This
scarcity is one of the defining characteristics of our economic environment. It is consistent
with the secular decline in global real interest rates since the early 1980s. It is also con-
sistent with the observed divergence between the average real return to physical capital
and the risk free real rate.13
Caballero, Farhi and Gourinchas (2016) argue that the scarcity of safe assets mutates
once the economy reaches the Effective Lower Bound (ELB) on the policy rate. Above
the ELB, the scarcity is benign: countries with a scarcity of safe assets run a current
account surplus vis-à-vis safe asset providers, and these surpluses pushes the global safe
real rate downwards. At the ELB, the scarcity becomes malign: since the equilibrium real
rate cannot fall sufficiently to equilibrate the market for safe assets, aggregate demand
falls short of potential output and the global economy experiences a recession. In that
environment, countries face a strong incentive to reflate their economy at the expense
of their neighbor, for instance by depreciating their currency. In other words, there is
a potential for currency wars. More generally, there are strong gains from coordinating
macroeconomic policies. In the extreme, policies that seem to be appropriate locally, such
as increasing price flexibility, or building safety nets by accumulating reserves, or imple-
menting stricter liquidity requirement on the banking sector as envisioned under Basle13The increased spread between the economic return to productive capital and the risk free rate is
also consistent with increased rents in the economy. Caballero, Farhi and Gourinchas (2017a) proposes amacro decomposition that allows for increased rents as well as increased risk premia or factor-augmentingtechnological progress. It finds that increased rents or technological progress cannot alone explain thedecline in the labor share and observed trends in returns. See also Farhi and Gourio (2019).
29

III, may be self-defeating globally: by accentuating the scarcity of safe assets, they may
push the global economy further into a recession (Fornaro and Romei 2018).
5 Where Do We Go from There? New Triffin Dilemma and
Shadow RMB Anchor.
In conclusion, I would like to offer a few prospective remarks. First, Fig. 14 extends
Fig. 2, using World Economic Outlook data. It reports output shares between 1980 and
2024 as predicted by the International Monetary Fund, for the same countries and re-
gions.14 The message is very clear: the share of US output in world output is expected to
decline further, from 15.5% in 2016 to 13.7% in 2024. Much of the growth is expected to
come from India (7.3% to 9.8%) and China (17.6% to 21.4%). This secular decline in the
relative size of the U.S. raises important questions for the continued primacy of the dollar.
To begin with, in the near future, the US is bound to remain the primary issuer of
global safe assets. All other candidate international currencies lag far behind the dollar
along almost all dimensions (see Fig. 3). The immediate implication is that, unless the
supply of dollar safe assets rises in line with global demand, the global scarcity of safe
assets is bound to increase, pushing global real safe rates uncomfortably close to the ELB.
The macroeconomic risks of such an environment are quite easy to grasp: at the ELB,
the global economy tips over into a recession. The increasing scarcity of safe assets keeps
the economy in the danger zone. Furthermore, as I’ve argued above, self-oriented policies
such as fiscal austerity, reserve accumulation or stricter liquidity requirement in the bank-
ing sector, that may look appropriate at the country level, could well be self-defeating
globally as they further increase global demand for safe assets or reduce its supply.14There are small but non negligible differences between Fig. 2 and Fig. 14. These are not important
for our purpose and I will ignore them.
30

Other dangers lurk in the corners. Low safe real rates, below the growth rate of the
economy, send a strong market signal that debt sustainability is not an issue. This is the
case whether the issuers have sufficient borrowing capacity or not. For the former, more
debt issuance increases the supply of safe assets and helps move the global economy away
from safety traps (Caballero et al. 2016, 2017b). For the latter, whether private or public,
a key question is whether markets have the ability to correctly price credit risk. The
experience of the latest global financial crisis is not encouraging. Caballero et al. (2008)
argued that environments with a scarcity of safe assets are prone to bubbles. One way to
think about these bubbles is that they increase the supply of ‘quasi-safe’ assets. While
this may temporarily alleviate the problem, it also makes the global economy more risky
since these are not truly safe assets: bubble are rarely safe. The danger, then, is that
efforts to make some parts of the financial system safer only help to push vulnerabilities
to other corners.15 As argued by Shin (2014), a second phase of global liquidity started
around 2010, with a substantial increase in dollar debt issuance substituting for cross-
border dollar loans, since the latter were subject to a stricter regulatory environment (see
Fig. 7). In turn, continued or even increased private sector reliance on dollar funding
makes local authorities reluctant to let their currency depreciate against the dollar, and
potentially increases sovereign default risk, even on local currency debt (Du and Schreger
2016). Increased reliance on dollar funding also increases the desirability of holding dollar
reserves (Gopinath and Stein 2018b).
Core safe asset providers such as the US face a problem of a different nature: a modern
version of the old Triffin dilemma. Expanding public debt in line with a growing global15Carstens and Shin (2019) make a similar argument in relation to the original sin debate: the devel-
opment of local currency bond markets for sovereign debt may look like it is insulating sovereigns fromfluctuations in the dollar exchange rate. Yet it simply pushes the currency risk onto the marginal (andforeign) lender. In the end, local currency bond markets may simply substitute currency risk for defaultrisk without substantially improving risk sharing.
31

0%
5%
10%
15%
20%
25%
1980 1984 1988 1992 1996 2000 2004 2008 2012 2016 2020 2024
Share of World Output
United States
Euro (12)
Japan
United Kingdom
China
India
EM-Asia (ex China and India)
Projection
Figure 14: World Output Shares - 2. Source: World Economic Outlook, April 2019.Output shares based on PPP. EM-Asia ex China and India consists of Bangladesh, Cambodia, Hong-Kong,Indonesia, Korea, Malaysia, Pakistan, Philippines, Singapore, Thailand and Vietnam. Euro12 consistsof: Austria, Belgium, Finland, France, Germany, Greece, Ireland, Italy, Luxembourg, the Netherlands,Portugal and Spain.
demand is tempting: yields remain low, so that debt sustainability does not appear to be
an issue. Furthermore, to the extent that the global economy is close to the effective lower
bound, fiscal policy is likely to be quite stimulative. The alternative, with an unchanged
supply of safe assets and real rates at the ELB, is a secular appreciation of the dollar
which restores equilibrium on the market for safe assets by reducing foreign demand (in
dollars) (Caballero et al. 2017b). However, since the share of the US economy will con-
tinue to decline, expanding US public debt in line with the growth of the world economy
must eventually exhaust the fiscal capacity of the US, and before that, runs the risk of
coordination failure type run on its debt (Farhi and Maggiori 2018).
To put it differently, while the dollar hegemon is locally stable, it is not sustainable.
The global economy will have to transition, at some point in the future, either to another
single anchor, or to a multipolar environment. The former scenario is much less likely
than the latter since no-one anticipates a full displacement of the dollar. The most likely
32
path is one where the dollar co-exists with one or two other global international curren-
cies: the renminbi and possibly the euro.
While that transition will not be completed anytime soon, it is already partially under
way. First, renminbi internationalization has started, both by design, and as a conse-
quence of the increased size of the Chinese economy and the explosion in the volume of
trade between China and the rest of the world. The use of renminbi for trade invoic-
ing, trade settlement, cross-border financial transactions, or official use, has soared in the
last ten years, in part due to a number of policy initiatives implemented by the Chinese
authorities, including trade settlement programs, RMB offshore clearing banks, off-shore
RMB denominated bond market in Hong Kong (so called ‘dim sum’ bonds), and a network
of central bank RMB swap lines.16 These initial efforts culminated in October 2016 with
the addition of the renminbi to the basket making up the International Monetary Fund’s
Special Drawing Rights. More recently, China introduced an RMB denominated oil fu-
ture contract (‘petroyuan’) and allowed the inclusion of Chinese local bonds in Bloomberg
global bond index. As in the case of the dollar, we ought to expect that the use of the
renminbi for trade invoicing and settlement will increase the private sector demand for
renminbi funding, and vice versa; that increased renminbi invoicing and borrowing will
increase the desirability of anchoring one’s currency to the RMB, and to hold RMB re-
serves; and conversely that stability in the RMB-local exchange rate and abundant RMB
reserves will make it more desirable to invoice and borrow in RMB.
These complementarities also suggest that the transition could gather speed once it
gets seriously under way. Consider, for instance, the question of RMB anchoring. No
country is currently anchoring to the RMB. In part this is because, while the currency is
technically deemed ‘freely usable,’ it still faces significant restrictions.17 Another reason16See Eichengreen and Kawai (2015) for a detailed description of each policy initiative.17The IMF criterion for a ‘freely usable’ currency does not require that all capital controls be dismantled.
33
is that, as long as the dollar-RMB exchange rate remains reasonably stable, anchoring to
the dollar indirectly also anchors to the RMB. The argument is similar to that of ster-
ling anchoring during the Bretton Woods era and described above: for all intents and
purposes, sterling anchors were shadow dollar anchors. Once currencies started floating,
countries -especially in Asia- had to choose whether to remain anchored to the sterling or
the dollar. All of them chose the dollar. Similarly, for some countries, a dollar anchor may
already be a ‘shadow RMB anchor.’ A switch to RMB anchoring would occur, should
significant monetary instability between the two countries arise. This could force a rapid
realignment with the emergence of a RMB zone.
34

ReferencesAkinci, Ozge and Albert Queralto, “Balance sheets, exchange rates, and international
monetary spillovers,” June 2018. FRB of New York Staff Report No. 849.
Aliber, Robert Z, National Preferences and the scope for International monetary reformnumber 101, International Finance Section, Princeton University, 1973.
Avdjiev, Stefan, McCauley Robert N., and Hyun Song Shin, “Breaking free of the triplecoincidence in international finance,” 2015. Working Paper 524, Bank Int. Settl., Basel,Switz.
, Wenxin Du, Catherine Koch, and Hyun Song Shin, “Exchange rates, currency hedgingand the cross-currency basis,” 2016. Working Paper 592, Bank Int. Settl., Basel, Switz.
Başçı, Erdem, Özgür Özel, and Çağrı Sarıkaya, “The monetary transmission mechanismin Turkey: new developments,” 2008. Paper No 35, Bank Int. Settl., Basel, Switz.
Bernanke, Ben S., Carol Bertaut, Laurie Pounder DeMarco, and Steven Kamin, “Inter-national capital flows and the returns to safe assets in the United States, 2003-2007,”International Finance Discussion Papers 1014, Board of Governors of the Federal Re-serve System 2011.
Bolt, Jutta, Robert Inklaar, Herman de Jong, and Jan Luiten van Zanden, “Rebasing‘Maddison’: new income comparisons and the shape of long-run economic development,”GGDC Research Memorandum, 2018, 174.
Bruno, Valentina and Hyun Song Shin, “Capital flows and the risk-taking channel ofmonetary policy,” Journal of Monetary Economics, 2015, 71, 119–132.
, Se-Jik Kim, and Hyun Song Shin, “Exchange Rates and the Working Capital Channelof Trade Fluctuations,” AEA Papers and Proceedings, 2018, 108, 531–36.
Caballero, Ricardo J., Emmanuel Farhi, and Pierre-Olivier Gourinchas, “Financial Crash,Commodity Prices and Global Imbalances,” Brookings Papers on Economic Activity,2008, 2, 1–55.
, , and , “Global Imbalances and Currency Wars at the ZLB.,” March 2016. NBERWorking Paper No. 21670.
, , and , “Rents, technical change, and risk premia accounting for secular trends ininterest rates, returns on capital, earning yields, and factor shares,” American EconomicReview, 2017, 107 (5), 614–20.
, , and , “The Safe Assets Shortage Conundrum,” Journal of Economic Perspectives,2017, 31 (3), 29–46.
Calvo, Guillermo A. and Carmen M. Reinhart, “Fear of Floating,” The Quarterly Journalof Economics, May 2002, 117 (2), 379–408.
35
Carstens, Agustín and Hyun Song Shin, “Emerging Markets Aren’t Out of the WoodsYet,” Foreign Affairs, 2019.
Coeuré, Benoit, “Asserting Europe’s leadership,” Panel remarks, Les rencontreséconomiques d’Aix-en-Provence, July 2018.
Cooper, Richard N, “The Future of the Dollar,” Foreign Policy, 1973, (11), 3–32.
Du, Wenxin and Jesse Schreger, “Sovereign Risk, Currency Risk, and Corporate BalanceSheets,” Harvard Business School Working Papers 17-024, Harvard Business School2016.
Egorov, Konstantin and Dmitry Mukhin, “Optimal Monetary Policy under Dollar Pric-ing,” March 2019. mimeo Yale University.
Eichengreen, Barry and Guangtao Xia, “China and the SDR: Financial Liberalizationthrough the Back Door,” Quarterly Journal of Finance, 2019.
and Masahiro Kawai, Renminbi internationalization: Achievements, prospects, andchallenges, Brookings Institution Press, 2015.
and Ricardo Hausmann, “Exchange Rates and Financial Fragility,” Federal ReserveBank of Kansas City Economic Policy Symposium, 1999.
, Arnaud J Mehl, and Livia Chitu, “Mars or Mercury? The Geopolitics of InternationalCurrency Choice,” Working Paper 24145, National Bureau of Economic Research De-cember 2017.
Eren, Egemen and Semyon Malamud, “Dominant currency debt,” November 2018. CEPRDiscussion Paper No. DP13391.
European Central Bank, “The international role of the euro,” Interim report, June 2018.
Farhi, Emmanuel and François Gourio, “Accounting for macro-finance trends: Marketpower, intangibles, and risk premia,” February 2019. NBER Working Paper No. 2582.
and Matteo Maggiori, “A Model of the International Monetary System,” QuarterlyJournal of Economics, 2018, 133 (1), 295–355.
, Pierre Olivier Gourinchas, and Hélène Rey, Reforming the International MonetarySystem, CEPR eBook, 2011.
Fornaro, Luca and Federica Romei, “The paradox of global thrift,” December 2018. Bancode Espana Working Paper No. 1845.
Gali, Jordi and Tommaso Monacelli, “Monetary policy and exchange rate volatility in asmall open economy,” The Review of Economic Studies, 2005, 72 (3), 707–734.
Goldberg, Linda and Cédric Tille, “Macroeconomic interdependence and the internationalrole of the dollar,” Journal of Monetary Economics, 2009, 56 (7), 990–1003.
36

Gopinath, Gita, The International Price System, Jackson Hole Symposium Proceedings,2016.
and Jeremy C. Stein, “Banking, Trade, and the Making of a Dominant Currency,”Technical Report, National Bureau of Economic Research April 2018. NBER WorkingPaper, No. w24485.
and , “Trade Invoicing, Bank Funding, and Central Bank Reserve Holdings,” AEAPapers and Proceedings, 2018, 108, 542–46.
, Emine Boz, Camila Casas, Federico Diez, Pierre-Olivier Gourinchas, and MikkelPlagborg-Møller, “Dominant Currency Paradigm,” Dec 2018. NBER Working PaperNo. 22943.
Gorton, Gary and Andrew Metrick, “Securitized banking and the run on repo,” Journalof Financial economics, 2012, 104 (3), 425–451.
Gourinchas, Pierre-Olivier, The Fundamental Structure of the International MonetarySystem, hoover press ed., Rules for International Monetary Stability: Past, Presentand Future, 2017.
, “Monetary Policy Transmission in Emerging Markets: An Application to Chile,” inE. Pastén E. Mendoza and D. Saravia, eds., Monetary Policy and Global Spillovers:Mechanisms, Effects and Policy Measures, Vol. 25, Santiago: Banco Central de Chile,2018, chapter 8, pp. 279–324.
, Hélène Rey, and Maxime Sauzet, “The International Monetary and Financial System,”Annual Review of Economics, Forthcoming 2019.
, Hélène Rey, and Nicolas Govillot, “Exorbitant Privilege and Exorbitant Duty,” 2017.Mimeo UC Berkeley.
Gudmundsson, Már, “Global financial integration and central bank policies in small, openeconomies,” The Singapore Economic Review, 2017, 62 (01), 135–146.
Ilzetzki, Ethan, Carmen M Reinhart, and Kenneth S Rogoff, “The Country Chronologiesto Exchange Rate Arrangements into the 21st Century: will the anchor currency hold?,”Technical Report 23135, National Bureau of Economic Research February 2017.
, Carmen Reinhart, and Kenneth Rogoff, “Exchange Arrangements Entering the 21stCentury: Which Anchor Will Hold?,” Quarterly Journal of Economics, 2019, 134 (2),599–646.
Ito, Hiro and Menzie D. Chinn, “The rise of the’redback’and the people’s republic ofchina’s capital account liberalization: An empirical analysis of the determinants ofinvoicing currencies,” in B. Eichengreen and M. Kawai, eds., Renminbi International-ization: Achievements, Prospects, and Challenges, April 2015.
Kalemli-Özcan, Şebnem, Se-Jik Kim, Hyun Song Shin, Bent E Sørensen, and SevcanYesiltas, “Financial shocks in production chains,” 2014. mimeo, University of Maryland.
37
Kamps, Annette, “The Euro as invoicing currency in international trade,” ECB WorkingPaper Series August 2006.
Kenen, Peter B., “The Role of the Dollar as an International Currency,” Occasional Paper,1983, 13.
Keohane, Robert O., The theory of hegemonic stability and changes in internationaleconomic regimes, 1967-1977, Center for International and Strategic Affairs, Universityof California, 1980.
Kindleberger, Charles P, The world in depression, 1929-1939, Univ of California Press,1973.
, “Dominance and leadership in the international economy: Exploitation, public goods,and free rides,” International studies quarterly, 1981, 25 (2), 242–254.
Lai, Edwin L-C and Xiangrong Yu, “Invoicing currency in international trade: An empir-ical investigation and some implications for the renminbi,” The world economy, 2015,38 (1), 193–229.
Maggiori, Matteo, Brent Neiman, and Jesse Schreger, “International Currencies and Cap-ital Allocation,” 2018. Working Paper, Harvard University.
McKinnon, Ronald, A new tripartite monetary agreement or a limping dollar standard?number 106, International Finance Section, Princeton University, 1974.
, Money in International Exchange: The Convertible Currency System, Oxford: OxfordUniversity Press., 1979.
Miranda-Agrippino, Silvia and Hélène Rey, “US Monetary Policy and the Global FinancialCycle,” Technical Report, NBER Working Paper No. 21722, Issued in November 2015,Revised in February 2018 2018.
Mukhin, Dmitry, “An equilibrium model of the International Price System,” 2017. mimeoPrinceton University.
Mundell, Robert A, “The monetary consequences of Jacques Rueff,” Journal of Business,July 1973, 46 (3), 384–395.
Na, Seunghoon, “The Monetary Policy Dilemma of Emerging Economies,” April 2019.mimeo Purdue University.
Rey, Hélène, “Dilemma not Trilemma: The Global Financial Cycle and Monetary PolicyIndependence,” Federal Reserve Bank of Kansas City Economic Policy Symposium,2013, 2013.
Rueff, Jacques, Le péché monétaire de l’Occident, Paris: Plon, 1971.
Salomao, Juliana and Liliana Varela, “Exchange Rate Exposure and Firm Dynamics,”January 2018. C.E.P.R. Discussion Papers No 12654.
38

Shin, Hyun Song, “The second phase of global liquidity and its impact on emergingeconomies,” in “Volatile capital flows in Korea,” Springer, 2014, pp. 247–257.
Stavrakeva, Vania and Jenny Tang, “The dollar during the global recession: US monetarypolicy and the exorbitant duty,” 2018.
Triffin, Robert, Gold and the Dollar Crisis; the future of convertibility, New Haven,Connecticut: Yale University Press, 1961.
Whitman, Marina VN, “The current and future role of the dollar: How much symmetry?,”Brookings Papers on Economic Activity, 1974, 3, 539–591.
39