The Doha Development Round and its Poverty Implications ... · The Doha Development Round and its...
38
1 The Doha Development Round and its Poverty Implications for a WTO Accession Candidate: The Case of Vietnam Author Daude, Sabine University of Hohenheim Institute of Agricultural Economics and Social Sciences (490A) 70593 Stuttgart Germany [email protected] 1 Background Within the liberalization efforts during the last years the World Trade Organization (WTO) played an important catalytic role by establishing a multilateral trading system where up to January 2004 148 member countries were accepted by the Ministerial Conference. However, during the present Negotiation Round, also called the Doha Development Round, some drawbacks occurred and scheduled deadlines could not be met, especially true for the agricultural sector. In preparation of the Ministerial Meeting in Cancún, Mexico, in September 2003, the WTO suggested further liberalization for the agricultural sector in the Harbinson Paper to break up the deadlock in the negotiations. This was meant to lay a ground for further discussions in the sensible area of agricultural liberalization. Although the participating countries could not agree during the Ministerial Conference in Cancún on further commitments to liberalize the multilateral trading system, efforts are still under way to bring the Doha Development Round to a successful end with further agreements to be reached. Vietnam is currently not a WTO member but is in the process of accession negotiations. The desire to join the WTO is one step within the opening of the Vietnamese economy during the last years. The country started a reform process (Doi Moi) from a centrally planned economy to a market-oriented economy in 1986. During this transition Vietnam experienced extraordinary economic growth mainly based on trade and it advanced from a net rice importer to the second biggest rice exporter worldwide. After the first years of reform the process lost some of its momentum due to the Asian crisis but also to the challenges to implement domestic reforms in Vietnam. The objective of the Vietnamese Government is to accede to the WTO within the Doha Round by 2005. The incentive to fully join the trade system of the WTO will largely be driven by the possible gains that can be expected from the accession besides the wish to promote domestic reforms. The Working Party on the accession of Vietnam was established in January 1995. In January 2002 an initial offer on tariffs was brought into the negotiation process which was then further elaborated and discussed in bilateral market access contacts. During the years 2002 and 2003 these bilateral market access negotiations between member countries and Vietnam continued. The last session of the Working Party took place in December 2003 and three sessions are planned for 2004 to reach the goal of accession in 2005. The discussion about trade and its role in the development process is not new; it can be traced back over decades. The last years put more emphasis not only on development but on the explicit eradication of poverty as a precondition for further development within a country. Theories of the effects of trade on the poor and their poverty situation emerged and attempts
Transcript of The Doha Development Round and its Poverty Implications ... · The Doha Development Round and its...

1
The Doha Development Round and its Poverty Implications for a WTO Accession Candidate: The Case of Vietnam
Author Daude, Sabine University of Hohenheim Institute of Agricultural Economics and Social Sciences (490A) 70593 Stuttgart Germany [email protected]
1 Background Within the liberalization efforts during the last years the World Trade Organization (WTO) played an important catalytic role by establishing a multilateral trading system where up to January 2004 148 member countries were accepted by the Ministerial Conference. However, during the present Negotiation Round, also called the Doha Development Round, some drawbacks occurred and scheduled deadlines could not be met, especially true for the agricultural sector. In preparation of the Ministerial Meeting in Cancún, Mexico, in September 2003, the WTO suggested further liberalization for the agricultural sector in the Harbinson Paper to break up the deadlock in the negotiations. This was meant to lay a ground for further discussions in the sensible area of agricultural liberalization. Although the participating countries could not agree during the Ministerial Conference in Cancún on further commitments to liberalize the multilateral trading system, efforts are still under way to bring the Doha Development Round to a successful end with further agreements to be reached. Vietnam is currently not a WTO member but is in the process of accession negotiations. The desire to join the WTO is one step within the opening of the Vietnamese economy during the last years. The country started a reform process (Doi Moi) from a centrally planned economy to a market-oriented economy in 1986. During this transition Vietnam experienced extraordinary economic growth mainly based on trade and it advanced from a net rice importer to the second biggest rice exporter worldwide. After the first years of reform the process lost some of its momentum due to the Asian crisis but also to the challenges to implement domestic reforms in Vietnam. The objective of the Vietnamese Government is to accede to the WTO within the Doha Round by 2005. The incentive to fully join the trade system of the WTO will largely be driven by the possible gains that can be expected from the accession besides the wish to promote domestic reforms. The Working Party on the accession of Vietnam was established in January 1995. In January 2002 an initial offer on tariffs was brought into the negotiation process which was then further elaborated and discussed in bilateral market access contacts. During the years 2002 and 2003 these bilateral market access negotiations between member countries and Vietnam continued. The last session of the Working Party took place in December 2003 and three sessions are planned for 2004 to reach the goal of accession in 2005. The discussion about trade and its role in the development process is not new; it can be traced back over decades. The last years put more emphasis not only on development but on the explicit eradication of poverty as a precondition for further development within a country. Theories of the effects of trade on the poor and their poverty situation emerged and attempts

2
to quantify the poverty impacts of trade liberalization became prominent. The challenge is to trace the effects from international trade liberalization to the individual household level where poverty occurs. After stating the objective of the study a methodology is presented that tries to link the international trade level with the household level to quantify poverty effects on households from trade liberalization. Results are presented and discussed before the paper ends with some conclusions and policy recommendations.
2 Objective of the study The objective of the paper is to analyze implications of trade liberalization, as discussed within the Doha Round on Vietnam’s agricultural sector and particularly rural households in mountainous regions of Northern Vietnam. The paper will examine how poverty rates for households in Northern Vietnam are affected when prices change due to agricultural trade liberalization.
3 Methodology and data In order to investigate the implications of an accession of Vietnam to the WTO and further multilateral agricultural liberalization a multi-country general equilibrium model has been used. The Global Trade Analysis Model (GTAP) with its focus on worldwide trade relations seems to be most suitable for this purpose. Other research on international trade liberalization has demonstrated that GTAP offers an appropriate framework for such questions. Closely related to the question of a suitable modelling framework is the availability of data for Vietnam. The used GTAP data base includes a social accounting matrix (SAM) of Vietnam thus incorporating the Vietnamese economy with all its factor and activity flows into the analytical framework. The analysis of poverty changes has two sides: the consumption side and the earnings side. This aspect shall be explicitly taken into consideration in the poverty analysis for Vietnam and, therefore, price changes for consumption commodities as well as for production factors for Vietnam shall be incorporated. This information can be derived from the results of the GTAP simulation. Given the aim of the study to examine the effects of multilateral trade liberalization on rural households in mountainous regions in Northern Vietnam, those households are subjected to the developments in the international trading environment but they are not influencing the international arena themselves. Therefore, an approach that incorporates feedback from the households to the international system is not required. Thus, a two-step micro-macro synthesis approach is chosen combining the GTAP general equilibrium model with a post-simulation analysis. The term micro-macro synthesis is a recent term in the literature examining the relationship between trade and poverty. Used in this context it means the “sequential linking of a model based on micro-level data with a model based primarily on macro-level data” (Reimer, Jeffrey J., 2002). Following the two steps in the micro-macro synthesis the next two subchapters are organized accordingly: The first one discusses the trade policy model used and the second one explains in detail a post-simulation analysis based on household data.
3
3.1 Micro-macro synthesis – first step: general equilibrium simulation with the GTAP Model This part will first describe the model theory before elaborating on the political content of the Harbinson paper and its implementation.
3.1.1 The GTAP model Within a general equilibrium modelling framework all sectors of an economy and their linkages are included as opposed to a partial equilibrium framework where one or only a few sectors are incorporated. Partial equilibrium models are typically more disaggregated for the chosen sectors, and these models are more suited to examine implications of sector specific policies. However, for the analysis of policies which affect all sectors and where interdependency effects are expected between sectors a general equilibrium framework is better suited than a partial equilibrium model (Brockmeier, Martina, 1999). Liberalization within the multilateral trading system is a policy where changes in all sectors and interrelationships between them are to be expected and, therefore, a computable general equilibrium (CGE) model seems to be suitable for the first step in the sequential micro-macro approach. The Global Trade Analysis Project (GTAP) was founded in 1992 at Purdue University in the USA. One of its main effects has been to lower entry costs for researchers who want to do quantitative analysis of international issues on an economy-wide level (Hertel, Thomas W., 1997). The GTAP modelling framework employs a standard CGE model based on the neoclassical theory of firm and household behaviour assuming perfect competition, rational and utility optimizing behaviour. It has a global coverage and includes all bilateral trade flows between all regions to examine international trade issues. The standard model is a comparative static model which means that after introducing an exogenous shock like a policy change the model works out a new equilibrium in all markets and determines new values for the endogenous variables. The model and its characteristics are extensively documented in the literature (e.g. Hertel, Thomas W. edit., 1997; Brockmeier, Martina, 1996). Using the GTAP model for analyzing trade issues of Vietnam has already been suggested by Anderson (Anderson, Kym, 1999). However, at that time the Vietnamese data had not been included yet into the database; now data are available and incorporated into the GTAP framework. All policy scenarios are implemented in the GTAP standard modelling framework via so-called “price wedges” (Brockmeier, Martina and Salamon, Petra, 2003). These price wedges originate in prices on different market levels which are different due to taxes and subsidies. These tax instruments drive a wedge between the prices of the producer, trader and consumer. Implementing for example a reduction of export subsidies in the model is done by changing the price relationship between the market price and the export price. A full documentation of price linkage equations can be found in Hertel, Thomas W. and Tsigas, Marinos E., 1997. If all markets in the multi-region model are balanced (market-clearing condition), all firms earn zero profit (zero-profit condition) and all households are on their budget constraint line, then global savings must equal global investment and with this Walras’ Law is satisfied. It implies that equilibrium is obtained for a system of n equations if n-1 equations are solved. The default solution method for the GTAP model is Gragg’s method where the model is solved several times with an increasingly finer grid. An extrapolated solution is calculated based on these results (Hertel, Thomas W. and Tsigas, Marinos E., 1997). Through the interrelationships between demand and supply, prices and quantities are calculated which

4
assure a clearing of all commodity and factor markets and thus bring the whole model to equilibrium (Francois, Joseph, Meijl, Hans van, and Tongeren, Frank van, 2003). The resulting price changes for commodities as well as for production factors are used in the post-simulation analysis.
3.1.2 Implementation of agricultural trade liberalization in the GTAP model Following the mandate from the Doha Ministerial Declaration and in preparation of the WTO Ministerial Meeting in Cancún, Mexico, the agricultural negotiations’ chairperson, Stuart Harbinson submitted a proposal for further liberalization in the agricultural sector in February 2003. Officially called “Negotiations on Agriculture: First Draft of Modalities for the Further Commitments” the paper tried to bridge the immense gaps between parties in the negotiation process. A slightly revised version of this so-called Harbinson paper (March 2003) is the basis for the following simulations. The three classical negotiation fields in the WTO are the issues of market access, export subsidies and domestic support. For market access Harbinson proposes to reduce tariffs in equal annual instalments based on bound tariff rates. Tariffs are divided into three (for industrialized countries) or four bands (for developing countries) and are reduced differently according to the band. For industrialized countries the period foreseen is five years and for developing countries ten years. Harbinson tries to harmonize the tariff structure by adopting a progressive approach where higher tariff cuts are needed for higher tariff rates. For export subsidies the draft paper foresees to reduce export subsidies to zero. For at least 50% of export subsidies this objective should be reached within 5 years, for the remaining 50% of export subsidies the objective should be reached within 9 years. The approach allows countries to backload export subsidies for especially sensitive products until the ninth year of the agreement. For developing countries the phasing-out periods are 10 and 13 years. In the area of domestic support the Harbinson paper maintains the green box subsidies and even enhances its scope. For the blue box subsidies which include direct payments of the European Union, Harbinson proposes to bound them at the 1999/2002 level and then reduce them by 50% or alternatively include them in the current total Aggregate Measurement of Support (AMS) and thus merge blue box and amber box subsidies. The AMS measures all trade- and production distorting subsidies which are not exempted in the green and blue box measures. For the amber box subsidies (measured with the AMS) industrialized countries should reduce them by 60% over a period of five years in equal annual instalments. Developing countries would be requested to reduce the AMS subsidies by 40% within 10 years. As the Harbinson paper distinguishes between commitments for developing countries and industrialized countries it is necessary to define subsets where the corresponding country groups are assigned to. When aggregating the regions from the data set this has to be accounted for by putting only industrialized or only developing countries together in one group. The Harbinson paper makes suggestion to liberalize agricultural markets in the three areas of market access, export subsidies and domestic support as described above. The latter is mainly characterized by the direct payments of the European Union to its farmers. Incorporating these payments and its reductions into the model requires the modelling framework to be extended by the EU budget. This complex undertaking is not tackled here because the focus

5
of the research does not lie on the budgetary effects of the Harbinson paper on the European Union. Following the Harbinson paper in the area of export subsidies a 100% elimination is simulated. For market access commitments increases of quota volumes were not incorporated into the modelling framework. The import tax reductions are simulated according to the proposed bands. For industrialized countries the following market access commitments apply: If the percentage value of an import tax is higher than 90%, then the actual rate is reduced by 60%, if the tax value is between 15% and 90% the reduction is of 50%, and if the value is lower than 15% it is reduced by 40%. For developing countries import taxes above 120% are due to a 40% reduction; import taxes between 120% and 60% are reduced by 35%, import taxes between 20% and 60% are reduced by 30% and finally, import taxes below 20% are reduced by 25%. Two scenarios are implemented. Both simulate further liberalization commitments during the Doha Round proposed in the Harbinson paper for the agricultural sector. The first scenario assumes that Vietnam does not accede to the WTO within the Doha Round whereas the second scenario assumes Vietnam’s accession to the WTO. Scenario 1: Harbinson agricultural liberalization and Vietnam IS NOT member of the WTO. Scenario 2: Harbinson agricultural liberalization and Vietnam IS member of the WTO.
3.2 Micro-macro synthesis – second step: post-simulation analysis Having obtained the price changes from trade liberalization scenarios from the GTAP general equilibrium model the post-simulation analysis aims at showing the implications at the household level. Households are affected by price changes in the commodity and the factor markets because adjustments are transmitted through these two channels (Reimer, Jeffrey J., 2002). The net income effect can thus be obtained as follows: Net income effect = consumption effect + earnings effect The aim of the post-simulation analysis is to match the GTAP price changes with the household data in order to obtain the net income effect and the implications for poverty. The post-simulation analysis as done by Friedman includes the following steps (Friedman, Jed, 2000):
1. Matching the simulated price changes to household consumption 2. Measuring the level-of-living 3. Measuring changes in the cost-of-living (compensating variation) 4. Measuring changes in household earnings 5. Estimating the net effects of trade liberalization
The following description of the methodological approach is based on these five steps combined with a similar methodology presented by Neil McCulloch (McCulloch, Neil, 2003).
3.2.1 Matching the simulated price changes to household consumption From the GTAP results commodity price changes and price changes for different production factors are taken. The consumption information is derived from household surveys. Special attention is given to the consumption of self-produced goods. Subsistence production can be valued with local market prices or with a proxy – the unit value. The unit value can be obtained by dividing total household expenditures for a good by the total bought quantity

6
consumed. This measure is only a proxy in the sense that it does not account for quality differences of the same product. The value of consumption of the households for different goods is calculated following the commodity aggregates of the global equilibrium framework. Then mean expenditure shares for different commodities and different household categories are derived. Household categories can be based on regional characteristics like rural and urban or on income levels, like poor and non-poor or rankings of wealth. The expenditure shares for consumption goods reveal the importance that price changes for these goods have: The bigger the expenditure share the bigger the influence from a price change of this product.
3.2.2 Measuring the level-of-living Friedman suggests two different but complementary ways to measure the level-of-living (Friedman, Jed, 2000): The first one measures household expenditures continuously; it is the most commonly used approach. Expenditures are assumed to reflect household utility and are preferred over income to measure actual household welfare. Expenditure measures reflect households ability to smooth consumption in the case of income shocks. The second way is to use a binary index poor/non-poor. The choice to categorize a household as poor or non-poor depends crucially on the definition of a poverty line: if a household falls under this line he is deemed to be poor. The choice of the poverty line obviously highly influences the extent of poverty. Based on household data the extent of poverty, i.e. number of households falling under a defined poverty line, can be determined.
3.2.3 Measuring changes in the cost-of-living (compensating variation) Measuring changes in the cost-of-living is equivalent to measure changes in welfare. McCulloch calculates the consumption effect by multiplying the price changes with the consumption expenditure shares that are spent for the different consumption goods. The percentage effect on the cost-of-living can be written as (adapted from McCulloch, Neil, 2003):
∑
∆=
∆cj
cjc
j p
pCS
CLCL
(1)
with CL : cost-of-living c
jCS : consumption expenditure share of consumption good j
cjp : price of consumption good j
Equation (1) shows that the change in the cost-of-living for a household depends on the differences in relative prices among the bundle of consumed goods as well as on the consumption expenditure budget share spent on each good. The approach does not account for substitution effects between products which may occur with large price changes and over a longer period of time. Incorporating this would need initial price levels to calculate cross-price elasticities. As price changes are not expected to be too big a first-order approximation seems to be appropriate to look at short-term effects. Friedman suggests an alternative measurement which accounts for housing that is owned by the household and for consumption of self-produced agricultural goods. In the case of decreasing prices for housing or agricultural goods households with own homes or with self-consumption are relatively worse off compared to households that rent their homes and buy their food (Friedman, Jed, 2000). Therefore, the imputed values for own-housing and self-

7
produced goods are treated as negative expenditures to calculate the adjusted measurement. The above formula (1) can be extended as follows:
∑∑
∆−
∆=
∆cjs
cjsc
jscjb
cjbc
jb p
pCS
p
pCS
CLCL (2)
with cjbCS : consumption expenditure share of consumption good j bought
cjbp : price of consumption good j bought
cjsCS : consumption expenditure share of consumption good j self-produced
cjsp : price of consumption good j self-produced
In the case of decreasing prices both terms become negative and the second term is then added and thus increases the cost-of-living of self-producing households relative to the rest. In the case of increasing prices households that consume their own-produced goods are relatively better of. In this case the two terms are positive and the second term is then deducted and thus reduces the cost-of-living of self-producing households. The change in the cost-of-living can be regarded as compensation variation, i.e. this amount of money would be necessary to pay to the households to keep them on their initial utility after the price changes. Investigating the compensation variation over income differences can show if poor households are more affected by trade liberalization price changes than the wealthier households. So far, this analysis only incorporates the consumption side. With the next steps the earning side will also be included in the analysis.
3.2.4 Measuring changes in household earnings From the GTAP simulations changes in returns to production factors can be derived. These changes have to be brought together with the available household data on earnings generation. From the household data different sources of earnings can be derived like earnings from wages and salaries, earnings from agricultural production, earnings from non-agricultural own business and other minor sources. The share of each category shows the relative importance for total household earnings and determines the “nature of the household” concerning the earning side (McCulloch, Neil, 2003). For matching the GTAP production factors with household earning information Friedman suggests the following assumptions (Friedman, Jed, 2000): For the agricultural earning the shares of different crops contributing to total agricultural earnings are calculated and then multiplied with the respective producer price changes for the different crops to get the total change in agricultural earnings. For the change of non-agricultural own business earning the price change of the trade and transport sector in GTAP is assumed. The educational level of the household head determines if the skilled or unskilled labour is applied for the wage changes. The household earning change can thus be calculated as (adapted from Friedman, Jed, 2000, McCulloch, Neil, 2003):
∑
∆=
∆hi
hih
i pp
ESEARNEARN (3)
with EARN : earning h
iES : earning share of production factor i for household h
hip : price of production factor i for household h
8
With the different assumptions and the above equation (3) it is possible to calculate the earnings effect of the simulated agricultural trade liberalization via the price changes of the production factors and the commodity price changes.
3.2.5 Estimating the net effects of trade liberalization When both the consumption and the earnings effects are determined the net effect of trade liberalization is easily obtained by subtracting the consumption effect from the earnings effect to get the net income effect for each household (Friedman, Jed, 2000). It has to be kept in mind that the results obtained are “worst case” scenarios because no quantitative response is assumed neither through substitution effects in consumption nor through earning generation changes (McCulloch, Neil, 2003). The underlying assumption is that in the short run households are not adjusting to price changes; only in the long run are adjustments taking place. With the focus on poverty implications it is useful to consider these short run effects because they represent shocks where households have to cope with. Any consumption substitution or changes in earning generation reflect long run adjustments. For poverty alleviating policy measures it is important to know the “worst case” to help the poor to manage this transition process. With the net income effects calculated it is possible to determine the new extent of poverty and compare it with the original poverty rates calculated before.
3.3 Data The database used in the macro model is the GTAP dataset, version 6.1 with reference year 2001 (Dimaranan, B. and McDougall, Robert, 2003). It consists of 85 countries and regions, 57 economic sectors and 5 production factors (skilled labour, unskilled labour, land, capital and natural resources). The regional data are derived from national social accounting matrices (SAMs) which are linked by matrices of bilateral trade flows. These detailed input-output, trade and final demand data are supplemented with the latest transport data and tariff information for merchandise trade and agricultural protection to characterize inter-sectoral linkages within regions as well as economic linkages among regions. An aggregation of regions and sectors which follows the needs of the research question is necessary. The objectives of the research as well as political and trade-related considerations are taken into account when performing the aggregation of the data base. This leads to an aggregation of ten regions and twelve economic sectors which is shown in Table 1: Aggregation of regions and sectors (12x10)”. The EU15, CEEC, USA, Japan, Australia & New Zealand, and the rest of industrialized countries (RIC) are defined as industrialized countries and the remaining regions are sub summarized under developing countries. Household data are from 251 Vietnamese households from a survey that was done in two subprojects (F1/F3) of a research project of Hohenheim University called “The Uplands Program – Research for Sustainable Land Use and Rural Development in Mountainous Regions of Southeast Asia”(Dufhues, Thomas and Wirth, Thomas, 2002). This program is an interdisciplinary Thai-Vietnamese-German Collaborative Research Program which examines with its second phase running until June 2006. Households are located in several villages in Son La province (district Yen Chau) and Bac Kan province (district Ba Be) in the mountainous areas of Northern Vietnam which are considered to give a good picture of the situation of poor rural farmers within the country. Both research areas are considered among the group of the poorest districts of the country due to the geographical conditions and the marginalization of ethnic minorities within the population. The survey was done in two rounds from November 2001 until April 2002 and relates to the time period 2001. Questions

9
did not only relate to consumption patterns and earning sources but also to land use, finance, and credit.
4 Results and their discussion Looking at simulation results it should be kept in mind that the simulations are based on a data base that incorporates pre-existing distortions and these interact with the policy shocks and produce second-best effects. Another important point is to interpret numbers with an appropriate attitude: certain numbers should not be taken literally, but they suggest certain directions, e.g. big returns to simulated policies (McCulloch, Neil, Winters, Alan L., and Cirera, Xavier, 2001). The first subchapter gives the results for the macro-simulation before proceeding to the presentation of income and poverty results for the households of the survey following the different steps of the post-simulation analysis in the second subchapter.
4.1 Production, price, trade and welfare effects of macro-simulation The results of the GTAP simulations are presented in four broad categories, namely production, price, trade, and welfare effects. The focus is to analyze the effects for Vietnam in comparing the two simulations for Vietnam being a member of the WTO, or not.
4.1.1 Production effects Table 2 gives an overview of the production effects of the two simulations and the difference between them. Output of most agricultural sectors is negatively affected by the implementation of the Harbinson paper if Vietnam is not member of the WTO as is shown by results from simulation 1. This is especially pronounced in the “other crops sector” (OCR) comprising mainly coffee, tea and spices with a decrease of over 2% in production. The “other processed food sector” (OPRF) including products like oils, dairy products and beverages, decreases its production by nearly 5%. The “animal production sector” (AnimP) stays unaffected and the “meat sector” (MTP) is the only agricultural sector that experiences a production increase of 0.5%. The manufacturing sectors enlarge their production under simulation 1 with a production increase of nearly 3% in the “textile and clothing manufacturing sector” and an increase of nearly 2% in the “other manufacturing sector”. The Vietnamese “service sector” is not affected. When Vietnam accedes to the WTO (simulation 2) agricultural output is positively affected by the Harbinson paper except for the “animal production sector” (-0.5%) and the “other processed food sector” (-1.9%). For the other agricultural sectors production increases up to 2.4%. The manufacturing sectors experience output declines in the magnitude of 1 to 2%. The service sector again shows nearly no output changes. Vietnam’s accession to the WTO affects the production pattern of the country and adjustments in production structure can be observed. Looking at the differences between the simulations it becomes obvious that production effects on Vietnam’s agricultural sectors are positive when acceding to the WTO, except for the animal production and the meat sector. Although the difference between the two simulations in the meat sector is negative, Vietnam increases its production slightly. For the sector of other processed food the picture is the reverse. Although the accession of Vietnam to the WTO has a positive production effect on the sector this can not compensate for the negative effects caused by the Harbinson paper leaving Vietnam with a shrinking production in this sector. When Vietnam accedes to the WTO production in the manufacturing sectors decreases in the magnitude of -3% to -4.5%. These strong declines can not be offset by the positive effects of the agricultural liberalization and lead to a net shrinking production in these sectors.

10
Closely related to output changes is the movement of production factors between sectors. Under a poverty and income focus the changes for the unskilled labour force is of special relevance. Table 3 summarizes the changes for unskilled labour demand. When Vietnam is not member of the WTO and the Harbinson paper is implemented within the Doha Round, the demand for unskilled labour in the agricultural sectors goes down in line with the above described decreases in output. The decline is especially pronounced in the OCR and the OPRF sectors. A slight increase in labour demand can be observed for the meat sector, but labour not demanded in the agricultural sector moves into the manufacturing sector. In the case of Vietnam’s accession to the WTO the situation for the unskilled labour force develops in the opposite direction. Demand for labour in the agricultural sectors increases and labour moves out of the manufacturing sectors into the agricultural sectors. An exception is the sector for other processed food that releases also workers to move into the other agricultural sectors that are further down in the value-added chain. As labour is assumed to be fully flexible across sectors the wage rate moves to the same level for all sectors. For simulation 1 the wage for unskilled labour in Vietnam goes down by 0.8% whereas for simulation 2 the decline is reduced to -0.1%, i.e. the remuneration stays nearly unchanged. With an accession to the WTO the unskilled labour force profits in the sense that wages do not go down as strong as without accession. For the rural population the accession is beneficial in the way that more labour is demanded in the agricultural sectors whereas the urban poor are harmed by the decrease in unskilled labour demand in the manufacturing sectors with an accession to the WTO.
4.1.2 Price effects When the multilateral trading system continues liberalization in the agricultural sector while Vietnam is still no member of the WTO this result in declining prices in Vietnam over all sectors as can be seen in Table 4. The magnitude in the agricultural sectors is greater (-1% to -3%), whereas the manufacturing and service sector is only affected by price declines of under 1%. The results of simulation 2, when Vietnam is a member of the WTO, reveal price increases over all sectors. The strongest price increase happens in the primary production sector (+3.5%) whereas the weakest increase for the agricultural sector can be observed for the OPRF sector with an increase of less than half a percent. Also the manufacturing and service sectors experience only small price increases. The price effects on the labor market are depicted in Table 5. In the case that Vietnam is not in the WTO and agricultural trade liberalization is pursued wages for Vietnamese unskilled and skilled labour go down equally by -0.8%. The downward trend holds even when Vietnam becomes a member of the WTO but is then much smaller. Wages for unskilled labor nearly stay unchanged with a slight decline of -0.1% and skilled labor suffers from a wage decrease of -0.3%.
4.1.3 Trade effects Developments in export and import can be examined separately or the two can be taken together by looking at the trade balance (exports minus imports). Changes in trade are displayed in million USD or in percentage changes. The effects on the trade performance of Vietnam following the two simulations can be examined under various perspectives. The first focus will be on the development of total

11
exports before taking a closer look at sectoral trade balances. Table 6 summarizes the different results of total export values of Vietnam for simulation 1 with Vietnam not being a member of the WTO and simulation 2 when Vietnam’s accession is completed. In the first simulation exports of Vietnam go down whereas in the case of membership in the WTO and further agricultural liberalization the country can expand its exports by 137 million USD which corresponds to a considerable increase of 1.2%. Comparing the two simulations the increase in the trade figures becomes even clearer: through the accession to the WTO Vietnam increases its export values by over 200 million USD compared to the situation where Vietnam stays outside the multilateral trading system that advances with agricultural liberalization. When looking not only at export values but also at import values and analysing the effects on the trade balance results emerge that are shown in Table 7. The table does not only show the total effect but also the splitting up between the different sectors of the Vietnamese economy. Although export values decreased in Vietnam for simulation 1 the trade balance is still positive with 14 million USD, i.e. imports decreased more than exports thus leading to a positive trade balance effect. When Vietnam becomes a member of the WTO the positive trade balance effect increases up to 38 million USD. Comparing this figure to the increase in exports shown in Table 6 it becomes obvious that Vietnam increases not only its exports but also its imports because otherwise a bigger trade balance surplus would have been realized. The total figures are a first approximation to get an idea of the trade balance effect but it is interesting to look further at the sectoral shares that produce these changes. Trade effects in the different sectors are quite heterogeneous and positive and negative effects cancel each other out in the net total (Table 7). The total effect therefore does only incompletely reflect the changes within the sectors. In simulation 1 negative trade balance effects occur in the agricultural sector for other crops, primary products and especially other processed food with a decrease of -144 million USD. The other agricultural sectors are only slightly positive affected. Strong positive trade balance effects stem from the manufacturing and service sectors with the two manufacturing sectors contributing over 100 million USD each to the positive trade balance and the service sector nearly 40 million USD. When Vietnam accedes to the WTO (simulation 2) changes in the total trade balance compared to simulation 1 amount to 24 million USD. This net increase, however, is only small compared to the figures within each sector. The strongest effect occurs in the sector of primary products with a positive trade balance of 150 million USD compared to -72 million USD in simulation 1. Smaller increases can be observed in all other agricultural sectors, worth mentioning the processed rice sector obtaining a share of 32 million USD in the trade balance and the vegetable and fruit sector with a share of 21 million USD.
4.1.4 Welfare effects Welfare indicators can be seen as summary of policy changes. They incorporate consumption, production, price and trade changes. The GTAP model uses the concept of equivalent variation to measure welfare effects. The variable “equivalent variation” is a summary index within the model to measure overall welfare implications for the national economy. The model computes a money equivalent of the change in utility and thus summarizes the welfare change resulting from a policy shock in dollar values. Welfare effects in Vietnam differ substantially from scenario 1 to scenario 2 with ongoing agricultural liberalization. In the case of being outside the WTO Vietnam suffers from a

12
welfare loss of -128 million USD whereas the country gains 45 million USD in welfare when it is a member of the WTO. The GTAP model offers a further decomposition of the total welfare effect to provide as much detail as possible on the sources of welfare changes by relating it to real income changes (Huff, Karen M. and Hertel, Thomas W., 2000). The two most important effects for the simulations in this research leading to welfare changes are: Allocative effect: These are changes within a country due to more efficient resource allocation in line with its comparative advantages. Welfare increases when the production of subsidized goods is reduced or the production of taxed goods is enlarged. Terms of trade effect: These are changes between countries that occur when a country enlarges its trade in those products where it has a comparative advantage. In the policy simulations the effects of price changes for imports and exports, i.e. terms of trade changes are shown. If the price of exports increases or the price of imports decreases the terms of trade improve, leading to changes in trade flows and thereby welfare increase. For Vietnam the contribution of the allocative effect and the terms of trade effect to overall welfare is displayed in Table 8. The break down of the total welfare change into component parts shows that in simulation 1 the terms of trade component clearly dominates the total outcome. The much smaller negative allocative effect has nearly no impact on total equivalent variation. In the second simulation when Vietnam is a member of the WTO the allocative effect contributes solely to the positive welfare outcome whereas the terms of trade effect has no impact. These effects can be further broken down by commodity. Table 9 gives the decomposition for the allocative efficiency effect for the second simulation. The positive allocative efficiency effects come from the agricultural sectors which are less taxed through the simulations and where resources flow into these sectors. The reverse is true for the “textile and clothing manufacturing sector”.
4.2 Income and poverty effects for households in Northern Vietnam To examine the income and poverty effects of the price changes of the trade liberalization scenarios the outcomes of the macro model are linked with the household analysis. Certain assumptions are made how to match the different sectors of the household survey with GTAP sector categories. To determine liberalization effects on living standards consumption and earning shares of the household survey are determined. In the following the procedure is outlined in detail.
4.2.1 Matching the GTAP price changes with the Vietnamese household consumption information The sectors available in the GTAP data base and the sector aggregation chosen for the liberalization simulations have to be matched to the information collected in the household survey. This is done first before determining consumption expenditure shares from the household data.

13
4.2.1.1 Matching between GTAP model sectors and household consumption information Consumption data in the household survey are more detailed than the aggregated macro model sectors; therefore, the household consumption data are aggregated to groups which match the GTAP sectors as best as possible. Similarly, the household sectors are subsumed into GTAP sectors in order to relate price changes from the macro model to the household level. The impact of a price change for the household depends on the “nature of the household”. The household is characterised on the one hand by its earning sources (which will be dealt with later) and on the other hand by its consumption basket and the relative importance of the different consumption goods (McCulloch, Neil, 2003). For consumption one can distinguish food consumption and non-food consumption. Within the food sector household consumption data distinguish between rice and husked rice, which corresponds to the GTAP categories of processed rice and paddy rice. Household information about maize, cassava and sweet potato are collected separately and have been subsumed under the category of other staple food; they are assumed to correspond to the GTAP sector of other cereals. Consumption information about fruits and vegetables are directly comparable with the GTAP equivalent of the fruit and vegetable sector. Information about bean consumption is assumed to fall also into the fruit and vegetable group as beans are regarded in Vietnam as vegetable rather than as staple food. Survey information about the consumption of meat and eggs is assumed to correspond to the animal and animal product sector of the macro model. Under the heading of other processed food various consumption goods are summarized; namely oil, salt, sugar, tea, cigarettes/tobacco, alcohol, and fish. For the non-food sector households are asked for their wood consumption. Wood is assumed to correspond to the primary product category in GTAP. Concerning the households’ consumption of soap, petrol, lamp oil, etc. these items are taken together into a category of other manufacturing goods. The consumption of electricity can be evaluated at the price of the service sector. Consumption expenditures for clothing are assumed to correspond to the textile and clothing manufacturing sector. For the maintenance of buildings (houses, storage houses, stalls) expenditures are mainly bamboo and wood for repair and this is assumed to correspond to the GTAP sector of primary products. Table 10 summarizes the comparison between the household consumption goods and the GTAP sectors.
4.2.1.2 Determining consumption expenditure shares Another prerequisite for the post-simulation analysis is to determine consumption expenditure shares. In order to see differences among the households a classification is necessary. A distinction between rural and urban households is not reasonable because the used household data are all from rural areas. However, a distinction of households concerning their consumption level can show differences in the wealth status and the different importance of consumption goods in each group. For categorizing households according to poverty status
Deleted: ¶¶Table 10

14
per capita consumption is chosen to define tercile groups. The number of household members includes all persons living permanently in the household (children included without adjustment for age). Minimum per capita consumption within the sample is 72300 VND/year (equivalent to 4,91 USD) and maximum per capita consumption amounts to annually 3785300 VND (equivalent to 257,07 USD). The average is around 685200 VND/year (equivalent to 46,53 USD). These consumption figures only relate to bought consumption goods and do not include subsistence consumption which partly explains the low minimum value. Taking the difference between minimum and maximum per capita consumption and dividing this by three gives the range for the per capita consumption terciles. The different expenditure shares for food and non-food consumption goods without incorporating subsistence consumption are shown in Table 11. By defining terciles following per capita consumption without subsistence consumption households are unevenly distributed among the terciles. More than half of the households are in the poorest consumption tercile whereas the upper tercile is only represented by two households. Husked rice is not bought by the households except for the poorest households. The consumption share of (raw) rice increases from the lowest tercile to the second tercile and then declines again with an average of 11 percent of total expenditures spent for raw rice. From
Formatted: Text,1st line notindented
Formatted: Font: 12 pt, English(U.K.)
Deleted: Table 11

15
Table 11 it can be seen that the consumption of meat and egg gets the highest share of consumption expenditures; between 27 and 35 percent. Another important part of the consumption budget is spent for other processed food like oil, salt, sugar, etc with expenditure shares between 11and 19 percent. In sum, total consumption expenditure shares for food range between 64 and 73 percent.
For non-food items the biggest consumption share in the bottom tercile is devoted to clothing. Over one fifth of total expenditures is spent for clothing. This percentage decreases to less than 7 percent for the top tercile. The second biggest category of non-food products is manufactured products like soap, petrol and lamp oil. Consumption shares vary around an average of 11 percent with higher shares for the wealthier terciles.
Consumption expenditure shares show that price changes for meat and animal products as well as for clothing are the ones to affect the households most as they have the biggest shares of total consumption expenditures.
For rural households in Northern Vietnam subsistence agriculture and especially the cultivation of rice for own-consumption plays a dominant role. Not taking into account subsistence consumption therefore overstates the effect of price changes on the consumption shares of bought items. For that reason subsistence consumption is included in the calculation of consumption shares, evaluated at their local market value (see also World Bank, 2003).
The quantity of subsistence consumption can be derived from the household survey data, which record area planted and yield evaluated at local market prices. Subsistence consumption relates mainly to rice (lowland wet rice and upland dry rice). Moreover, garden crops and vegetables are a major source of food intake that is produced by the farmers themselves. Maize and cassava are also produced for own consumption, however, at a much smaller extent. When including subsistence consumption into total consumption minimum and maximum per capita consumption are at 428800 VND/year (equivalent to 29,12 USD) and 3785300VND/year (257,07 equivalent to USD) respectively with an average of 1395300VND/year (equivalent to 94,76 USD). The share of subsistence consumption can attain up to 92 percent of total consumption with an average of around 50 percent over all
Deleted: Table 11
16
households of the survey. It is obvious that through the incorporation of subsistence consumption the relative importance of food categories changes, too. The per capita consumption terciles and the distribution of consumption expenditure shares taking into account subsistence consumption are illustrated in Table 12. The distribution of households over the terciles is still extremely unevenly distributed, however less skewed than in the case of not incorporating subsistence consumption. Through the incorporation of subsistence consumption the share of food in total consumption raises considerably, reaching values of over 80 percent for all terciles. Rice from self-production becomes the dominant consumption share with an average of nearly 40 percent of total consumption expenditures followed by meat and egg consumption (bought and self-produced) with expenditure shares between 17 and 23 percent.
For non-food items clothing expenditures still dominate but their relative importance in total consumption declines to 10 percent for the poorest terciles and around 7 percent for the upper terciles. Other manufactured products (soap, petrol, lamp oil, etc.) attain a share of around 5 percent with slightly increasing tendencies over the terciles.
Expenditure shares for consumption goods reveal the importance that relative price changes for different goods have: the more important the share of a product category within total consumption and the bigger the share of bought consumption goods the more is the household influenced by price changes of this product category. Distinguishing per capita consumption with and without subsistence consumption helps to understand the consumption data: subsistence consumption plays an important role for households in Northern Vietnam and influences consumption shares considerably. For subsistence consumption households are not affected directly by price changes. Moreover, bought consumption goods are represented by their “real” importance in the consumption basket when incorporating subsistence consumption. To examine the initial extent of poverty in the survey region and the change in poverty incidence of liberalization measures poverty lines are defined.
4.2.2 Measuring the level-of-living of households in Northern Vietnam Assuming that the level-of-living is measured via consumption expenditures the next step is to chose a poverty line. Households falling with their expenditures below this line are defined as being poor. The definition of poverty lines is a controversial issue in Vietnam because it concerns the political debate about poverty reduction strategies and the targeting of poverty reduction programs. By defining a poverty line households are (more or less arbitrarily) categorized as being poor or non-poor. Therefore it is common that different institutions publish “their” poverty lines thus attaining different percentage rates of households living in poverty. The first part will present three different approaches to poverty lines used in Vietnam. The second part then deals with the extent of poverty and thus the level-of-living in the research area in mountainous regions of Northern Vietnam.
4.2.2.1 Three approaches to poverty lines in Vietnam In Vietnam there are commonly three institutions whose poverty lines can be used to characterize the poverty situation (National Economic University, 2004):
1. Poverty lines of the Ministry of Labour, Invalids and Social Affairs (MOLISA) 2. Poverty lines of the General Statistical Office (GSO) 3. Poverty lines of the World Bank
Poverty lines of the Ministry of Labour, Invalids and Social Affairs (MOLISA)
17
The poverty line of MOLISA is based on rice consumption, which means that it is defined in terms of kilograms of rice available per person per month. The quantity of rice is converted to money values based on current rice prices. MOLISA distinguishes hungry households and poor households. Hungry households are those with less than 13kg of rice per capita per month which corresponds to 45 000VND (equivalent to 3,06 USD) (MOLISA assumes an average price of around 3500VND/kg, May 1997). With this measure it is possible to trace the chronically undernourished households (Jamal, Vali and Jansen, Karel, 2004). Poor households are defined for three different regions (National Economic University, 2004):
1. Mountainous regions and islands - 15kg of rice per capita per month (equal to 55000VND or 3,74 USD).
2. Delta regions and the midlands - 20kg of rice per capita per month (equal to 70000 VND or 4,75 USD).
3. Urban areas – 25kg of rice per capita per month (equal to 90000VND or 6,11 USD) Distinguishing poverty lines for different regions takes account of the fact that prices differ between regions and whether a household is determined being poor depends upon its expenditures and the respective regional poverty line. In general poverty lines for urban areas are higher than for rural areas taking into consideration the higher consumption prices in cities (Khandker, Shahid, 2004). Table 13 gives a summary of MOLISA’s poverty lines and the corresponding annual monetary values to simplify comparison with other sources. MOLISA’s measure for hungry households and for rural poor households is predominantly a rice-only poverty line which assumes that the minimum caloric intake is mainly served by rice. No expenditures for other food items or for non-food items are included. The urban poverty line is defined differently allowing for some non-food needs (Jamal, Vali and Jansen, Karel, 2004). Poverty lines of the General Statistical Office (GSO) The GSO is the official statistical service of the Vietnamese government. They determine national food poverty lines since 1993 based on a similar methodology than the World Bank. Minimum calorie intake is defined as 2100 calories per capita per day. A food basket of 12 food items is determined for rural and urban households separately. Food items chosen correspond to the consumed items of the rural and urban middle group income quintiles. The monetary equivalents represent the rural and urban national food poverty lines. For 1996 the respective figures were 103000 VND (equivalent to 6,99 USD) per capita per month
Deleted: ¶Table 13

18
(annually: 1.236.000 VND or 83,94 USD) and 136000 VND (equivalent to 9,24 USD) per capita per month (annually: 1.632.000 VND or 110,83 USD). Poverty lines of the World Bank The World Bank (WB) distinguishes a food poverty line (low poverty line) and a total poverty line (high poverty line). The conceptualization of a low and a high poverty line tries to avoid the idea that a poverty line is a kind of threshold where a household moves from misery to an adequate minimum amount of living. However, welfare of a household follows a continuum and this calls for defining more than one poverty line (Khandker, Shahid, 2004). This helps to depict the difference between extreme poverty and poverty. The food poverty line is the minimum amount needed to secure a calorie intake of 2100 calories per day per person. A basis needs food basket is determined made up of 40 food items from the middle expenditure quintile. Except for the number of food items chosen the WB food poverty line is methodologically equal to the GSO national food poverty line. Both institutions base their calculations on the Vietnamese Living Standard Surveys (VLSSS). To determine a total poverty line the World Bank assumes a modest allowance for non-food items and adds this to the low food poverty line. For 1998 the food poverty line was fixed at 1.290.000 VND (equivalent to 87,61 USD) and the total poverty line at 1.790.000 VND (equivalent to 121,56 USD) per capita per year.
4.2.2.2 Extent of poverty in research area in Northern Vietnam Taking the per capita consumption expenditures of the household survey in Son La and Bac Kan Province and assuming a binary index who defines those households that fall below a poverty line as poor and the others as non-poor the extent of poverty in this regions following the different poverty lines is shown in Table 14. The different percentage rates show that it is very important to know how the poverty lines are defined. The different results are not an argument for the senselessness of poverty lines; on the contrary, they can shed light on different dimensions of the poverty problem. Obviously, the overall poverty level highly depends on the chosen poverty line. The MOLISA result shows the core poor, i.e. those that are not even able to meet their minimum calorie intake through rice. They can be regarded as chronically undernourished and represent 10,0 percent of the households included in the survey.
The GSO food poverty line and the WB food poverty line do not give very different results. Both show that nearly half of the households of the survey live below the food poverty line. The total poverty headcount measure of the World Bank even calculates three quarters of the households living in poverty. These figures are frightening high.
The average poverty incidence for rural Vietnam is estimated by the World Bank at around 57 percent which is nearly 20 percent less than the figure calculated here (World Bank, 2003). However, poverty varies greatly across regions, and the Northern mountainous regions are those with the highest incidence of poverty and the slowest reductions in poverty rates.
In an effort to map poverty on a provincial level in Vietnam Minot and Baulch combined data from the Vietnam Living Standard Survey 1998 with the 1999 Population and Housing Census (Minot, Nicholas and Baulch, Bob, 2002). First they used the VLSS to estimate linear regression models for predicting per capita expenditures for rural and urban populations and different income strata. These regression models are then applied to the available 3 percent sample of the household census to calculate provincial level estimates of poverty. They found

19
for Son La province a poverty headcount measure of 78.5 percent and for Bac Kan of 67.3 percent based on the total poverty line of the World Bank. These results seem to be in line with the figures presented in Table 14.
4.2.3 Measuring changes in the cost-of-living for households in Northern Vietnam Taking the commodity price changes from the two GTAP simulations together with the expenditures shares for consumption goods it is possible to calculate the short run changes in the costs-of-living for the household deciles. As subsistence production is an important part in the households consumption the expenditure shares taking subsistence into account are taken as basis for the calculation. For the short run it is assumed that the households do not substitute products and maintain their original expenditure shares. Taking the change in prices times the share of each product in the consumption basket the changes in the cost-of-living for the terciles of expenditures shares are calculated. If market prices for certain consumption goods go down, households that consume these goods are relatively better off than subsistence households, and vice versa. To take account of this relationship Friedman suggests a measurement taking the value of the subsistence production as negative expenditures (positive income) in the case of increasing prices and as positive expenditures (negative income) in the case of decreasing prices. The results for the change in costs-of-living for the households in Northern Vietnam under the two different scenarios are depicted in Table 15. In case that Vietnam does not accede to the WTO (simulation 1) the figures indicate that households in Northern Vietnam would suffer from a slight increase in their costs-of-living of up to 0.4 percent. The poorest tercile suffers from a bigger increase in its costs-of-living than the upper terciles.
In the last row of Table 15 it can be seen that in the case of Vietnam’s accession to the WTO and further multilateral liberalization (simulation 2) costs-of-living for households in Northern Vietnam generally decline by an average of -0.7 percent. The poorest tercile benefits from a stronger decline in its costs-of-living compared to the upper terciles.
4.2.4 Matching the GTAP price changes with the Vietnamese household earnings information So far the effects of price changes on the consumption side have been analyzed, but the earnings side has been neglected. This will be done in this part to get the net effect of price changes from trade liberalization. Trade liberalization does not only affect prices of consumption goods: agricultural households who are selling their products are affected by the same price changes through the effect on their earnings. Moreover, prices of production factors like wages can change, and their share in total earnings determines how much a household is affected. The first part will determine earning shares of different categories like agricultural earnings and non-agricultural own-business earnings of the households, wage earnings and transfer earnings for households in the survey. In the second part assumptions will be made which allow for matching the information available in the GTAP model with that of the household survey. Based on this the last part will calculate the changes on the earning side for households in Northern Vietnam from the simulated trade liberalization scenarios.

20
4.2.4.1 Determining earning shares Information about earning sources in the household survey are spread over different categories. The importance of four different earning sources will be examined, namely agricultural earning (further divided into different crops and livestock), off-farm own-business earnings, wages and salaries, and transfers. For rural households agricultural earnings are in most cases the most important income source. In order to get a better picture how this agricultural earnings are generated the shares of different crop and livestock activities are determined. Categories chosen are rice cultivation, vegetable and fruit cultivation, other cereals cultivation and livestock production. To calculate net earnings from the cultivation of crops the amount of sold crops is added to the amount of subsistence production. Production expenses (like plant material, plant protection, fertilizer, transportation costs and other expenditures) are deducted to derive net crop earnings.
To calculate earning from livestock production the value of sold animals is added to the value of self-consumed animals. Moreover, the value of other animal products sold (like eggs) is added. From this, expenditures (like fodder, veterinary and medicine and other expenditures) are deducted to derive net earnings from livestock production.
Earnings from non-agricultural own-business are income from a tailor shop, trading activities at the market, a bicycle garage, a motorbike taxi, etc. Moreover profits from selling home-made processed goods like alcohol, wine, yeast or joss sticks is added in this earnings category.
Wages include regular salaries paid for jobs in the commune or in the district as well as wage payments for working on other farms or in other sectors like the construction sector. Salaries are paid on a monthly basis whereas the other wage payments are paid daily or weekly and are based on seasonal fluctuations. Payments are made in cash and in kind.
The earning category “transfers” includes monthly pensions as well as income of other sources like renting out animals or machines. Moreover the value of transfers from friends is includes which is normally given in the form of clothes or food. Some households received transfers from the government in the form of food donations. Table 16 shows the contributions of different categories to total earnings for terciles of per capita consumption (including subsistence consumption). The figures confirm that agricultural income is the most important earning source for households in Northern Vietnam with an average share of 80 percent and falling tendencies from the lower tercile to the upper tercile. Within the agricultural earning the cultivation of rice contributes around one third. The importance of vegetable and fruit cultivation for the earning generation is around 8.5 percent. The cultivation of other cereals like maize, cassava and sweet potatoes is more important for the lower terciles: their share declines from 23 percent in the poorest tercile to 10 percent in the richest tercile. The opposite is true for the livestock sector. The share of livestock production to total earnings is around 17.5 percent in the lower tercile and raises to 25 percent in the upper tercile.
Earning from non farming self-employment is nearly the same over all terciles with a share of around 6 percent.
The share of wages to total earnings is around 9 percent for the two lower terciles of the household survey but reaches 20 percent for the top tercile. Probably the lower terciles depend more on wage payments whereas the upper tercile receives salary payments.
Formatted: Font: 12 pt, English(U.K.)
Formatted: Font: 12 pt, English(U.K.), Check spelling and grammar
Deleted: Table 16

21
For the category “transfers and pensions” the contribution to total earnings is between 0 and 5.5 percent. No clear pattern across terciles is observable.
All together it can be said that the differences of earning sources over terciles is relatively evenly distributed. This is due to the small sample size and the quite homogenous group. The households are predominantly agricultural households with rice being the most important earning source. Differences between consumption terciles can be observed within the agricultural earnings for cultivation of other cereals and livestock production. Wages and salaries are the second important income source followed by income from off-farm self-employment. Transfers and pensions play a minor role but are nonetheless present, especially in the lower terciles.
4.2.4.2 Matching between GTAP production factors and household earning information In order to relate the price changes from the macro-simulations to the information from the household survey the following assumptions are made. To calculate the change in agricultural earnings the shares from different crops are multiplied with the GTAP producer price changes. The matching between the agricultural earning categories of the household survey and the GTAP sectors is given in Table 17. To calculate the total change in agricultural earnings the producer price change for rice is applied to the earning share of rice cultivation, the price change of fruits and vegetables is applied to the share of fruits and vegetable cultivation, and the same for the two other categories. For earnings from off-farm own businesses the price changes of the GTAP service sector is matched to this income category because small scale businesses in Vietnam tend to offer services like little shops, tailors, and carpenters. The GTAP model distinguishes between wages for skilled and unskilled labour. In order to match the wage changes to the households the educational level of the household head, which is available in the survey, is used to determine whether the household receives the wage level for skilled or unskilled labour. Household heads that attained secondary school are assumed to get the wage for skilled labour whereas people with primary school or under-secondary school are assigned to receive the unskilled wage. For the household survey this leads to 84% of household heads being classified as unskilled workers and 16% being classified as skilled workers. The distribution between unskilled and skilled for the different terciles is given in Table 18. In the two lower terciles the distribution is around 85 percent unskilled and 15 percent skilled whereas the bottom terciles shows an equal distribution between skilled and unskilled household heads. The income category of transfers and pensions is assumed to be uncorrelated to factor price changes. Therefore, no matching with any production factors is assigned and the amount of transfers is assumed to stay unchanged.
4.2.4.3 Changes in earnings for households in Northern Vietnam To calculate the changes in earning the formula described in the methodology section is used. The earning shares of the different income sources for the consumption terciles are taken from Table 16. The agricultural commodity price changes and the skilled and unskilled wage changes for the two different liberalization scenarios are those from Table 4 and Table 5. Table 19 shows the earning change results for the first tercile with the respective earning shares and price change information in a detailed manner for all categories.

22
For simulation 1 earnings go down due to falling prices. The strongest decrease occurs in the sector of other cereals cultivation (maize, cassava, sweet potatoes) followed by declines in the rice sector and the livestock sector. Unskilled wages decline by 0.06 percent whereas skilled wages stay unchanged. Overall the changes for the different categories result in a total earning decline of -1.8 percent (see Table 20). When Vietnam is a member of the WTO (simulation 2) and further agricultural liberalization is pursued earning effects are positive. The largest effect is based on rice cultivation with an increase of 0.8 percent and other cereals with an increase of 0.7 percent. This is followed by livestock and vegetable and fruit cultivation. For the other income categories changes are zero, only unskilled wages experimenting a slight decline. In summary earnings increase by 2 percent for households in the first tercile (see Table 20). The total effects for all terciles are shown in Table 20. The earning changes for all terciles reveal that the differences between them are relatively evenly distributed. For simulation 1 earnings decline on average by -1.8 percent with the strongest effect in the lower tercile and a slighty decreasing trend up to the third tercile.
For simulation 2 earnings increase by an average of 2,2 percent. Again, the bottom tercile shows the biggest effect with an increase in earnings of 2,3 percent. Terciles two and three show smaller figures with an earnings increase of 1,9 percent for the top tercile. The results from Table 20 only show the impacts on earnings of rural households in Northern Vietnam following multilateral trade liberalization. In order to get a complete picture of the effects the next part will bring together the consumption effects and the earnings effects to derive the net income effects.
4.2.5 Estimating the net income effects of trade liberalization for households in Northern Vietnam and its effects on poverty Combining both effects, i.e. a household’s consumption pattern and its earning pattern, we calculate the net income effect. For the consumption effects results are taken from Table 15 where the changes in the costs-of-living were calculated taking into account subsistence consumption. The changes in the earnings situation of households in Northern Vietnam were calculated in Table 20. For simulation 1 the consumption and earning effects go both in the same negative direction: costs-of-living go generally up and the earnings go down thus resulting clearly in a negative net income position. In the case of simulation 2 households are positively affected in their net income both by declining costs-of-living as well as by increased earnings. The net income effects for the two simulations are shown in Table 21. In the case of simulation 1 households in Northern Vietnam suffer from an average net income decrease of around 2 percent. Households in the lower tercile are more negatively affected than the upper terciles.
For simulation 2 when Vietnam is in the WTO the results look different: households in Northern Vietnam benefit from net income increases with an average increase of nearly 3 percent. Households in the poorest tercile can grasp higher net income increases than the upper terciles.
Having obtained the percentage changes in net income for different household terciles in Northern Vietnam following two agricultural liberalization scenarios the question remains how this affects the poverty situation in this region.

23
Different poverty lines used in Vietnam were already presented and the extent of changes in poverty incidence based on the data of the household survey are calculated. With the results from Table 21 changes in the extent of poverty is calculated. As the households live mostly near the poverty line it is assumed that changes in net income lead directly to a change in consumption. A comparison between the extent of poverty before and after agricultural trade liberalization is given in Table 22. If agricultural liberalization is pushed further within the multilateral trading system and Vietnam is not member of the WTO households in Northern Vietnam are negatively affected, although moderately. The extent of poverty as measured by the MOLISA rice poverty line and the WB food poverty line increases by 0.8 percent; the GSO poverty line experiences the highest increase with 1.2 percent and the WB total poverty line the smallest increase with 0.4 percent. The raise of poverty by MOLISA’s measure can be interpreted that more people will live in absolute poverty and are chronically undernourished.
In the case of the second simulation when agricultural liberalization is going on and Vietnam is member of the WTO households in Northern Vietnam are positively affected. Declines in poverty can be observed measured by all poverty lines. Taking the MOLISA rice poverty line poverty goes down by 0.4 percent whereas following the GSO food poverty line it declines by 1.6 percent. The strongest reduction in poverty is shown if the food poverty line as defined by the World Bank is applied; poverty shows a reduction of 2.8 percent falling under 50 percent to 49.0 percent. For the total poverty line of the World Bank the poverty reduction amounts to 1.6 percent compared to the situation before liberalization and amounts to 74.9 percent.
Conclusions and policy recommendations International trade liberalization within the multilateral trading system affects all countries, whether they are member of the World Trading Organization or not, or whether they have small shares in the world market or large ones. Countries have to take account of developments in the international trade environment and consider them in their own domestic policies to be able to benefit from chances that are opening up or to mitigate negative developments that may arise. Over the last years international trade liberalization in the manufacturing sectors already advanced substantially whereas the agricultural sector is still relatively high protected. An attempt to find a compromise for further agricultural liberalization is the Harbinson Paper that suggests further liberalization commitments in the three areas of market access, export subsidies and domestic support. Implementing these suggestions within the Doha Round has implications for production and prices worldwide. Concerning the trade liberalization efforts of the WTO Vietnam has two options: to stay outside the WTO or become a member of the WTO. Vietnam decided to start accession negotiations with the WTO, and the objective is to accede within the Doha Round until 2005. The question is still open whether Vietnam will complete its accession negotiations successfully within the next year. Developing countries including Vietnam need to pay special attention to the impact of agricultural trade liberalization on their poor population; agriculture is still the most important income source of the poor in developing countries. To analyse the linkages between trade and
24
poverty is therefore an important task and the outcomes of such analysis are important for national policies and especially for targeted poverty reduction programmes. The chosen micro-macro approach in this paper is a tool to examine the link between international trade liberalization policies and poverty impacts on households in Northern Vietnam (Son La and Bac Kan province). For the macro approach the Harbinson suggestions for agricultural trade liberalization are simulated in a general equilibrium framework under the two options of Vietnam being a member of the WTO or not. The resulting price changes are linked to household information in a post simulation analysis. In this micro approach the effects of price changes on net income are examined by looking at the household consumption and earning patterns. If Vietnam is not member of the WTO and agriculture is further liberalized in the multilateral trading system the agricultural sector in Vietnam shrinks and the manufacturing sector expands. This development is reflected in output as well as in trade changes. Agricultural exports go down whereas manufacturing exports increase. In sum, however, exports and imports decline which indicates a declining integration of Vietnam into the world economy. Structural adjustment takes place and a labour surplus occurs in the agricultural sector which can move to the manufacturing sector. This is beneficial for those people living in areas with manufacturing industries, but in the short-run rural households in less connected and remote areas such as Son La and Bac Kan in Northern Vietnam are adversely affected. Due to their consumption and earning patterns costs-of-living go up and earnings decline, thus leading to a net income decrease of -2 percent. This leads to an increase of extremely poor households as measured by a Vietnamese rice poverty line by 0.8 percent. Other poverty lines show an increase in the extent of poverty between 0.4 and 1.2 percent. In the case of Vietnam’s accession to the WTO production increases in the agricultural sector and declines in the manufacturing sector with labour demand going in the same directions. Prices increase over all sectors, especially in the agricultural sector. Combining this information with the household data it can be seen that costs-of-living go down due to the high share of subsistence production. On the other hand, earnings go up because households in Northern Vietnam get most of their income from agriculture. Both costs-of-living and earning developments lead to a raise in net incomes of 3 percent and declines in poverty rates of 0.4 to 2.8 percent. For rural households in Northern Vietnam it is more beneficial if the country accedes to the WTO. However, what might be good for them might be less good for other poor groups with different consumption and earning patterns and a lesser degree of subsistence production. Therefore, it is necessary for the Vietnamese government to determine the impact of international policies on various groups of the population, like the rural and the urban poor. The results of these analyses have to be integrated in national poverty reduction policies. Special attention has to be given to the role of subsistence production and how it is included in the analysis as this has a great influence on the final outcome. Moreover, the definition and use of different poverty lines can help to determine the poorest parts of the population and poverty reduction efforts should start there. The first channel to reduce poverty is through an increase in earnings and less through a reduction in costs-of-living. Therefore the challenge for the government is to create better income opportunities in those sectors where the poor have their highest income share, i.e. in the agricultural sector. This can happen through the creation of market opportunities to sell agricultural products, but these markets have to function. By ameliorating infrastructure or

25
extension services to produce a higher quality product which is especially relevant for such remote areas like the mountainous regions in Northern Vietnam poor households can be linked to market opportunities created through liberalization. Moreover, sustainable agricultural systems need to be promoted which allow for more income and which do not harm the environment. In mountainous regions in Northern Vietnam with high rates of erosion and declining soil fertilities this is of special concern as the environment is the basis for income generation for the poor.

26
Tables
Table 1: Aggregation of regions and sectors (12x10) Regions Sectors Vietnam (VNM) Paddy rice (PDR) ASEAN Vegetables & fruits (V_F) China, Taiwan, Korea (CHTWKO) Cereals, oils seeds, raw sugar, fib (COSF) Japan (JPN) Other crops (OCR) Australia, New Zealand (AUSNZ) Animals & animal products (AnimP) United States of America (USA) Primary products (PrimP) European Union (EU15) Meat (MTP) CEE Countries (CEEC) Processed rice (PRR) Rest of developing countries (RDC) Other processed food (OPRF) Rest of industrialized countries (RIC)
Textile & cloth manufacturing (TCMNFC)
Other manufacturing (OMNFC) Services (SVCES)
Table 2: Production effects for Vietnam of simulations 1 and 2 (%)
sim 1 sim 2 change
Products/sectors VNM not in WTO VNM in WTO
PDR -0.05 0.85 0.90
V_F -0.12 1.88 2.00
COSF -0.19 1.48 1.67
OCR -2.19 0.77 2.96
AnimP 0.02 -0.52 -0.54
PrimP -1.00 2.42 3.42
MTP 0.53 0.36 -0.17
PRR -0.06 1.07 1.13
OPRF -4.78 -1.85 2.93
TCMNFC 2.84 -1.73 -4.57
OMNFC 1.83 -1.23 -3.06
SVCES -0.02 -0.10 -0.08 Source: GTAP data, own calculations.

27
Table 3: Unskilled labor demand effects for Vietnam of simulations 1 and 2 (%)
sim 1 sim 2 change
Products/sectors VNM not in WTO VNM in WTO
PDR -0.4 1.7 2.2
V_F -0.5 2.9 3.4
COSF -0.6 2.5 3.0
OCR -2.8 1.7 4.4
AnimP -0.3 0.2 0.6
PrimP -1.5 3.7 5.2
MTP 0.5 0.3 -0.2
PRR -0.1 1.1 1.1
OPRF -4.8 -1.9 3.0
TCMNFC 2.8 -1.8 -4.6
OMNFC 1.8 -1.3 -3.0
SVCES -0.1 -0.1 0.0 Source: GTAP data, own calculations.
Table 4: Price effects for Vietnam of simulations 1 and 2 (%)
sim 1 sim 2 change
Products/sectors VNM not in WTO VNM in WTO
PDR -1.68 2.54 4.22
V_F -1.88 3.20 5.08
COSF -2.06 3.45 5.51
OCR -2.80 3.18 5.98
AnimP -1.92 2.49 4.41
PrimP -1.94 3.50 5.44
MTP -1.37 1.38 2.75
PRR -1.60 2.32 3.92
OPRF -0.91 0.38 1.29
TCMNFC -0.56 0.19 0.75
OMNFC -0.63 0.34 0.97
SVCES -0.74 0.06 0.80 Source: GTAP data, own calculations.

28
Table 5: Wage effects for skilled and unskilled labor for Vietnam of simulation 1 and 2 (%)
sim 1 sim 2 change
VNM not in WTO VNM in WTO
Unskilled labour -0.8 -0.1 0.7
Skilled labour -0.8 -0.3 0.5 Source: GTAP data, own calculations.
Table 6: Changes in global export values for Vietnam of simulations 1 and 2 (million USD and %)
sim 1
VNM not in WTO
sim 2
VNM in WTO
change
Change in global export values (million USD)
-67 +137 +204
Change in global export values (%) -0.6 +1.2 +1.8 Source: GTAP data, own calculations.
Table 7: Changes in sectoral trade balances for Vietnam of simulations 1 and 2 (million USD)
sim 1 sim 2 change
Products/sectors VNM not in WTO VNM in WTO
PDR 1 0 -1
V_F 2 21 19
COSF 1 5 3
OCR -30 -5 25
AnimP 1 -2 -4
PrimP -72 150 222
MTP 1 1 0
PRR 6 32 26
OPRF -144 -41 103
TCMNFC 106 -70 -176
OMNFC 104 -51 -155
SVCES 39 -1 -40
total 14 38 24 Source: GTAP data, own calculations.

29
Table 8: Contribution of terms of trade and allocative effects to total equivalent variation for Vietnam of simulations 1 and 2 (million USD)
sim 1
VNM not in WTO
sim 2
VNM in WTO
allocative effect -3 45
terms of trade effect -119 0
total equivalent variation (EV) effect -128 45 Note: Other effects play only a minor role and are not reported, but they explain the difference of -5 in
the total of simulation 1.
Source: GTAP data, own calculations.
Table 9: Decomposition of the allocative effect by commodity for Vietnam of simulation 2 (million USD)
Products/sectors VNM – sim 2
PDR 1
V_F 2
COSF 0
OCR 1
AnimP 0
PrimP 6
MTP 1
PRR 1
OPRF 49
TCMNFC -12
OMNFC -2
SVCES -1
total 46 Source: GTAP data, own calculations.

30
Table 10: Matching between Vietnamese household consumption goods and GTAP sectors
Consumption goods in the household survey Matched GTAP sectors
Husked rice Paddy rice
Rice Processed rice
Maize, cassava, sweet potato Other cereals
Fruits, vegetables, beans Fruits and vegetables
Meat, eggs Animal and animal products
Oil, salt, sugar, tea, ciarettes/tobacco, alcohol, fish Other processed food
Soap, petrol, lamp oil Other manufacturing
Wood Primary products
Electricity Services
Clothing Textile and clothing manufacturing
Building maintenance Primary products

31
Table 11: Consumption expenditure shares by tercile of per capita consumption without subsistence consumption (%)
1 n=227
2 n=18
3 n=12
avg n=247
FOOD TOTAL 63,7 68,1 72,6 64,1 Husked rice
0,6 0,0 0,0 0,5
Rice
10,2 19,5 11,9 10,9
Maize, cassava, sweet potato 1,5 3,6 5,3 1,7 Fruits, vegetables, beans 4,8 3,7 10,1 4,7 Meat, eggs
28,0 27,1 34,3 28,0
Oil, salt, sugar, tea, cigarettes, alcohol 18,7 14,2 11,0 18,3 NON-FOOD TOTAL 36,3 31,9 27,4 35,9 Wood
0,2 1,5 0,0 0,3
Soap, petrol, lamp oil 10,6 11,0 16,5 10,7 Electricity
1,7 3,4 4,2 1,9
Clothing
22,1 11,0 6,7 21,2
Building maintenance 1,6 5,1 0,0 1,8 TOTAL 100 100 100 100 Source: Household survey SFB 564 project F1/F2, own calculations.
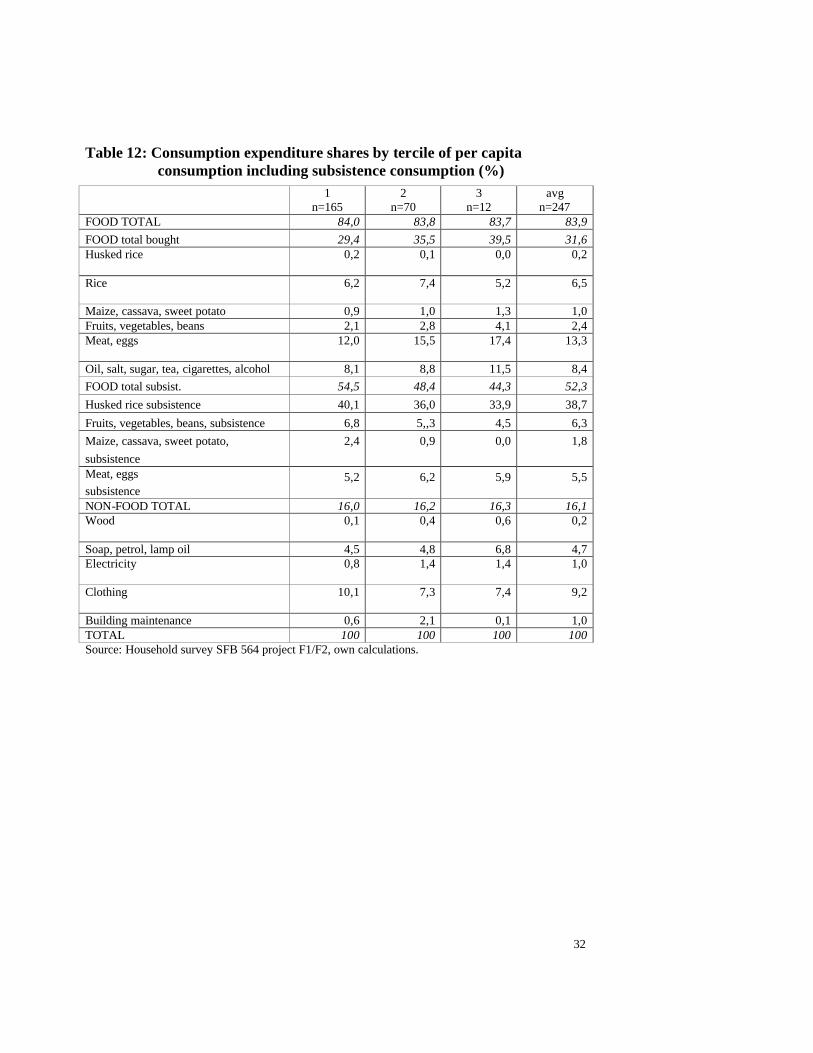
32
Table 12: Consumption expenditure shares by tercile of per capita consumption including subsistence consumption (%)
1 n=165
2 n=70
3 n=12
avg n=247
FOOD TOTAL 84,0 83,8 83,7 83,9 FOOD total bought 29,4 35,5 39,5 31,6 Husked rice
0,2 0,1 0,0 0,2
Rice
6,2 7,4 5,2 6,5
Maize, cassava, sweet potato 0,9 1,0 1,3 1,0 Fruits, vegetables, beans 2,1 2,8 4,1 2,4 Meat, eggs
12,0 15,5 17,4 13,3
Oil, salt, sugar, tea, cigarettes, alcohol 8,1 8,8 11,5 8,4 FOOD total subsist. 54,5 48,4 44,3 52,3 Husked rice subsistence 40,1 36,0 33,9 38,7 Fruits, vegetables, beans, subsistence 6,8 5,,3 4,5 6,3 Maize, cassava, sweet potato, subsistence
2,4 0,9 0,0 1,8
Meat, eggs subsistence
5,2 6,2 5,9 5,5
NON-FOOD TOTAL 16,0 16,2 16,3 16,1 Wood
0,1 0,4 0,6 0,2
Soap, petrol, lamp oil 4,5 4,8 6,8 4,7 Electricity
0,8 1,4 1,4 1,0
Clothing
10,1 7,3 7,4 9,2
Building maintenance 0,6 2,1 0,1 1,0 TOTAL 100 100 100 100 Source: Household survey SFB 564 project F1/F2, own calculations.

33
Table 13: Annual MOLISA rice poverty lines (VND)
Hungry households
Poor households living in mountainous regions and islands
Poor households living in delta regions and midlands
Poor households living in urban areas
Poverty line per capita per year in VND (equivalent in USD)
540.000
(36,67)
660.000
(44,82)
840.000
(57,05)
1.080.000
(73,34)
Source: MOLISA 1997, own calculations.
Table 14: Extent of poverty for household survey in Son La and Bac Kan following different poverty line definitions (%)
MOLISA
Rice poverty line, 1997
GSO
Food poverty line, 1996
WB
Food poverty line, 1998
WB
Total poverty line, 1998
Poverty extent 10,0 % 48,2 % 51,8 % 76,5 %
Source: Own calculations.
Table 15: Alternative measurement of changes in costs-of-living from trade liberalization assuming consumption expenditure shares with subsistence consumption for households in Northern Vietnam (%)
Changes in the cost-of-living
1 n=165
2 n=70
3 n=12
avg n=247
Trade liberalization and Vietnam NOT in the WTO (sim 1)
0,4 0,1 0,0 0,3
Trade liberalization and Vietnam in the WTO (sim 2)
-0,8 -0,4 -0,3 -0,7
Source: Own calculations.

34
Table 16: Earning shares by tercile of per capita consumption (%) 1
n=165 2
n=70 3
n=12 avg
n=247 AGRIC INCOME
81,4 79,4 73,6 80,4
Rice cultivation
32,4 31,6 31,4 32,1
Veg & fruits cultivation
8,6 9,1 6,9 8,6
Maize, cassava, sweet potato cultivation 22,9 18,9 10,4 21,2 Livestock
17,5 19,8 24,9 18,5
OFF-FARM SMALL OWN-BUSINESS
6,3 6,0 6,4 6,2
WAGES & SALARIES 8,6 9,0 20,0 9,3 TRANSFERS, PENSIONS 3,7 5,5 0,1 4,0 TOTAL 100 100 100 100 Source: Household survey SFB 564 project F1/F2, own calculations.
Table 17: Matching between Vietnamese agricultural earning sources and GTAP sectors
Agricultural earning sources in the household survey Matched GTAP sectors
Rice cultivation Paddy rice
Fruits and vegetable cultivation Fruits and vegetables
Other cereals cultivation Other cereals
Livestock Animal and animal products
Table 18: Shares of unskilled and skilled household heads over terciles (%) 1
n=165 2
n=70 3
n=12 avg
n=247 unskilled
87 83 50 84
skilled
13 17 50 16
Source: Household survey SFB 564 project F1/F2, own calculations.

35
Table 19: Detailed earning change results for the first tercile (%)
tercile 1 Earning share
Price change SIM 1 VNM not in WTO
Price change SIM 2 VNM in WTO
Earning change SIM 1 VNM not in WTO
Earning change SIM 2 VNM in WTO
Rice cultivation
32,4 -1,68 2,54 -0,54 0,82
Veg&fruit cultivation
8,6 -1,88 3,20 -0,16 0,27
Oth cereals cultivation
22,9 -2,80 3,18 -0,64 0,73
Livestock 17,5 -1,92 2,49 -0,34 0,44
Off-farm own business
6,3 -0,74 0,06 -0,05 0,00
Wages 8,6 Unskilled: -0,8
Skilled: -0,8
Unskilled: -0,1
Skilled: -0,3
-0,06
-0,01
-0,01
0,00
Transfers 3,7 - - 0,00 0,00
Source: Own calculations.
Table 20: Earning change results for households in Northern Vietnam (%) Changes in earnings 1
n=165 2
n=70 3
n=12 avg
n=247 Trade liberalization and Vietnam NOT in the WTO (sim 1)
-1,8
-1,7
-1,6
-1,8
Trade liberalization and Vietnam in the WTO (sim 2)
2,3
2,2
1,9
2,2
Source: Own calculations.

36
Table 21: Net income effects from trade liberalization for households in Northern Vietnam (%)
Changes in net income 1 n=165
2 n=70
3 n=12
avg n=247
Trade liberalization and Vietnam NOT in the WTO (sim 1)
-2,2
-1,9
-1,7
-2,1
Trade liberalization and Vietnam in the WTO (sim 2)
3,1
2,6
2,3
2,9
Source: Own calculations.
Table 22: Poverty rates before and after agricultural trade liberalization for households in Northern Vietnam (%)
MOLISA
Rice poverty line, 1997
GSO
Food poverty line, 1996
WB
Food poverty line, 1998
WB
Total poverty line, 1998
Before liberalization
10,0 % 48,2 % 51,8 % 76,5 %
SIM 1 (VNM not in WTO)
10,8 % 49,4 % 52,6 % 76,9 %
SIM 2 (VNM in WTO)
9,6 % 46,6% 49,0 % 74,9 %
Source: Own calculations.

37
References
Anderson, Kym. 1999. Vietnam's Transforming Economy & WTO Accession. Singapore: Continental Press Pte Ltd.
Brockmeier, Martina. 1996. A Graphical Exposition of the GTAP Model. GTAP Technical Paper No. 8. Purdue, USA: Purdue University, Center for Global Trade Analysis.
Brockmeier, Martina. 1999. Die Relevanz allegemeiner Gleichgewichtsmodelle für die agrarökonomische Forschung. Agrarwirtschaft 48 (12) (438-447.
Brockmeier, Martina and Salamon, Petra. 2003. WTO-Agrarverhandlungen - Schlüsselbereich für den Erfolg der Doha-Runde: Optionen für Exportsubventionen, interne Stützung, Marktzugang (Anhang). Braunschweig, D: Federal Agricultural Research Center, FAL.
Dimaranan, B. and McDougall, Robert. 2003. GTAP data base 6.1. Purdue, USA: Purdue University.
Dufhues, Thomas and Wirth, Thomas. 2002. Joint Questionnaire for Rural Households: subproject F1 "Land Tenure and Natural Resource Management in the Upland Areas of Vietnam" and subproject F2 "Rural Financial Market Development in Northern Vietnam". SFB 564 The Uplands Program. Hohenheim, D: University of Hohenheim.
Francois, Joseph, Meijl, Hans van, and Tongeren, Frank van. 2003. Trade Liberalization and Developing Countries under the Doha Round. Discussion Paper Series No. 4032. London, UK: Centre for Economic Policy Research (CEPR).
Friedman, Jed. 2000. Differential Impacts of Trade Liberalization on Indonesia's Poor and Non-poor. Paper prepared for the Conference on International Trade and Poverty, Stockholm, Oct 20-21, 2000.
Hertel, Thomas W. 1997. Introduction. In Global Trade Analysis: Modeling and Applications. Hertel, Thomas W. (ed.): 3-10. Cambridge, USA: University Press.
Hertel, Thomas W. and Tsigas, Marinos E. 1997. Structure of GTAP. In Global Trade Analysis: Modeling and Applications. Hertel, Thomas W. (ed.): 13-73. Cambridge, USA: University Press.
Hertel, Thomas W. edit. 1997. Global Trade Analysis - Modeling and Applications. Cambridge, USA: University Press.
Huff, Karen M. and Hertel, Thomas W. 2000. Decomposing Welfare Changes in the GTAP Model. GTAP Technical Paper. Purdue, USA: Purdue University, Center for Global Trade Analysis.
Jamal, Vali and Jansen, Karel. 2004. Agrarian transition in Viet Nam. www.ilo.org/public/english/dialogue/sector/papers/agrtans/128ap2.htm accessed 31-3-2004.
38
Khandker, Shahid. 2004. Poverty Manual. www.worldbank.org/wbi/povertyanalysis/manual accessed 1-4-2004.
McCulloch, Neil. 2003. The Impact of Structural Reforms on Poverty: A Simple Methodology with Extensions. Policy Research Working Paper 3124. Washington D.C., USA: World Bank.
McCulloch, Neil, Winters, Alan L., and Cirera, Xavier. 2001. Trade Liberalization and Poverty: A Handbook. London, UK: Centre for Economic Policy Research (CEPR).
Minot, Nicholas and Baulch, Bob. 2002. The Spatial Distribution of Poverty in Vietnam and the Potential for Targeting. MSSD Discussion Paper. Washington D.C., USA: IFPRI.
National Economic University. 2004. Concepts, contents and measurement of poverty in Vietnam. www.unescap.org/stat/meet/povstat/pov7_vnm.pdf accessed
Reimer, Jeffrey J. 2002. Estimating the Poverty Impacts of Trade Liberalization. Purdue, USA: Purdue University.
World Bank. 2003. World Development Indicators 2003. Washington D.C., USA: World Bank.