The Diversity Immigrant Visa Program
24
The Diversity Immigrant Visa Program Updated October 15, 2019 Congressional Research Service https://crsreports.congress.gov R45973
Transcript of The Diversity Immigrant Visa Program
The Diversity Immigrant Visa Program
Updated October 15, 2019
Congressional Research Service
https://crsreports.congress.gov
R45973

Congressional Research Service
SUMMARY
The Diversity Immigrant Visa Program The purpose of the diversity immigrant visa program (DV program, sometimes called
“the green card lottery” or “the visa lottery”) is, as the name suggests, to foster legal
immigration from countries other than the major sending countries of current
immigrants to the United States. Current law weights the allocation of immigrant visas
primarily toward individuals with close family in the United States and, to a lesser
extent, toward those who meet particular employment needs. The diversity immigrant
category was added to the Immigration and Nationality Act (INA) by the Immigration
Act of 1990 (P.L. 101-649) to stimulate “new seed” immigration (i.e., to foster new, more varied migration from
other parts of the world).
The DV program currently makes 50,000 visas available annually to natives of countries from which immigrant
admissions were less than 50,000 over the preceding five years combined. The formula for allocating these visas
is specified in statute: visas are divided among six global geographic regions, and each region and country is
identified as either high-admission or low-admission based on how many immigrant visas were given to foreign
nationals from each region and country over the previous five-year period. Higher proportions of diversity visas
are allocated to low-admission regions and countries. The INA limits each country to 7% (3,500, currently) of the
total and provides that Northern Ireland be treated as a separate foreign state.
Because demand for diversity visas greatly exceeds supply, a lottery system is used to select individuals who may
apply for them. Those selected by lottery (“lottery winners”), like all other foreign nationals wishing to come to
the United States, must undergo reviews performed by Department of State consular officers abroad and
Department of Homeland Security immigration officers upon entry to the United States. These reviews are
intended to ensure that the foreign nationals are not ineligible for visas or admission to the United States under the
grounds for inadmissibility spelled out in the INA. To be eligible for a diversity visa, the INA requires that a
foreign national have at least a high school education or the equivalent, or two years’ experience in an occupation
that requires at least two years of training or experience. The foreign national or the foreign national’s spouse
must be a native of one of the countries listed as a foreign state qualified for the diversity visa program.
The distribution of diversity visas by global region of origin has shifted over time, with higher shares coming
from Africa and Asia in recent years compared to earlier years when Europe accounted for a higher proportion. Of
all those admitted through the program from FY1995 (the first year it was in full effect) through FY2017 (the
most recent year for which data are available), individuals from Africa accounted for 40% of diversity
immigrants, while Europeans accounted for 31% and Asians for 25%.
Some argue that the DV program should be eliminated and its visas re-allocated for employment-based visas or backlog
reduction in various visa categories. Critics of the DV program warn that it is vulnerable to fraud and misuse and is
potentially an avenue for terrorists to enter the United States, citing the difficulties of performing background checks in many
of the countries whose citizens are eligible for a diversity visa. Critics also argue that admitting immigrants on the basis of
their nationality is discriminatory and that the reasons for establishing the DV program are no longer germane. Supporters of
the program argue that it provides “new seed” immigrants for a system weighted disproportionately to family-based
immigrants from a handful of countries. Supporters contend that fraud and abuse have declined following measures put in
place by the State Department, and that the system relies on background checks for criminal and national security matters that
are performed on all prospective immigrants seeking to come to the United States, including those applying for diversity
visas. Supporters also contend that the DV program promotes equity of opportunity and serves important foreign policy
goals.
R45973
October 15, 2019
Jill H. Wilson Analyst in Immigration Policy

The Diversity Immigrant Visa Program
Congressional Research Service
Contents
Background ..................................................................................................................................... 1
Legislative Origins .................................................................................................................... 1 Eligibility Criteria and Application Process .............................................................................. 2
Trends in Source Regions and Countries......................................................................................... 4
Characteristics of Diversity Immigrants .......................................................................................... 7
Regions of Birth ........................................................................................................................ 7 Age and Sex .............................................................................................................................. 7 Marital Status ............................................................................................................................ 8 Educational Attainment and Labor Market Characteristics ...................................................... 8
Impact of the DV Program on Immigrant Diversity ...................................................................... 10
Selected Legislative Action ............................................................................................................ 11
Selected Policy Questions .............................................................................................................. 11
Is it fair to have the diversity visa category when there are family members and
prospective employees who have been waiting for years for visas to become
available? .............................................................................................................................. 11 Should the United States base admissions decisions on nationality? ...................................... 12 Is a lottery the best way to choose applicants for diversity visas? .......................................... 13 Is the diversity visa lottery more vulnerable to fraud and misuse than other
immigration pathways? ........................................................................................................ 14 Are there national security reasons to eliminate the diversity visa? ....................................... 15 Are there foreign policy reasons to continue the diversity visa program? .............................. 16 Are the reasons that led to establishment of the diversity visa (e.g., to stimulate “new
seed” immigration) still germane? ....................................................................................... 17
Figures
Figure 1. Diversity Immigrant Visa Program .................................................................................. 3
Figure 2. World Region of Birth for Diversity Immigrants ............................................................. 5
Figure 3. Top Countries of Birth for Diversity Immigrants ............................................................. 6
Figure 4. World Region of Birth for LPRs in FY2017 .................................................................... 7
Figure 5. Age Distribution of LPRs in FY2017............................................................................... 8
Figure A-1. Entropy Index (Standardized) by LPR Type .............................................................. 19
Appendixes
Appendix. Entropy Index Methodology and Results .................................................................... 19
Contacts
Author Information ........................................................................................................................ 20

The Diversity Immigrant Visa Program
Congressional Research Service
The Diversity Immigrant Visa Program
Congressional Research Service 1
Background Family reunification and the admission of immigrants with needed skills are two of the major
principles underlying U.S. immigration policy. As a result, current law weights the allocation of
immigrant visas heavily toward individuals with close family in the United States and, to a lesser
extent, toward individuals who meet particular employment needs. The diversity immigrant
category was added to the Immigration and Nationality Act (INA) by the Immigration Act of
1990 (P.L. 101-649) to stimulate “new seed” immigration (i.e., to foster new, more varied
migration from other parts of the world).1 Diversity visas are allocated to natives of countries
from which the combination of immediate relatives, family preference, and employment
preference immigrant admissions were lower than a total of 50,000 over the preceding five years
combined.
Legislative Origins
The Immigration Amendments of 1965 replaced the national origins quota system, which
prioritized European source countries, with equally distributed per-country ceilings.2 In the
1980s, some Members of Congress began expressing concern that U.S. legal immigration
admissions were skewed in favor of immigrants from Asia and Latin America because of the
1965 amendments.3 The first legislative response to this concern occurred in Section 314 of the
Immigration Reform and Control Act of 1986 (IRCA), which allowed an extra 5,000 immigrant
visas per year for FY1987 and FY1988 to be distributed to natives of 36 countries that had been
adversely affected by the 1965 changes to the INA. Over 1 million people applied for what was
then called the NP-5 program, and visas were made available according to the chronological
order in which qualified applications were mailed to the State Department (DOS). Natives of
Ireland received the largest proportion (31%) of the NP-5 visas, followed by natives of Canada
(21%) and Great Britain (11%).4 In 1988, Congress extended the NP-5 program for two more
years and made 15,000 additional immigrant visas available each year in FY1989 and FY1990.5
What is now known as the diversity immigrant category was added to the INA6 by P.L. 101-649
and went fully into effect in FY1995. Section 132 of P.L. 101-649 provided 40,000 visas per year
for a transitional program during FY1992-FY1994 for certain natives of foreign states that were
adversely affected by the 1965 changes to the INA. At least 40% of these visas were earmarked
for natives of Ireland. The current diversity visa category had an annual allocation of 55,000 visas
when it went into effect in FY1995.
While the diversity visa category has not been directly amended since its enactment, P.L. 105-
100, the Nicaraguan Adjustment and Central American Relief Act of 1997 (NACARA),
1 §203(c) of INA.
2 P.L. 89-23679 Stat. 911 (1965).
3 Legal permanent residents from Ireland, for example, fell from 6,307 in FY1964 to 1,836 in FY1986; see CRS Report
91-141, A Brief History of U.S. Immigration Policy, Joyce C. Vialet, January 25, 1991 (archived report, available upon
request to congressional clients). For more on the legislative history of the diversity immigrant visa program, see Anna
O. Law, “The Diversity Visa Lottery: A Cycle of Unintended Consequences in United States Immigration Policy,”
Journal of American Ethnic History, vol. 21, no. 4 (Summer 2002).
4 “Irish Biggest Winners in NP-5 Nonpreference Visa Program,” Interpreter Releases, vol. 64, no. 291 (March 9,
1987).
5 “State Dept. Advises on New NP-5 Program,” Interpreter Releases, vol. 65, no. 45 (November 22, 1988).
6 §203(c) of INA.
The Diversity Immigrant Visa Program
Congressional Research Service 2
temporarily decreased the 55,000 annual ceiling to 50,000. Beginning in FY2000, the 55,000
ceiling has been reduced by 5,000 annually to offset immigrant visas made available to certain
unsuccessful asylum seekers from El Salvador, Guatemala, and formerly communist countries in
Europe who are being granted immigrant status under special rules established by NACARA. The
5,000 offset is temporary, but it is not clear how many years it will be in effect to handle these
adjustments of status.
Eligibility Criteria and Application Process
To be eligible for a diversity visa, the INA requires that a foreign national must have at least a
high school education or the equivalent, or two years of experience in an occupation that requires
at least two years of training or experience. The applicant or the applicant’s spouse must be a
native of one of the countries listed as a foreign state qualified for the DV program.7 Minor
children of the qualifying diversity immigrant, as well as the spouse, may accompany as lawful
permanent residents (LPRs)8 and are counted toward the 50,000 annual limit.
Because the demand for diversity visas is much higher than the supply, a lottery is used to
randomly select who may apply for one of the 50,000 diversity visas available annually. (See
Figure 1 for an illustration of the process). There is no fee to enter the diversity lottery.9
Registration for the FY2020 diversity lottery began on October 3, 2018, and closed on November
6, 2018.10 Beginning on May 7, 2019, and continuing through September 30, 2020, those who
registered can use an online system to find out if they had been selected.11 The FY2018 lottery
had 14.7 million entries, representing over 23 million people (including family members). From
the millions of entries, approximately 100,000 selectees are randomly chosen.12 Being chosen as a
selectee (“lottery winner”) does not guarantee receipt of a diversity visa; rather, it identifies those
who are eligible to apply for one. To receive a visa, selectees must successfully complete the
application process (including security and medical screenings and in-person interviews) by the
end of the fiscal year for which they registered for the lottery or they lose their eligibility.13
7 8 USC §1153(c) (INA §203(c)). An individual who is not a native of a qualifying country may also qualify for the
diversity visa program based on his or her spouse’s country of birth or his or her parent’s country of birth if neither of
the parents were born in or are permanent residents of the applicant’s country of birth at the time of the applicant’s
birth (see “Instructions for the 2020 Diversity Immigration Visa Program,” https://travel.state.gov/content/dam/visas/
Diversity-Visa/DV-Instructions-Translations/DV-2020-Instructions-Translations/DV-2020-Instructions-English.pdf).
8 LPRs are foreign nationals who are admitted to the United States on a permanent basis.
9 On June 5, 2019, the State Department began requiring petitioners to have a valid, unexpired passport in order to enter
the lottery; see U.S. Department of State, “Visas: Diversity Immigrants,” 84 Federal Register 25989, June 5, 2019.
Some predict that this new rule will exclude lower-income petitioners or those in more remote areas for whom
obtaining a passport may be more difficult. A lawsuit was filed in September claiming that the Trump Administration
did not follow the public notice and comment procedures in changing this policy (E.B. et al. v. U.S. Department of
State et al., case number 1:19-cv-02856, in the U.S. District Court for the District of Columbia).
10 U.S. Department of State Bureau of Consular Affairs, “Registration for the Diversity Immigrant (DV-2020) Visa
Program,” 83 Federal Register 48499-48507, September 25, 2018. Registration for the FY2021 diversity visa lottery
began on October 2, 2019, and is to close on November 5, 2019.
11 The DOS instructs registrants to log onto “Entrant Status Check” at dvlottery.state.gov to see if they have been
selected. Selected entrants are encouraged to complete the online DS-260 application immediately to schedule an
interview appointment at the U.S. embassy or consulate. For more information, see https://travel.state.gov/content/
travel/en/us-visas/immigrate/diversity-visa-program-entry.html
12 The State Department chooses approximately 100,000 selectees in order to yield 50,000 visas because historically
about half of selectees do not successfully complete the visa application process by the deadline.
13 Such individuals may register for the lottery again in subsequent years.

The Diversity Immigrant Visa Program
Congressional Research Service 3
DV applicants, like all other foreign nationals applying to come to the United States, must pay
applicable fees14 and undergo reviews and biometric background checks performed by DOS
consular officers abroad and Department of Homeland Security (DHS) immigration officers upon
entry to the United States. Individuals selected for a diversity visa who are residing in the United
States as nonimmigrants15 must undergo reviews by U.S. Citizenship and Immigration Services
(USCIS) prior to adjusting to LPR status.16 These reviews, which include an in-person interview,
are intended to ensure that the applicants are not inadmissible under the grounds spelled out in
Section 212(a) of the INA. Grounds for inadmissibility include health, criminal history, security
and terrorist concerns, public charge, illegal entry, and previous removal.17
Figure 1. Diversity Immigrant Visa Program
General Process and FY2018 Cohort Information
Source: CRS illustration based on data from the Department of State’s Diversity Visa Selected Entrants, 2018,
https://travel.state.gov/content/travel/en/us-visas/immigrate/diversity-visa-program-entry/dv-2018-selected-
14 Individuals outside the United States must pay $330 to DOS to apply for their visa and $220 to USCIS to receive
their LPR status. DV applicants who are already present in the United States on a nonimmigrant visa and do not wish to
leave and re-enter the United States using their diversity visa must pay $1,140 (plus an $85 biometrics fee) to USCIS to
adjust their status from nonimmigrant to LPR and $330 to DOS for their visa.
15 Nonimmigrants are foreign nationals who are lawfully admitted to the United States for a designated period of time
and a specific purpose. These include students, temporary workers, exchange visitors, and tourists. For more
information, see CRS Report R45040, Immigration: Nonimmigrant (Temporary) Admissions to the United States.
16 Each year, a small percentage (2.8%, on average, over the last 10 fiscal years) of DV immigrants adjust status from
within the United States.
17 For more information on inadmissibility, see CRS Report R43892, Alien Removals and Returns: Overview and
Trends.

The Diversity Immigrant Visa Program
Congressional Research Service 4
entrants.html and from Table III of Report of the Visa Office, 2018,
https://travel.state.gov/content/dam/visas/Statistics/AnnualReports/FY2018AnnualReport/FY18AnnualReport%20-
%20TableIII.pdf.
Trends in Source Regions and Countries The diversity immigrant visa program currently makes 50,000 visas available annually to natives
of countries from which immigrant admissions were lower than a total of 50,000 over the
preceding five years.18 USCIS implements a formula for allocating visas according to statutory
specifications:19 visas are divided among six global geographic regions, and each region and
country is identified as either high admission or low admission based on how many immigrant
visas each received over the previous five-year period. Higher proportions of diversity visas are
allocated to low-admission regions and low-admission countries. Each country is limited to 7%,
or 3,500,20 of the total, and the INA provides that Northern Ireland be treated as a separate foreign
state.21
The distribution of diversity visas by global region of origin has shifted over time (see Figure 2).
From FY1995 through FY2001, foreign nationals from Europe garnered a plurality of diversity
visas, ranging from 38% to 47% of the total. In the early 2000s, the share of DV recipients from
Africa was on par with those from Europe. Europe’s share dropped by nine percentage points
from FY2005 to FY2006 as the shares from African and Asian countries continued to increase.
Since FY2008, Europe has accounted for smaller shares than Africa or Asia. Latin America
(which includes South America, Mexico, Central America, and the Caribbean), Oceania, and
North America accounted for less than 8% each year. In total, from FY1995 through FY2017
immigrants from Africa accounted for 40% of diversity immigrants, while Europeans accounted
for 31% and Asians for 25%. These trends are consistent with the statutory formula Congress
outlined to allocate diversity visas.22
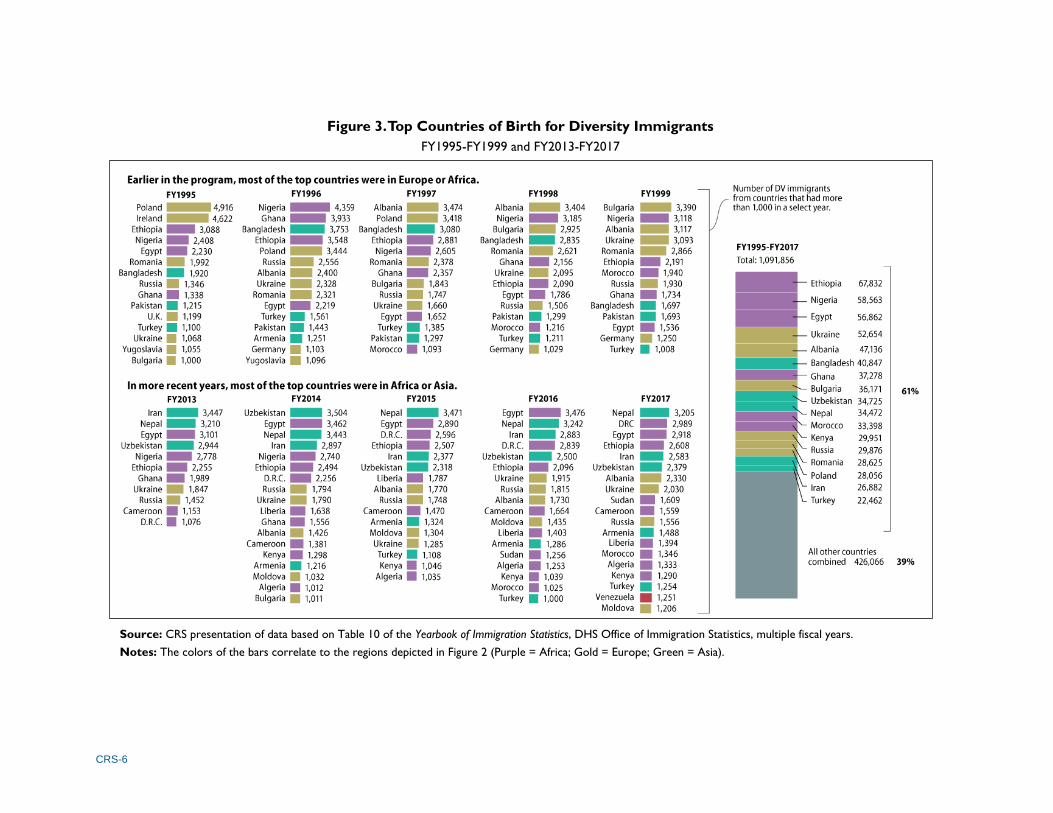
Figure 3 presents the countries from which at least 1,000 DV immigrants were admitted in the
first five years that the program was in full effect (FY1995-FY1999) and the most recent five
years for which data are available (FY2013-FY2017). Early in the program, most of the top
countries were in Europe (particularly Eastern Europe) and Africa. In more recent years, there has
been a shift toward Africa and Asia. Certain countries—such as Ethiopia, Ukraine, and Egypt—
rank high across many years of the program, while others—such as Ireland, Poland, and
Venezuela—are limited to particular periods of time. From FY1995-FY2017, natives of six
countries received at least 40,000 diversity visas in total: Ethiopia (67,832), Nigeria (58,563),
Egypt (56,862), Ukraine (52,654), Albania (47,136), and Bangladesh (40,847).
18 Only immediate relatives, family-based immigrants, and employment-based immigrants count toward the 50,000
total for the preceding five years.
19 INA §203(c)(1).
20 Given the temporary reduction in visas from 55,000 to 50,000, the 7% limit currently yields a maximum of 3,500
rather than 3,850 visas per country.
21 INA §203(c)(1)(F).
22 INA §203(c)(1).

CRS-5
Figure 2. World Region of Birth for Diversity Immigrants
FY1995-FY2017
Source: CRS presentation of data based on Table 10 of the Yearbook of Immigration Statistics, DHS Office of Immigration Statistics, multiple fiscal years.
Note: CRS definitions of regions are based on diversity visa regions from U.S.C. §1153(c)(1)(F) and thus differ from definitions of regions used in the DHS Yearbook of
Immigration Statistics.
CRS-6
Figure 3. Top Countries of Birth for Diversity Immigrants
FY1995-FY1999 and FY2013-FY2017
Source: CRS presentation of data based on Table 10 of the Yearbook of Immigration Statistics, DHS Office of Immigration Statistics, multiple fiscal years.
Notes: The colors of the bars correlate to the regions depicted in Figure 2 (Purple = Africa; Gold = Europe; Green = Asia).

The Diversity Immigrant Visa Program
Congressional Research Service 7
Characteristics of Diversity Immigrants
Regions of Birth
As one would expect, diversity immigrants come from different parts of the world that differ from
the leading immigrant-sending regions. Department of Homeland Security data (Figure 4) reveal
that Africa accounted for 43% of diversity immigrants admitted in FY2017, but 11% of all LPRs
admitted that fiscal year. Europeans made up 7% of all LPRs admitted in FY2017, but 22% of
diversity immigrants. In contrast, Latin America (Mexico, Central America, the Caribbean, and
South America) was the sending region for 43% of all LPRs admitted in FY2017, but provided
4% of the diversity immigrants during that fiscal year. North America (excluding Mexico) and
Oceania account for a small percentage of LPRs admitted by any means.
Figure 4. World Region of Birth for LPRs in FY2017
Diversity LPRs Compared with Total LPRs
Source: CRS presentation of data from Department of Homeland Security, Office of Immigration Statistics,
2017 Yearbook of Immigration Statistics, Table 10.
Notes: In FY2017, 1.1 million LPRs were admitted, of which 51,592 were diversity LPRs. Some LPRs are
admitted in a different fiscal year than the fiscal year in which the visa is issued, which explains why there can be
more than 50,000 diversity LPRs admitted in a given year. Latin America includes Mexico, Central America, the
Caribbean, and South America. North America includes Canada and The Bahamas.
The distribution of LPR admissions and DV admissions from Asia illustrates the impact of the
two-step visa allocation formula, which considers both regional and national admissions levels.
Asia includes many top-sending countries—such as China, India, and the Philippines—for
family- and employment-based LPRs, making it a high-admission region. Yet it also includes
low-admission countries—such as Nepal, Iran, and Uzbekistan—that rank high for their number
of diversity visas. As a result, as Figure 4 illustrates, in FY2017 foreign nationals from Asia
represented a somewhat more equivalent share of the 1.1 million LPRs (38%) in relation to their
share (30%) of diversity LPRs in contrast to the other world regions.
Age and Sex
Diversity immigrants are, on average, younger than other LPRs. Department of Homeland
Security data (see Figure 5) reveal that DV immigrants are more likely to be working-age adults
and their children, and less likely to be over the age of 40 than LPRs overall. Also, the foreign-
born population of the United States is more likely to be in the prime working-age group (i.e.,
ages 25 to 64) than the native-born population, and diversity immigrants have a younger age
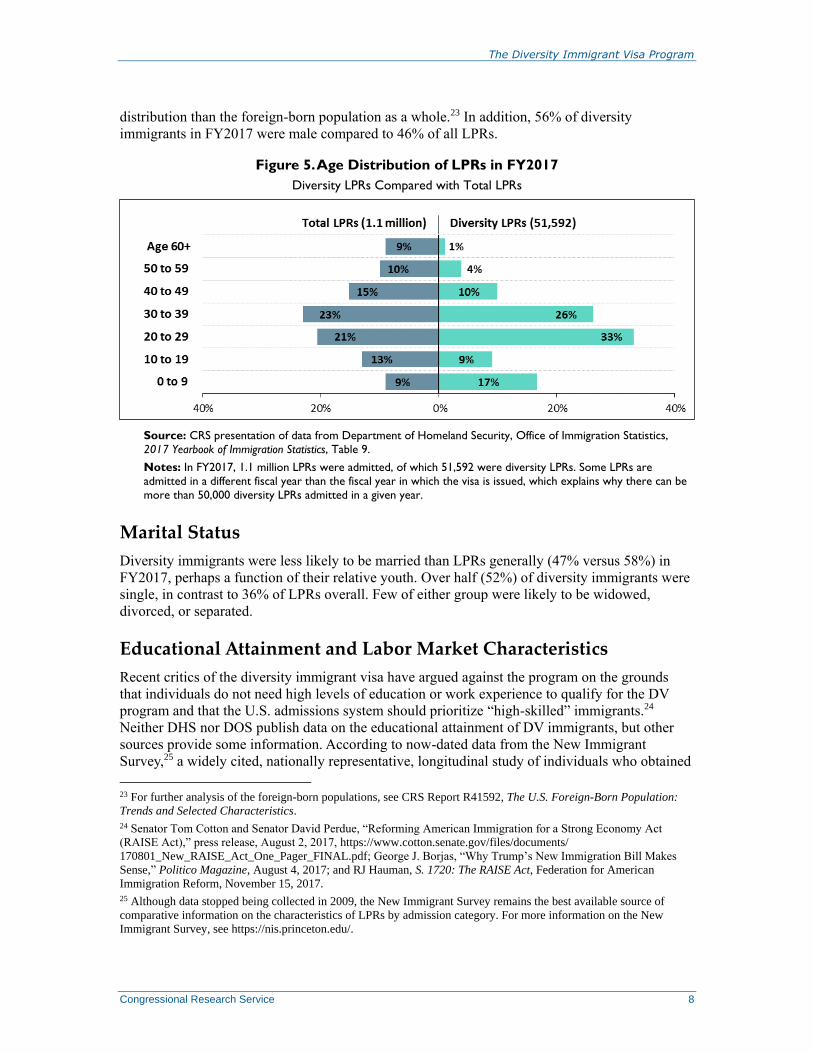
The Diversity Immigrant Visa Program
Congressional Research Service 8
distribution than the foreign-born population as a whole.23 In addition, 56% of diversity
immigrants in FY2017 were male compared to 46% of all LPRs.
Figure 5. Age Distribution of LPRs in FY2017
Diversity LPRs Compared with Total LPRs
Source: CRS presentation of data from Department of Homeland Security, Office of Immigration Statistics,
2017 Yearbook of Immigration Statistics, Table 9.
Notes: In FY2017, 1.1 million LPRs were admitted, of which 51,592 were diversity LPRs. Some LPRs are
admitted in a different fiscal year than the fiscal year in which the visa is issued, which explains why there can be
more than 50,000 diversity LPRs admitted in a given year.
Marital Status
Diversity immigrants were less likely to be married than LPRs generally (47% versus 58%) in
FY2017, perhaps a function of their relative youth. Over half (52%) of diversity immigrants were
single, in contrast to 36% of LPRs overall. Few of either group were likely to be widowed,
divorced, or separated.
Educational Attainment and Labor Market Characteristics
Recent critics of the diversity immigrant visa have argued against the program on the grounds
that individuals do not need high levels of education or work experience to qualify for the DV
program and that the U.S. admissions system should prioritize “high-skilled” immigrants.24
Neither DHS nor DOS publish data on the educational attainment of DV immigrants, but other
sources provide some information. According to now-dated data from the New Immigrant
Survey,25 a widely cited, nationally representative, longitudinal study of individuals who obtained
23 For further analysis of the foreign-born populations, see CRS Report R41592, The U.S. Foreign-Born Population:
Trends and Selected Characteristics.
24 Senator Tom Cotton and Senator David Perdue, “Reforming American Immigration for a Strong Economy Act
(RAISE Act),” press release, August 2, 2017, https://www.cotton.senate.gov/files/documents/
170801_New_RAISE_Act_One_Pager_FINAL.pdf; George J. Borjas, “Why Trump’s New Immigration Bill Makes
Sense,” Politico Magazine, August 4, 2017; and RJ Hauman, S. 1720: The RAISE Act, Federation for American
Immigration Reform, November 15, 2017.
25 Although data stopped being collected in 2009, the New Immigrant Survey remains the best available source of
comparative information on the characteristics of LPRs by admission category. For more information on the New
Immigrant Survey, see https://nis.princeton.edu/.

The Diversity Immigrant Visa Program
Congressional Research Service 9
LPR status in 2003, those who entered as principals26 via the diversity visa category had, on
average, 14.5 years of schooling when they entered the United States, which was higher than
those who were admitted on family-based visas as spouses or siblings of U.S. citizens (13.0 and
11.5 years, respectively), but lower than those who were admitted as principal employment-based
immigrants (15.6 years).27 Similarly, DV immigrants were more likely to be fluent in English than
most family-based immigrants (except for immigrant spouses of native-born U.S. citizens), but
less likely than employment-based immigrants to be fluent in English.28 Using the same data
source, the Migration Policy Institute found that 50% of DV immigrants who entered in 2003 had
a college degree (32% with a bachelor’s and 18% with a graduate degree).29 It is likely that the
educational attainment of recent DV immigrants is higher than it was for those represented in the
New Immigrant Survey, given that more recently arrived immigrants have higher levels of
education overall than their predecessors.30
Government data on other labor market characteristics of DV immigrants are also limited.31
According to the New Immigrant Survey, DV immigrants who entered in 2003 had higher initial32
unemployment rates than employment-based immigrants and those who immigrated as spouses of
U.S. citizens, but lower unemployment rates than those who immigrated as siblings of U.S.
citizens. Four to six years after U.S. entry, however, DV immigrants’ unemployment rates had
dropped significantly and were similar to those of all other groups except employment-based
principals (who had the lowest rates at both initial entry and four to six years later). DV
immigrants’ hourly earnings were similarly situated between that of employment-based
immigrant category (which had the highest earnings) and that of the sibling category (which had
the lowest). Among male immigrants earning wages, those who entered on diversity visas had the
highest percentage growth in real hourly wages between initial entry and re-sampling four to six
years later.33
26 Principals are foreign nationals who apply for a visa and from whom another foreign national (such as a spouse or
child) may derive lawful status under immigration law.
27 Guillermina Jasso and Mark R. Rosenzweig, “Labor Market Outcomes of Family Migrants in the United States: New
Evidence from the New Immigrant Survey,” unpublished; presented at the DHS-OECD Conference on Adapting to
Changes in Family Migration: The Experience of OECD Countries, Washington, DC, November 2013.
28 Guillermina Jasso, “Migration and stratification,” Social Science Research, vol. 40 (2011), pp. 1292-1336.
29Julia Gellatt, “The Diversity Visa Program Holds Lessons for Future Legal Immigration Reform,” Migration Policy
Institute, February 2018.
30 Jynnah Radford and Jens Manueal Krogstad, “Recently Arrived U.S. Immigrants, Growing in Number, Differ from
Long-term Residents,” Pew Research Center, June 3, 2019. In addition, using Census Bureau data, the Migration Policy
Institute found that among recent arrivals (2012-2016) from 19 countries for which at least 25% of new green-card
holders were admitted via diversity visas (from FY2012-FY2016), 50% had a bachelor’s degree or higher, compared to
32% of the overall U.S. population in 2016. Julia Gellatt, “The Diversity Visa Program Holds Lessons for Future Legal
Immigration Reform,” Migration Policy Institute, February 2018.
31 Although DHS publishes annual data on occupations of DV immigrants (see Table 9 of the Yearbook of Immigration
Statistics), the data cannot accurately portray the DV immigrant population because there are many missing values, the
information is self-reported and difficult to categorize, the information reflects past work history not necessarily
occupation in the United States, and the data are published in categories that are too broad to assess educational and
occupational attainment.
32 “Initial” refers to Round 1 of the New Immigrant Survey, in which interviews were conducted approximately four
months, on average, after admission to LPR.
33 Guillermina Jasso and Mark R. Rosenzweig, “Labor Market Outcomes of Family Migrants in the United States: New
Evidence from the New Immigrant Survey,” unpublished; presented at the DHS-OECD Conference on Adapting to
Changes in Family Migration: The Experience of OECD Countries, Washington, DC, November 2013.
The Diversity Immigrant Visa Program
Congressional Research Service 10
Impact of the DV Program on Immigrant Diversity Given its name and the discourse about “new seed” immigrants that preceded the creation of the
diversity visa, the question arises whether the DV program has led to an increase in the diversity
of immigrant flows to the United States. Leading up to and since its enactment, some observers
have noted that, regardless of its name, the DV program was intended to benefit Irish and Italian
constituents who had been negatively affected by the Immigration Act of 1965 that resulted in an
increase in immigration from Asia and Latin America.34 During the transition period after the
program was created (FY1992-FY1994), at least 40% of diversity visas were earmarked for Irish
immigrants, and 92% of diversity visas in FY1994 went to Europeans. Since its full
implementation in FY1995, however, immigrants from a wider range of countries and regions
have entered via the program (see “Regions of Birth” above).
The DV program’s small size relative to total annual immigrant admissions (DV admissions make
up about 5% of annual LPR admissions) limits its impact on the make-up of the immigrant
population. Former Representative Bruce Morrison, who helped create the program, stated in a
2005 hearing that it was not Congress’s intent to diversify the immigrant flow as a whole (“It
could not have possibly done so at the 50,000 number”),35 but rather to add a new pathway for
those who would not be able to enter under the family- or employment-based systems. By that
standard, the program arguably fulfills its objectives, having admitted more than 1 million
immigrants from under-represented countries since FY1995 (see Figure 3).
Another way to assess the program’s impact is to analyze the diversity of annual LPR flows
before and after the DV program was established. Using a measure of diversity called the entropy
index, CRS found that in FY1990, before the DV program was in effect, the diversity of LPR
admissions was 0.52.36 In every year from FY1995 (when the DV program went into full effect)
through FY2017 (the most recent data available), the diversity of annual LPR admissions was
higher than in 1990, ranging from 0.67 to 0.72. In each of those years, the diversity of LPR
admissions not including the DV admissions was lower than it was with DV admissions included
(see the Appendix), indicating that the admission of DV immigrants does increase the diversity
of annual LPR admissions.
A full analysis of the impacts of the DV program on admission numbers would also take into
account individuals whom DV immigrants subsequently sponsor through the family-based
admissions system. Because administrative data on immigrant admissions do not specify these
linkages, this type of direct analysis is not currently possible. However, admissions data suggest
that, at least for Africans, the DV has led to an increase in immigration via the family-based
system (particularly immediate relatives).37 From 1992 to 2007, admissions of Africans based on
34 See, for example, Anna O. Law, “The Diversity Visa Lottery: A Cycle of Unintended Consequences in United States
Immigration Policy,” Journal of American Ethnic History, vol. 21, no. 4 (Summer 2002), pp. 3-29; Walter P. Jacob,
“Diversity Visas: Muddled Thinking and Pork Barrel Politics,” Georgetown Immigration Law Journal, vol. 6, no. 297
(1992), pp. 297-343; Frank H. Retman, “Diversity and Transition Programs Under the Immigration Act of 1990,” in
Understanding the Immigration Act of 1990, American Immigration Lawyers Association Washington, DC, 1991, pp.
117-125; and Charles Gordon, Stanley Mailman, and Stephen Yale-Loehr, Immigration Law and Procedure §§ 40.01
to 40.04, revised annually.
35 Testimony of Bruce A. Morrison, House Committee on the Judiciary, Subcommittee on Immigration, Border
Security, and Claims, Diversity Visa Program, 109th Cong., 1st sess., June 15, 2005, H.Hrg. 109-49 (Washington: GPO,
2005), p. 5.
36 The entropy index (also called the Shannon index) is at its maximum when all groups are present in equal
proportions, in which case the index is equal to one. See Appendix for details.
37 Kevin J. A. Thomas, “What Explains the Increasing Trend in African Emigration to the U.S.?,” International
The Diversity Immigrant Visa Program
Congressional Research Service 11
family sponsorship grew faster than other categories of admissions for Africans, including
diversity, which remained fairly stable over the time period.38 The DV seems to have diversified
the African flow itself by boosting emigration from non-English speaking African countries
(whereas English-speaking African countries have longer histories of U.S. immigration and are
therefore more likely to be the source of sponsoring immigrant family members).39
Selected Legislative Action Legislation related to the Diversity Immigrant Visa has focused largely on eliminating the
program. Bills to eliminate the diversity visa category have been introduced in nearly every
Congress since the program was created and have passed one chamber on more than one
occasion. Most recently, S. 744 in the 113th Congress, a comprehensive immigration reform bill
that the Senate passed in 2013 by a vote of 68 to 32, would have eliminated the program.40 Other
bills introduced in the past would have raised the annual limit of diversity visas or temporarily re-
allocated diversity visas for other purposes. In the 116th Congress, several bills to eliminate the
DV program have been introduced, including H.R. 479, H.R. 2278, S. 1103, and S. 1632. In
contrast, H.R. 3799 would raise the annual diversity visa allocation to 80,000.
Selected Policy Questions As Congress weighs whether to eliminate or revise the diversity visa category, it may want to
consider various policy questions pertinent to this discussion.41
Is it fair to have the diversity visa category when there are family
members and prospective employees who have been waiting for
years for visas to become available?
Given the 3.7 million approved family-based and employment-based petitions waiting for a visa
to become available at the close of FY2018,42 some argue that the 50,000 diversity visas should
be used for backlog reduction in these visa categories.43 Others might observe that the family-
Migration Review, vol. 45, no. 1 (Spring 2011).
38 Ibid.
39 Ibid.
40 One of the bill’s merit-based point systems included points (5 out of 100) for country of origin diversity. For more
information on S. 744, see archived CRS Report R43097, Comprehensive Immigration Reform in the 113th Congress:
Major Provisions in Senate-Passed S. 744.
41 Despite recent debate about the DV program, no hearings have been held on this topic since 2011. Thus, many of the
citations in this section come from hearings held in 2004, 2005, and 2011.
42 U.S. Department of State, Annual Report of Immigrant Visa Applicants in the Family-sponsored and Employment-
based preferences Registered at the National Visa Center as of November 1, 2018. These data do not include nationals
already present in the United States with approved employment-based immigrant petitions who have not yet adjusted
status. USCIS reported that figure to be 395,025 as of April 20, 2018. For more information on the visa queue, see CRS
Report R45447, Permanent Employment-Based Immigration and the Per-country Ceiling.
43 Testimony of Representative Bob Goodlatte, House Committee on the Judiciary, Subcommittee on Immigration
Policy and Enforcement, SAFE for America Act, 112th Cong., 1st sess., April 5, 2011, H. Hrg. 112-27 (Washington:
GPO, 2011); and testimony of Jan Ting, Professor of Law, Temple University, House Committee on the Judiciary,
Subcommittee on Immigration, Border Security, and Claims, Diversity Visa Program and Its Susceptibility to Fraud
and Abuse, 108th Cong., 2nd sess., April 29, 2004, H.Hrg. 108-82 (Washington: GPO, 2004).

The Diversity Immigrant Visa Program
Congressional Research Service 12
based, employment-based, and diversity visa categories are statutorily designed as independent
pathways to LPR status and that the problems of the family-based and employment-based
backlogs should be addressed separately.44 Some also argue that the DV program increases
fairness in the immigration system by making visas available to individuals who would not
otherwise have a chance of obtaining one45 and by discouraging illegal immigration through
expanding access to the legal immigration system.46
Should the United States base admissions decisions on nationality?
Some argue that the diversity visa program reverts to discriminatory national origin quotas, which
Congress eliminated through the 1965 amendments to the Immigration and Nationality Act.47
However, there are other examples of admissions policies that effectively discriminate based on
nationality (e.g., H-2A,48 H-2B,49 E,50 and TN51 nonimmigrant visas, the Visa Waiver Program,52
and the per country caps53 on family- and employment-based LPR admissions, all of which limit
admissions by nationality). Some also argue that admissions decisions should be based on higher
44 For more information on family-based and employment-based immigration, see CRS Report R42866, Permanent
Legal Immigration to the United States: Policy Overview. For information on visa wait times in the employment-based
system and efforts to reduce them, see CRS Report R45447, Permanent Employment-Based Immigration and the Per-
country Ceiling.
45 Testimony of Representative Zoe Lofgren, House Committee on the Judiciary, Subcommittee on Immigration Policy
and Enforcement, SAFE for America Act, 112th Cong., 1st sess., April 5, 2011, H. Hrg. 112-27 (Washington: GPO,
2011); testimony of Representative John Conyers, House Committee on the Judiciary, Subcommittee on Immigration
Policy and Enforcement, SAFE for America Act, 112th Cong., 1st sess., April 5, 2011, H. Hrg. 112-27 (Washington:
GPO, 2011);and testimony of Ambassador Johnny Young, Executive Director, U.S. Conference of Catholic Bishops,
House Committee on the Judiciary, Subcommittee on Immigration Policy and Enforcement, SAFE for America Act,
112th Cong., 1st sess., April 5, 2011, H. Hrg. 112-27 (Washington: GPO, 2011).
46 Testimony of Ambassador Johnny Young, Executive Director, U.S. Conference of Catholic Bishops, House
Committee on the Judiciary, Subcommittee on Immigration Policy and Enforcement, SAFE for America Act, 112th
Cong., 1st sess., April 5, 2011, H. Hrg. 112-27 (Washington: GPO, 2011); and testimony of Senator Charles Schumer,
House Committee on the Judiciary, Subcommittee on Immigration Policy and Enforcement, SAFE for America Act,
112th Cong., 1st sess., April 5, 2011, H. Hrg. 112-27 (Washington: GPO, 2011).
47 Stephen H. Legomsky, “Immigration, Equality and Diversity,” Columbia Journal of Transnational Law, vol. 31, no.
2 (1993); testimony of Mark Krikorian, Executive Director, Center for Immigration Studies, House Committee on the
Judiciary, Subcommittee on Immigration, Border Security, and Claims, Diversity Visa Program, 109th Cong., 1st sess.,
June 15, 2005, H. Hrg. 109-49;testimony of Rosemary Jenks, Director of Government Relations, NumbersUSA, House
Committee on the Judiciary, Subcommittee on Immigration, Border Security, and Claims, Diversity Visa Program,
109th Cong., 1st sess., June 15, 2005, H. Hrg. 109-49; testimony of Jan Ting, Professor of Law, Temple University,
House Committee on the Judiciary, Subcommittee on Immigration, Border Security, and Claims, Diversity Visa
Program and Its Susceptibility to Fraud and Abuse, 108th Cong., 2nd sess., April 29, 2004, H.Hrg. 108-82 (Washington:
GPO, 2004); and Walter P. Jacob, ”Diversity Visas: Muddled Thinking and Pork Barrel Politics,” Georgetown
Immigration Law Journal, vol. 6, (1992), pp. 297-343.
48 For more information, see CRS Report R44849, H-2A and H-2B Temporary Worker Visas: Policy and Related
Issues.
49 Ibid.
50 For more information, see CRS Report R45040, Immigration: Nonimmigrant (Temporary) Admissions to the United
States.
51 Ibid.
52 For more information, see CRS Report RL32221, Visa Waiver Program.
53 For more information, see CRS Report R45447, Permanent Employment-Based Immigration and the Per-country
Ceiling.

The Diversity Immigrant Visa Program
Congressional Research Service 13
levels of education, job experience, and language skills, or family ties to U.S. residents, rather
than country of origin and being selected at random via a lottery.54
In contrast, others argue that the program bolsters equity of opportunity—a quintessential
American value—by providing a pathway for individuals—particularly those from Africa,
Eastern Europe, and the former Soviet Union—who do not have family or employer connections
in the United States.55 Some also argue that the more than one million immigrants who have
moved to the United States as a result of the program have enriched the United States culturally
and economically, and strengthened the nation’s global connections.56 Some also argue that
efforts to end it are racially motivated57 or point out that for most of U.S. history, Africans in
particular had little opportunity to come to the United States other than as slaves.58
Is a lottery the best way to choose applicants for diversity visas?
Some equate the use of a lottery system in the DV program to awarding “green cards” at random
and argue that luck should not come into play in U.S. admissions decisions.59 Others argue that,
given the millions of interested applicants every year, a lottery is a fair method of reducing the
applicant pool because it gives all entrants who meet the program’s qualifications an equal chance
54 Testimony of Representative Bob Goodlatte, House Committee on the Judiciary, Subcommittee on Immigration
Policy and Enforcement, SAFE for America Act, 112th Cong., 1st sess., April 5, 2011, H. Hrg. 112-27 (Washington:
GPO, 2011).
55 Testimony of Bruce A. Morrison, House Committee on the Judiciary, Subcommittee on Immigration, Border
Security, and Claims, Diversity Visa Program, 109th Cong., 1st sess., June 15, 2005, H.Hrg. 109-49 (Washington: GPO,
2005). Testimony of Representative John Conyers, House Committee on the Judiciary, Subcommittee on Immigration
Policy and Enforcement, SAFE for America Act, 112th Cong., 1st sess., April 5, 2011, H. Hrg. 112-27 (Washington:
GPO, 2011). In addition, the House Judiciary Committee Report on H.R. 4300, which led to the enactment of the DV
program, stated “The Committee is convinced that in order to correct ongoing inequities in current law, changes must
be made to further enhance and promote diversity within the present system.” U.S. Congress, House Committee on the
Judiciary, Family Unity and Employment Opportunity Immigration Act of 1990, 101st Cong., 2nd sess., September 19,
1990, H. Rept. 101-723 (Washington: GPO, 1990), p. 48.
56 Patrick Kennedy, “The Labor Economics Case for the Diversity Visa Lottery,” Stanford Law Review, vol. 71
(October 2018), https://www.stanfordlawreview.org/online/the-labor-economics-case-for-the-diversity-visa-lottery/;
Jeremy L. Neufeld, The Diversity Visa: Part of a Merit-Based Immigration System, Niskanen Center, Washington, DC,
October 2018, https://niskanencenter.org/wp-content/uploads/2018/10/Diversity-Visa-and-Skills.pdf; Arun Peter Lobo,
U.S. Diversity Visas are Attracting Africa’s Best and Brightest, Population Reference Bureau, July 2001,
https://www.prb.org/usdiversityvisasareattractingafricasbestandbrightest/; Laura D. Francis, “Diversity Visas are a
Trump Target, and That Could Hurt Employers,” Bloomberg Law, November 14, 2018,
https://news.bloomberglaw.com/daily-labor-report/diversity-visas-are-a-trump-target-and-that-could-hurt-employers-
corrected; Testimony of Representative Zoe Lofgren, House Committee on the Judiciary, Subcommittee on
Immigration Policy and Enforcement, SAFE for America Act, 112th Cong., 1st sess., April 5, 2011, H. Hrg. 112-27
(Washington: GPO, 2011); Testimony of Ambassador Johnny Young, Executive Director, U.S. Conference of Catholic
Bishops, House Committee on the Judiciary, Subcommittee on Immigration Policy and Enforcement, SAFE for
America Act, 112th Cong., 1st sess., April 5, 2011, H. Hrg. 112-27 (Washington: GPO, 2011).
57 Rafael Bernal, “Five things to know about the diversity visa lottery,” The Hill, November 1, 2017. Testimony of
Representative John Conyers, House Committee on the Judiciary, Subcommittee on Immigration Policy and
Enforcement, SAFE for America Act, 112th Cong., 1st sess., April 5, 2011, H. Hrg. 112-27 (Washington: GPO, 2011).
58 Andowah A. Newton, “Injecting Diversity into U.S. Immigration Policy: The Diversity Visa Program and the
Missing Discourse on Its Impact on African Immigration to the United States,” Cornell International Law Journal, vol.
38, no. 3 (2005); Testimony of Bruce A. Morrison, House Committee on the Judiciary, Subcommittee on Immigration,
Border Security, and Claims, Diversity Visa Program, 109th Cong., 1st sess., June 15, 2005, H.Hrg. 109-49
(Washington: GPO, 2005).
59 Testimony of Representative Bob Goodlatte, House Committee on the Judiciary, Subcommittee on Immigration
Policy and Enforcement, SAFE for America Act, 112th Cong., 1st sess., April 5, 2011, H. Hrg. 112-27 (Washington:
GPO, 2011).
The Diversity Immigrant Visa Program
Congressional Research Service 14
to apply for a diversity visa. They also cite the use of a lottery in other over-subscribed visa
categories such as the H-1B and H-2B temporary worker classifications to illustrate that U.S.
immigration policy considers it a reasonable tool.60
Is the diversity visa lottery more vulnerable to fraud and misuse
than other immigration pathways?
Some observers concerned about immigration fraud surrounding the DV program reference a
2003 State Department Office of Inspector General report and a 2007 GAO report which found
fraud vulnerabilities in the DV program.61 They may also cite the 2017 and 2018 complaints filed
by the Department of Justice (DOJ) in two cases seeking the denaturalization of individuals who
had gained admission (in 1997 and 2001) to the United States through the DV program. In the
first case, DOJ filed a complaint to denaturalize four Somali-born diversity visa recipients who
falsely claimed to be a family.62 In the second case, DOJ filed a complaint to denaturalize a
diversity visa recipient who obtained naturalization without having disclosed two prior orders of
removal.63
Those defending the fraud protections of the DV program counter that DOS has since revised the
diversity lottery procedures to address fraud vulnerabilities,64 including a requirement to submit a
recent photograph, the addition of biographic and facial recognition checks to reduce duplicate
entries, a policy requiring the disqualification of entrants who fail to list their spouse and children
on their entries, and technical improvements to limit manipulation of entries by automated bots.65
They also argue that the risk of fraud is not unique to the DV program and refer to the numerous
fraud investigations and arrests of immigrants who entered the United States via other visa
categories66 and the significant resources that DOS commits to fraud prevention for all immigrant
60 For information on the H-1B visa program, see CRS Report R43735, Temporary Professional, Managerial, and
Skilled Foreign Workers: Policy and Trends. For information on the H-2B visa program, see CRS Report R44849, H-
2A and H-2B Temporary Worker Visas: Policy and Related Issues.
61 U.S. Department of State, Office of Inspector General, Memorandum Inspection Report: Diversity Visa Program,
ISP-CA-03-52, September 2003; U.S. Government Accountability Office, Fraud Risks Complicate State’s Ability to
Manage Diversity Visa Program, GAO-07-1174, September 2007, https://www.gao.gov/products/GAO-07-1174.
62 U.S. Department of Justice, “Denaturalization Sought Against Four Somalia-Born Individuals Who Falsely Claimed
to be a Family and Were Admitted to the United States on Diversity Immigrant Visas,” press release, November 6,
2017 https://www.justice.gov/opa/pr/denaturalization-sought-against-four-somalia-born-individuals-who-falsely-
claimed-be-family.
63 U.S. Department of Justice, “Department of Justice Files Complaint to Denaturalize Diversity Visa Recipient Who
Obtained Naturalized Citizenship After Failing to Disclose Two Prior Orders of Removal,” press release, February 15,
2018 https://www.justice.gov/opa/pr/department-justice-files-complaint-denaturalize-diversity-visa-recipient-who-
obtained.
64 U.S. Department of State, “Fraud Warning, Diversity Visa, Program Scammers Sending Fraudulent Emails and
Letters,” https://travel.state.gov/content/travel/en/us-visas/visa-information-resources/fraud.html.
65 U.S. Department of State letter to the Chairman of the Committee on the Judiciary, Charles E. Grassley, December
15, 2017, https://www.judiciary.senate.gov/imo/media/doc/2017-12-19%20State%20Dept.%20to%20CEG%20-
%20Diversity%20Visa%20Program.pdf.
66 The Department of State’s response to the 2007 GAO report on the diversity visa program stated, “It is a sad reality
that all visa categories encounter sham marriages, suspect identities, fraudulent documents, use of agents, and unlikely
stories.” U.S. Department of State, Comments on GAO Draft Report, ‘Border Security: Fraud Risks Complicate State’s
Ability to Manage Diversity Visa Program,’ September 10, 2007, p. 1. USCIS maintains a website for the public to
report immigration fraud, with specific sections for fraud related to marriage, asylum, and the H-1B, H-2B, and EB-5
programs: https://www.uscis.gov/report-fraud. For recent examples, see U.S. Immigration and Customs Enforcement,
“Nearly 100 people indicted, 50 currently in custody in massive Houston-based marriage fraud conspiracy,” press

The Diversity Immigrant Visa Program
Congressional Research Service 15
and nonimmigrant visa applications through its Fraud Prevention Units at posts overseas.67 In
addition, on June 5, 2019, DOS published an interim final rule to require diversity visa entrants to
provide certain information from a valid, unexpired passport on the electronic entry form.68 This
rule is intended to make it more difficult for third parties to submit unauthorized entries, because
third parties are less likely to have individuals’ passport numbers.69
Are there national security reasons to eliminate the diversity visa?
Some assert that the difficulties of performing background checks in many of the countries whose
natives currently qualify for the DV program, as well as broader concerns about terrorism, justify
the elimination of the category.70 Some cite the 2004 warning of the DOS Deputy Inspector
General that the diversity visa lottery “contains significant vulnerabilities to national security”
from state sponsors of terrorism.71 They argue that DV immigrants, by definition, are not required
to have employer or family ties in the United States and thus may be more likely to have
nefarious intent.72 They cite the case of a New Jersey resident responsible for killing eight people
with his rental truck in lower Manhattan in 2017, who had immigrated to the United States from
Uzbekistan on a diversity visa.73 In response to that event, the Trump Administration called on
Congress to immediately terminate the diversity visa lottery program.74
Others respond that immigrants coming to the United States in other immigrant visa categories
are not restricted if they come from these same countries, and further argue that background
checks for national security risks are performed on all prospective immigrants seeking to come to
release, May 13, 2019; U.S. Government Accountability Office, Student and Exchange Visitor Program: DHS Can
Take Additional Steps to Manage Fraud Risks Related to School Recertification and Program Oversight, GAO-19-297,
March 18, 2019, https://www.gao.gov/products/GAO-19-297; U.S. Government Accountability Office, Immigrant
Investor Program: Progress Made to Detect and Prevent Fraud, but Additional Actions Could Further Agency Efforts,
GAO-16-828, September 13, 2016; U.S. Department of Justice, “International Employee Recruiter Sentenced to Two
Years in Prison for Visa Fraud,” July 2, 2014; and U.S. Government Accountability Office, H-2B Visa Program:
Closed Civil Criminal Cases Illustrate Instances of H-2B Workers Being Targets of Fraud and Abuse, GAO-10-1053,
September 30, 2010.
67 U.S. Department of State letter to the Chairman of the Committee on the Judiciary, Charles E. Grassley, December
15, 2017, https://www.judiciary.senate.gov/imo/media/doc/2017-12-19%20State%20Dept.%20to%20CEG%20-
%20Diversity%20Visa%20Program.pdf.
68 U.S. Department of State, Visas, Diversity Immigrants: Interim Final Rule, 84 Federal Register 25989, (June 5,
2019), https://www.federalregister.gov/documents/2019/06/05/2019-11762/visas-diversity-immigrants.
69 Ibid. at 25990, “Why is the Department promulgating this rule?” Some argue that this new rule’s effect will be to
limit lottery entries from low-income individuals and those who live in remote areas or who otherwise have difficulty
obtaining a passport.
70 Testimony of Janice L. Kephart, Center for Immigration Studies, House Committee on the Judiciary, Subcommittee
on Immigration Policy and Enforcement, SAFE for America Act, 112th Cong., 1st sess., April 5, 2011, H. Hrg. 112-27
(Washington: GPO, 2011).
71 U.S. Congress, House Committee on the Judiciary, Subcommittee on Immigration, Border Security, and Claims, The
Diversity Visa Program, and Its Susceptibility to Fraud and Abuse, 108th Cong., 2nd sess., April 29, 2004.
72 Testimony of Janice L. Kephart, Center for Immigration Studies, House Committee on the Judiciary, Subcommittee
on Immigration Policy and Enforcement, SAFE for America Act, 112th Cong., 1st sess., April 5, 2011, H. Hrg. 112-27
(Washington: GPO, 2011).
73 Benjamin Mueller, William K. Rashburn, Al Baker, “Terror Attack Kills 8 and Injures 11 in Manhattan,” The New
York Times, https://www.nytimes.com/2017/10/31/nyregion/police-shooting-lower-manhattan.html; U.S. Congress,
Senate Judiciary Committee, “Grassley Seeks Details on NYC Attacker,” press release, November 1, 2017,
https://www.grassley.senate.gov/news/news-releases/grassley-seeks-details-nyc-attacker.
74 The White House, “National Security Threats—Chain Migration and the Visa Lottery System,” February 1, 2018,
https://www.whitehouse.gov/articles/national-security-threats-chain-migration-visa-lottery-system/.
The Diversity Immigrant Visa Program
Congressional Research Service 16
the United States. They also point to the 2005 DOS Inspector General’s testimony that DOS’s
Bureau of Consular Affairs strengthened the DV program by complying with most of the
recommendations in the OIG’s 2003 report.75 They similarly note the testimony of one of the
creators of the DV Program who contended that “it is absurd to think that a lottery would be the
vehicle of choice for terrorists” and that attention should instead be focused on greater security
risks.76 They also point out that since the creation of the Visa Security Program in 2003, DHS has
aided consular officers in extensively vetting individuals applying for visas.77 They also reference
a 2007 GAO report stating: “We found no documented evidence that DV immigrants from these,
or other, countries posed a terrorist or other threat. However, experts familiar with immigration
fraud believe that some individuals, including terrorists and criminals, could use fraudulent means
to enter or remain in the United States.”78
Are there foreign policy reasons to continue the diversity visa
program?
Citing the millions of diversity visa lottery entries every year from around the world, some argue
that the DV program is an efficient means of boosting American goodwill and “soft power”
abroad, and that a diversity of immigrant origins helps the United States better respond to the
challenges of globalization.79 Some also cite the value of remittances sent by diversity immigrants
to their countries of origin as international development assistance without U.S. government
expense.80 Others argue that the DV program encourages “brain drain” from developing
75 Testimony of DOS Inspector General Howard J. Krongard, House Committee on the Judiciary, Subcommittee on
Immigration, Border Security, and Claims, Diversity Visa Program, 109th Cong., 1st sess., June 15, 2005, H. Hrg. 109-
49 (Washington: GPO, 2005).
76 Testimony of Bruce A. Morrison, House Committee on the Judiciary, Subcommittee on Immigration, Border
Security, and Claims, Diversity Visa Program, 109th Cong., 1st sess., June 15, 2005, H.Hrg. 109-49 (Washington: GPO,
2005).
77 Through the Visa Security Program, special agents from ICE’s Homeland Security Investigations are assigned to
diplomatic posts worldwide to conduct law enforcement visa security activities. For more information, see U.S.
Immigration and Customs Enforcement, Visa Security Program, https://www.ice.gov/visa-security-program#
78 U.S. Government Accountability Office, Border Security: Fraud Risks Complicate State’s Ability to Manage
Diversity Visa Program, GAO-07-1174, September 21, 2007, Highlights.
79 Carly Goodman and Charles Piot, “Diversity visa lottery doesn't make us less safe, but ending it might,” The Hill,
November 29, 2017; Klara Bilgin, “It is called hope! Why we should keep the U.S. diversity immigrant visa program,”
International Policy Digest, November 6, 2017; Onoso Imoagene, “Affecting Lives: How Winning the U.S. Diversity
Visa Lottery Impacts DV Migrants Pre- and Post-Migration,” International Migration, vol. 55, no. 6 (2017), pp. 170-
183; Testimony of Representative John Conyers, House Committee on the Judiciary, Subcommittee on Immigration
Policy and Enforcement, SAFE for America Act, 112th Cong., 1st sess., April 5, 2011, H. Hrg. 112-27 (Washington:
GPO, 2011); Testimony of Ambassador Johnny Young, Executive Director, U.S. Conference of Catholic Bishops,
House Committee on the Judiciary, Subcommittee on Immigration Policy and Enforcement, SAFE for America Act,
112th Cong., 1st sess., April 5, 2011, H. Hrg. 112-27 (Washington: GPO, 2011). “Dissenting Views,” U.S. Congress,
House Committee on the Judiciary, SAFE for America Act, Report to accompany H.R. 704, 112th Cong., 1st sess.,
November 10, 2011, H.Rept. 112-275 (Washington: GPO, 2011); Testimony of Bruce A. Morrison, House Committee
on the Judiciary, Subcommittee on Immigration, Border Security, and Claims, Diversity Visa Program, 109th Cong., 1st
sess., June 15, 2005, H.Hrg. 109-49 (Washington: GPO, 2005).
80B. Ikubolajeh Logan and Kevin J.A. Thomas, “The U.S. Diversity Visa Programme and the Transfer of Skills from
Africa,” International Migration, vol. 50, no. 2 (2012); John Gibson and David McKenzie, “The Economic
Consequences of ‘Brain Drain’ of the Best and Brightest: Microeconomic Evidence from Five Countries,” The
Economic Journal, vol. 122, no. 560 (May 2015).

The Diversity Immigrant Visa Program
Congressional Research Service 17
countries, a concern which acknowledges that many DV immigrants—particularly from Africa—
possess education and skills beyond the minimum requirements for program eligibility.81
Are the reasons that led to establishment of the diversity visa (e.g.,
to stimulate “new seed” immigration) still germane?
Supporters of the DV program argue that it honors the United States’ history as a destination for
enterprising immigrants—the “self-selected strivers”82—who arrive without family ties but with a
desire to work hard for a better life.83 Some point to the present-day preponderance of immigrants
from a handful of countries and argue that the diversity visa fosters new and more varied
migration to counterbalance an admissions system weighted disproportionately to family-based
immigration, which tends to perpetuate the dominance of certain countries. They also point to
wide support for legislation that would remove or raise the 7% per-country limits on family- and
employment-based immigrant admissions,84 which would likely result in further concentration of
immigrant flows from the top sending countries.85 Even with the per-country limits and DV
program in place, the total foreign-born population has become more concentrated in the top ten
source countries compared to 199086 (see “Impact of the DV Program on Immigrant Diversity”).
Others argue that, after almost 30 years, the diversity visa category has run its course.87 They
might cite the countries—such as Pakistan, Brazil, Nigeria, and Bangladesh—that formerly
qualified for the DV program and no longer do due to their increase in admissions, or the growth
81 Onoso Imoagene, “Affecting Lives: How Winning the U.S. Diversity Visa Lottery Impacts DV Migrants Pre- and
Post-Migration,” International Migration, vol. 55, no. 6 (2017), pp. 170-183; B. Ikubolajeh Logan and Kevin J.A.
Thomas, “The U.S. Diversity Visa Programme and the Transfer of Skills from Africa,” International Migration, vol.
50, no. 2 (2012); Arun Peter Lobo, “Unintended Consequences: Liberalized U.S. Immigration Law and the African
Brain Drain,” in The New African Diaspora in North America: Trends, Community Building, and Adaptation, ed.
Kwado Konadu-Agyemang, Baffour K. Takyi, and John Arthur (New York: Lexington Books, 2006), pp. 189-208.
82 Testimony of Bruce A. Morrison, House Committee on the Judiciary, Subcommittee on Immigration, Border
Security, and Claims, Diversity Visa Program, 109th Cong., 1st sess., June 15, 2005, H.Hrg. 109-49 (Washington: GPO,
2005).
83 Testimony of John P. Collins, National Chairman of the American Irish National Immigration Committee, House
Committee on the Judiciary, Subcommittee No. 1, The Effect of the Act of October 3, 1965, on Immigration from
Ireland and Northern Europe, 91st Cong., 1st sess., December 10, 1969, H. Hrg. 91-28 (Washington: GPO, 1970).
84 On July 10, 2019, H.R. 1044, the Fairness for High-Skilled Immigrants Act, passed the House by a vote of 365-65. It
would remove the 7% per country limit for employment-based immigrant visas and raise the per-country limit to 15%
for family-based immigrant visas.
85 For more information on the 7% per-country caps, see CRS Report R42866, Permanent Legal Immigration to the
United States: Policy Overview.
86 In 1990, 52.2% of foreign-born individuals were born in the top ten countries of origin for the U.S. foreign-born
population; in 2017, that number was 57.4%. At the same time, a higher proportion of the foreign born are concentrated
in the bottom ten source countries (0.42% in 2017 compared to 0.21% in 1990). These statistics have been used to
argue both for and against keeping the DV program in place. Those who support the DV program argue that without it,
the foreign-born population would be dominated to an even greater extent by the high-admission countries. Those
against it argue that the increased concentration at the top shows that the DV program does not actually diversify the
foreign-born population and therefore should be eliminated, but this argument does not take into account what would
have happened if the DV program had not been in place. See “Impact of the DV Program on Immigrant Diversity”
above.
87 Institute of the Electrical and Electronic Engineers, Promoting Diversity through the STEM Visa: A White Paper on
High-Skill Immigration Reform, 2012, https://ieeeusa.org/wp-content/uploads/2017/07/IEEEUSAWP-
DiversityVisa2012.pdf; and Laura D. Francis, “Diversity Visas are a Trump Target, and That Could Hurt Employers,”
Bloomberg Law, November 14, 2018, https://news.bloomberglaw.com/daily-labor-report/diversity-visas-are-a-trump-
target-and-that-could-hurt-employers-corrected.

The Diversity Immigrant Visa Program
Congressional Research Service 18
in immigration from Africa, Eastern Europe, and parts of Asia as an indication that the need for
“new seed” immigration has been met.88 Others counter that these trends indicate that the
program is meeting its goals and should be continued. They further argue that in many countries
around the world, the diversity visa remains the only accessible avenue for immigrating to the
United States.89
88 Ibid.
89 Testimony of Representative John Conyers, House Committee on the Judiciary, Subcommittee on Immigration
Policy and Enforcement, SAFE for America Act, 112th Cong., 1st sess., April 5, 2011, H. Hrg. 112-27 (Washington:
GPO, 2011); and testimony of Bruce A. Morrison, House Committee on the Judiciary, Subcommittee on Immigration,
Border Security, and Claims, Diversity Visa Program, 109th Cong., 1st sess., June 15, 2005, H.Hrg. 109-49
(Washington: GPO, 2005).

The Diversity Immigrant Visa Program
Congressional Research Service 19
Appendix. Entropy Index Methodology and Results The entropy index (also called the Shannon index)90 is a measure of the diversity of a population.
Diversity can be defined as the “relative heterogeneity of a population.”91 It is at its maximum
when all subpopulations are present in equal proportions (for the purposes of this report, when
each country of birth receives an equal number of LPR admissions). The formula for the entropy
index is
where H is the entropy index, k is the country-of-origin group, and P is the proportion of the total
from each country-of-origin group. The index can be standardized by dividing by its maximum,
log K. Doing so results in a range of 0 (for the case where all of the population is in one
subpopulation) to 1.0 (for the case where all subpopulations are present in equal proportions).
For this report, the standardized entropy index was calculated by year for country of birth of total
LPR admissions, LPR admissions minus DV admissions, and DV admissions. This was
calculated after creating a standardized list of countries across all years so that K was held
constant. As shown in Figure A-1, between FY1995 and FY2017, the entropy index varied, but in
all years the index was higher when DV LPRs were included.
Figure A-1. Entropy Index (Standardized) by LPR Type
FY1995-FY2017
Source: CRS calculations of LPR admissions data from DHS Yearbook of Immigration Statistics, Table 10, various
years.
90 The entropy index used in this report is explained in greater detail in Michael J. White, “Segregation and Diversity
Measures in Population Distribution,” Population Index, vol. 52, no. 2 (Summer 1986).
91 Ibid, p. 199.

The Diversity Immigrant Visa Program
Congressional Research Service R45973 · VERSION 4 · UPDATED 20
Author Information
Jill H. Wilson
Analyst in Immigration Policy
Acknowledgments
Mariam Ghavalyan, Research Assistant in CRS’s Domestic Social Policy Division, provided research and
graphics assistance, and Amber Wilhelm, Visual Information Specialist in CRS’s Office of Publishing,
provided graphics assistance for this report.
Disclaimer
This document was prepared by the Congressional Research Service (CRS). CRS serves as nonpartisan
shared staff to congressional committees and Members of Congress. It operates solely at the behest of and
under the direction of Congress. Information in a CRS Report should not be relied upon for purposes other
than public understanding of information that has been provided by CRS to Members of Congress in
connection with CRS’s institutional role. CRS Reports, as a work of the United States Government, are not
subject to copyright protection in the United States. Any CRS Report may be reproduced and distributed in
its entirety without permission from CRS. However, as a CRS Report may include copyrighted images or
material from a third party, you may need to obtain the permission of the copyright holder if you wish to
copy or otherwise use copyrighted material.