
The Diversity-Bandwidth Trade-off - funginstitute.berkeley.edu · Diversity-Bandwidth Trade-off 91...
83
The Diversity-Bandwidth Trade-off Author(s): Sinan Aral and Marshall Van Alstyne Reviewed work(s): Source: American Journal of Sociology, Vol. 117, No. 1 (July 2011), pp. 90-171 Published by: The University of Chicago Press Stable URL: http://www.jstor.org/stable/10.1086/661238 . Accessed: 01/11/2011 10:10 Your use of the JSTOR archive indicates your acceptance of the Terms & Conditions of Use, available at . http://www.jstor.org/page/info/about/policies/terms.jsp JSTOR is a not-for-profit service that helps scholars, researchers, and students discover, use, and build upon a wide range of content in a trusted digital archive. We use information technology and tools to increase productivity and facilitate new forms of scholarship. For more information about JSTOR, please contact [email protected]. The University of Chicago Press is collaborating with JSTOR to digitize, preserve and extend access to American Journal of Sociology. http://www.jstor.org
Transcript of The Diversity-Bandwidth Trade-off - funginstitute.berkeley.edu · Diversity-Bandwidth Trade-off 91...

The Diversity-Bandwidth Trade-offAuthor(s): Sinan Aral and Marshall Van AlstyneReviewed work(s):Source: American Journal of Sociology, Vol. 117, No. 1 (July 2011), pp. 90-171Published by: The University of Chicago PressStable URL: http://www.jstor.org/stable/10.1086/661238 .Accessed: 01/11/2011 10:10
Your use of the JSTOR archive indicates your acceptance of the Terms & Conditions of Use, available at .http://www.jstor.org/page/info/about/policies/terms.jsp
JSTOR is a not-for-profit service that helps scholars, researchers, and students discover, use, and build upon a wide range ofcontent in a trusted digital archive. We use information technology and tools to increase productivity and facilitate new formsof scholarship. For more information about JSTOR, please contact [email protected].
The University of Chicago Press is collaborating with JSTOR to digitize, preserve and extend access toAmerican Journal of Sociology.
http://www.jstor.org

90 AJS Volume 117 Number 1 (July 2011): 90–171
� 2011 by The University of Chicago. All rights reserved.0002-9602/2011/11701-0003$10.00
The Diversity-Bandwidth Trade-off1
Sinan AralNew York University
Marshall Van AlstyneBoston University
The authors propose that a trade-off between network diversity andcommunications bandwidth regulates access to novel informationbecause a more diverse network structure increases novelty at a costof reducing information flow. Received novelty then depends onwhether (a) the information overlap is small enough, (b) alters’ top-ical knowledge is shallow enough, and (c) alters’ knowledge stocksrefresh slowly enough to justify bridging structural holes. Socialnetwork and e-mail content from an executive recruiting firm showthat bridging ties can actually offer less novelty for these reasons,suggesting that the strength of weak ties and structural holes dependon brokers’ information environments.
Where does one find novel information? Most modern sociological theorysuggests that we find novelty through weak ties that span structural holes.A more precise question, however, is where does one find the most novel
1 We are grateful to Lada Adamic, Wayne Baker, Erik Brynjolfsson, Ron Burt, PaulCarlile, Emilio Castilla, Jerry Davis, Stine Grodal, Jon Kleinberg, Michael Macy, ErolPekoz, Damon Phillips, Arun Sundararajan, Ezra Zuckerman, and seminar partici-pants at the Workshop on Information Systems Economics, the Sunbelt Social Net-works Conference, the International Conference on Network Science, the Academy ofManagement Conference, Harvard University, New York University, MassachusettsInstitute of Technology, Stanford University, the London School of Economics, andthe University of Chicago for valuable comments, and to the National Science Foun-dation (Career Awards IIS-9876233 and IIS-0953832 and grant IIS-0085725), Micro-soft, Cisco Systems, France Telecom, and the MIT Center for Digital Business forgenerous funding. We are also greatly indebted to Tim Choe, Petch Manoharn, LevMuchnik, Cyrus-Charles Weaver, and Jun Zhang for their tireless research assistance.Direct correspondence to Sinan Aral, Stern School of Business, New York University,New York, New York 10027. E-mail: [email protected]

Diversity-Bandwidth Trade-off
91
information per unit of time? That is, at what rate do we receive noveltyfrom our different social contacts? We should get information with greaternovelty from across a structural hole but at a slower rate because inter-actions with bridging ties are weaker, are less frequent, and have lowerbandwidth. Although we should get information with less novelty froma cohesive tie, we should receive novelty at a faster rate because the tieis stronger, the interaction more frequent, and the bandwidth higher.Contrary to conventional wisdom, this stronger tie can in certain circum-stances provide greater total novelty over time. Since strong high-band-width ties are more likely in cohesive networks and weak low-bandwidthties more likely in sparse networks, the two factors affecting the rate atwhich we find novel information—structural diversity and channel band-width—trade off, creating countervailing effects on access to novel in-formation. We develop a theory of this trade-off and the contingencies ofsocial structure and information environments that affect access to nov-elty. We test this theory on observed information content flowing throughorganizational e-mail networks. Results suggest that information benefitsto brokerage depend on the information environments in which brokersfind themselves and that we should embrace a more nuanced view ofhow information flows in social networks.
THE DIVERSITY-BANDWIDTH TRADE-OFF
The assumption that network structure influences the distribution of in-formation and knowledge in social groups (and thus characteristics of theinformation to which individuals have access) underpins a significantamount of theory linking social structure to outcomes such as wages, jobplacement, promotion, creativity, innovation, political success, social sup-port, productivity, and performance (Simmel [1922] 1955; Moreno, Jen-nings, and Sargent 1940; Granovetter 1973; Baker 1990; Burt 1992, 2004;Padgett and Ansell 1993; Uzzi 1996, 1997; Hansen 1999, 2002; Podolny2001; Reagans and Zuckerman 2001; Van Alstyne and Bulkley 2004; Aral,Brynjolfsson, and Van Alstyne 2007a, 2007b). The central argument inthis body of theory is that structurally diverse networks—networks lowin cohesion and structural equivalence and rich in structural holes—pro-vide access to diverse, novel information. Contacts maintained throughweak ties are typically unconnected to other contacts and therefore morelikely to “move in circles different from our own and thus [to] have accessto information different from that which we receive” (Granovetter 1973,p. 1371). These ties are “the channels through which ideas, influence, orinformation socially distant from ego may reach him” (p. 1371). As Burt(1992, p. 16) argues, “everything else constant, a large, diverse network

American Journal of Sociology
92
is the best guarantee of having a contact present where useful informationis aired.” Since information in local network neighborhoods tends to beredundant, structurally diverse contacts that reach across structural holesshould provide channels through which novel information flows (Burt1992).
Novel information is thought to be valuable because of its local scarcity.Actors with scarce information in a given network neighborhood are betterpositioned to broker opportunities, make better decisions, and apply in-formation to problems that are intractable given local knowledge (e.g.,Hargadon and Sutton 1997; Reagans and Zuckerman 2001; Burt 2004;Rodan and Gallunic 2004; Van Alstyne and Brynjolfsson 2005; Lazer andFriedman 2007). Access to novel information should increase the breadthof individuals’ absorptive capacity, strengthen the ability to communicateideas across a broader range of topics to a broader audience, and improvepersuasion and the ability to generate broader support from subject matterexperts (Cohen and Levinthal 1990; Simon 1991; Reagans and McEvily2003; Rodan and Galunic 2004). For these reasons, networks rich in struc-tural diversity are thought to confer “information benefits” or “visionadvantages” that improve performance by providing access to diverse andnovel perspectives, ideas, and information (Burt 1992).
These are the central inferences on which structural theories of bro-kerage and the strength of weak ties rest, and it is therefore intuitive toexpect that having structurally diverse networks—networks low in co-hesion and structural equivalence and rich in structural holes—is posi-tively associated with receiving more diverse information and more totalnonredundant information and that access to more diverse informationand more total nonredundant information is positively associated withindividual performance.2 Over the last four decades, these two inferenceshave guided the way sociologists think about information flow in net-works, motivating and informing thousands of empirical studies of in-
2 We define the “structural diversity” or “network diversity” of an ego network as theextent to which it is low in “constraint” as defined by Burt (1992, p. 55), low in theaverage structural equivalence of alters, and rich in structural holes. We define the“structural cohesion” or “network cohesion” of an ego network as the extent to whichit is high in “constraint” as defined by Burt, low in structural holes, and high in theaverage structural equivalence of alters. Various phrases have been used in the liter-ature to describe analogous concepts including ego density (or sparseness) and networkembeddedness. These definitions and their measures are highly correlated with andchange in proportion to network diversity and network cohesion. We chose to use thephrases “network diversity” and “network cohesion” because they are the ones mostcommonly used in the literatures to which we refer (e.g., Burt 1992, 2004, 2005; Reagansand McEvily 2003). At times we also use the terms “embeddedness” and “constraint”to highlight that our arguments draw from and contribute to literatures that also usethose terms (e.g., Granovetter 1985; Burt 1992; Uzzi 1996, 1997).

Diversity-Bandwidth Trade-off
93
novation (Hargadon and Sutton 1997; Burt 2004), academic output (Swed-berg 1990), team performance (Reagans and Zuckerman 2001), theformation of industry structures (Walker, Kogut, and Shan 1997), thesuccess of social movements (Centola and Macy 2007), and labor marketoutcomes (Montgomery 1991).
However, theoretical arguments linking network diversity to novel in-formation have thus far focused almost exclusively on the relative diver-sity of the information received across different alters in a network, gen-erally overlooking the diversity and volume of novel information flowingwithin each tie or channel over time. Although dense, cohesive networkstend to deliver information that is redundant across channels (with eachalter providing the same or similar information), relationships in suchnetworks are also typically stronger (Granovetter 1973; Burt 1992), im-plying greater frequency of interaction and richer information flows. Met-aphorically, such ties have greater channel bandwidth. In contrast, weakties offer less communication (Granovetter 1973; Burt 1992), and infor-mation should flow through them less frequently (Granovetter 1973), withlower complexity and detail (Uzzi 1997; Hansen 1999).3
Two mechanisms explain why socially distant weak ties should interactand communicate less: exposure and motivation. As contacts interact morefrequently, they are more likely to be exposed to and to spend time witheach others’ contacts in cohesive embedded networks (Granovetter 1973).Cohesive embedded networks also motivate their members to interactwith one another: social pressure, cognitive balance, and the developmentof cooperative norms in embedded relationships inspire us to devote timeand energy to communicating with embedded ties (Heider 1958; Newcomb1961; Granovetter 1973, 1985, 1992; Coleman 1988).4 In relationships
3 We use the phrase relationship “channel bandwidth” carefully and in preference tothe more inclusive “strong tie” to draw attention to the volume of literal communicationshared among people. In general, stronger ties imply greater bandwidth, but the addedprecision allows us to also handle unusual cases. For example, individuals may havestrong ties to parents based on emotional affinity, trust, or caregiving yet be observedto communicate more frequently with coworkers who are less emotionally significantin their lives. We draw out the importance of focusing on information diversity andvolume, observed over actual communications channels, in developing the theoriesthat follow. The strength of a tie may be a noisy reflection of the bandwidth of thechannel. More detailed empirical work on the relationship between the strength of tiesand the bandwidth of channels may provide evidence on how the social function ofrelationships (Podolny and Barron 1997; Burt 2000) is associated with the nature ofthe conduits of information flow they enable. We encourage this work, although wedo not focus on it here.4 As Granovetter (1973, p. 1362) notes, homophily could also explain closure withouta causal relationship between the strength of ties and closure, breaking the causalrelationship between structural diversity and the rate and volume of interaction (ifindividuals interact more with similar others because they are similar and not because

American Journal of Sociology
94
among firms in New York’s apparel industry, for example, Uzzi (1997)reports that socially distant weak ties were “non-repeated . . . one shotdeals” in which communication occurred much less frequently, whereasembedded ties were characterized by “constant communication.” Similarevidence has been found in research and development (R&D) organiza-tions (Allen 1977; Reagans and Zuckerman 2001; Reagans and McEvily2003), innovation labs (Hargadon and Sutton 1997), job seeking (Grano-vetter 1973), familial relations (Coleman 1988), and relationships betweenfirms’ business units (Hansen 1999) and across firms (Helper, MacDuffie,and Sabel 2000). Given evidence suggesting the prevalence of weak tiesin structurally diverse networks and the likelihood of increased infor-mation flow in cohesive networks due to motivation and exposure, thebandwidth of communication channels should be lower in diverse net-works. Thus, network diversity and channel bandwidth should trade offsuch that greater network diversity is associated with lower channel band-width (see fig. 1).
All else equal, greater channel bandwidth should also provide accessto more diverse information and more total nonredundant informationbecause interaction through rich high-bandwidth channels tends to bemore detailed, cover more topics, and address more complex, interde-pendent concepts. While unconnected alters may have more novel infor-mation, the amount of useful novel information delivered to ego shouldincrease in cohesive networks, in which both the volume of the infor-mation flow and the motivation to share relevant novel information aregreater. As Reagans and McEvily (2003, p. 262) argue, “It is easier totransfer all kinds of knowledge [codified and tacit, simple and complex]in a strong tie and more difficult to transfer all kinds . . . in a weak tie.”If many interdependent ideas must be applied together, then throughputmust increase to transfer them all. Even the seminal work favoring weakties as a source of novel information foreshadows in a footnote that “onepossible model would expect information to flow through ties in propor-tion to time expended in interaction; this model would predict much moreinformation via strong ties” (Granovetter 1973, p. 1372). We consider howjust such a model can reform conventional wisdom regarding the rela-tionship between social structure and access to novel information.
they are connected in embedded relationships). However, prior empirical work onfriendship formation demonstrates that exposure and preferences both play highlysignificant roles in tie formation (see Currarini, Jackson, and Pin 2009, 2010). Thediversity-bandwidth trade-off can therefore be viewed to a significant extent as a causaltheory, with structure driving the rate and volume of interaction. Exposure and mo-tivation are likely to play an even bigger role in our setting because we study workrelationships in which, as we explain in our empirical analyses, recruiters seek diversityconstrained by exposure in order to perform well at work.

Diversity-Bandwidth Trade-off
95
Fig. 1.—The diversity-bandwidth trade-off. As structural diversity increases, channelbandwidth decreases.
SOCIAL PROCESSES AND ACCESS TO NOVEL INFORMATION
While most current theories describe networks as channels, pipes, bridges,or conduits (e.g., Podolny 2001; Centola and Macy 2007), characterizecontent as “attributes of nodes” (e.g., Rodan and Galunic 2004), and im-plicitly assume that information flows in proportion to the distribution ofinformation in the network (e.g., Granovetter 1978; Schelling 1978;Kempe, Kleinberg, and Tardos 2003),5 information exchange is funda-mentally a social process and knowledge transfer a discretionary activity(Reagans and McEvily 2003; Wu et al. 2004). A connection to any indi-vidual affords the possibility of receiving the information she possessesbut by no means guarantees it. As Wu et al. point out, “information isselective and passed by its host only to individuals the host thinks wouldbe interested in it” (2004, p. 328). In competitive settings, information isoften withheld even when it is known to be of interest to others. Networksare not simply pipes into different pools of information; they reflect thenature of the relationships, interactions, and information exchanges takingplace among those they connect.
Although the channel, pipe, bridge, and conduit metaphors are common
5 Two core models have emerged to explain the diffusion of influence and contagion.Threshold models posit that individuals adopt innovations (or receive information) aftersurpassing their own private “threshold” (e.g., Granovetter 1978; Schelling 1978). Cascademodels posit that each time an adjacent individual adopts, the focal actor adopts withsome probability that is a function of their relationship (e.g., Kempe et al. 2003). Whileboth models assume information transmission between adopters and nonadopters, theyrarely specify the nature of the information or the conditions under which exchangestake place. Rather, the diffusion process is typically tested under various assumptionsabout the distribution of thresholds or dyadic adoption probabilities in the population.In fact, as Kempe et al. explain, “The fact that [thresholds] are randomly selected isintended to model our lack of knowledge of their values” (2003, p. 2).
American Journal of Sociology
96
in sociology, such terminology hides restrictive assumptions about networkstructure preceding information flow. Human interactions in fact definesocial network structure. So, to avoid problems with channel metaphors,we argue first from social processes, using social distance as synecdochefor less frequent interaction, lower mutual commitment, and limited un-derstanding. Speaking metaphorically, social distance is inverse band-width. Five social mechanisms, summarized in table 1, then explain whygreater channel bandwidth and lower social distance should increase ac-cess to novel information.
Social capital.—In relationships characterized by strong cohesive ties,contacts are likely to be more willing to share information. Diverse, low-bandwidth ties are typically opportunistic, functional, and only selfishlycooperative (Granovetter 1973; Uzzi 1997), whereas cohesive, embeddedties are typically characterized by greater intimacy, trust, emotional in-tensity, and mutual confiding (Coleman 1988; Uzzi 1996). Social cohesionmotivates individuals to devote time and effort to communicating withand assisting one another (Granovetter 1985; Coleman 1988). The de-velopment of cooperative norms (Granovetter 1992) and the subsequentreduction in competition in cohesive networks are likely to increase knowl-edge transfer between individuals (Szulanski 1996; Argote 1999; Reagansand McEvily 2003). Social capital in strong high-bandwidth relationshipsgives ego the standing to seek information and alter the comfort to offerinformation. It also engenders the levels of trust that allow contacts toshare both sensitive and nonsensitive information. A weak-tie relationshipwill typically provide access to only the nonsensitive information. Simi-larly, in weak-tie relationships, alters will be less willing to devote timeand effort to information exchanges with ego, who will get less in returnfor placing burdensome requests and will receive less total novel infor-mation.
In the context of job seeking, Granovetter (1973, p. 1371) nicely setsup the open empirical question we seek to address: “A natural a prioriidea is that those with whom one has strong ties are motivated to helpwith job information. Opposed to this greater motivation are the structuralarguments I have been making: those to whom we are weakly tied . . .will have access to information different from that which we receive.”Social capital, developed through prior information sharing, enables egoto seek and encourages alters to share more novel information in high-bandwidth relationships. Indeed, a weak-tie alter is likely to have alreadypushed such valuable information to his or her own strong ties beforehonoring weak-tie requests from ego. Whether strong or weak ties delivermore total novel information therefore remains a critical open question.
Transactive memory.—Wegner (1987) introduced the term “transactivememory” to describe intimate relationships in which individuals have

TA
BL
E1
Impl
icat
ion
so
ft
he
Div
ersi
ty-
Ban
dw
idt
hT
rad
e-o
fff
orA
cces
st
oN
ove
lIn
form
ati
on
Th
eory
Ego
’sP
ersp
ecti
veA
lter
’sP
ersp
ecti
ve
Soc
ial
cap
ital
(e.g
.,P
utn
am19
95;
Bu
rt19
92;
Tsa
ian
dG
hos
hal
1998
;L
in20
02)
Gre
ater
inti
mac
y,tr
ust
,re
cip
roci
ty,
and
coop
erat
ion
inco
hes
ive-
hig
h-b
and
wid
thn
etw
ork
sm
akes
ego
mor
ew
illin
gto
req
uest
nov
elin
form
atio
nfr
omal
ter
Gre
ater
inti
mac
y,tr
ust
,re
cip
roci
ty,
and
coop
erat
ion
inco
hes
ive-
hig
h-b
and
wid
thn
etw
ork
sm
ake
alte
rm
ore
wil
ling
tosh
are
nov
elin
form
atio
nw
ith
ego
Tra
nsa
ctiv
em
emor
y(e
.g.,
Weg
ner
1987
;L
ian
get
al.
1995
)
Aw
aren
ess
ofw
hom
toas
kan
dw
hat
toas
kfo
rin
coh
e-si
ve-
hig
h-b
and
wid
thn
etw
ork
sen
able
seg
oto
req
ues
tn
ovel
info
rmat
ion
mor
eef
fect
ivel
yfr
omal
ter
Aw
aren
ess
ofw
hat
tov
olu
nte
erin
coh
esiv
e-h
igh
-ban
d-
wid
thn
etw
ork
sen
able
sal
ter
tov
olu
nte
erre
lev
ant
nov
elin
form
atio
nm
ore
effe
ctiv
ely
toeg
oS
earc
htr
ansf
er(e
.g.,
Han
sen
1999
)C
lose
,fr
equ
ent
inte
ract
ion
and
tigh
tco
up
lin
gin
coh
e-si
ve-
hig
h-b
and
wid
thn
etw
ork
sm
akes
ego
bet
ter
able
toco
mp
reh
end
and
thus
rece
ive
nov
elin
form
atio
nfr
omal
ter
Clo
se,
freq
uen
tin
tera
ctio
nan
dti
ght
cou
pli
ng
inco
he-
siv
e-h
igh
-ban
dw
idth
net
wor
ks
mak
eal
ter
able
toex
-p
ress
and
thus
tran
sfer
nov
elin
form
atio
nto
ego
Kn
owle
dge
crea
tion
(e.g
.,U
zzi
1996
,19
97;
Ob
stfe
ld20
05;
Uzz
ian
dS
pir
o20
05)
Em
bed
ded
ness
and
coh
esio
nen
able
ego
tofi
ndsy
ner
gies
and
con
nect
ion
sb
etw
een
her
info
rmat
ion
and
alte
r’s
info
rmat
ion
inor
der
toge
ner
ate
new
idea
san
dn
ewn
ovel
info
rmat
ion
Em
bed
ded
ness
and
coh
esio
nen
able
alte
rto
find
syn
er-
gies
and
con
nect
ion
sb
etw
een
her
info
rmat
ion
and
ego’
sin
form
atio
nin
orde
rto
gen
erat
en
ewid
eas
and
new
nov
elin
form
atio
nH
omop
hily
(e.g
.,B
lau
1986
;U
zzi
1997
;H
elp
eret
al.
2000
;M
cPh
erso
net
al.
2001
)
Alt
ers
are
mor
elik
ely
toh
ave
mu
tual
inte
rest
sw
ith
ego
acro
ssa
wid
erv
arie
tyof
top
ics
insp
irin
gm
ult
ifac
eted
com
mu
nica
tion
and
acce
ssto
mor
eof
the
dif
fere
ntd
i-m
ensi
ons
ofal
ters
’in
form
atio
n
Ego
ism
ore
likel
yto
hav
em
utu
alin
tere
sts
wit
hal
ters
acro
ssa
wid
erv
arie
tyof
top
ics
insp
irin
gal
ter
toco
m-
mu
nica
tem
ore
ofth
ed
iffe
ren
td
imen
sion
sof
thei
rin
-fo
rmat
ion

American Journal of Sociology
98
organized into mutually determined and understood domains of expertise.Although developing a relationship can be understood “as a process ofmutual . . . disclosure . . . it can also be [understood] as a necessaryprecursor to transactive memory” (1987, p. 200). As relationships develop,contacts become more familiar with each other’s areas of interest andexpertise. Knowing who knows what makes embedded relationships withhigh-bandwidth communication channels a more likely source of novelinformation.
Discovery of remote information is more likely when ego knows whomto ask for it (Wegner 1987). Stronger ties are more familiar with eachother’s catalog of knowledge, inspiring information exchanges on a largernumber and wider variety of topics. The greater the social distance be-tween two people, the lower the likelihood that ego knows what an alterknows, limiting ego’s ability to seek information effectively and alters’ability to proactively offer relevant novel information to ego. Knowingwho has the most information about job opportunities or where to seekfunding facilitates the search process even if the information to be trans-ferred is itself not known beforehand. In Uzzi’s study of the fashionindustry, knowing who possesses information on how to get the best pricefor wool precedes discovery of that price and where it is offered. Buildingcatalogs of expertise requires prior shared experience, which is a char-acteristic of strong-tie relationships (Wegner 1987; Liang, Moreland, andArgote 1995; Cramton 2001). More frequent interaction also gives altersa broader catalog of ego’s knowledge and interests, making it easier forthem to volunteer relevant nonredundant information. For example, altersare more likely to volunteer information about potentially relevant jobopportunities if they know that ego is looking for a job and in whichindustry ego is interested in working.
Search transfer.—While transfer of simple news might be efficient inweak ties, that is not the case for complex information on multiple in-terdependent topics. Weak ties are inherently limited in the set of novelinformation they can transfer to the subset of “simple” novel information(Hansen 1999). As Reagans and McEvily (2003) demonstrate, strong em-bedded ties create a favorable social environment for information transfer:“Cohesion around a relationship can ease knowledge transfer by decreas-ing the competitive and motivational impediments that arise, specificallythe fact that knowledge transfer is typically beneficial for the recipientbut can be costly for the source” (Reagans and McEvily 2003, p. 242).Awareness of a previously unknown software module can pass easily viaan infrequent social contact. But transferring that module together withinterdependent instructions and contextual information requires a levelof expert assistance that implies a helping relationship (Hansen 1999).
Information exchanges in embedded relationships are likely to be more

Diversity-Bandwidth Trade-off
99
detailed and also more holistic in the sense that they convey not onlydiscrete bits of information but also meta information about how eachdiscrete idea connects with others, as well as discussion of the conceptualimplications of each idea. However, structurally diverse bridging ties areusually formed for a particular purpose and in order to deliver informationon a single or a limited number of dimensions. Such information is likelyto be more discrete, summarizing a number of dimensions in a singlesignal, such as the price of goods in an economic relationship. Uzzi (1997)describes how representatives of firms engaged in embedded relationshipsgo beyond exchanging price information to also discussing more detailedimplications concerning profit margins, fashion sense, and strategy. Peoplecan absorb ideas more easily on topics matching their expertise (Cohenand Levinthal 1990), and cohesive embedded ties, in effect those withhigh bandwidth, have been shown to produce higher rates of complexknowledge transfer in contract R&D (Reagans and McEvily 2003) andproduct innovation firms (Hansen 1999). Bandwidth therefore affects theability to share complex forms of novelty.
Knowledge creation.—Creating new knowledge also injects more nov-elty into the network and often requires rich interaction through thickcommunication channels. Songwriters and artists benefit from communityembeddedness as their ideas feed on one another. In creative works suchas country music production, Lingo and O’Mahoney (2010) found twoforms of brokerage: one as a strategic actor extracting advantage fromnetwork position (the traditional view) and the other as a relational expertconnecting others to promote innovation (the creative view). They describe“nexus work” as the iterative process of integrating, synthesizing, andtransforming the collective inputs of others. Likewise, in Broadway mu-sicals a team combines initially separate ideas through a creative processof brainstorming, problem solving, and collaboration (Uzzi and Spiro2005). Such idea-generating collaborations are rarely socially remote. Theycommonly arise in apprenticeship relationships, for example, between pro-fessors and graduate students or between colleagues interacting on thebasis of common interests (Lave and Wegner 1991). Obstfeld (2005) findsthat brokers who bring together disconnected alters, in effect increasingthe frequency of their interactions, promote innovation more than thosewho keep their contacts separated. Successful innovation teams coordinatetheir knowledge and actions, intentionally pushing new knowledge to allteam members. For instance, initiating design changes to the set of a stageplay requires collaborators to update team members quickly and often.These updates to one’s social network bring people together and coor-dinate group action, representing a “union” strategy. In the context of anautomotive engineering firm, this strategy was more conducive to trust,cooperation, transfers of complex knowledge, and ultimately idea gen-

American Journal of Sociology
100
eration than “disunion” strategies that kept contacts apart (Obstfeld 2005).In Obstfeld’s setting, new social knowledge generated from prolongedcontact between engineers helped create innovation, demonstrating howdense cohesive social networks can outperform sparse networks withstructural holes.6
Homophily.—Homophily among those in cohesive embedded networksmakes them more likely to share mutual interests across a wider varietyof topics because of similarities across a greater number of distinct socialdimensions (Blau 1986; McPherson, Smith-Lovin, and Cook 2001).Though overlapping interests across a greater number of dimensions havebeen theorized to create redundancy, they can in fact inspire more mul-tifaceted communication, creating opportunities for high-bandwidthchannels to deliver more of the different dimensions of information knownto each contact. We are more likely to be inspired to cover more topicalground in conversation with those with whom we share a greater numberof common interests. Individuals connected by cohesive ties are morelikely to engage each other more deeply and to participate in cooperativeactivities such as joint problem solving, so they are more likely to discovertopics of mutual interest in their discussions and to subsequently continueto both generate and exchange information on those additional dimensions(Uzzi 1997; Helper et al. 2000).
In summary, these five social phenomena (social capital, transactivememory, search transfer, knowledge creation, and homophily) imply thatas the bandwidth of a channel increases, the topical diversity of infor-mation and the total volume of novel information flowing through itshould also increase. We therefore expect that channel bandwidth is pos-itively associated with receiving more diverse information and more totalnonredundant information.
INFORMATION ENVIRONMENTS AND THE CONTINGENCY OFVISION ADVANTAGES
If network diversity and channel bandwidth trade off and if both provideaccess to novel information, then determining which provides greaterinformation advantages will depend on the information environments inwhich brokers find themselves. Although a diverse network of weak, low-bandwidth ties (“diverse-low bandwidth”) can provide access to morenovel information than a cohesive network of strong, high-bandwidth ties(“cohesive-high bandwidth”), the converse is also possible and in manycases more likely. Three characteristics of information environments
6 We are indebted to one of our reviewers for this helpful insight.

Diversity-Bandwidth Trade-off
101
should affect the degree to which bandwidth delivers more novel infor-mation to ego. First, the more information overlaps among people in thenetwork, the less structural diversity should confer information advan-tages. Second, the larger the total size of the topic space, the more im-portant bandwidth becomes in accessing these multiple topics. Third, themore information changes over time, the more cohesive-high-bandwidthnetworks should deliver novel information.
In the following section we translate our theory into probabilistic ex-pectations of access to novel information in different information envi-ronments. These expectations describe how social motivations to exchangemore information and the likelihood of greater redundancy in denselyconnected groups affect the likelihood of receiving novel information fromboth diverse-low-bandwidth and cohesive-high-bandwidth networks.Each alter has information on certain topics (represented by numbers),which together constitute the set of topics or ideas that exist in the net-work. The numbers of arrows between actors represent the bandwidthsof communication channels (which parallels tie strength).
Consider two actors, Alex (A) and Beth (B), depicted in figure 2, panel1. Alex has weak, low-bandwidth ties to unconnected alters Isaac (i) andJake ( j), whereas Beth has strong, high-bandwidth ties to alters Kim (k)and Lauren (l), who connect to each other via strong ties. Alex’s ties toIsaac and Jake are more likely to be low bandwidth because he is lesslikely to have sufficient social capital with them to inspire them to sharemore, he is less likely to know what they know (as are they to know whathe needs), they are likely to have less in common and thus are less likelyto share information, and they are less likely to create new knowledgetogether. However, because all three are socially distant, they are morelikely to have different information from each other. This scenario cap-tures classic arguments about network structure and information accessas well as the diversity-bandwidth trade-off.
Alex’s weak-tie contacts, being separated by a structural hole, have noredundant information, whereas Beth’s strong-tie contacts, being stronglyconnected, have redundant information. To demonstrate the importanceof the diversity-bandwidth trade-off in even extreme settings that are leastfavorable to our theory, we invoke the most conservative version ofGranovetter’s original forbidden triad argument. Although, according toGranovetter, the strong ties connecting B-k and B-l imply that the k-l tie“is always present (whether strong or weak)” (1973, p. 1363), we representthe k-l tie as a strong connection and assume complete information ho-mogeneity between Kim (k) and Lauren (l). This same basic scenario holdsacross all panels 1–6, yet Kim and Lauren frequently provide more novelinformation to Beth than Isaac and Jake provide to Alex because theyfurnish a greater overall volume of information. Owing to the high-band-

Fig. 2.—The diversity-bandwidth trade-off under varying information environments: (1)a base case, (2) as the strength of the trade-off increases, (3) as the information overlap ofalters increases, (4) as the topic space increases, and (5) and (6) as the refresh rate of alters’information increases.

Diversity-Bandwidth Trade-off
103
width nature of their relationships, they are more willing and have moreopportunities to provide Beth more samples of their respective informationspaces. In social terms, whether this extra volume contains extra noveltyper unit of information is a trade-off that depends on (i) how much theinformation of alters overlaps with one another, (ii) the total number oftopics in alters’ catalog of knowledge, and (iii) the rate at which infor-mation in the network refreshes or updates.
The classic weak-tie, structural-hole argument sets the baseline in panel1, which represents weak- and strong-tie strengths by two arrows andthree arrows, respectively. Each alter has information on four topics (i,k, and ), but only Alex’s contacts have nol p {1, 2, 3, 4} j p {5, 6, 7, 8}overlap in their information. Alex’s weak, low-bandwidth ties to Isaacand Jake allow him to secure two samples each from their topic spaces.Beth secures more information samples from Kim and Lauren than Alexdoes from his alters because of the social processes that characterize theirrespective information exchanges. Beth has more opportunities to talkwith her alters, who are more motivated to share information because ofthe social pressure, cooperative norms, and cognitive balance that havedeveloped in their embedded relationships. Those factors also make Kimand Lauren less likely to withhold information and more likely to proac-tively offer information to Beth.
Assuming that alters do not offer the same piece of information twice,Alex samples two nonredundant items from Isaac and two nonredundantitems from Jake, receiving four total novel pieces of information overall.Beth, however, will receive three novel pieces of information from herfirst contact Kim, but there is only a probability that she will receive1
4a novel piece of information in her subsequent exchange with Lauren. IfBeth’s first draw from Lauren is novel, Lauren has no more nonredundantinformation to share.7 Assuming redundant information on her first ex-change (which occurs with probability ), Beth then has a one in three3
4chance of receiving nonredundant information on her second exchangewith Lauren. Over these two exchanges, Beth receives novel informationwith cumulative probability (as given by ). If Beth has1 1 3 1 1� # p2 4 4 3 2not received new information by the third exchange (which occurs withprobability ), she retains a chance of receiving nonredundant infor-1 1
2 2mation in her last exchange. The total chance of Beth receiving novelinformation over three exchanges is (given by3 1 3 1 1 1� # � # p4 4 4 3 2 2
7 Since social people talk, it could be the case that Beth tells Lauren what she learnedfrom Kim in order that Lauren shares her nonredundant information in a single draw.But then Beth would already have used her three units of bandwidth. Allowing moretargeted requests in a transactive memory sense (Wegner 1987) complicates the analysisbut in no way invalidates the basic bandwidth trade-off.

American Journal of Sociology
104
). The total number of nonredundant pieces of information Beth expects34to receive is thus given that she started by receiving three nonredun-33 4dant items from Kim.
If each bit of novel information represents a job opening, then Alex’ssocial network spans eight different opportunities and he can expect toreceive news about four of them. In contrast, Beth’s social network in-cludes only four opportunities and she can expect, on average, to receivenews of fewer opportunities in a given time interval. This is due to theheterogeneity of information among Alex’s contacts and demonstrates thevalue of structural diversity in delivering novel information. Even thoughAlex has fewer opportunities to exchange information with his contacts,he still expects to receive more novel information because his social net-work bridges nonoverlapping information pools separated by structuralholes.
In panel 2, we examine the same scenario but raise the bandwidth ofBeth’s ties by one and reduce the bandwidth of Alex’s ties by one. Thepower of bandwidth becomes immediately apparent. While we maintainthe same conservative assumptions about the distribution of informationacross alters (Kim and Lauren have completely redundant information,whereas Isaac and Jake have completely nonredundant information), theincreased bandwidth of Beth’s ties is enough to provide her with moreexpected novel information. In fact, the example is trivial. While Alexexpects to receive two pieces of nonredundant information (one each fromIsaac and Jake), Beth expects to receive four pieces of novel informationsimply because the bandwidth of her communication channels with Kimand Lauren is higher. In fact, the relative benefit of bandwidth is basedon a model that is socially conservative. In their study of R&D transfer,Reagans and McEvily (2003) found that cohesion improves the willingnessand ability to transfer information by reducing competition and costs ofsharing. Here, Isaac and Jake might have preferred to hoard their uniqueinformation either to use themselves or because alters in their positionsare more likely to compete, whereas Kim has less incentive to keep fromBeth what Lauren can also share.
In panel 3, we relax the conservative assumption of complete infor-mation heterogeneity between Isaac and Jake by introducing partial over-lap in their information sets.8 Although Kim and Lauren continue to havecompletely homogeneous information, the scenario again tips in favor ofchannel bandwidth: the cohesive-high-bandwidth ties yield more novelinformation. The only difference in this panel is that Jake’s informationoverlaps with Isaac’s information by 50%. Alex still receives two novel
8 The same insight follows exactly if we instead decrease the overlap of Kim andLauren rather than increase that of Isaac and Jake.
Diversity-Bandwidth Trade-off
105
pieces of information from Isaac but then, on contact with Jake, receivesnovel information only with probability . Assuming that Alex receives1
2no novel information during his first interaction with Jake (which occurswith symmetric probability ), he will receive novel information during1
2his second interaction with probability as two of the three remaining2
3information items available from Jake are novel. If however, he doesreceive novel information in his first interaction, the chance of receivingnovel information on his second interaction falls to . The total probability1
3of Alex receiving novel information over both draws from Jake is 1 (basedon interaction one: � interaction two: ). So, Alex expects1 1 1 1 2# � #2 2 3 2 3to receive three total items of novel information, one from Jake and twofrom Isaac. As Beth’s likelihood of receiving novel information has notchanged relative to panel 1 (three and from Kim and Lauren, respec-3
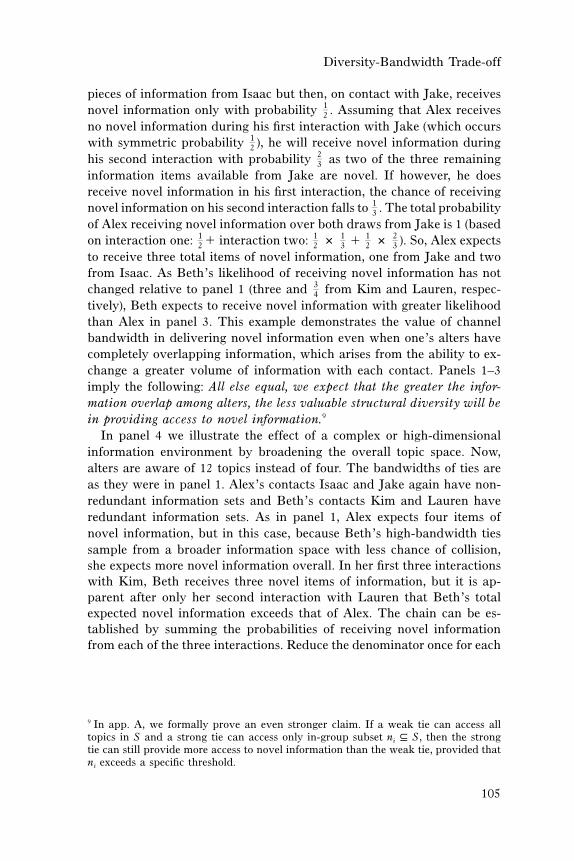
4tively), Beth expects to receive novel information with greater likelihoodthan Alex in panel 3. This example demonstrates the value of channelbandwidth in delivering novel information even when one’s alters havecompletely overlapping information, which arises from the ability to ex-change a greater volume of information with each contact. Panels 1–3imply the following: All else equal, we expect that the greater the infor-mation overlap among alters, the less valuable structural diversity will bein providing access to novel information.9
In panel 4 we illustrate the effect of a complex or high-dimensionalinformation environment by broadening the overall topic space. Now,alters are aware of 12 topics instead of four. The bandwidths of ties areas they were in panel 1. Alex’s contacts Isaac and Jake again have non-redundant information sets and Beth’s contacts Kim and Lauren haveredundant information sets. As in panel 1, Alex expects four items ofnovel information, but in this case, because Beth’s high-bandwidth tiessample from a broader information space with less chance of collision,she expects more novel information overall. In her first three interactionswith Kim, Beth receives three novel items of information, but it is ap-parent after only her second interaction with Lauren that Beth’s totalexpected novel information exceeds that of Alex. The chain can be es-tablished by summing the probabilities of receiving novel informationfrom each of the three interactions. Reduce the denominator once for each
9 In app. A, we formally prove an even stronger claim. If a weak tie can access alltopics in S and a strong tie can access only in-group subset , then the strongn P Si
tie can still provide more access to novel information than the weak tie, provided thatexceeds a specific threshold.ni

American Journal of Sociology
106
draw and reduce the numerator once for each success.10 On average,receiving three pieces of novel information from Kim and from Lauren,12 4Beth expects to do better than Alex on the basis of a larger topic space.The difficulty of transferring complex information makes bandwidth evenmore important in this case. If three units of interdependent informationneed to be transferred together to be useful, then Beth’s benefit of band-width is understated. Alex may not be able to use the two pieces of novelinformation he receives from Isaac and Jake if he has insufficient contextto understand them. Likewise, social capital theory also predicts that Bethis better off. It is easier to ask for one item than for 10. Alex must bewilling to ask for more and his contacts must be willing to share, butBeth is better positioned to both ask and receive. Further, creativity isoften higher when there are more ideas to work with (Weitzman 1998),implying that the value of novel information is higher in the presence ofa greater volume of novelty. Panel 4 implies that, all else equal, the broaderthe topic space, the more valuable channel bandwidth will be in providingaccess to novel information.
Thus far, we have presented the diversity-bandwidth trade-off in purelystatic contexts in which colleagues’ information does not change. A morerealistic scenario involves dynamic updating. As we become aware ofnews concerning our workplaces, our friends, and changes in the worldaround us, we revise our understanding of basic facts as well as complexknow-how. The advance of Internet technologies, mobile service appli-cations for personalized news, and the “always on” nature of online socialnetworks can in fact accelerate the pace at which our knowledge of theworld refreshes. Information simultaneously obsolesces as it updates. En-vironmental turbulence inspires adaptation (Galbraith 1974; March 1991),and changing information makes learning from experience more difficult(Weick 1979). As prior knowledge becomes obsolete more quickly, ac-cessing timely information requires gathering news more frequently.
Reinterpreting a classic example (Granovetter 1973), suppose thathighly desirable job openings fill quickly but that undesirable jobs remainopen longer. Information drawn from weak ties about the jobs currentlyavailable can sample disproportionately from undesirable jobs. By the
10 The complete chain is given as
9 9 8 9 8 7 9 3 8 3 9� # � # # � # # � #( ) ( ) ( ) ( )12 12 11 12 11 10 12 11 10 12 11
3 9 8 3 2 9 9� # # � # # p .( ) ( )12 11 10 12 11 10 4
As shown in app. A, a more straightforward approach is to use the mean of thehypergeometric distribution, which gives equivalently .3(12 � 3)/12 p 9/4

Diversity-Bandwidth Trade-off
107
time a weak tie delivers information about a desirable job, informationabout that job is already well known to competing alters whose strongties update them more quickly. If information about jobs refreshes oftenor obsolesces quickly, frequent communication is essential to getting newsbefore others. This speaks directly to the issue of the information refreshrate relative to channel bandwidth. High-bandwidth ties are more likelyto deliver time-critical information and are thus more likely to delivernonredundant information in turbulent information environments. Panels5 and 6 therefore introduce time.
To reestablish the weak-tie/structural-hole baseline, panel 5 shows thatdiverse low-bandwidth ties can provide more novel information. In bothpanels 1 and 5, Beth’s contacts’ knowledge overlaps whereas Alex’s doesnot; Beth has bandwidth 3 and Alex has bandwidth 2; and informationsets span a topic space of 4. But, in panel 5, information refreshes. Dashedlines separate changes in information. Since panel 5 spans two periods( and ), expected access to novel information exactly doubles that ofT T1 2
panel 1. Panel 6, however, shows a more turbulent environment. Updatesoccur twice per period as shown, for example, by the fact that Isaac’sinformation set changes from {1, 2, 3, 4} to {5, 6, 7, 8} within period .T1
Although Beth might learn of three news items (among 1, 2, 3, or 4) fromKim, by the time she checks with Lauren, the context has already changedsuch that she learns three new items (from among 5, 6, 7, or 8). This givesher six novel pieces of information per period, a full dozen across bothperiods.11 High-bandwidth ties can therefore provide more access to newinformation in more turbulent information environments, despite beingmore structurally constrained.
In a slow-moving information environment such as roof repair (a roofneeds repair roughly once every 20 years), a roofer’s network of weakties is sufficient to deliver information about potential jobs (Podolny 2001).But in turbulent environments such as stock market arbitrage, minuteadvantages can be critical and people must shift from exploiting whatthey know to exploring what they do not know quickly and often (March
11 Although this assumes sequential attention across alters in a given period, the maininsights do not change, assuming that ego attends simultaneously to all alters. To modelsimultaneous draws without replacement on a given alter, use a hypergeometric dis-tribution and then estimate expected nonoverlap. Given complete nonoverlap, thenumbers for ego A are unchanged across all six panels. For B in panel 1, total expectednovelty from each alter is 15/8 for a total of 15/4 over both alters. In the sequentialdraw, Lauren had much higher novelty than Kim, by virtue of getting attention first,namely three versus 3/4. In panel 6, simultaneous draws over each alter provide
for a total of 9.75. This is lower than the sequential calculation, but higher39/8bandwidth still provides 1.75 more expected novel units of information than structuraldiversity. Thus, whether using simultaneous or sequential draws, primary intuitionsdo not change in these examples.

American Journal of Sociology
108
1991). In communications terms, this means interacting more frequentlyand increasing communication channel bandwidth. For transactive mem-ory systems, change renders the catalog of others’ knowledge obsolete,and a person searches less effectively without updates. In the creativityliterature, the chance at Schumpeterian recombination of ideas rises asindividuals are exposed to change and design changes must be sharedwith teammates more quickly for projects to be successful (Obstfeld 2005).Constantly changing information implies that ego does not need to changechannels to receive incremental novelty because what their contacts haveto tell them is itself changing, refreshing, or updating. The greater thebandwidth of communication channels, the more of this newly updatedinformation will be passed on to ego in a timely manner. We thereforeexpect that, all else equal, the higher the refresh rate, the more valuablechannel bandwidth will be in providing access to novel information.
Since stylized examples depend heavily on assumptions and initial con-ditions, we extend these illustrations by developing a more general ana-lytical model of our arguments in appendix A. We formally prove therethat each of the factors previously discussed can make either a diverse-low-bandwidth network or a cohesive-high-bandwidth network more at-tractive in terms of access to novel information. The key intuition isconveyed by representing “bias” as the tendency of cohesive ties to sharethe same redundant elements from a topic vector. When the disadvantageof bias swamps the advantage of bandwidth, the diverse-low-bandwidthtie provides greater chance of encountering novel information. But whenthe advantage of bandwidth swamps the disadvantage of bias, theconstrained-high-bandwidth tie is preferable. While a range of interme-diate cases span these extremes, conditions exist (depending on bias, band-width, and the number of links already present) in which a person willalways prefer one or the other type of tie (for a summary of hypotheses,see table 2).
The diversity-bandwidth trade-off implies that vision advantages arecontingent on the different social settings and information environmentsin which brokers are situated. In turbulent social settings or intellectualdomains where conditions change rapidly and news, ideas, and methodsare frequently updated, greater channel bandwidth is more useful fordelivering novel information. However, if information possessed by altersis relatively static, structural diversity becomes the more important factor.In highly heterogeneous information environments in which local networkneighborhoods possess distinct, nonoverlapping information, bandwidthis less beneficial than structural diversity. But when the overlap of in-formation among alters is more pronounced, the opposite is true. In en-vironments with multiple complex ideas, bandwidth delivers greater nov-elty, but when the topic space is limited, structural diversity trumps

Diversity-Bandwidth Trade-off
109
TABLE 2Summary of Hypotheses
Domain andHypothesis Hypothesized Relationship
Diversity-bandwidthtrade-off:
H1a . . . . . . . . . . . . . . . Network diversity is positively associated with receiving morediverse information and more total nonredundant information
H1b . . . . . . . . . . . . . . . Network diversity is associated with lower channel bandwidthH1c . . . . . . . . . . . . . . . . Channel bandwidth is positively associated with receiving more
diverse information and more total nonredundant informationH2a . . . . . . . . . . . . . . . The greater the information overlap among alters, the less valua-
ble structural diversity will be in providing access to novel in-formation
H2b . . . . . . . . . . . . . . . The broader the topic space, the more valuable channel band-width will be in providing access to novel information
H2c . . . . . . . . . . . . . . . . The higher the information refresh rate, the more valuable chan-nel bandwidth will be in providing access to novel information
Performance effects:H3 . . . . . . . . . . . . . . . . . Access to nonredundant and diverse information is positively as-
sociated with individual performance
bandwidth. These contingencies are critical to understanding brokeragebecause the configurations that produce them are among the most prev-alent in human social networks. Since structurally diverse strong ties andcohesive embedded weak ties are both relatively rare (Granovetter 1973;Burt 1992; Watts and Strogatz 1998; Watts 1999; Centola and Macy 2007),the contingent scenarios are the most useful for explaining relationshipsbetween networks, information flow, and performance outcomes in a va-riety of social contexts (see fig. 3).
Unfortunately, the vast majority of empirical work on networks andinformation advantage is “content agnostic” (Hansen 1999, p. 83). Whilethere is abundant evidence linking social structure to performance (e.g.,Burt 1992, 2004, 2007; Reagans and Zuckerman 2001; Sparrowe et al.2001; Cummings and Cross 2003; Cummings 2004; Aral et al. 2007a,2007b), empirical data on information flowing through networked rela-tionships is rarely used to validate information-based theories of brokerageand the strength of weak ties. As Burt (2008, p. 253) notes, “Empiricalsuccess in predicting performance with network models has far out-stripped our understanding of the way information flow in networks isresponsible for network effects. A cluster of network concepts emergedin the 1970s on the idea that advantage results from connections withmultiple, otherwise disconnected, groups and individuals. The hubs in asocial network were argued to have advantaged access to informationand control over its distribution. . . . However, the substance of advan-

American Journal of Sociology
110
Fig. 3.—Granovetter’s (1973) original forbidden triad argument implies that the twoconfigurations that most strongly predict access to novel information (diverse–high-band-width ties and cohesive-low-bandwidth ties) are also the least likely to be observed in realsocial settings, making the contingent scenarios the most relevant. Cohesive-high-bandwidthnetworks deliver the most novel information when the refresh rate of information is high,when the topic space is large, and when information overlap between alters is low.
tage, information, is almost never observed.” According to Burt (2005, p.60), “The next phase of work is to understand the information-arbitragemechanisms by which people harvest the value buried in structural holes.. . . More generally, the sociology of information will be central in thework.”12 We therefore test our arguments by combining social networkand performance data with direct observation of the information contentflowing through e-mail communication.
12 A significant body of related work in political sociology, research on social movementsand on cognition and network structure, has developed around networks and language.Some of this work examines discourse in markets (White 2000), dialogic processes(Steinberg 1999), framing practices (McLean 1998), civic talk (Eliasoph 1996), andcommitment styles (Lichterman 1996) in social movements, as well as sociolinguisticapproaches to conversational dynamics in social movements (see the work of HarrisonWhite and Ann Mische; e.g., White 1995; Mische and White 1998; Mische 2000). Workon cognition in networks (e.g., Krackhardt 1987, 1990) has examined content from theperspective of what is perceived in and through social networks, and conversation-analytic approaches have been used to examine the structure of interaction (e.g., Goff-man 1961; Drew and Heritage 1992; Gibson 2005). We build on this related work byfocusing specifically on the diversity and total novelty of information exchanged be-tween actors in networks over time in order to examine the information mechanismsthat explain returns to brokerage.

Diversity-Bandwidth Trade-off
111
DATA AND METHODS
Research Setting
We collected e-mail messages exchanged by employees of an executiverecruiting firm with 14 offices across the United States, analyzing theirtopical content to determine the relative heterogeneity and novelty of theinformation passed between the employees. Previous research by Wu etal. (2004) and Kossinets and Watts (2006, 2009) validates the usefulnessof e-mail data in characterizing and analyzing social networks in firmsand academic institutions. We extend that research by combining analysisof the social structure of e-mail communication with an evaluation of theinformation content of messages. We argue that combining analysis ofmessage content and communication topology will open new avenues foranswering questions at the heart of the sociology of information. Althoughinformation flow can be documented in a limited way with ethnographicand survey data (Baker 1984; Reagans and McEvily 2003; Obsfeldt 2005),direct observation of information content and its variation across andmovement through networks is critical to accurately testing information-based theories of social capital (Burt 2008).
By analyzing e-mail communication patterns and message content, weare able not only to match network structures to the subject matter ofthe content flowing through them but also to avoid inaccuracy in re-spondents’ recall of their social networks and communication. Most priorresearch elicits network data from respondents who have difficulty re-calling their networks (e.g., Bernard, Killworth, and Sailor 1981), partic-ularly when contacts are socially distant (Krackhardt and Kilduff 1999).The inaccuracy of respondent recall and the bias associated with recallat social distance create inaccurate estimates of network variables (Kum-basar, Romney, and Batchelder 1994), forcing most empirical studies toartificially limit the boundary of estimated networks to local areas aroundrespondents (e.g., Reagans and McEvily 2003). Such artificial boundariescreate estimation challenges due to the sensitivity of network metrics tothe completeness of data (Marsden 1990). If important areas of the net-work are not captured, estimates of network positions can be biased. Wetherefore took several steps to ensure a high level of participation in thestudy (described below). As 87% of eligible employees agreed to partici-pate, we collected e-mail network and content data with nearly full cov-erage of the firm. There are no statistical differences between participantsand those who opted out of the study on dimensions of relevance to theanalysis.13
13 We performed F-tests to compare performance levels of those who opted out withthe performance levels of those who remained, but they did not show statistically

American Journal of Sociology
112
As the company’s work was geographically dispersed and instant mes-saging was rarely used, recruiters relied on e-mail as their primary meansof communication.14 As one recruiter put it, “staff spend an enormous
significant differences: F(Sig): Rev02 2.295 (.136), Comp02 .837 (.365), multitasking.386 (.538). We also calculated the indegrees of missing nodes based on the choices ofthe nonmissing nodes. We found that the indegrees (insize) of missing nodes were lowerthan those of nonmissing nodes (average monthly mean indegree nonmissing p 14.7;average monthly mean indegree missing p 10.7); however, t-tests reveal no statisticallysignificant differences between the two (t-statistic p �1.38; ). Size is the rawP ! .172number of contacts and degree is weighted by message counts. We thank an anonymousreviewer for this suggested robustness check.14 Most employees we talked to reported that e-mail was their primary means of com-munication. Although we did not collect phone conversation data or face-to-face in-formation exchanges, e-mail provides the best means of assessing codified communi-cations between employees at this firm. That said, we took several steps to investigatewhether use of the phone and use of e-mail were similar in the organization. First,our survey had asked employees to report “the number of people they communicatedwith on a typical day (a) by phone and (b) by e-mail.” A Pearson correlation returneda .31 correlation, which was significant at the level, indicating that the sizesP ! .001of e-mail networks and phone networks were likely to be similar. However, this didnot give us insight into network structure, so we went further. Second, we found threereasonable proxies for phone communication between two people. First, our interviewsindicated that recruiters most often spoke with their project team members (more thanother recruiters in the firm) both by e-mail and by phone. We therefore decided thatif two people worked on the same project together, it would be reasonable to expectthat they would talk on the phone. In fact, the more projects they worked on together,the more likely they would exchange a greater volume of phone traffic. We thereforeconstructed a network of “project cowork,” which measured as the strength of a tiethe number of projects two individuals in the firm had worked on together. Ourinterviews also indicated that work was frequently regionally clustered (in other words,candidates typically looked for jobs in the same region they were currently workingin). We therefore conjectured that if two recruiters worked in the same region, theywould be more likely to seek information from one another over the phone aboutcandidates who might be interested in a specific job in that region. Similarly, if theyworked in the same office, they may have reasons specific to the social workings ofthe office to exchange a higher volume of phone communication. We therefore alsocreated two new matrices in which dyads shared a tie if they “worked in the sameregion” or “worked in the same office.” We took these three new matrices, “projectcowork,” “same region,” and “same office,” and used Quadratic Assignment Procedure(QAP) to assess QAP correlations and to analyze correlations via Multiple RegressionQAP (MRQAP) with a pooled matrix of the total e-mail exchanged between thesesame individuals (a single pooled matrix of e-mail traffic over all 10 months of data).If these proxies for greater phone traffic (project cowork, same region, and same office)were highly correlated with the e-mail adjacency matrix, then the e-mail networkshould approximate the phone network. The e-mail network was significantly corre-lated with the project cowork network (.426, ) and with the same regionP ! .001network (.359, ), which makes it likely that the e-mail network mirrors theP ! .001phone network relatively well given that our interviews indicated that recruiters talkedmore frequently via phone and e-mail to others on the same project or in the sameregion. Correlation with the same office network was slightly lower (.148, ),P ! .001perhaps because it is less necessary to talk via phone with those in the same office,but also, and perhaps most tellingly, because the cowork network and the same office

Diversity-Bandwidth Trade-off
113
amount of time coordinating. We are big users of e-mail.” The e-mailnetwork of the firm displays a hub and spoke structure, with a dense coreof 34 recruiters at the firm’s headquarters and spokes in 13 other officeslocated across the United States (see fig. 4). This structure offers a uniqueperspective on the value of network and information diversity as measuredin e-mail data for two reasons. First, since geographic dispersion makesface-to-face meetings difficult, it establishes e-mail as an even more im-portant source of information (Hinds and Keisler 2002). Second, redun-dant information and expertise tend to pool in each dispersed geographiclocation, enabling recruiters with diverse networks to reach across struc-tural holes into distinct pools of information, making this setting partic-ularly well suited to analyzing the information benefits of brokerage.
The core of executive recruiters’ work involves matching job candidatesto clients’ requirements—a process that is information intensive and re-quires activities geared toward assembling, analyzing, and making de-cisions based on information gathered from team members, other firmemployees, and contacts outside the firm. Recruiters report being moreeffective when they receive rich information from their colleagues aboutcandidate qualifications, client idiosyncrasies, team coordination, and
network had the lowest correlation (.079, ), reflecting the fact that projectP ! .005teams were typically geographically dispersed across different offices—again lendingcredibility to the argument that project cowork should be a better proxy for phonecommunication than simply being in the same office. These results mirror the MRQAPresults, which indicate that the project cowork network is the strongest predictor ofthe e-mail network (.339, ) and the same region network is also a strong predictorP ! .01(.225, ), whereas the same office network was correlated but was not as strongP ! .01a predictor (.084, ). As our interviews revealed that recruiters talked on theP ! .05phone most often with those who were on the same projects and in the same regions,the results of the QAP correlations and MRQAP analysis indicate that the e-mailnetwork should mirror the phone network relatively well. A separate question iswhether the same type of information is exchanged over the phone and over e-mail.However, the interview evidence that e-mail was the communication medium of choicein this setting gives us confidence that our results of e-mail analyses are the mostimportant in this study with regard to access to information and the role of informationin performance. Perhaps more important, phone communication data, if we had them,would likely only support our claims rather than detract from them. If the phone isa richer communication medium through which high-bandwidth, high-novelty infor-mation is likely to flow, then the social microprocesses arguments that predict high-bandwidth communication in socially proximate relationships would simply be mag-nified in the telephone context. For example, we are less likely to have the social capitalstanding to “cold call” a weak tie to ask for a significant amount of their time to giveus detailed novel information, nor would such a tie likely call us out of the blue tovolunteer such information. Several of the other social microprocesses operate in thesame way in that they predict that social proximity enables high-bandwidth exchangesthat are likely to occur over the phone as well as over e-mail. However, future workshould assess the differences between phone and e-mail networks.

Fig
.4.—
Th
ee-
mai
ln
etw
ork
ofth
efi
rmd
isp
lays
ah
ub
and
spok
est
ruct
ure
,wit
ha
den
seco
rein
the
firm
hea
dq
uar
ters
and
spok
esin
var
iou
sof
fice
slo
cate
dac
ross
the
Uni
ted
Sta
tes.

Diversity-Bandwidth Trade-off
115
methods for circumventing secretarial screens or handling difficult place-ments.15
Executive recruiters are quintessential brokers. Access to diverse andnovel information is a critical component of their business. Qualitativestudies have shown that recruiters fill “brokerage positions” between cli-ents and candidates and rely heavily on information flows to completetheir work effectively (Finlay and Coverdill 2000). Information about adiverse pool of candidates, diverse markets, and diverse client firms re-duces the time a recruiter wastes interviewing unsuitable candidates andimproves the quality of placements (Aral et al. 2007a). Sharing proceduralinformation can also improve efficiency and effectiveness (Szulanski 1996).For example, information exchanged through social communication helpsrecruiters navigate entry into client firms and candidate pools. One re-cruiter told us that “call penetration can be really hard into private com-panies so researchers and consultants swap information to get through.”Having different information on how to “penetrate” different private com-panies can make recruiters more effective at gathering the informationand contacts they need to match candidates to clients. Information sharingalso enables coordination, reducing total work among teams of recruiterssearching for similar candidates or clients. As one recruiter told us, “Com-munication within and across teams is a big success factor. It eliminatesdouble work.”
In these ways, recruiters’ access to diverse information is critical forfilling different types of positions and performing complex matching ofcandidate strengths and weaknesses to client needs. Recruiters emphasizethe need for diverse contacts, reporting that “diversity means more andbetter contacts” because “skill sets are complementary and not perfectlyoverlapping.” Our interviews also included executive recruiter trainers.One trainer, who describes her job as “helping recruiters learn to be betterrecruiters,” told us, “[To be a successful recruiter one should] developrelationships with people you don’t know. . . . Some folks join groupsfor their prestige but you should join clubs for their diversity.” For thosereasons we expect diverse and novel information to be particularly im-portant for explaining variance in recruiter performance.
Data
Our data come from four sources: (i) detailed accounting records of in-dividual project assignments and performance; (ii) e-mail data captureddirectly from the corporate server; (iii) survey data on demographic char-
15 We conducted in-depth interviews over the course of a year beginning in October2001.

American Journal of Sociology
116
acteristics, human capital, and information-seeking behaviors; and (iv)data from the website Wikipedia.org used to validate our analytical mod-els of information diversity. The firm gave us complete access to its internalaccounting and project databases for records spanning 2000–2005. Thosedatabases describe revenues generated by individual recruiters, contractstart and stop dates, projects handled by each recruiter, project teamcomposition, and job levels of recruiters and placed candidates. Fromthose data we were able to mine excellent performance measures thatcould be normalized for quality. E-mail data include all messages sentthrough the firm for a period of 10 months, captured from the corporatemail server during two equal periods from October 1, 2002, to March 1,2003, and from October 1, 2003, to March 1, 2004. Participants received$100 in exchange for permitting use of their data, resulting in 87% cov-erage of eligible recruiters and more than 125,000 e-mail messages cap-tured.16 Details of e-mail data collection are described by Aral et al.(2007a). The third data set contains survey responses on demographic andhuman capital variables such as age, education, industry experience, andinformation-seeking behaviors. Survey questions were generated from areview of relevant literature and interviews with recruiters. Experts insurvey methods at the Inter-University Consortium for Political and SocialScience Research vetted the survey instrument, which was then pretestedfor comprehension and ease of use. Individual participants received $25for completed surveys, and participation exceeded 85%. The fourth dataset is made up of 291 entries collected from Wikipedia.org, which wedescribe in detail in the section pertaining to the validity of our infor-mation diversity metrics (see app. C). Descriptive statistics and correla-tions of all variables are provided in tables 3 and 4 (we detail constructionof each variable in the next section). An observation is one person-month.
Variable Construction
Dependent Variables
Recruiters in this firm measure success by the number of job openingsfilled and the amount of revenue generated per unit of time. We therefore
16 We wrote and developed e-mail capture software specific to this project and tookmultiple steps to maximize data integrity. New code was tested at Microsoft ResearchLabs for server load, accuracy and completeness of message capture, and securityexposure. To account for differences in user deletion patterns, we set administrativecontrols to prevent data expunging for 24 hours. The project went through nine monthsof human subjects review, and content was masked using cryptographic techniquesto preserve privacy (see Van Alstyne and Zhang [2003], U.S. Patent 7,503,070, andReynolds, Van Alstyne, and Aral [2009] for more detail). Spam messages were excludedby eliminating external contacts who did not receive at least one message from someoneinside the firm.

Diversity-Bandwidth Trade-off
117
TABLE 3Descriptive Statistics
Variable N Mean SD Min Max
Age . . . . . . . . . . . . . . . . . . . . . . . . . . . . . . . . . . . . 522 42.36 10.94 24 67Gender (1 p male) . . . . . . . . . . . . . . . . . . . 657 .56 .50 0 1Industry experience . . . . . . . . . . . . . . . . . . 522 12.52 9.52 1 39Years of education . . . . . . . . . . . . . . . . . . . 522 17.66 1.33 15 21Total incoming e-mails . . . . . . . . . . . . . . . 563 80.31 59.67 0 342Information diversity . . . . . . . . . . . . . . . . 563 .57 .14 0 .87Total nonredundant information . . . . 563 47.94 35.97 0 223.30Network size . . . . . . . . . . . . . . . . . . . . . . . . . . 563 16.81 8.79 1 58Structural holes . . . . . . . . . . . . . . . . . . . . . . . 563 .71 .17 0 .91Structural equivalence . . . . . . . . . . . . . . . 563 77.25 16.32 27.35 175.86Expertise heterogeneity . . . . . . . . . . . . . . 560 .86 .07 .51 .97Channel bandwidth . . . . . . . . . . . . . . . . . . 555 5.87 4.13 0 51Alters’ information refresh rate . . . . . 564 34.24 25.97 0 178.84Alters’ topic space . . . . . . . . . . . . . . . . . . . . 564 46.59 35.06 0 214.67Information overlap of alters . . . . . . . 564 310.11 362.35 0 3,292.83Revenue . . . . . . . . . . . . . . . . . . . . . . . . . . . . . . . 630 20,962.03 18,843.16 0 80,808.41Completed projects . . . . . . . . . . . . . . . . . . . 630 .39 .36 0 1.69Average project duration (days) . . . . . 630 225.23 165.77 0 921.04
assess a recruiter’s performance by measuring the number of projectscompleted per month and revenues generated per month as recorded inthe firm’s accounting records. In addition to revenues and project com-pletions, the speed with which vacancies are filled is also an importantintermediate measure of workers’ productivity. Contract completion im-plies that recruiters have met a client’s minimum thresholds of candidatefit and quality. Project completion can be interpreted as a quality-controlled measure of productivity: a faster rate implies that a recruiteris creating high-quality matches in a shorter period of time. As one re-cruiter told us, “the longer a client delays, the lower the probability ofjob acceptance.” We therefore also measure average project duration.
Network Variables
Network size.—The size of i’s network ( ) is simply the number ofSi
contacts with whom i exchanges at least one message. Size is the mostfamiliar network characteristic related to information benefits and is agood proxy for a variety of characteristics, including degree centrality,betweenness centrality, and network reach, which describes the breadthand range of actors’ networks (see Burt 1992, p. 12). Network size issignificantly correlated with degree centrality ( ; ), be-r p .70 P ! .001tweenness centrality ( ; ), and reach ( ; )r p .77 P ! .001 r p .56 P ! .001

TA
BL
E4
Pa
irw
ise
Cor
rel
atio
ns
bet
we
enV
aria
bles
Mea
sure
12
34
56
78
910
1112
1314
1516
1718
1.A
ge..
....
....
....
....
....
....
..
.2.
Gen
der
(1p
mal
e)..
....
....
..1
1*3.
Indu
stry
exp
erie
nce
....
....
...7
3*.2
0*4.
Yea
rsof
educ
atio
n..
....
....
..3
8*.0
6.1
5*5.
Tot
alin
com
ing
e-m
ail
....
....
�.3
3*�
.10*
�.2
8*�
.15*
6.In
form
atio
nd
iver
sity
....
....
..0
9.0
5.1
6*.0
5.2
9*7.
Non
red
un
dan
tin
form
atio
n..
.�
.32*
�.0
9*�
.27*
�.1
2*.9
8*.3
6*8.
Net
wor
ksi
ze..
....
....
....
...
�.0
7.0
2�
.01
.09
.63*
.45*
.64*
9.N
etw
ork
div
ersi
ty..
....
....
...1
2*.0
2.2
5*.0
1.3
4*.7
1*.3
5*.6
2*10
.S
tru
ctur
aleq
uiva
len
ce..
....
�.1
9*�
.06
�.2
4*�
.06
.23*
�.0
8.2
3*�
.05
�.1
6*11
.E
xper
tise
het
erog
enei
ty..
...
.11*
.20*
.27*
.12*
.03
.23*
.04
.38*
.46*
�.2
1*12
.C
han
nel
ban
dw
idth
....
....
.�
.24*
�.1
0*�
.24*
�.2
0*.1
9*.5
2*.5
0*�
.02
�.0
2.2
9*�
.25*
13.
Ref
resh
rate
....
....
....
....
.�
.33*
�.1
1*�
.26*
�.1
3*.9
5*.2
9*.9
4*.6
1*.3
4*.2
2*.0
9*.4
7*14
.T
opic
spac
e..
....
....
....
...
�.3
4*�
.11*
�.3
0*�
.15*
.97*
.30*
.97*
.62*
.33*
.23*
.03
.50*
.97*
15.
Info
rmat
ion
over
lap
....
....
.�
.25*
�.0
7�
.19*
�.0
7.8
5*.2
0*.8
5*.7
1*.3
0*.0
9*.1
5*.2
7*.8
5*.8
5*16
.R
even
ue..
....
....
....
....
...4
4*�
.02
.33*
.15*
�.0
9*.2
3*�
.12*
�.1
2*.2
7*�
.16*
.12*
�.0
5�
.11*
�.1
4*�
.13*
17.
Com
ple
ted
pro
ject
s..
....
...
.41*
�.0
1.2
9*.1
1*�
.09*
.23*
�.1
1*�
.09*
.25*
�.1
4*.1
0*�
.07
�.1
1*�
.13*
�.1
3*.9
2*18
.A
ver
age
pro
ject
dur
atio
n..
...5
0*.1
2*.4
9*.2
1*�
.30*
.14*
�.3
1*�
.07
.18*
�.2
1*.0
7�
.14*
�.3
2*�
.35*
�.2
8*.5
4*.4
7*.
..
*.
P!
.05

Diversity-Bandwidth Trade-off
119
among employees in this organization, demonstrating its value as a proxyfor network breadth.
Network diversity.—Network diversity describes the degree to whichcontacts are structurally nonredundant, and there are both first-order andsecond-order dimensions of redundancy. We measure redundancy in thefirst order by the lack of constraint in actors’ networks and in the secondorder by the average structural equivalence of actors’ contacts. We defineconstraint (Burt 1992, p. 55)17 as the lack of structural holes in anCi
actor’s network using bidirectional e-mail traffic to construct ego net-works, such that
2C p p � p p , q ( i, j,� �i ij iq qj( )j q
and the structural diversity of an actor’s network as . We useD 1 � Ci i
the standard definition of structural equivalence of two actors, measuredas the Euclidean distance of their contact vectors (Friedkin 1984).18 Bymeasuring both network diversity and the structural equivalence of alters,we account for the possibility that small-world networks, or cohesivecliques linked by infrequent weak ties, could bring novel information intoa clique (Watts and Strogatz 1998).
Channel bandwidth.—Bandwidth measures the volume of communi-cation over a given channel. As our unit of analysis is the monthly egonetwork and performance variables are computed monthly, we measurebandwidth by recording average monthly message traffic over commu-nication channels or ties, operationalized as the amount of incoming e-mail over the total number of contacts at time t, providing a measure ofthe average channel bandwidth of actors’ ties:
IEitB p .it ( )Sit
Information Diversity and Novelty: A Vector Space Model ofCommunication Content
We model and measure the diversity and total novelty of information inindividuals’ e-mail using a vector space model of the topics present in e-
17 The term measures the proportion of i’s bidirectional communicationp ��p pij iq qj
with network contacts that directly or indirectly involve j, and sums this across allCi
of i’s contacts.18 Euclidean distance measures the square root of the sum of squared distances betweentwo contact vectors, or the degree to which contacts are connected to the same people.We measure the average structural equivalence of actors’ direct contacts.

American Journal of Sociology
120
mail content (e.g., Salton, Wong, and Yang 1975).19 Vector space modelsrepresent textual content as vectors of topics in multidimensional spacebased on the relative prevalence of topic keywords. They are widely usedin information retrieval and search query optimization algorithms to iden-tify similar documents or to find topics identified by search terms. In ourmodel, each e-mail is represented as a multidimensional topic vector inwhich elements are the frequencies of keywords in the e-mail. The prev-alence of certain keywords indicates that a topic that corresponds to thosekeywords is being discussed. For example, an e-mail about pets mightinclude frequent mentions of the words “dog,” “cat,” and “veterinarian,”whereas an e-mail about statistics might mention the words “variance,”“specification,” and “heteroscedasticity.” We evaluated the relative topicalsimilarity of two e-mails by topic vector convergence or divergence—thedegree to which their vectors point in the same or orthogonal directionsin multidimensional topic space.20 E-mails about similar topics are morelikely to contain similar language, so the vectors used to represent themare closer in multidimensional space, reducing their collective variance,or spread. We therefore measured e-mail content diversity by character-izing all e-mails as topic vectors and measuring the spread of topic vectorsin individuals’ in-boxes and out-boxes as described below.
Construction of topic vectors and keyword selection.—Our vector spacemodel represents each e-mail (where i indexes e-mails and l indexesDil
recruiters) as a vector of keyword frequencies . Each e-mail is thereforekin
represented as an n-dimensional vector of keyword frequencies in topicspace,
�D p (k , k , … , k ),il i1 i2 in
where represents the frequency of the nth keyword that appears in thekin
ith e-mail. As terms that appear frequently in an e-mail are more likely tobe thematic and to relate to the e-mail’s subject matter, we used the “termfrequency” of keywords in e-mail as weights to construct topic vectors. Anexample of the vector construction process is shown in figure 5.
The choice of keywords is an important step in the process. Rather
19 While e-mail is not the only source of employees’ communication, it is one of themost pervasive media that preserve content. It is also a good proxy for other socialsources of information in organizations in which e-mail is widely used. In our data,the average number of contacts by phone is positively and significantly correlated withe-mail contacts ( ; ). Our interviews indicate that in our firm, e-mail isr p .31 P ! .001a primary communication medium.20 Each e-mail may pertain to multiple topics on the basis of keyword prevalence, andtopic vectors representing e-mails can emphasize one topic more than another on thebasis of the relative frequencies of keywords associated with different topics. In thisway, our framework captures nuances of e-mails that may pertain to several topics ofdiffering emphasis.

Diversity-Bandwidth Trade-off
121
Fig. 5.—An example e-mail is shown on the left. The step-by-step method used to con-struct e-mail vectors is described on the right.
than imposing exogenous keywords on the topic space on the basis of ourown thinking, we chose keywords likely to characterize useful, represen-tative topics on the basis of the following procedures.21 First, we initializedour data by removing common “stop words,” such as “a,” “the,” and “and”and other words that appear with high frequency across all e-mails, whichare likely to create noise in content measures. We then ran an iterative,k-means clustering algorithm to group e-mails into clusters on the basis
21 Another common weighting scheme is the “term frequency/inverse document fre-quency.” However, we use a more sophisticated keyword selection refinement methoddescribed in detail in the text.

American Journal of Sociology
122
of the co-occurrence of words in e-mails across the entire corpus.22 Theresult of iterative k-means clustering is a series of assignments of e-mailsto clusters based on their language similarity. These clusters represent“topics” in that they group e-mails with similar topical language.
Second, in order to identify distinct topics in our corpus, keywordsshould distinguish topics from one another. We therefore chose keywordsthat maximized the mean frequency variation across k-means clusters,choosing words that tend to appear in the same topic clusters often andin other clusters relatively infrequently. This refinement favors words withwidely differing mean frequencies across clusters, retaining words withan ability to distinguish between topics. In our data, we found the co-efficient of variation of the mean frequencies of keyword i across topics( ) to be a good indicator of this dispersion:23iC
n i 2i�(1/n) � (m � M )ccp1iC p .
iM
Third, keywords should represent the topics they are intended to iden-tify. To achieve that goal we chose keywords that minimize the meanfrequency variance within k-means clusters, favoring words that are con-sistently used across a large number of the e-mails in a given topic cluster.The intratopic frequency of keyword i ( ) is therefore defined as fol-iITFlows:24
i i 2�� � ( f � m )ec ce ciITF p .
iM
Fourth, keywords should not occur too infrequently. Infrequent key-words will not represent or distinguish topics and will create sparse topic
22 Clustering of k-means generates clusters by locally optimizing the mean squareddistance of all documents in a corpus. The algorithm first creates an initial set ofclusters based on language similarities, computes the “centroid” of each cluster, andthen reassigns documents to clusters whose centroid is the closest to that document intopic space. The algorithm stops iterating when no reassignment is performed or whenthe objective function falls below a prespecified threshold.23 The coefficient of variation is particularly useful because of its scale invariance,enabling comparisons of data sets, like ours, with heterogeneous mean values (Anconaand Caldwell 1992). To ease computation we use the square of the coefficient ofvariation, which produces a monotonic transformation of the coefficient without af-fecting our keyword selection. The term refers to the coefficient of variation ofiCkeyword i, is the mean frequency of keyword i in e-mails in topic cluster c, andimc
is the mean frequency of keyword i across all topics.iM24 The letter i indexes keywords and c indexes k-means clusters of e-mails that representtopics; is the frequency of keyword i in e-mail e in topic cluster c; is the meani if mec c
frequency of keyword i in e-mails in topic cluster c; and is the mean frequency ofiMkeyword i across all topics. We squared the variation to ease computation as in n. 23.

Diversity-Bandwidth Trade-off
123
vectors that are difficult to compare. We therefore selected high-frequencywords (not eliminated by the “stop word” list of common words) thatmaximize the intertopic coefficient of variation and minimize intratopicmean frequency variation. This process generated topical keywords fromusage characteristics of the e-mail communication of employees at oursite.25 We then populated topic vectors representing the subject matter ofeach e-mail (shown in fig. 5) and measured the diversity and novelty ofthe streams of e-mail flowing to recruiters over time using the methodsdescribed below.
Measures of information diversity and total nonredundant informa-tion.—Current literature remains vague in defining the dimensions ofnovelty or novel information that should matter for vision advantages.We believe that two distinct aspects of novelty are important: the diversityof the information received, which can be thought of as the variance ofthe topics being discussed, and the total volume of novel informationreceived. We developed two distinct empirical measures of novelty: onethat captures variance (which we term “information diversity”) and onethat captures volume (which we call “total nonredundant information”).
We measured the degree to which the e-mails in an individual em-ployee’s in-box or out-box are focused or diverse by measuring the spreador variance of their topic vectors. We created five separate diversity mea-surement specifications based on techniques from the information re-trieval, document similarity, and information theory literatures (see app.B for detailed descriptions of each measure). The purpose of all fivemeasures is to characterize the degree to which e-mails are about a setof either focused or diverse topics. We used two common document sim-ilarity measures (cosine similarity and Dice’s coefficient) and three mea-sures enhanced by an information-theoretic weighting of e-mails basedon their “information content.”26 All five diversity measures are highlycorrelated (∼ corr. p .98; see app. B), so our specifications use one of themost common measures, the average cosine distance of employees’ in-coming e-mail topic vectors from the mean vector of their topic spaceIdij
, to represent incoming information diversity ( ):I IM IDi i
25 We conducted sensitivity analysis of our keyword selection process by choosingdifferent thresholds at which to select words on the basis of our criteria and foundthat results were robust to all specifications and generated keyword sets more precisethan those used in traditional term frequency/inverse document frequency-weightedvector space models that do not refine keyword selection.26 Information content is used to describe how informative a word or phrase is on thebasis of its level of abstraction. Formally, the information content of a concept c isquantified as its negative log likelihood, .� log p(c)

American Journal of Sociology
124
N I I 2� [1 � cos (d , M )]ij ijp1IID p ,i N
where
� w # wij Mjjd 7 Mi icos (d , M) p pij 2 2Fd FFM F � �� w � wi i ij Mj
such that . This measure aggregates the cosine distance ofI0 ≤ ID ≤ 1i
e-mail vectors in an in-box from the mean topic vector of that in-box,approximating the spread or variance of topics in incoming e-mail for agiven individual. We measure the total amount of i’s incoming e-mailcommunication as a count of incoming e-mail messages, ,IE p � mi jij
where represents a message sent from j to i, and the total amount ofmji
nonredundant information flowing to each actor i as diversity ( ) timesIIDi
total incoming e-mail: . We performed extensive val-I I INRI p (E # ID )i i i
idation tests of our diversity measures by creating simulated e-mail in-boxes using an independent data set from Wikipedia.com. These simu-lated in-boxes ranged from sets containing highly diverse e-mails aboutdifferent topics to sets containing highly focused e-mails about a limitednumber of similar topics. Our measures performed very well in accuratelylabeling the diverse sets as containing diverse information and vice versa(see app. C). A three-dimensional vector space model of five e-mail vectorsand their mean vector is shown in figure 6.
Refresh rate of alters’ information (refresh rate).—The information re-fresh rate of an alter j in month t ( ) is defined as the cosine distanceRRjt
between every pair of j’s daily mean e-mail vectors in that month, in-cluding both incoming and outgoing e-mail.27 In other words, to calculatethe degree to which j’s information changed from day 1 to day 2 in montht, we calculated the mean vector of j’s e-mails on day 1 and the meanvector of j’s e-mails on day 2 and then computed the cosine distancebetween them: . We then repeated this procedure for1 � cos (M , M )jt jt1 2
the mean vectors between day 1 and day 3, day 1 and day 4, and so onuntil we had dyadic comparisons between each pair of days in month t.We considered measuring the cosine distance only between contiguousdays (day 1 and day 2, day 2 and day 3, etc.) but rejected this approach
27 We measure the refresh rate of alters using both incoming and outgoing e-mail vectorsto capture the degree to which information being received was changing and the degreeto which alters changed the topics they sent information about over time. Both arelikely to affect the effective refresh rate in ego’s network. However, an argument couldbe made for considering the refresh rate of only information received by alters as aproxy for information they are privy to. We therefore created an alternative refreshrate measure that considered only alters’ incoming e-mail. Use of that variable didnot change the results significantly.

Fig
.6.
—T
wo
dif
fere
nt
thre
e-d
imen
sion
alv
ecto
rsp
ace
mod
els
ofse
par
ate
sets
offi
ve
e-m
ail
vec
tors
ofm
ore
(rig
ht)
and
less
(lef
t)co
llec
tiv
ed
iver
sity
are
show
nal
ong
wit
hth
eir
mea
nv
ecto
rson
the
left
.A
sum
mar
yof
how
info
rmat
ion
div
ersi
tyw
asca
lcu
late
dis
show
non
the
righ
t.

American Journal of Sociology
126
because topics of conversation may simply alternate over days in the weekor longer periods. For example, two contacts may e-mail about topic 1on Monday and topic 2 on Tuesday, go back to topic 1 on Wednesday,and again talk about topic 2 on Thursday. Topics might be repeated everythird day, fourth day, or seventh day if there are recurring weekly meetingsthat inspire e-mail exchanges about those topics. Measuring informationdissimilarity only among contiguous days would not capture this potentialtopic switching and would incorrectly measure these patterns as beingvery diverse even though a limited number of topics are being repeatedlydiscussed. We therefore measure the information refresh rate of i’s localnetwork as a sum of information refresh rates ( ) of i’s immediateP RRit jt
neighbors j in month t, weighted by the strength of ties between i and j.We use the number of messages sent from j to i during month t as amjit
proxy for the strength of incoming ties. Formally, we define the infor-mation refresh rate of a node j in month t as
RR p 1 � cos (M , M ),�jt jt jt1 2!t t1 2
where is the mean vector of j’s e-mails on day , and is theM t Mjt 1 jt1 2
mean vector of j’s e-mails on day . The information refresh rates of i’st2
contacts are then aggregated by summing the refresh rates of i’s alters jweighted by the strength of i’s incoming tie from each alter: R pit
.� RR # mjt jitj
Topic space of alters (topic space).—We measure the overall size of thetopic space in ego’s local network by measuring the total amount ofnonredundant information i’s alters j exchange with their respective con-tacts: . If the amount of total nonredundant in-NRI p � (E # ID )j jk jkk
formation i’s alters receive and distribute is high, we expect i to be ableto sample from a larger topic space. We therefore define the overall topicspace of i’s network in month t ( ) as the sum of the nonredundantTSit
information of i’s contacts in month t weighted by the number of messagessent from j to i during month t ( ): .m TS p � NRI # mjit it jt jitj
Information overlap of alters (information overlap).—Excessive simi-larity among alters’ topic vectors signals that the information availableto ego through different channels may be redundant. The extent to whichthe information of i’s neighbors is redundant depends on the dyadic over-lap of all of i’s pairs of alters. We therefore calculate the informationoverlap of each pair of i’s alters in month t and average that result overthe number of i’s contacts in month t:
N
IO p cos (M , M )/N.�jkt jt ktkp1
We take the average information overlap between pairs of i’s alters so

Diversity-Bandwidth Trade-off
127
that the overlap proxy is independent of the number of alters in thenetwork. We then simply sum the average overlap of the information ofi’s contacts in month t weighted by the number of messages sent from jto i during month t: .28IO p � IO # mit jkt jitj
Control Variables
Several additional factors could affect access to diverse novel informationand individual performance. We therefore examine six possible alternativeexplanations for information advantage as control variables: expertiseheterogeneity, demography, human capital, total communication volume,unobservable individual characteristics, and temporal shocks to the flowof information in the firm.
Expertise heterogeneity of alters (expertise heterogeneity).—A basicpremise of brokerage theory is that disconnected network neighborhoodshouse dissimilar expertise, which brokers tap by reaching across structuralholes. If that is true, we would expect individuals with structurally diversenetworks to be connected to alters with heterogeneous expertise and thatthis heterogeneity enables access to novel information. We measure theexpertise heterogeneity of an employee’s contacts by evaluating the di-versity of his or her expertise accumulated through the projects completedin the past. In this setting recruiters develop expertise as they completeprojects of different types. As there is little in the way of formal trainingto become an executive recruiter, we use the distributions of recruiters’prior project experience over project types rather than educational back-ground to measure expertise heterogeneity. The firm categorizes projectsinto the following categories: chief executive officer, chief operating officer,chief information officer, medical executive, human resources executive,business development executive, nurse, and other. We use these categoriesas the relevant areas of recruiters’ expertise.29 The expertise heterogeneityvariable is constructed using a Herfindahl index of the expertise of anactor’s contacts in each month, weighted by the strength of the tie to eachalter. As the firm records each employee’s effort share on each project,the expertise of a recruiter is share weighted by the amount of effort sherecorded against any given project in the accounting data. The measureis constructed as follows:
28 We exclude each alter’s overlap with himself, which would add only a constant tothe measure as the cosine similarity of j to j, , is always 1.cos (M , M )jt jt
29 We also ran specifications controlling for other categorization schemes and subcat-egories of other jobs clustered by their project descriptions, which returned similarresults. We therefore retained the firm’s original classification.
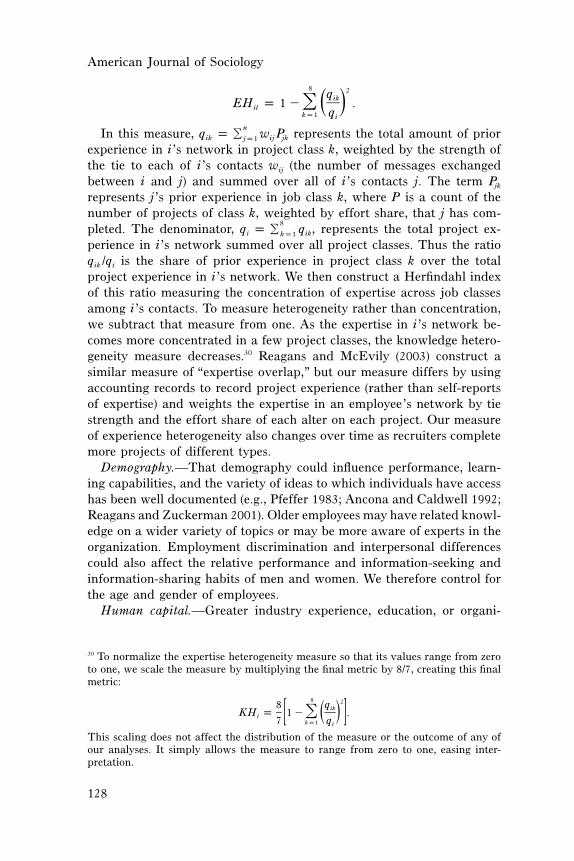
American Journal of Sociology
128
8 2qikEH p 1 � .�it ( )qkp1 i
In this measure, represents the total amount of priorn
q p � w Pik ij jkjp1
experience in i’s network in project class k, weighted by the strength ofthe tie to each of i’s contacts (the number of messages exchangedwij
between i and j) and summed over all of i’s contacts j. The term Pjk
represents j’s prior experience in job class k, where P is a count of thenumber of projects of class k, weighted by effort share, that j has com-pleted. The denominator, , represents the total project ex-
8q p � qi ikkp1
perience in i’s network summed over all project classes. Thus the ratiois the share of prior experience in project class k over the totalq /qik i
project experience in i’s network. We then construct a Herfindahl indexof this ratio measuring the concentration of expertise across job classesamong i’s contacts. To measure heterogeneity rather than concentration,we subtract that measure from one. As the expertise in i’s network be-comes more concentrated in a few project classes, the knowledge hetero-geneity measure decreases.30 Reagans and McEvily (2003) construct asimilar measure of “expertise overlap,” but our measure differs by usingaccounting records to record project experience (rather than self-reportsof expertise) and weights the expertise in an employee’s network by tiestrength and the effort share of each alter on each project. Our measureof experience heterogeneity also changes over time as recruiters completemore projects of different types.
Demography.—That demography could influence performance, learn-ing capabilities, and the variety of ideas to which individuals have accesshas been well documented (e.g., Pfeffer 1983; Ancona and Caldwell 1992;Reagans and Zuckerman 2001). Older employees may have related knowl-edge on a wider variety of topics or may be more aware of experts in theorganization. Employment discrimination and interpersonal differencescould also affect the relative performance and information-seeking andinformation-sharing habits of men and women. We therefore control forthe age and gender of employees.
Human capital.—Greater industry experience, education, or organi-
30 To normalize the expertise heterogeneity measure so that its values range from zeroto one, we scale the measure by multiplying the final metric by 8/7, creating this finalmetric:
8 28 qikKH p 1 � .�i ( )[ ]7 qkp1 i
This scaling does not affect the distribution of the measure or the outcome of any ofour analyses. It simply allows the measure to range from zero to one, easing inter-pretation.

Diversity-Bandwidth Trade-off
129
zational status could also create variation in access to diverse and novelinformation and performance. As individuals gain experience, they maycollect expertise across several domains, reflected in communicationsacross multiple subjects or topics. It could also be that individuals spe-cialize as they gain experience, focusing their work and communicationon a limited number of topics. We therefore control for the level of ed-ucation, industry experience measured by the number of years employeeshave worked in executive recruiting, and organizational position. As em-ployees occupy one of three positions in the firm—partner, consultant, orresearcher—we include dummy variables for these positions to accountfor authority and status differences that could explain variation in bothaccess to information and performance.
Total communication volume.—We are interested in both the totalamount of novel information and the importance of network structureholding communication volume constant. Other studies have demon-strated the importance of controlling for communication volume to isolatethe effects of structural variables (e.g., Cummings and Cross 2003). Wetherefore control for total e-mail communication.
Individual characteristics and temporal shocks.—Some employees maysimply be more social or more ambitious, creating variation in informa-tion-seeking habits and performance. To control for unobservable indi-vidual characteristics, we test fixed-effects specifications of each of ourhypotheses. Temporal shocks could also affect demand for the firm’s ser-vices, with additional work stimulating information-seeking activities. Inour data, business exhibits seasonal variation. Demand for the firm’sservices picks up sharply in January and declines steadily through thenext eight months. These exogenous shocks to demand could drive si-multaneous increases in project workload, information seeking, and rev-enue generation and create a spurious correlation between informationflows and output. There could also be nonseasonal transitory shocks todemand in a given year or a given month of a given year. We control forseasonal and transitory variation in our data by using dummy variablesfor each month and year. Figure 7 visualizes the expertise heterogeneityand information diversity variables by showing how project experiencein different job classes and topics discussed in e-mails were distributedacross a group of five recruiters.31
31 Multicollinearity is not a significant issue in our study for several reasons. First, wenever include any of the variables with a high correlation in the same model, makingmulticollinearity due to their simultaneous inclusion in an estimating equation unlikely.Second, we conducted variance inflation factor (VIF) analysis, which provides a mea-sure of the degree to which the variance of an estimated regression coefficient isincreased as a result of multicollinearity, to quantify the severity of the effects ofmulticollinearity in our models. We examined the VIF for all coefficients in all of our

Fig
.7.
—D
istr
ibu
tion
sof
pro
ject
exp
erti
sean
dto
pic
sin
inco
min
ge-
mai
lar
esh
own
for
fiv
ere
cru
iter
s.D
istr
ibu
tion
sof
pro
ject
exp
erti
sere
pre
sen
tth
ep
rop
orti
ons
ofex
per
tise
ofea
chof
the
fiv
ere
cru
iter
sov
erth
eei
ght
pro
ject
cate
gori
esre
cogn
ized
by
the
firm
.D
istr
ibu
tion
sof
top
ics
inin
com
ing
e-m
ail
rep
rese
nt
the
nu
mb
erof
inco
min
ge-
mai
lsth
atd
iscu
ssea
chof
eigh
tto
pic
sA
–H(a
ne-
mai
lca
nco
nta
inre
fere
nce
tom
ore
than
one
top
ic).

Diversity-Bandwidth Trade-off
131
Model Specification
We used panel data to estimate relationships between network structureand information access and between information access and performance.We are interested in how variations in network structure explain perfor-mance differentials between individuals, as well as how changes in actors’networks explain variation in their access to information and performance.If network structure generates social capital by influencing informationaccess, actors who possess larger, more diverse networks with higher chan-nel bandwidth should receive more novel information and perform betterthan their counterparts. However, unobserved heterogeneity in employees’personal characteristics, such as ambition, gregariousness, or social in-
specifications. None of the variables listed above ever generated a VIF greater than5, which is well below the acceptable threshold of 10 noted by Kutner, Nachtsheim,and Neter (2004). The only two variables that ever recorded VIFs greater than 5 werethe network size and network size squared variables when they were simultaneouslyentered into regressions, which is common for nonlinear terms. We therefore estimatedthese regressions with the network size squared term removed, which created noqualitative change in the parameter estimates or the significance of any of the variablesin the models. We choose to include the size squared term, however, if it was significantin order to document the nonlinear effects of size and to remove it in cases in whichit contributed no explanatory power. Third, the real danger of multicollinearity is tobias parameter estimates toward zero by inflating the variance of an estimated re-gression coefficient. As such, any variance inflation due to collinearity should serveonly to make our estimates more conservative (by making confidence intervals wider)and to therefore make it more difficult to estimate statistically significant results. Theparameters of interest are significant even if there is variance inflation due to collin-earity. Fourth, aside from statistical concerns such as variance inflation due to mul-ticollinearity, we also considered the theoretical implications of these constructs beinghighly correlated. The measures we have devised are theoretically and conceptuallydistinct and produce different results in our analyses that are theoretically interestingand make sense from the perspective of our theory. For example, in the case of totalnonredundant information and information diversity, we discuss in the article howthese variables are conceptually related in that the first is a proxy for the “volume” ofnovel information and the second is a proxy for the “variance” of information or topics.We discuss in some depth why these distinctions are important and why we believethey are significant in some models but not in others. We have also added to andclarified this discussion to bring it to the fore. Furthermore, the raw correlation is aparticularly uninformative summary statistic in this case. When we consider the cor-relation of these two variables over their joint distributions, we find that they arehighly uncorrelated in particular regions and highly correlated in others. In particular,when the volume of novel information is low, the diversity of information is low aswell, and they are highly correlated. However, they display a correlation of only .12for values of information diversity greater than 1 SD less than the normalized mean.The zero-order correlation is driven by their high correlation at low levels, whichmakes sense. In the limit, when you receive no e-mail, you receive no novel informationand the diversity of your incoming information is also zero. Epsilon perturbations fromthis limit exhibit similar high correlations. However, as we get into more interestingregions of the distributions, the correlation of these variables decreases significantlyas expected and described above.

American Journal of Sociology
132
telligence, could simultaneously drive variation in network structure andperformance. If unobserved characteristics of individuals are correlatedwith the error terms in our models, pooled ordinary least squares (OLS)estimation will produce biased parameter estimates. To control for biascreated by unobserved heterogeneity, we examine variation within andacross individuals over time using both fixed-effects and random-effectsmodels. As observations in network data are not independent, we esti-mate a model of network autocorrelation of disturbances that providesconsistent estimates of coefficients and standard errors that are robust toboth network and temporal autocorrelation in panel data. Full details ofour model specifications and estimation procedures are provided in ap-pendix D.
RESULTS
The Diversity-Bandwidth Trade-off
If the diversity-bandwidth trade-off regulates the receipt of novel infor-mation, we should observe two phenomena in our data. First, as recruit-ers’ networks become more diverse, we should see the bandwidth of theircommunication channels contract. Second, they should receive more novelinformation as their networks become more structurally diverse and aschannel bandwidth expands. If those conditions hold, then a trade-offbetween network diversity and channel bandwidth is creating counter-vailing effects on the receipt of novel information.
We found strong evidence confirming the diversity-bandwidth trade-off. As recruiters communicated with contacts who were less well con-nected to each other and who occupied less structurally equivalent po-sitions in the network, the bandwidth of their communication channelsto those contacts contracted quite rapidly. For instance, we estimated thata 1-SD increase in the structural diversity of a recruiter’s network overtime was associated on average with a 21% reduction in the bandwidthof his or her communication channels (models 1–3, table 5, ). AsP ! .01recruiters communicated more with contacts who were themselves denselyconnected and structurally equivalent, the bandwidth of their commu-nication channels expanded. There was a strong negative relationshipbetween network diversity and channel bandwidth (table 5, model 1:
, ) and a strong positive relationship between structuralb p �.314 P ! .01equivalence and channel bandwidth (table 5, model 1: ,b p .107 P !
), indicating that as networks became more diverse, the thickness of.05communication channels narrowed. These results held even when wecontrolled for network size and expertise heterogeneity in fixed-effectsmodels that also hold unobserved time-invariant heterogeneity constant

Diversity-Bandwidth Trade-off
133
across recruiters (table 5, models 1–3). We also found that both greaternetwork diversity and greater channel bandwidth were strongly associatedwith the receipt of more diverse information and more total nonredundantinformation (network diversity: table 6, as discussed in the next section,models 2 and 9, ; channel bandwidth: table 6, models 4, ,P ! .01 P ! .05and 10, ). Having established that the diversity-bandwidth trade-P ! .01off regulates access to novel information, we then examined the conditionsunder which this trade-off affects vision advantages.
In the organization we studied, work was organized by geographicregions and knowledge domains. Recruiters with diverse networks com-municated with contacts whose prior experience and knowledge wereheterogeneous, providing evidence of one way in which diverse networksdeliver diverse information—by providing access to pools of heteroge-neous expertise. This mechanism is reflected in the strong positive asso-ciation between expertise heterogeneity and network diversity in models6–10 in table 5. In order to contact peers with varied expertise, recruitersdiversified their communication networks (communicated with structur-ally distant alters) to reach across structural holes into local networkneighborhoods less well connected to their own. This confirms earlierfindings on the diversity of expertise in networks rich in structural holes(Reagans and McEvily 2003; Rodan and Gallunic 2004) and supports abasic premise of brokerage theory: that disconnected network neighbor-hoods house dissimilar expertise and knowledge, which brokers tap byreaching across structural holes. However, as recruiters began to reachinto diverse, unconnected network neighborhoods seeking advice, infor-mation, or support, the bandwidth of their communication channels de-creased (table 5, models 1–5 and 8–10). The negative associations betweenexpertise heterogeneity and channel bandwidth in pairwise correlations( , ), random-effects models ( , , model 5),r p �.25 P ! .05 b p �.21 P ! .01and more conservative fixed-effects models ( , , modelb p �.095 P ! .103) provide corroborating evidence for the diversity-bandwidth trade-off.Individuals whose contacts had diverse knowledge and experience com-municated more infrequently and with lower volume per channel, whichis consistent with prior characterizations of the nature of weak-tie rela-tionships (Granovetter 1973; Uzzi 1996) and provides new empirical evi-dence about how information tends to flow through them.
To create more diverse networks, recruiters must cultivate new struc-turally distant contacts, which increases their network size. Limited time,energy, and attention could necessitate weaker, more infrequent, andtherefore lower-bandwidth communication with those contacts, an ar-gument consistent with the notion of network maintenance costs (Burt1992). Interestingly, however, our findings show that the reductions inchannel bandwidth associated with greater network diversity do not seem

134
TA
BL
E5
Th
eN
etw
ork
Div
ersi
ty–
Ch
ann
el
Ban
dw
idth
Tra
de
-off
De
pen
de
nt
Var
iabl
e:C
han
ne
lB
and
wid
th
De
pen
de
nt
Var
iabl
e:N
etw
ork
Div
ers
ity
Mod
el1
FE
Mod
el2
FE
Mod
el3
FE
Mod
el4
RE
Mod
el5
RE
Mod
el6
FE
Mod
el7
FE
Mod
el8
FE
Mod
el9
RE
Mod
el10
RE
Age
....
....
....
....
....
....
.�
.006
�.0
07(.0
11)
(.006
)G
ende
r..
....
....
....
....
...
�.1
13�
.129
*(.1
36)
(.070
)E
duc
atio
n..
....
....
....
....
�.1
23**
�.0
12(.0
59)
(.030
)In
dust
ryex
per
ien
ce..
....
.�
.014
.012
*(.0
12)
(.006
)P
artn
er..
....
....
....
....
...
.145
.155
(.284
)(.1
45)
Con
sult
ant
....
....
....
....
.�
.231
.174
(.217
)(.1
10)
Net
wor
kd
iver
sity
....
....
.�
.314
***
�.2
88**
*�
.335
**�
.286
***
�.1
90*
(.078
)(.0
95)
(..13
6)(.0
89)
(.111
)S
tru
ctu
ral
equi
val
ence
....
.107
**.1
01*
.105
*.1
67**
*.1
49**
�.0
55�
.033
�.0
21�
.034
�.0
73**
(.042
)(.0
52)
(.055
)(.0
54)
(.068
)(.0
38)
(.031
)(.0
30)
(.026
7)(.0
30)

135
Exp
erti
seh
eter
ogen
eity
...
�.0
74�
.095
*�
.209
***
�.1
41**
.254
***
.132
***
.127
***
.132
***
.122
***
(.056
)(.0
49)
(.058
)(.0
68)
(.019
)(.0
19)
(.025
)(.0
29)
(.031
)N
etw
ork
size
....
....
....
...2
13.4
76**
*.3
98**
.747
***
.753
***
.965
***
.911
***
(.231
)(.1
71)
(.199
)(.1
02)
(.102
)(.0
74)
(.078
)N
etw
ork
size
squa
red
....
.�
.123
�.3
45**
�.3
33**
�.4
45**
*�
.446
***
�.6
12**
*�
.543
***
(.149
)(.1
42)
(.161
)(.0
73)
(.073
)(.0
65)
(.066
)C
han
nel
ban
dwid
th..
....
.�
.076
***
�.0
69**
*�
.037
*(.0
28)
(.021
)(.0
21)
Con
stan
t..
....
....
....
....
..1
81**
*.1
92**
*.1
64**
*.1
052.
793*
**.3
42**
*.1
99**
*.2
02**
*�
.034
.530
(.046
)(.0
47)
(.047
)(.1
24)
(.972
)(.0
36)
(.040
)(.0
37)
(.062
)(.5
03)
Tem
por
alco
ntr
ols
....
....
.M
onth
/ye
arM
onth
/ye
arM
onth
/ye
arM
onth
/ye
arM
onth
/ye
arM
onth
/ye
arM
onth
/ye
arM
onth
/ye
arM
onth
/ye
arM
onth
/ye
arF
-val
ue/W
ald
x2
....
....
...
45,9
38**
*12
5.91
***
788.
77**
*74
.63*
**76
.63*
**11
2,30
1***
2,47
9.08
***
1820
***
425.
64**
*40
8.09
***
(df)
....
....
....
....
....
....
..(1
1)(1
2)(1
4)(1
3)(1
9)(1
1)(1
3)(1
3)(1
3)(1
9)..
....
....
....
....
....
....
.2
R.0
9.0
9.1
0.2
0.2
4.2
3.3
5.3
5.5
5.5
9N
....
....
....
....
....
....
....
536
535
535
535
429
538
538
535
535
429
No
te
.—H
ausm
ante
stre
sult
s:ra
nd
omef
fect
s(R
E)
con
sist
ent
and
effi
cien
t,m
odel
s3
and
4:21
.23*
,;
mod
els
7an
d8:
411.
38**
*,P
!.1
0P
!
..0
1 *.
P!
.10
**.
P!
.05
***
.P
!.0
1

American Journal of Sociology
136
to be driven only by the time and effort costs of network maintenance,but also by the nature of the relationships in sparse networks. The positiveparameter estimate on the network size variable in bandwidth regressions(table 5, models 4 and 5) indicates that, as recruiters cultivated morecontacts, the bandwidth of their communication channels widened ratherthan narrowed. If constraints on time and effort devoted to relationshipmaintenance alone were driving channel bandwidth, we would expectbandwidth to decrease as network size increased. On the contrary, asrecruiters communicated with more people, they also exchanged moremessages per contact.
As network size continued to increase, time, energy, and attention con-straints eventually had their expected effect. The network size squaredestimate on channel bandwidth is negative and significant in random-effects specifications, indicating declining marginal increases in channelbandwidth as networks grew. The nonlinear relationship between net-work size and channel bandwidth suggests that there are simultaneousincreases in network size and channel bandwidth in smaller networks butthat as network size exceeds the normalized population mean, time andeffort costs and the nature of weak-tie relationships necessitate reductionsin channel bandwidth (see fig. 8). Evidence of this maintenance cost mech-anism was seen only in random-effects models that consider variationbetween recruiters and not in fixed-effects models that analyze variationwithin observations of recruiters over time. This suggests that unobservedheterogeneity between recruiters explains this variation. For instance,more gregarious recruiters could have larger networks and could com-municate more with each contact on average up to a certain network size.
Models 7–10 in table 5 also show a strong positive, but nonlinear,relationship between network size and network diversity. These resultssuggest that information benefits to larger networks are constrained inbounded organizational networks and that marginal benefits to structuraldiversity decrease as a network grows in size. As recruiters contactedmore colleagues, each new contact contributed a diminishing amount ofstructural diversity to the focal actor’s network. The implications of thistrade-off between size and structural diversity complement Burt’s (1992,p. 167) concepts of “effective size” and “efficiency.”32 Figure 8 graphs therelationships among network size, network diversity, and information di-versity, clearly showing the positive, nonlinear relationships.
Demographic variables have no effect on channel bandwidth in models4 and 5, whereas education has a consistently negative relationship, per-
32 In fact, Burt (1992, p. 169) finds stronger evidence of hole effects with the constraintmeasures we employ than with effective size, demonstrating that “exclusive access isa critical quality of relations that span structural holes.”

Diversity-Bandwidth Trade-off
137
Fig. 8.—Relationships between network size, bandwidth, network diversity, and infor-mation diversity.
haps indicating that more educated employees are able to communicatemore efficiently with fewer messages per channel. Fixed- and random-effects models are relatively consistent, except that network size and ex-pertise heterogeneity variables are correlated with channel bandwidthonly in random-effects models, indicating that persistent variation in net-work size and expertise heterogeneity between individuals explained var-iation in channel bandwidth, whereas changes in individuals’ networksize and network expertise heterogeneity over time did not. However,changes in network diversity do explain changes in bandwidth over time.As recruiters’ networks became more structurally diverse, the bandwidth

American Journal of Sociology
138
of their communication channels contracted. Taken together, these resultsagain confirm the trade-off between diversity and bandwidth.
The Diversity-Bandwidth Trade-off and Access to Novel Information
If vision advantages exist and are regulated by the diversity-bandwidthtrade-off, we should observe positive effects from network diversity andchannel bandwidth on the receipt of diverse novel information. Analysesestimating whether network diversity and channel bandwidth predictincoming information diversity ( ) and total nonredundant informationIIDit
received ( ) are shown in table 6.33INRI it
We found strong support for the basic argument that information ben-efits explain returns to structural diversity and brokerage. Network di-versity was positively and significantly associated with greater informa-tion diversity in incoming e-mail. The first-order diversity variable, whichmeasures the lack of constraint in recruiters’ networks, was highly sig-nificant in all specifications, whereas the average structural equivalenceof recruiters’ contacts did not influence access to diverse information(controlling for network size and first-order structural diversity). A 1-SDincrease in network diversity was associated with approximately a 0.15-SD increase in the diversity of incoming information, demonstrating thatlarge diverse networks provide access to diverse information. The exper-tise heterogeneity of recruiters’ contacts was positively correlated withthe diversity of the information recruiters received in both pairwise cor-relations (.23, , table 4) and regression results (table 6, model 1).P ! .05When we control for total communication volume, a 1-SD increase in theexpertise heterogeneity of recruiters’ contacts was associated with a 0.28-SD increase in incoming information diversity (model 1, ). WhenP ! .01the network diversity and structural equivalence terms were added to theestimation (model 2), the positive contribution of expertise heterogeneityto incoming information diversity was reduced by 75%, implying thatnetwork diversity and expertise heterogeneity are positively correlatedand that network diversity is a stronger predictor of access to diverseinformation than the expertise heterogeneity of recruiters’ contacts.
As recruiters reached across structural holes, they were not only com-municating with those who had more diverse sets of expertise but werealso receiving more diverse information from their contacts as a result.
33 We focus in this article on incoming information for two reasons. First, we expectnetwork structure to influence incoming information more than outgoing information.Second, the theory we intend to test is about the information to which individualshave access as a result of their network structure, not the information individualssend. These dimensions are correlated.

Diversity-Bandwidth Trade-off
139
This corroborates the theory that network diversity provides diverse in-formation in part by providing access to diverse pools of expertise, butit also confirms that in our setting, network structure is a stronger pre-dictor of access to diverse information than the expertise heterogeneityof ego’s contacts.
As recruiters added network contacts, the contribution to informationdiversity lessened with each additional contact, implying diminishing mar-ginal information benefits to larger networks. A 1-SD increase in the sizeof recruiters’ networks (approximately eight additional contacts) was as-sociated with a 0.5-SD increase in information diversity (models 3–7,
); the coefficient on network size squared was negative and sig-P ! .01nificant, indicating diminishing marginal information benefits to networksize (models 3–7, ).34P ! .01
Finally, channel bandwidth was also associated with access to morediverse information, confirming that the diversity-bandwidth trade-offwas regulating access to diverse information. A 1-SD increase in channelbandwidth was associated with a 0.085-SD increase in information di-versity (model 4, ). When channel bandwidth was added to theP ! .05specification, the magnitude of the estimated relationship between net-work diversity and information diversity increased. This implies a neg-ative correlation between network diversity and channel bandwidth, pro-viding additional corroborating evidence of the trade-off between the two.
While models 1–7 in table 6 estimate correlates of information diversity,models 9–13 show that the total volume of novel information flowing torecruiters increased with their network size, network diversity, and chan-nel bandwidth. Expertise heterogeneity had a strong positive relationshipwith total nonredundant information received (model 8, ), untilP ! .01the network diversity and structural equivalence variables were added tothe specification (model 9), again demonstrating that recruiters accessednovel information by reaching across structural holes into diverse poolsof expertise. Network diversity and channel bandwidth both had strongpositive relationships with the total amount of novel information flowinginto actors’ in-boxes (model 10, ), with a 1-SD increase in band-P ! .01width associated with a 0.35-SD increase in total novel information re-ceived ( ). As network size and the thickness of channels increased,P ! .01the total volume of novel information received also increased. These re-sults demonstrate the importance of considering channel bandwidth, aswell as the diversity-bandwidth trade-off, when estimating relationshipsbetween network structure and access to diverse novel information. Band-width trades off with network diversity and has a strong positive rela-
34 We also tested a negative exponential specification of this relationship with verysimilar results.

140
TA
BL
E6
Ef
fect
so
fN
etw
ork
Div
ersi
ty
an
dC
han
nel
Ba
nd
wid
tho
nA
cces
st
oD
iver
se,
No
vel
Info
rmat
ion
:F
ixed
-Ef
fect
sS
peci
fic
atio
ns
De
pen
den
tV
ari
abl
e:In
for
mat
ion
Div
ersi
ty
De
pen
den
tV
ari
abl
e:N
on
red
un
da
nt
Inf
orm
atio
n
Mod
el1
Mod
el2
Mod
el3
Mod
el4
Mod
el5
Mod
el6
Mod
el7
Mod
el8
Mod
el9
Mod
el10
Mod
el11
Mod
el12
Mod
el13
Tot
ale-
mai
lin
com
-in
g..
....
....
....
.002
**.0
00�
.001
�.0
02*
�.0
02**
�.0
05**
*�
.002
(.001
)(.0
01)
(.001
)(.0
01)
(.001
)(.0
01)
(.001
)E
xper
tise
het
erog
e-n
eity
....
....
....
.281
***
.073
***
.028
.037
*.0
35*
.032
.037
*.1
81**
*.0
99**
*�
.011
�.0
10.0
002
�.0
07(.0
54)
(.023
)(.0
19)
(.021
)(.0
19)
(.020
)(.0
21)
(.026
)(.0
30)
(.016
)(.0
19)
(.018
)(.0
23)
Net
wor
kd
iver
-si
ty..
....
....
...
.232
***
.145
*.1
55*
.161
**.1
65**
.139
**.2
06**
*.0
66**
.016
.045
**�
.036
(.062
)(.0
83)
(.083
)(.0
75)
(.071
)(.0
95)
(.072
)(.0
32)
(.016
)(.0
16)
(.043
)S
tru
ctur
aleq
uiva
-le
nce
....
....
....
.012
.019
.021
.024
.027
.017
�.0
32�
.007
.012
.007
.008
(.042
)(.0
45)
(.036
)(.0
40)
(.040
)(.0
35)
(.041
)(.0
49)
(.007
)(.0
04)
(.033
)N
etw
ork
size
....
...4
39**
*.5
05**
*.4
85**
*.4
88**
*.4
68**
*.6
68**
*.2
31**
*.1
15**
*.1
61**
(.102
)(.1
05)
(.069
)(.0
69)
(.091
)(.1
02)
(.030
)(.0
19)
(.050
)N
etw
ork
size
squa
red
....
....
.�
.250
***
�.2
59**
*�
.257
***
�.2
56**
*�
.216
***
(.065
)(.0
54)
(.051
)(.0
53)
(.067
)C
han
nel
ban
d-w
idth
....
....
...
.085
**.0
81**
.084
**.0
80**
.352
***
.120
***
.060
***
.201
***
(.041
)(.0
33)
(.032
)(.0
40)
(.067
)(.0
30)
(.011
)(.0
51)
Ref
resh
rate
....
...
.028
.642
***
(.070
)(.0
40)

141
Ch
anne
lb
and-
wid
th#
refr
esh
rate
....
....
....
.�
.016
.077
***
(.037
)(.0
09)
Top
icsp
ace
....
...
.210
.832
***
(.146
)(.0
44)
Ch
anne
lb
and-
wid
th#
top
icsp
ace
....
....
...
�.0
09.0
37**
(.036
)(.0
17)
Info
rmat
ion
over
-la
p..
....
....
....
�.0
03.6
38**
*(.0
37)
(.079
)N
etw
ork
div
ersi
ty#
info
rmat
ion
over
lap
....
....
.�
.038
�.2
30**
(.043
)(.0
76)
Con
stan
t..
....
....
�.4
56**
*.0
04.0
64.1
65.2
48**
.408
***
.152
�.1
72**
*.3
71**
*�
.131
***
�.0
12�
.045
***
.215
***
(.068
)(.0
88)
(.077
)(.1
11)
(.106
)(.0
93)
(.107
)(.0
21)
(.041
)(.0
37)
(.017
)(.0
14)
(.033
)T
emp
oral
con
trol
s..
....
...
Mon
th/
year
Mon
th/
year
Mon
th/
year
Mon
th/
year
Mon
th/
year
Mon
th/
year
Mon
th/
year
Mon
th/
year
Mon
th/
year
rM
onth
/ye
arM
onth
/ye
arM
onth
/ye
arM
onth
/ye
arF
-val
ue/W
ald
x2
....
....
....
...
6.6E
4***
6,99
4***
492.
8***
97.3
2***
80.0
6***
374.
1***
269.
9***
4.6E
5***
1.0E
5***
333.
5***
9,84
5***
2,97
6***
27,9
60**
*(d
f)..
....
....
....
..(1
1)(1
3)(1
5)(1
6)(1
8)(1
8)(1
8)(1
0)(1
2)(1
4)(1
6)(1
6)(1
6)..
....
....
....
...
2R
.14
.11
.14
.16
.16
.16
.16
.18
.19
.56
.86
.91
.75
N..
....
....
....
...
556
538
538
535
535
535
535
556
538
535
535
535
535
*.
P!
.10
**.
P!
.05
***
.P
!.0
1

American Journal of Sociology
142
tionship with incoming information diversity and total nonredundant in-formation, creating countervailing effects on the information benefits tobrokerage.
Although network diversity predicts both the diversity and the totalamount of novel information actors receive, the coefficient on networkdiversity drops by 66% when network size and channel bandwidth areadded to the specification. A 1-SD increase in channel bandwidth wasassociated with a 0.35-SD increase in total nonredundant informationreceived, whereas a 1-SD increase in network diversity was associatedwith only a 0.07-SD increase. These results imply that while structuraldiversity and channel bandwidth both have a strong impact on the di-versity of the information actors receive (per unit of information), vari-ation in the total amount of novel information received is determinedmostly by the size of actors’ contact networks and their channel band-width, drawing attention to the importance of the thickness of commu-nication channels and the number of contacts in providing larger totalvolumes of novel information.
To investigate how the diversity-bandwidth trade-off behaved in dif-ferent information environments, we examined the effects of the refreshrate, the size of the topic space, and information overlap on relationshipsbetween network diversity, channel bandwidth, and access to novel in-formation. Implications of variation in the refresh rate are shown in table6, models 5 and 11. When the refresh rate of alters’ information increased,recruiters received more novel information and channel bandwidth hada stronger effect on the volume of novel information received (model 11).In other words, as alters’ information changed more from day to day,higher-bandwidth ties to those alters delivered more total nonredundantinformation. Interestingly, the refresh rate did not have the same effecton the average diversity of information received—the variance of topics(model 5).
As the topic space of alters’ information increased, recruiters receivedmore total nonredundant information from their contacts and greaterchannel bandwidth provided even more total nonredundant informationthan when the alters’ topic space was smaller (model 12). Communicatingthrough thicker channels with those who know about many topics affordsan ability to sample more information on distinct topics. As these modelsare estimated using fixed-effects specifications, the variation comes fromchanges in the topic space of a recruiter’s alters over time. As the topicspace of recruiters’ contacts increased, they received more novel infor-mation and their high-bandwidth ties were even more valuable in deliv-ering more novel information.
These two results highlight why the distinction between informationdiversity (as a measure of variance) and total nonredundant information

Diversity-Bandwidth Trade-off
143
(as a measure of volume) is important. Although having more samples ofalters’ topic space per period increased the number of novel topics sampledand the total volume of novel information received, it did not change thevariance of the distribution of topics from which recruiters were sampling.Recruiters who increased the bandwidth of their communication channelssaw increases in the total amount of novel information they received, butnot necessarily in diversity per unit of information. When maintenancecosts are considered, this implies that actors must weigh the benefits ofadditional novel information against the costs of obtaining that infor-mation, which makes the functional form of the relationship betweennovel information and performance particularly salient—a relationshipwe discuss in more detail below.
Finally, as the overlap of alters’ information topic spaces increased,network diversity was less useful for delivering more total nonredundantinformation (table 6, model 13). Perhaps surprisingly, greater informationoverlap in an ego network was associated with greater access to nonre-dundant information. Upon reflection, it is clear why this relationship ispositive. As the topic spaces of alters grew larger, they were more likelyto overlap, but they were also more likely to contain more total novelinformation and to thus offer more novel topics to ego. This is confirmedby the fact that when topic space was added to the specification in model13, the information overlap variable did not significantly predict totalnonredundant information.
In summary, network diversity and channel bandwidth both predictaccess to more diverse information and more total nonredundant infor-mation, although bandwidth is a more powerful predictor of the totalvolume of novel information received. As alters’ topic spaces grew largerand changed more rapidly, bandwidth became more important for deliv-ering novel information. Finally, the more alters’ information overlapped,the less important network diversity became to delivering novel infor-mation.
Performance Effects
Table 7 displays strong evidence of a positive relationship between accessto nonredundant information and performance, as measured by revenuesgenerated per month, projects completed per month, and average projectduration.35 We estimated both random-effects and fixed-effects specifi-cations, but in the interests of space provide only the more conservative
35 As there are some employees who do not take on projects or who are not involvedin any projects in a given month, we estimate equations only for individuals withnonzero revenues in a given month.

TA
BL
E7
Pe
rfor
man
ce
Eff
ects
of
Net
wo
rkD
iver
sity
,C
han
nel
Ban
dw
idt
h,
an
dN
onr
edu
nd
an
tIn
form
ati
on
:F
ixed
-Ef
fect
sS
peci
fic
atio
ns
De
pen
de
nt
Var
iabl
e:P
roj
ect
Du
rat
ion
De
pen
de
nt
Var
iabl
e:P
roj
ect
sC
ompl
eted
De
pen
de
nt
Var
iabl
e:R
eve
nu
es
Gen
era
ted
Mod
el1
Mod
el2
Mod
el3
Mod
el4
Mod
el5
Mod
el6
Mod
el7
Mod
el8
Mod
el9
Net
wor
kd
iver
sity
...
�16
.02*
**�
14.1
5***
�12
.28*
**.0
37**
*.0
2**
.01
802.
236
5.44
�42
0.4
(3.9
0)(3
.39)
(3.5
3)(.0
10)
(.01)
(.01)
(520
.15)
(544
.69)
(479
.47)
Ban
dwid
th..
....
....
.�
5.35
�2.
41�
1.57
.023
**.0
02�
.01
1,58
5.3*
**89
9.25
*54
4.47
(2.9
2)(4
.22)
(4.0
5)(.0
09)
(.01)
(.01)
(493
.79)
(467
.81)
(517
.18)
NR
I..
....
....
....
....
.�
12.6
4***
�19
.00*
**.1
0***
.16*
**2,
947.
46**
*5,
626.
2***
(4.7
2)(5
.19)
(.02)
(.02)
(617
.80)
(933
.27)
NR
Isq
uare
d..
....
...
7.70
***
�.0
7***
�6,
858.
8***
(1.9
1)(.0
1)(1
,545
.01)
Con
stan
t..
....
....
....
307.
96**
*30
5.04
***
302.
62**
*.6
4***
.66*
**.6
0***
27,8
65**
*28
,545
***
27,4
47**
*(.2
87)
(1.1
7)(2
.74)
(.004
)(.0
04)
(.01)
(276
.15)
(227
.28)
(438
.83)
Tem
por
alco
ntr
ols
...
Mon
th/
year
Mon
th/
year
Mon
th/
year
Mon
th/
year
Mon
th/
year
Mon
th/
year
Mon
th/
year
Mon
th/
year
Mon
th/
year
F-v
alue
....
....
....
...
1.8E
6***
4.6E
3***
4.3E
3***
1.29
E7*
**1.
4E5*
**5.
2E4*
**1.
78E
6*2.
6E4*
*3.
2E4*
**(d
f)..
....
....
....
....
..(1
1)(1
2)(1
3)(1
1)(1
2)(1
4)(1
1)(1
2)(1
3)..
....
....
....
....
...
2R
.08
.09
.10
.05
.08
.14
.05
.06
.10
N..
....
....
....
....
....
416
416
416
416
416
416
416
416
416
*.
P!
.10
**.
P!
.05
***
.P
!.0
1

Diversity-Bandwidth Trade-off
145
fixed-effects results here. Random-effects estimates were all in the samedirection and were stronger than fixed-effects results.
As recruiters’ structural diversity and channel bandwidth increased,they fulfilled contracts more quickly, fulfilled more contracts per unit oftime, and generated more revenue.36 A 1-SD increase in the bandwidthof communication channels was associated with just over $1,500 morerevenues generated (per person per month; model 7, ) and an ad-P ! .01ditional two-tenths of a project completed (model 4, ). The per-P ! .05formance effects of network structure were enabled in large part by theprovision of nonredundant information. When nonredundant informationwas added to the specifications, the performance effects of network struc-ture were reduced and nonredundant information strongly predicted per-formance across all dimensions. A 1-SD increase in the amount of non-redundant information flowing to individuals was associated on averagewith just over $2,900 more in revenues generated (model 8, ), anP ! .01extra one-tenth of one project completed (model 5, ), and an av-P ! .01erage project duration that is 12 days shorter per person per month (model2, ). These results offer evidence that diverse networks provideP ! .01access to diverse, nonredundant information, which in turn predicts per-formance. As a robustness check, we estimated the relationships betweeninformation diversity (the variance measure) and performance with verysimilar results. A 1-SD increase in information diversity was associatedwith increases in revenues ( , NS; ,b p 1,322.97 b p 2,254.75 P !FE RE
) and project completions ( , ; , ).01 b p .036 P ! .05 b p .049 P ! .01FE RE
and with reductions in average project duration ( , ;b p �16.04 P ! .01FE
, ).b p �15.78 P ! .01RE
We also uncovered evidence of alternative mechanisms linking networkstructure to performance. With access to novel information held constant,network diversity was associated with more completed projects (model5, ) and faster project completion (models 2 and 3, ). TheseP ! .05 P ! .01results imply that benefits to network diversity come not just from access
36 Given the core-periphery structure of the e-mail network of this firm (displayed infig. 4), we compared the effects of network diversity on performance for those employeesphysically located at the headquarters with the effects for those who worked in pe-ripheral offices. Our estimates of pooled OLS regressions provide evidence that beingin a peripheral office is associated with lower performance and that the interactioneffect of being in a peripheral office and having a diverse network is positive, implyingthe potential for network diversity to be even more important for the geographicallyisolated. We do not report these results in this article because of space and focusconsiderations and because estimated relationships are not robust to panel data pro-cedures given that geographic isolation is a time-invariant binary characteristic. How-ever, these results indicate that future work on the importance of network diversityfor the geographically isolated may be fruitful.

American Journal of Sociology
146
to novel information but also from other mechanisms, such as better jobsupport, more power, or organizational influence (Burt 1992).
Across the board, access to nonredundant information had diminishingmarginal performance returns for each of our performance measures(models 3, 6, and 9). These parameter estimates suggest that the marginalperformance impacts of novel information are lower when employeesalready have access to significant amounts of novel information. In fact,as the graphs in figure 9 demonstrate, there seem to be negative returnsto more novel information beyond the normalized mean.37 Such nonlin-earities in the value of novel information likely arise for at least tworeasons. First, beyond the threshold for decision relevance, new infor-mation adds no value. Second, employees reach the limits of their infor-mation-processing capacity as excess novelty becomes burdensome or dis-tracting. These explanations are consistent with theories of boundedrationality, limited cognitive capacity, and information overload.
DISCUSSION
Structural theories of social capital and brokerage have developed to asignificant extent around intuitions and anecdotal evidence about howinformation is likely to be distributed in networks and how different typesof information are likely to accrue to individuals in different structuralpositions (Simmel [1922] 1955; Moreno 1940; Granovetter 1973; Baker1990; Burt 1992, 2008; Padgett and Ansell 1993; Uzzi 1996, 1997; Hansen1999, 2002; Podolny 2001; Reagans and Zuckerman 2001, 2008a, 2008b).However, the actual information flowing between individuals is rarelyobserved (Burt 2008), and we have lacked detailed dynamic theories ofhow social groups access, share, and distribute information under differentnetwork and environmental conditions.
This article develops a theory of how social actors gain access to novelinformation that accounts for how information stocks are distributed ina network as well as how information flows between contacts. Specifically,we propose that a trade-off exists between gathering novel informationthrough more diverse network structure and gathering it through higher-bandwidth communication channels. As diversity and bandwidth coun-terbalance one another, it is difficult to increase both simultaneously.Structurally diverse networks tend to deliver information that exhibitsmore variation across channels because there tends to be information
37 For novel information greater than the normalized mean, coefficients in revenueregressions are negative and significant ( , ; ,b p �3,340.33 P ! .05 b p �3,207.06FE RE
), and in completed projects regressions are negative, though not significantP ! .05( , NS; , NS).b p �.04 b p �.04FE RE

Diversity-Bandwidth Trade-off
147
Fig. 9.—Graphs of the relationships between novel information, completed projects, andrevenue.
homogeneity within connected social groups (Simmel [1922] 1955; Grano-vetter 1973; Blau 1986; Burt 1992). However, diverse networks also tendto include weaker ties (Granovetter 1973) that lack cooperative norms(Granovetter 1985; Coleman 1988) and display less multiplexity and di-mensionality (Uzzi 1997; Hansen 1999), making them likely to deliverinformation on fewer topics with less accumulated novelty over time. Weshow—intuitively, analytically, and empirically—that this trade-off cre-ates countervailing effects on access to novel information as measured byvariance and by volume.
Statistical analyses that combine social network and performance datawith direct observation of the information content flowing through e-mail

American Journal of Sociology
148
at a medium-sized executive recruiting firm provide strong evidence insupport of the diversity-bandwidth trade-off. As network diversity in-creased, channel bandwidth fell, and both diversity and bandwidth de-livered novel information. In accordance with existing theory, reachingacross structural holes provides access to novel information. As recruiterscommunicated across structural holes, they tended to tap contacts withvaried expertise and to receive more diverse information from them. How-ever, they paid for this diversification by forgoing communication band-width that, all else equal, reduced the total volume of novel informationthey received through thicker bandwidth channels.
We also found support for each of the three main environmental con-ditions hypothesized to moderate the effects of the diversity-bandwidthtrade-off: information overlap, topic space, and refresh rate. When con-tacts had redundant information, when they were aware of a larger num-ber of topics, and when their information changed more rapidly, band-width was more influential in providing access to novel information.However, when recruiters’ contacts had nonoverlapping information,when the topic space of ideas was smaller, and when updates were rarer,network diversity had a greater impact on access to novel information.These findings suggest that information benefits, vision advantages, andreturns to brokerage are contingent on the information environments inwhich brokers find themselves. The prevailing wisdom among sociologistsfor the last 40 years has been that the strength of weak ties and informationadvantages to brokerage operate with a fair degree of regularity acrosscontexts (Centola and Macy 2007). In contrast, our analysis shows thatcontext matters. In certain information environments, brokers with manybridging ties to disparate parts of a social network can have disadvantagedaccess to novel information because their lower-bandwidth communica-tion constrains the volume of novelty they receive.
High-bandwidth channels are more important in turbulent environ-ments in which information changes rapidly. Several implications followfrom this result. First, the prevailing view that information redundancyexists in dense cohesive networks ignores the fact that the informationeach actor has can be changing rapidly. A densely connected group ofarbitrageurs in New York might all know each other well but may alsoconstantly get new information from one another because what each per-son knows changes moment by moment. Second, weak, structurally di-verse ties provide information at a lower rate, with less frequency, lesscomplexity, and more delay. Weak ties are more likely to deliver obsoleteinformation. In the classic case of job market opportunities or other time-sensitive settings such as stock market arbitrage, fewer relevant and usefulopportunities are likely to arrive via diverse-low-bandwidth ties. Theproblem of stale information from remote ties is compounded by the fact

Diversity-Bandwidth Trade-off
149
that our cohesive-high-bandwidth ties are more likely to know what weneed and are therefore more likely to volunteer relevant information ina timely manner. Such thinking highlights the importance of timely accessto novel information—rather than access alone—as a factor in brokeragetheory.
The dependence of vision advantages on information turbulence sug-gests two important questions: which social environments are more tur-bulent, and is society moving toward greater overall information turbu-lence? The implications for brokerage are clear: if turbulence makeshigh-bandwidth channels relatively more important for access to novelinformation, then vision advantages from brokerage positions are lesslikely in social and economic sectors where the general stock of knowledgechanges rapidly. If turbulence increases population heterogeneity, thendiverse structure can remain salient. But if this is not the case and societyis moving toward greater information turbulence, then over time bro-kerage positions could become less useful than leadership positions incohesive cliques. Turbulent environments in which key environmentalvariables change quickly or a large number of new events occur withina given period of time have been described as postindustrial (Bell 1973;Huber 1984), high-velocity (Eisenhardt 1989), and time sensitive (Glazerand Weiss 1993) and are typically associated with markets in which in-formation technology plays a critical role (Glazer 1991). Incorporating therate of environmental change and information turbulence into brokeragetheory could explain why brokerage is salient in some industries but notin others.
High-bandwidth channels also deliver more nonredundant informationin high-dimensional information environments in which knowledge iscomplex and comprises many distinct topics. It is not surprising thatevidence contradicting the predictions of brokerage theory typicallyemerges in R&D (Reagans and McEvily 2003), innovation (Obstfeld 2005),and the creative arts (Uzzi and Spiro 2005; Lingo and O’Mahony 2010).In these settings, novelty is produced by exploiting interactions amongcomplex complementary ideas. In high-dimensional information environ-ments, innovation is born of union strategies that connect alters ratherthan disunion strategies that keep them apart. Prior work describes theseeffects as resulting from complex interactions, collaborations, and brain-storming, which are all more likely to occur in dense cohesive networksin which strong ties are prevalent. Our work provides an additional un-derlying mechanism supporting this argument: increasing the volume ofnovel information flowing among collaborators provides even greater sup-port for innovation in high-dimensional information environments. Incontrast, in environments in which efficiency is more important thaninnovation, weaker ties are sufficient. Having been asked to provide “the

American Journal of Sociology
150
one thing you would change to improve [the company’s] supply chainmanagement” in 2,000 characters or less, supply chain managers pos-sessing networks rich in structural holes provided answers that werescored higher in peer evaluations (Burt 2004). We speculate that thesecontrasting results can be explained by the complexity, or lack of com-plexity, in the ideas being solicited in the different contexts. Simple goodideas come more easily to brokers bridging structural holes, but complexinnovation that requires coordinating high-dimensional interdependentinformation comes more readily from high-bandwidth communication.
An important question raised by the benefit of bandwidth in high-dimensional information environments is whether it is more important todevelop “thick bridges” or “wide bridges,” where a thick bridge refers toa high-bandwidth tie to a socially distant community and a wide bridgerefers to several reinforcing weak ties to a socially distant community.Centola and Macy (2007) contend that, because adoption of complex be-haviors requires social affirmation and reinforcement, exposure from mul-tiple different contacts is the key structural characteristic of bridges acrossstructural holes that enables diffusion of complex contagions. But ourresults show that thick, high-bandwidth bridges are critical to the amountof complex novel information that traverses a tie. The open question iswhether a bundle of several weak ties is the same as one strong tie ofequal channel bandwidth, in both the types of information they deliverand their role in social reinforcement and affirmation. Is the width orrather the thickness of a bridge more important for the movement ofcomplex, high-dimensional information? In effect, when does the insightgleaned from 15 minutes with one doctor equal that of one minute with15? To answer these questions, the importance of social reinforcementthrough multiple weak ties and rich interactions through high-bandwidthties must be considered simultaneously. It could be that social reinforce-ment depends not only on multiple exposures but also on the transfer ofrich information from trusted sources, which happens less often over low-bandwidth channels. Social reinforcement from multiple casual acquain-tances may be less important than social reinforcement from one trustedpeer. High-bandwidth ties could therefore also explain the tendency ofsocial movements to diffuse spatially (Centola and Macy 2007). Our resultsimply that the most important tie for access to high-dimensional noveltyis the thick bridge—a high-bandwidth tie to a distant network neigh-borhood.
Finally, information-based mechanisms do in fact explain performancebenefits to brokerage. Network structure explains access to novel infor-mation, which in turn explains variation in performance. These resultsconfirm prior theory and represent some of the first quantitative evidenceof an information-based mechanism explaining returns to brokerage. As

Diversity-Bandwidth Trade-off
151
recruiters accessed more diverse information (variance) and more totalnonredundant information (volume), they generated more revenue, com-pleted more projects per unit of time, and completed projects faster. Theseresults held even in conservative fixed-effects specifications and werestronger in random-effects models that also evaluated variation acrossrecruiters. An important limitation is that we cannot make causal claimsabout the relationship between access to information and performance(Aral, Muchnik, and Sundararajan 2009; Aral 2011; Aral and Walker, inpress). In order to identify these relationships, future work could exploitrandom exogenous variation in the receipt of novel information to examinewhether access to information actually causes performance increases orwhether top performers are simply magnets for information. More detailedtheoretical development and new empirical inquiry in different contextswill no doubt shed further light on these and other trade-offs. Towardthis end, our methods for analyzing network structure and informationcontent in e-mail data are replicable, opening a new line of inquiry intothe information mechanisms that make social networks valuable.
CONCLUSION
The importance of weak ties and sparse networks is that they connectindividuals to socially distant ideas and novel information. Access to novelinformation provides vision advantages to individuals that connect so-cially distant network neighborhoods. These two inferences have for de-cades guided sociologists’ thinking on information flow in networks. How-ever, our research shows that as networks become more structurallydiverse, the volume of information flowing between dyads falls; that is,channel bandwidth contracts. This trade-off between network diversityand channel bandwidth regulates the degree to which structurally diversenetworks deliver nonredundant information to actors in brokerage po-sitions. As individuals communicate across structural holes, they tend totap contacts with varied expertise and to receive more diverse informationfrom them. However, they pay for that diversification by forgoing com-munication bandwidth, which on balance reduces the total volume ofnovel information they receive over time. Novelty must be measured interms of information variety and information volume, and both are af-fected by the diversity-bandwidth trade-off. In turbulent and high-dimensional information environments, this trade-off implies that brokerswith bridging ties to disparate parts of a social network can actually havedisadvantaged access to novel information because their lower-bandwidthcommunication curbs the total volume of received novelty. Our findings

American Journal of Sociology
152
therefore suggest that information advantages to brokerage are contingenton the information environments in which brokers find themselves.
APPENDIX A
Models of the Diversity-Bandwidth Trade-off: Proofs of Consequencesfor Information Acquisition
To make our claims precise regarding the diversity-bandwidth trade-off,this appendix provides probabilistic models of information acquisition.Such models also address the “prior knowledge” problem. In a determin-istic model, a person needs to know who knows what exactly in order toask for it. In a probabilistic model, a person needs to know only the bestexpected contact policy over the population without having to knowwhich person knows what. This represents an even softer constraint thanone imposed by a “transactive memory” model in which ego needs toknow which alter to ask. Yet, bandwidth to a cohesive tie can be favoredover weak access to a diverse tie. More generally, these models demon-strate when a constrained-high-bandwidth tie can be expected to providegreater novelty than a diverse-low-bandwidth tie, and vice versa. Ob-viously, a diverse (unconstrained) high-bandwidth tie is best, but we wishto show how various degrees of constraint affect the diversity-bandwidthtrade-off. The analysis proceeds in three parts, one each for topic space,information overlap, and refresh rate as shown in figure 2. Topic space issimplest, so we first generalize panel 4. “Biasing information overlap” gen-eralizes panels 1–3. Finally, temporal analysis generalizes panels 5 and 6.
Without loss of generality, normalize the capacity of the low-bandwidthchannel to 1 and that of the high-bandwidth channel to . Normal-B 1 1izing panel 1 in figure 2 illustrates a case in which the weak tie hasbandwidth 1 and the strong tie therefore has proportional bandwidth 1.5.
Topic Space
Consider two diverse-low-bandwidth ties, with completely nonoverlap-ping information, and two constrained-high-bandwidth ties, with com-plete overlap.
Proposition 1.—As the number of available topics T grows withoutbound, constrained-high-bandwidth ties provide strictly greater expectednovelty than diverse-low-bandwidth ties.
Proof. Two nonoverlapping low-bandwidth ties provide two normal-ized units of novel information. Novelty on the first high-bandwidth chan-nel is B. Complete overlap on the second high-bandwidth channel impliesthat only previously unshared items remain. Without repeatingT � B

Diversity-Bandwidth Trade-off
153
herself (i.e., without replacement), the second high-bandwidth contact hasthe potential to reveal new items according to a hypergeometric distri-bution with draw capacity B. From standard probability theory, the meanof a hypergeometric distribution is or simply . Total2B(T � B)/T B � B /Texpected novelty across two high-bandwidth channels is thus 2B �
, which has limit 2B as T grows without bound. Since for2B /T 2 ! 2B, this proves the claim. QEDB 1 1
As an aside, equation implies that optimal bandwidth across22B � B /Tboth ties is T.
Information Overlap
To generalize insights concerning information overlap from panels 1–3,we introduce more flexible notation for information sharing “bias.” Letthere be topics in in-group topic set and topics1, . . . , n n 1, . . . , ni i o
in out-group topic set for a total of . Define the likelihoodsn n � n p To i o
of encountering and topics as and , respectively. It follows thatn n p pi o i o
. An actor receives “biased” content if she is more likelyn p � n p p 1i i o o
to receive news on one set of topics than on another ( ), whichp 1 p 1 0i o
we use to characterize the increased likelihood that cohesive high-band-width ties discuss the same things. Receiving completely unbiased contentis , whereas completely biased content orp p p p 1/T p p 1/n 1 p p 0i o i i o
is . If ideas in become x times more likely to appearp p 0 ! p p 1/n ni o o i
among in-group communications, then (which implies thatp p x/Ti
with , , and ).p p [1 � n (x/T)]/(T � n ) n ! T x ! T xn ≤ To 1 1 i i
With this terminology, we can derive , the probability of en-P(W )biased
countering a new idea given that there are k ideas remaining to be seen,allowing differences in and . Let E represent the event that a personp pi o
encounters new information through a new link. Since novelty dependson what one has learned from prior links, let L represent links. Then,define the following:
1 if l connects to idea kI plk {0 otherwise,
L
1 if I p 0� lklp1J pk {
0 otherwise,
W p {event that link L � 1 connects to a new idea}.
Here indicates whether idea k has failed to appear among the infor-Jk
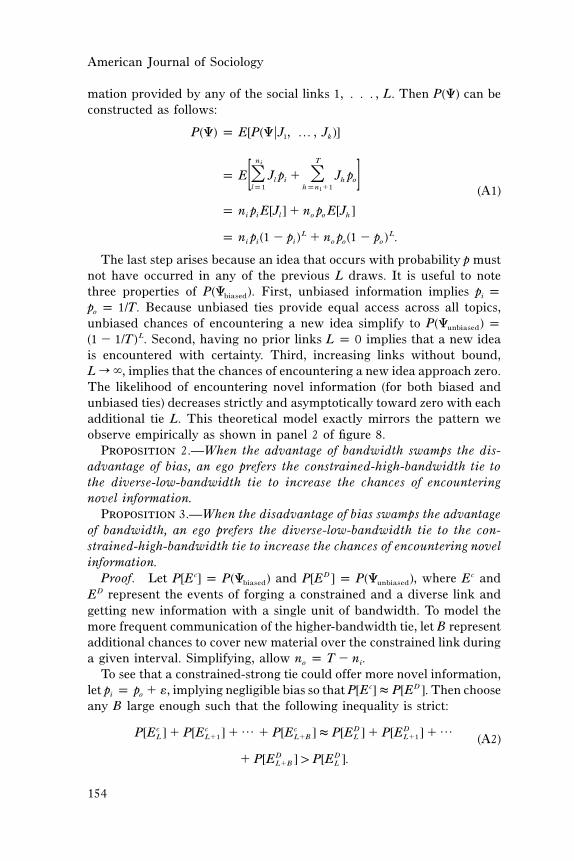
American Journal of Sociology
154
mation provided by any of the social links . Then can be1, . . . , L P(W)constructed as follows:
P(W) p E[P(WFJ , … , J )]1 k
n Ti
p E J p � J p� �l i h o[ ]lp1 hpn �11 (A1)
p n p E[J ] � n p E[J ]i i l o o h
L Lp n p (1 � p ) � n p (1 � p ) .i i i o o o
The last step arises because an idea that occurs with probability p mustnot have occurred in any of the previous L draws. It is useful to notethree properties of . First, unbiased information impliesP(W ) p pbiased i
. Because unbiased ties provide equal access across all topics,p p 1/To
unbiased chances of encountering a new idea simplify to P(W ) punbiased
. Second, having no prior links implies that a new ideaL(1 � 1/T) L p 0is encountered with certainty. Third, increasing links without bound,
, implies that the chances of encountering a new idea approach zero.L r �The likelihood of encountering novel information (for both biased andunbiased ties) decreases strictly and asymptotically toward zero with eachadditional tie L. This theoretical model exactly mirrors the pattern weobserve empirically as shown in panel 2 of figure 8.
Proposition 2.—When the advantage of bandwidth swamps the dis-advantage of bias, an ego prefers the constrained-high-bandwidth tie tothe diverse-low-bandwidth tie to increase the chances of encounteringnovel information.
Proposition 3.—When the disadvantage of bias swamps the advantageof bandwidth, an ego prefers the diverse-low-bandwidth tie to the con-strained-high-bandwidth tie to increase the chances of encountering novelinformation.
Proof. Let and , where andc D cP[E ] p P(W ) P[E ] p P(W ) Ebiased unbiased
represent the events of forging a constrained and a diverse link andDEgetting new information with a single unit of bandwidth. To model themore frequent communication of the higher-bandwidth tie, let B representadditional chances to cover new material over the constrained link duringa given interval. Simplifying, allow .n p T � no i
To see that a constrained-strong tie could offer more novel information,let , implying negligible bias so that . Then choosec Dp p p � � P[E ] ≈ P[E ]i o
any B large enough such that the following inequality is strict:
c c c D D… …P[E ] � P[E ] � � P[E ] ≈ P[E ] � P[E ] �L L�1 L�B L L�1 (A2)D D� P[E ] 1 P[E ].L�B L

Diversity-Bandwidth Trade-off
155
This demonstrates the first claim that a constrained-high-bandwidth tiecan supply a greater volume of novel information than a diverse-low-bandwidth tie provides. To see when a diverse-low-bandwidth tie couldbe preferred, consider when extreme bias results in topic heterogeneity.The subset of topics occurs with probability (such bias nec-n p p B/Ti i
essarily constrains ). For ease of simplification, let . Thenp ≈ � n p T/Bo i
algebra reduces relative probabilities toL LB 1c DP[E ] p 1 � ! 1 � p P[E ]. (A3)L L( ) ( )T T
This alternative case demonstrates the counterclaim that a diverse-low-bandwidth tie can supply a greater volume of novel information than aconstrained-high-bandwidth tie provides. Although C cP[E ] p P[E ] �L L
and increasing B adds more terms to and none toc C… � P[E ] P[E ]L�B L
, it also causes each term to approach zero faster. No matter howDP[E ]L
large the bandwidth of constrained ties, there always exists a fixed numberof links L such that link should be an unconstrained tie. ThisL � 1establishes the second claim. QED
While a range of intermediate cases span these two extremes, conditionsexist when a person will always prefer one or the other type of linkdepending on bias, bandwidth, and the number of links already present.
Refresh Rate
To model information renewal, we consider a standard Poisson process.Let mn be the average time between samples in a subset of n topics andr be the average time until news is refreshed (see fig. A1).
The chance that a given sample produces new information is the ratioof average time between samples over the total time until informationrenews . Note also that if m is average time between samples,mn/(mn � r)then gives the number of samples per unit of time. Consider non-1/moverlapping in-group and out-group topic subsets and with shortern ni o
sampling times for the higher-bandwidth in-group.Proposition 4.—Let high-bandwidth ties provide more frequent up-
dates, (so sample times are shorter), but let low-bandwidth tiesm ! mi o
provide access to distinct topics not included in . Then among tiesn no i
balanced to provide optimal access to news, an increase in the refresh ratefavors an increase in high-bandwidth ties.
Proof. We first find the optimal balance between in-group and out-group ties and then show that the proportion of in-group ties grows inrefresh rate. Since the number of ties is finite, the sum of samples perunit of time is bounded by the number of social links .1/m � 1/m ≤ Li o
To get the most news, a person chooses

American Journal of Sociology
156
TABLE B1Correlations between the Five Measures of Information Diversity
Measure 1 2 3 4 5
1. InfoDiversity 1.00002. VarDiceSim .9999 1.00003. AvgCommon .9855 .9845 1.00004. AvgCommonIC .9943 .9937 .9973 1.00005. AvgClusterDist .9790 .9778 .9993 .9939 1.0000
max p p (In-Group Samples) # P(In-Group Success)
� (Out-Group Samples) # P(Out-Group Success),
1 m n 1 m ni i o omax p p �m ,m ( ) ( )i o m m n � r m m n � ri i i i o o o o
such that .1/m � 1/m ≤ Li o
Use boundary condition to substitute for . Since1/m p L � 1/m mo i o
refresh occurs sooner in higher-bandwidth ties, substitute for out-grouprefresh rate using , . Solving produces a qua-r p dr d ≥ 1 �p/�m p 0o i i
dratic equation with two roots, of which the second is out of bounds:
1 Ldn n (2n � dLr )i i o ip , � .{ }m n � dn (n � dn )ri o i o i i
On the basis of the first root, the absolute time to spend on in-group tiesrises in the number of ties L, the relative refresh delay on out-group topicsd, and the number of in-group topics . It falls in the number of out-ni
group topics . The proportion of time to spend on high-bandwidth tiesno
is
1/m dni ip ,1/m � 1/m n � dni o o i
which increases strictly toward one as the refresh delay of out-group topicsincreases. Higher refresh rates strictly favor a higher proportion of high-bandwidth ties. QED
APPENDIX B
Descriptions and Correlations of Information Diversity Metrics
Table B1 presents the correlations of the following five measures of in-formation diversity.

Diversity-Bandwidth Trade-off
157
FIG. A1
Information Diversity (ID)
Variance based on cosine distance (cosine similarity):N I I 2� [1 � cos (d , M )]ij ijp1
IID p ,i N
where
� w # wij Mjjd 7 Mi icos (d , M) p p .ij 2 2Fd FFM F � �� w � wi i ij Mj
We measure the variance of deviation of e-mail topic vectors from themean topics vector and average the deviation across e-mails in a givenin-box or out-box. The distance measurement is derived from a well-known document similarity measure—the cosine similarity of two topicvectors.
Dice’s Coefficient Variance
Variance based on Dice’s distance and Dice’s coefficient:N I 2� [DistDice(d )]ijjp1
Ivar Dice p ,t N
where
DistDice(d) p DiceDist(d, M) p 1 � Dice(d, M),
and whereT
2 � (t # t )D Dip1 1j 2j
Dice(D , D ) p .1 2 T T� t �� tD Dip1 ip11j 2j
Similar to , variance is used to reflect the deviation of the topicvar cosvectors from the mean topic vector. Dice’s coefficient is used as an al-ternative measure of the similarity of two e-mail topic vectors.
Average Common Cluster
AvgCommon measures the level to which the documents in the documentset reside in different k-means clusters produced by the eClassifier algo-rithm:

American Journal of Sociology
158
N I I� [CommonDist(d , d )]1j 2jjp1IAvgCommon p ,i N
where represents a given pair of documents (1 and 2) in an in-I I(d , d )1j 2j
box and j indexes all pairs of documents in an in-box, and whereI I I ICommonDist(d , d ) p 1 � CommonSim(d , d ),1j 2j 1j 2j
� Iterations in same clusterI ICommonSim(d , d ) p .1j 2j � Iterations
AvgCommon is derived from the concept that documents are similarif they are clustered together by k-means clustering and dissimilar if theyare not clustered together. The k-means clustering procedure is repeatedseveral times, creating several clustering results with 5, 10, 20, 30, 40,. . . , 200 clusters. This measure counts the number of times during thisiterative process two e-mails were clustered together divided by the num-ber of clustering iterations. Therefore, every two e-mails in an in-box andout-box that are placed in separate clusters contribute to higher diversityvalues.
Average Common Cluster with Information Content
AvgCommonIC uses a measure of the “information content” of a clusterto weight in which different e-mails reside. AvgCommonIC extends theAvgCommon concept by compensating for the different amount of in-formation provided in the fact that an e-mail resides in the same bucketfor either highly diverse or tightly clustered clusters. For example, thefact that two e-mails are both in a cluster with low intracluster diversityis likely to imply more similarity between the two e-mails than the factthat two e-mails reside in a cluster with high intracluster diversity:
CommonICSim(D , D )1 2
1p
log (1/kall documentsk)
� log (kdocuments in the bucketk/kall documentskD ,D in same bucket1 27 ,
total number of bucket levels
CommonICDist(D , D ) p 1 � CommonICSim(D , D ),1 2 1 2
AvgCommonIC p average {CommonICDist(d , d )}.d ,d �documents 1 21 2

Diversity-Bandwidth Trade-off
159
Average Cluster Distance
AvgBucDiff measures diversity using the similarity/distance between theclusters that contain the e-mails:
AvgBucDiff p average {DocBucDist(d , d )},d ,d �documents 1 21 2
where
1DocBucketDist(D , D ) p1 2 kcluster iterationsk
7 [BucketDist(B )],� iteration pi,D2i � cluster iterations
and
BucketDist(B , B ) p cos Dist(m , m ).1 2 B B1 2
AvgBucDiff extends the concept of AvgCommon by using the similarity/distance between clusters. While AvgCommon differentiates only whethertwo e-mails are in the same cluster, AvgBucDiff also considers the distancebetween the clusters that contain the e-mails.
APPENDIX C
External Validation of Diversity Measures
We validated our diversity measurement using an independent, publiclyavailable corpus of documents from Wikipedia.org. Wikipedia.org, theuser-created online encyclopedia, stores entries according to a hierarchyof topics representing successively fine-grained classifications. For ex-ample, the page describing “genetic algorithms” is assigned to the “GeneticAlgorithms” category, found under “Evolutionary Algorithms,” “MachineLearning,” “Artificial Intelligence,” and subsequently under “Technologyand Applied Sciences.” This hierarchical structure enables us to constructclusters of entries on diverse and focused subjects and to test whetherour diversity measurement can successfully characterize diverse and fo-cused clusters accurately.
We created a range of high- to low-diversity clusters of Wikipediaentries by selecting entries either from the same subcategory in the topichierarchy to create focused clusters or from a diverse set of unrelatedsubtopics to create diverse clusters. For example, we created a minimumdiversity cluster (type 0) using a fixed number of documents from thesame third-level subcategory of the topic hierarchy and a maximum di-versity cluster (type 9) using documents from unrelated third-level sub-categories. We then constructed a series of document clusters (type 0 totype 9) ranging from low to high topic diversity from 291 individual entries

American Journal of Sociology
160
as shown in figure C1.38 The topic hierarchy from which documents wereselected appears in table C1.
If our measurement is robust, our diversity measures should identifytype 0 clusters as the least diverse and type 9 clusters as the most diverse.We expect that diversity will increase relatively monotonically from type0 to type 9 clusters, although there could be debate, for example, aboutwhether type 4 clusters are more diverse than type 3 clusters.39 Aftercreating this independent data set, we used the Wikipedia entries to gen-erate keywords and measure diversity using the methods described above.Our methods were very successful in characterizing diversity and rankingclusters from low to high diversity. Figure C2 displays cosine similaritymetrics for type 0 to type 9 clusters using 30, 60, and 90 documents topopulate clusters. All five diversity measures return increasing diversityscores for clusters selected from successively more diverse topics.40 Overall,these results give us confidence in the ability of our diversity measurementto characterize the subject diversity of groups of text documents of varyingsizes.
APPENDIX D
Model Specifications and Estimation Procedures
Model Specifications
To explore the mechanisms driving the creation and appropriation ofinformation advantages from network structure, we first explicitly con-sidered the trade-off between network diversity and channel bandwidthby estimating the two following specifications:
38 We created several sets of clusters for each type and averaged diversity scores forclusters of like type. We repeated the process using three, six, and nine documentsamples per cluster type to control for the effects of the number of documents ondiversity measures.39 Whether type 3 or type 4 clusters are more diverse depends on whether the similarityof two documents in the same third-level subcategory is greater or less than the dif-ference of similarities between documents in the same second-level subcategory ascompared to documents in categories from the first hierarchical layer onward. Thisis, to some extent, an empirical question.40 The measures produce remarkably consistent diversity scores for each cluster type,and the diversity scores increase relatively monotonically from type 0 to type 9 clusters.The diversity measures are not monotonically increasing for all successive sets, suchas type 4, and it is likely that the information contained in type 4 clusters is less diversethan in type 3 clusters simply because two type 4 documents are taken from the samethird-level subcategory.

Diversity-Bandwidth Trade-off
161
TABLE C1Wikipedia.org Categories
� Computer Science � Geography � Technology
� Artificial intelligence � Climate � Robotics� Machine learning � Climate change � Robots� Natural language processing � History of climate � Robotics competitions� Computer vision � Climate forcing � Engineering
� Cryptography � Cartography � Electrical engineering� Theory of cryptography � Maps � Bioengineering� Cryptographic algorithms � Atlases � Chemical engineering� Cryptographic protocols � Navigation �Video and movie technology
� Computer graphics � Exploration � Display technology� 3D computer graphics � Space exploration � Video codecs� Image processing � Exploration of Australia � Digital photography� Graphics cards
Fig. C2.—Document clusters selected from Wikipedia.org
2B p g � b ND � b SE � b EH � b NS � b NSit i 1 it 2 it 3 it 4 it 5 it (D1)
� b HC � b M � � ,� �j ji m it itj m
2ND p g � b SE � b EH � b NS � b NS � b Bit i 1 it 2 it 3 it 4 it 5 it (D2)
� b HC � b M � � ,� �j ji m it itj m
where represents channel bandwidth, represents network diversityB NDit it
(measured by one minus constraint), represents average structuralSEit
equivalence, represents the knowledge heterogeneity of i’s contacts,EHit
represents the size of i’s network, represents network size2NS NSit it
squared, represents controls for human capital and demographic� b HCj jij
variables (age, gender, education, industry experience, and manageriallevel), and represents temporal controls for each month/year. If� b Mm itm
network diversity and channel bandwidth trade off, network diversityshould be associated with lower channel bandwidth, and we would expect

Fig
.C
1.—
Div
ersi
tym
easu
rem
ent
val
idat
ion
resu
lts

Diversity-Bandwidth Trade-off
163
to observe parameter estimates such that and in equationb ! 0 b 1 01 2
(D1) and in equation (D2).b ! 05
We then examined the structural correlates of access to diverse andnovel information. We first estimated an equation relating network struc-ture to the diversity of information flowing into actors’ e-mail in-boxes.41
The estimating equation is specified as follows:I I 2ID p g � b E � b EH � b ND � b SE � b NS � b NSit i 1 it 2 it 3 it 4 it 5 it 6 it
� b B � b R � b (B # R ) � b TS � b (B # TS ) (D3)7 it 8 it 9 it it 10 it 11 it it
� b IO � b (ND # IO ) � b HC � b M � � ,� �12 it 13 it it j ji m it itj m
where represents the diversity of the information in a given indi-IIDit
vidual’s in-box, represents the total number of incoming messagesIEit
received by i, represents the refresh rate of i’s alters at time t,R TSit it
represents the topic space of i’s alters at time t, and represents theIOit
information overlap of i’s alters at time t. We then examined the rela-tionship between network structure and the total amount of novel infor-mation flowing into actors’ e-mail in-boxes ( ) using the followingINRI it
model:42
INRI p g � b EH � b ND � b SE � b NS � b Bit i 1 it 2 it 3 it 4 it 5 it
� b R � b (B # R ) � b TS � b (B # TS ) (D4)6 it 7 it it 8 it 9 it it
�b IO � b (ND # IO ) � b HC � b M � � .� �10 it 11 it it j ji m it itj m
Finally, we tested the relationship between nonredundant information( ) and performance ( ) and included our measures of network di-INRI Pit it
versity ( ) and bandwidth ( ) in the specification:ND Bit it
I I 2P p g � b ND � b B � b NRI � b (NRI )it i 1 it 2 it 3 it 4 it (D5)
� b HC � b Month � � .� �j ji m itj m
If information benefits to network diversity and channel bandwidthexist, they should be positively associated with access to diverse andnonredundant information, and nonredundant information should be pos-
41 We focus in this article on incoming information for two reasons. First, we expectnetwork structure to influence incoming information more than outgoing information.Second, the theory we intend to test is about the information to which individualshave access as a result of their network structure, not the information individualssend. These dimensions are highly correlated.42 We did not include the network size squared term because it had no explanatorypower. The relationship between network size and total nonredundant information islinear and positive.

American Journal of Sociology
164
itively associated with performance. If network structure confers addi-tional benefits beyond information advantage (such as power or favorabletrading conditions), network diversity and channel bandwidth should con-tribute to performance beyond their contribution through informationdiversity.43 Finally, if there are diminishing returns to novel information,we should see a concave relationship between novel information andproductivity. As a robustness check we also estimated equation (D5) re-placing the nonredundant information variable ( ) with incomingINRI it
information diversity ( ) with similar results.IIDit
Estimation Procedures
We estimate relationships between network structure and informationaccess and between information access and performance using panel data.We are interested in how variation in network structure explains perfor-mance differentials across individuals and also in how changes in actors’networks explain variation in their own performance over time. If networkstructure generates social capital by influencing information access, actorswith larger, more diverse networks with higher channel bandwidth shouldreceive more novel information and perform better than those with lessdiverse networks and lower channel bandwidth. However, evidence ofvariation across individuals cannot exclude the possibility that unobserv-able characteristics of individuals, such as ambition or social intelligence,could simultaneously drive variation in network diversity and perfor-mance. If unobserved characteristics of individuals are correlated withthe error terms in our models, pooled OLS estimation will produce biasedparameter estimates. We therefore examine variation within and acrossindividuals over time using both fixed-effects and random-effects modelsto control for bias created by this unobserved heterogeneity and to ex-amine variation within and across observations of individuals over time.
The fixed-effects estimator uses variation within observations of a singleindividual over time. The basic specification includes observations of de-pendent and independent variables for each individual in each cross-sectional time period t and a time-invariant vector of individual char-acteristics representing unobserved heterogeneity across individuals:a i
43 We were unable to reject the hypothesis of no heteroscedasticity and report standarderrors according to the White correction (White 1980). White’s approach is conser-vative. Estimated coefficients are unbiased but not efficient. In small samples, we mayobserve low t-statistics even when variables exert a real influence. As there may beidiosyncratic error at the level of individuals, for OLS analyses we report robuststandard errors clustered by individual. Clustered robust standard errors are robustto correlations within observations of each individual but are never fully efficient.They are conservative estimates of standard errors.

Diversity-Bandwidth Trade-off
165
y p a � x b � � . (D6)it i it it
The fixed-effects transformation is obtained by first averaging equation(D6) over to create the cross-section equation or betweent p 1, . . . , Testimator:
¯ ¯ ¯y p a � x b � � , (D7)i i i i
whereT T T� y � x � �it it it1 1 1
¯ ¯ ¯y p , x p , and � p .i i iT T T
When we subtract equation (D7) from equation (D6), the fixed-effectstransformation removes unobserved time-invariant individual-specificheterogeneity embodied in :a i
¯ ¯ ¯y � y p (x � x )b � � � � . (D8)it i it i it i
The fixed-effects estimator produces estimates using variation within ob-servations of the same individuals over time and allows us to estimatethe effects of network structure controlling for unobserved omitted var-iables that could bias our estimates.
While the fixed-effects estimator helps us estimate the effects of networkstructure on information access and performance controlling for unob-servable omitted variables, it has several drawbacks. First, we are alsointerested in the effects of observable time-invariant characteristics ofindividuals, such as demography (e.g., age, gender), human capital (e.g.,education, industry tenure), and organizational hierarchy (e.g., individ-uals’ position in the firm’s formal organizational structure), on access toinformation and performance. More precisely, we are interested in therelative effects of network structure on information access and perfor-mance compared to these traditional factors. As the fixed-effects estimatorwashes away variation in time-invariant characteristics, it makes esti-mation of these parameters impossible. Second, we believe that variationacross individuals also helps explain differences in information access andperformance correlated with network structure. Individuals may be ableto manipulate the information they receive by changing their communi-cation patterns over time, but persistent structural differences betweenindividuals could also explain performance differentials. We thereforeestimate both pooled OLS and random-effects models of our specificationsas robustness checks with similar results.
The OLS estimator on pooled data estimates an unweighted averageof the within and between estimators. Although we do not report theseresults in the tables, we produced pooled OLS estimates of our specifi-cations with very similar results, which most closely resembled therandom-effects estimates we report. We estimated the pooled OLS spec-

American Journal of Sociology
166
ifications with robust clustered standard errors in order to control for thefact that repeated observations of the same individuals over time in paneldata may artificially constrict the standard errors. Clustered robust stan-dard errors treat each individual as a super-observation for part of itscontribution to the variance estimate (e.g., , where is an� p h � u hci c ci c
individual effect and the idiosyncratic error). They are robust to cor-uci
relations within the observations of each individual but are never fullyefficient. They represent conservative estimates of standard errors.
When variables of interest do not vary much over time, fixed-effectsmethods can produce imprecise estimates. In our case, not only are weinterested in estimating the impact of time-invariant characteristics ofindividuals on access to information and performance (e.g., age, gender,education), but we also know that certain aspects of network structurechange relatively little over time. We therefore estimate both fixed-effectsand random-effects specifications. The random-effects model estimates amatrix weighted average of the between (D7) and within (D8) estimators,where the weighting matrix l accounts for correlation across observationsin the residuals as follows:
y � ly p (x � lx )b � � � l� . (D9)it it iti i i
We estimate l as a function of the idiosyncratic error variance and thegroup-specific error variance. When , the procedure is equivalentl p 0to estimating OLS, and when , we are estimating fixed effects. Thel p 1random-effects model brings efficiency gains and the ability to estimateparameters of time-invariant covariates at the risk of inconsistency. Totest the consistency of the random-effects estimator, we conduct Hausmantests (Hausman 1978) comparing fixed- and random-effects models andreport our results in the table notes for each set of results.
To adjust for nonindependence of observations in network panel data,we employ a consistent covariance matrix estimator that is robust to verygeneral forms of network, spatial, and temporal dependence (Driscoll andKraay 1998). This approach is similar to common network autocorrelationmodels considered in the literature (e.g., Ord 1975; Doreian 1980; Dow,Burton, and White 1982; Loftin and Ward 1983; Marsden and Friedkin1993) but also takes into account temporal dependence across panels inlongitudinal data as well as both cross-sectional and time-dependent net-work autocorrelation. The estimator assumes a data-generating processwith both contemporaneous and lagged cross-sectional dependence acrossobservations as follows:
y p x b � � , (D10)it it it
where

Diversity-Bandwidth Trade-off
167
� p l f � n ,it i t it
and
f p rf � u ,t t�1 it
where and are mutually independent normal random variables withu nit it
mean zero, and contemporaneous and lagged cross-sectional dependencein disturbances is modeled through the presence of the unobserved factor. The extent of dependence between two observations i and j dependsft
on the strength of the network autocorrelation terms and and thel li j
degree of temporal persistence in the factor r.
REFERENCES
Allen, T. J. 1977. Managing the Flow of Technology. Cambridge, Mass.: MIT Press.Ancona, D. G., and D. F. Caldwell. 1992. “Demography and Design: Predictors of New
Product Team Performance.” Organization Science 3 (3): 321–41.Aral, S. 2011. “Identifying Social Influence: A Comment on Opinion Leadership and
Social Contagion in New Product Diffusion.” Marketing Science 30 (2): 217–23.Aral, S., E. Brynjolfsson, and M. Van Alstyne. 2007a. “Information, Technology and
Information Worker Productivity: Task Level Evidence.” Working paper no. 13172.National Bureau of Economic Research, Cambridge, MA.
———. 2007b. “Productivity Effects of Information Diffusion in Networks.” Paper 17in Proceedings of the 28th Annual International Conference on Information Systems,Montreal. http://aisel.aisnet.org/icis2007/17.
Aral, S., L. Muchnik, and A. Sundararajan. 2009. “Distinguishing Influence BasedContagion from Homophily Driven Diffusion in Dynamic Networks.” Proceedingsof the National Academy of Sciences 106 (December 22): 21544–49.
Aral, S., and D. Walker. In press. “Creating Social Contagion through Viral ProductDesign: A Randomized Trial of Peer Influence in Networks.” Management Science.
Argote, L. 1999. Organizational Learning: Creating, Retraining and TransferringKnowledge. Boston: Kluwer Academic.
Baker, Wayne E. 1984. “The Social Structure of a National Securities Market.” Amer-ican Journal of Sociology 89:775–811.
———. 1990. “Market Networks and Corporate Behavior.” American Journal of So-ciology 96:589–625.
Bell, D. 1973. The Coming of Post-industrial Society. New York: Basic Books.Bernard, H. R., P. Killworth, and L. Sailor. 1981. “Summary of Research on Informant
Accuracy in Network Data and the Reverse Small World Problem.” Connections 4(2): 11–25.
Blau, P. M. 1986. Exchange and Power in Social Life. London: Transaction.Burt, R. 1992. Structural Holes: The Social Structure of Competition. Cambridge,
Mass.: Harvard University Press.———. 2000. “The Network Structure of Social Capital.” Pp. 345–423 in Research in
Organizational Behavior, vol. 22, edited by B. Staw and R. Sutton. New York: JAI.———. 2004. “Structural Holes and Good Ideas.” American Journal of Sociology 110:
349–99.———. 2005. Brokerage and Closure: An Introduction to Social Capital. New York:
Oxford University Press.———. 2007. “Secondhand Brokerage: Evidence on the Importance of Local Structure
for Managers, Bankers, and Analysts.” Academy of Management Journal 50 (1): 119–45.

American Journal of Sociology
168
———. 2008. “Information and Structural Holes: Comment on Reagans and Zuck-erman.” Industrial and Corporate Change 17 (5): 953–69.
Centola, D., and M. Macy. 2007. “Complex Contagions and the Weakness of LongTies.” American Journal of Sociology 113 (November): 702–34.
Cohen, W. M., and D. A. Levinthal. 1990. “Absorptive Capacity: A New Perspectiveon Learning and Innovation.” Administrative Science Quarterly 35 (1): 128–52.
Coleman, J. S. 1988. “Social Capital in the Creation of Human Capital.” AmericanJournal of Sociology 94:S95–S120.
Cramton, C. D. 2001. “The Mutual Knowledge Problem and Its Consequences forDispersed Collaboration.” Organization Science 12 (3): 346–71.
Cummings, J. 2004. “Work Groups, Structural Diversity, and Knowledge Sharing ina Global Organization.” Management Science 50 (3): 352–64.
Cummings, J., and R. Cross. 2003. “Structural Properties of Work Groups and TheirConsequences for Performance.” Social Networks 25 (3): 197–210.
Currarini, S., M. O. Jackson, and P. Pin. 2009. “An Economic Model of Friendship:Homophily, Minorities and Segregation.” Econometrica 77 (4): 1003–45.
———. 2010. “Identifying the Roles of Race-Based Choice and Chance in High SchoolFriendship Network Formation.” Proceedings of the National Academy of Sciences107 (11): 4857–61.
Doreian, P. 1980. “Linear Models with Spatially Distributed Data: Spatial Disturbancesor Spatial Effects?” Sociological Methods Research 9 (August): 29–60.
Dow, M. M. Burton, and D. White. 1982. “Network Autocorrelation: A SimulationStudy of a Foundational Problem in Regression and Survey Research.” Social Net-works 4:169–200.
Drew, Paul, and John Heritage, eds. 1992. Talk at Work: Interaction in InstitutionalSettings. Cambridge: Cambridge University Press.
Driscoll, J. C., and A. C. Kraay. 1998. “Consistent Covariance Matrix Estimation withSpatially Dependent Panel Data.” Review of Economics and Statistics 80:549–60.
Eisenhardt, K. 1989. “Making Fast Strategic Decisions in High Velocity Environ-ments.” Academy of Management Journal 32:543–76.
Eliasoph, N. 1996. “Making a Fragile Public: A Talk-Centered Study of Citizenshipand Power.” Sociological Theory 14:262–89.
Finlay, W., and J. E. Coverdill. 2000. “Risk, Opportunism and Structural Holes: HowHeadhunters Manage Clients and Earn Fees.” Work and Occupations 27:377–405.
Friedkin, N. E. 1984. “Structural Cohesion and Equivalence Explanations of SocialHomogeneity.” Sociological Methods and Research 12:235–61.
Galbraith, J. R. 1974. “Organization Design: An Information Processing View.” Inter-faces 4 (May): 28–36.
Gibson, D. R. 2005. “Taking Turns and Talking Ties: Networks and ConversationalInteraction.” American Journal of Sociology 110 (6): 1561–97.
Glazer, R. 1991. “Marketing in Information-Intensive Environments: Strategic Impli-cations of Knowledge as an Asset.” Journal of Marketing 55:1–19.
Glazer, R., and A. M. Weiss. 1993. “Marketing in Turbulent Environments: DecisionProcesses and the Time-Sensitivity of Information.” Journal of Marketing Research30 (4): 509–21.
Goffman, E. 1961. Encounters. New York: Bobbs-Merrill.Granovetter, M. 1973. “The Strength of Weak Ties.” American Journal of Sociology
78:1360–80.———. 1978. “Threshold Models of Collective Behavior.” American Journal of So-
ciology 83 (6): 1420–43.———. 1985. “Economic Action and Social Structure: The Problem of Embeddedness.”
American Journal of Sociology 91:1420–43.———. 1992. “Problems of Explanation in Economic Sociology.” Pp. 25–56 in Networks

Diversity-Bandwidth Trade-off
169
and Organizations, edited by N. Nohria and R. G. Eccles. Boston: Harvard BusinessSchool Press.
Hansen, M. 1999. “The Search-Transfer Problem: The Role of Weak Ties in SharingKnowledge across Organization Subunits.” Administrative Science Quarterly 44 (1):82–111.
———. 2002. “Knowledge Networks: Explaining Effective Knowledge Sharing in Mul-tiunit Companies.” Organization Science 13 (3): 232–48.
Hargadon, A., and R. Sutton. 1997. “Technology Brokering and Innovation in a ProductDevelopment Firm.” Administrative Science Quarterly 42:716–49.
Hausman, J. A. 1978. “Specification Tests in Econometrics.” Econometrica 46 (6): 1251–71.
Heider, F. 1958. The Psychology of Interpersonal Relations. New York: Wiley.Helper, S., J. P. MacDuffie, and C. Sabel. 2000. “Pragmatic Collaborations: Advancing
Knowledge While Controlling Opportunism.” Industrial and Corporate Change 9(3): 443–88.
Hinds, P., and S. Kiesler. 2002. Distributed Work. Cambridge, Mass.: MIT Press.Huber, G. 1984. “The Nature and Design of Post-industrial Organizations.” Manage-
ment Science 30:928–51.Kempe, D., J. Kleinberg, and E. Tardos. 2003. “Maximizing the Spread of Influence
through a Social Network.” Pp. 137–46 in Proceedings of the 9th ACM SIGKDD.Washington, D.C.: Association for Computing Machinery Special Interest Group onKnowledge Discovery and Data Mining. http://portal.acm.org/citation.cfm?idp956769&CFIDp31838805&CFTOKENp87393492.
Kossinets, G., and D. Watts. 2006. “Empirical Analysis of an Evolving Social Network.”Science 311 (5757): 88–90.
———. 2009. “Origins of Homophily in an Evolving Social Network.” American Jour-nal of Sociology 115 (2): 405–50.
Krackhardt, D. 1987. “Cognitive Social Structures.” Social Networks 9 (2): 109–34.———. 1990. “Assessing the Political Landscape: Structure, Cognition and Power in
Organizations.” Administrative Science Quarterly 35:342–69.Krackhardt, D., and M. Kilduff. 1999. “Whether Close or Far: Social Distance Effects
on Perceived Balance in Friendship Networks.” Journal of Personality and SocialPsychology 76:770–82.
Kumbasar, E., A. K. Romney, and W. H. Batchelder. 1994. “Systematic Biases in SocialPerception.” American Journal of Sociology 100:477–505.
Kutner, M. H. C. J. Nachtsheim, and J. Neter. 2004. Applied Linear Regression Models,4th ed. New York: McGraw-Hill Irwin.
Lave, J., and E. Wegner. 1991. Situated Learning: Legitimate Peripheral Participation.New York: Cambridge University Press.
Lazer, D., and A. Friedman. 2007. “The Network Structure of Exploration and Ex-ploitation.” Administrative Science Quarterly 52:667–94.
Liang, D. W., R. Moreland, and L. Argote. 1995. “Group versus Individual Trainingand Group Performance: The Mediating Role of Transactive Memory.” Personalityand Social Psychology Bulletin 21 (4): 384–93.
Lichterman, P. 1996. The Search for Political Community: American Activists Rein-venting Commitment. Cambridge: Cambridge University Press.
Lin, N. 2002. Social Capital: A Theory of Social Structure and Action. Cambridge:Cambridge University Press.
Lingo, E., and S. O’Mahony. 2010. “Nexus Work: Brokerage on Creative Projects.”Administrative Science Quarterly 55 (1): 47–81.
Loftin, C., and S. Ward. 1983. “A Spatial Autocorrelation Model of the Effects ofPopulation Density on Fertility.” American Sociological Review 48:121–28.
March, J. G. 1991. “Exploration and Exploitation in Organizational Learning.” Or-ganization Science 2 (1): 71–87.
American Journal of Sociology
170
Marsden, P. 1990. “Network Data and Measurement.” Annual Review of Sociology 16:435–63.
Marsden, P. V., and N. E. Friedkin. 1993. “Network Studies of Social Influence.”Sociological Methods and Research 22:127–51.
McLean, P. 1998. “A Frame Analysis of Favor Seeking in the Renaissance: Agency,Networks, and Political Culture.” American Journal of Sociology 104:51–91.
McPherson, M., L. Smith-Lovin, and J. Cook. 2001. “Birds of a Feather: Homophilyin Social Networks.” Annual Review of Sociology 27:415–44.
Mische, A. 2000. “Cross-Talk in Movements: Rethinking the Culture-Network Link.”Pp. 258–80 in Social Movements and Networks: Relational Approaches to CollectiveAction, edited by Mario Diani and Doug McAdam. Oxford: Oxford University Press.
Mische, A., and H. C. White. 1998. “Between Conversation and Situation: PublicSwitching Dynamics across Network Domains.” Social Research 65 (3): 695–724.
Montgomery, J. D. 1991. “Social Networks and Labor-Market Outcomes: Towards anEconomic Analysis.” American Economic Review 81 (5): 1408–18.
Moreno, J. L., H. H. Jennings, and J. Sargent. 1940. “Time as a Quantitative Indexof Inter-personal Relations.” Sociometry 3 (January): 62–80.
Newcomb, T. M. 1961. The Acquaintance Process. New York: Holt, Rinehart & Win-ston.
Obstfeld, D. 2005. “Social Networks, the Tertius Iungens Orientation, and Involvementin Innovation.” Administrative Science Quarterly 50:100–130.
Ord, K. 1975. “Estimation Methods for Models of Spatial Interaction.” Journal of theAmerican Statistical Association 70 (349): 120–26.
Padgett, J. F., and C. K. Ansell. 1993. “Robust Action and the Rise of the Medici.”American Journal of Sociology 98 (6): 1259–1319.
Pfeffer, J. 1983. “Organizational Demography.” Research in Organizational Behavior5:299–357.
Podolny, J. 2001. “Networks as the Pipes and Prisms of the Market.” American Journalof Sociology 107 (1): 33–60.
Podolny, J., and J. Baron. 1997. “Resources and Relationships: Social Networks andMobility in the Workplace.” American Sociological Review 62 (5): 673–93.
Putnam, R. D. 1995. “Bowling Alone: America’s Declining Social Capital.” Journal ofDemocracy 6 (1): 65–78.
Reagans, R., and B. McEvily. 2003. “Network Structure and Knowledge Transfer: TheEffects of Cohesion and Range.” Administrative Science Quarterly 48:240–67.
Reagans, R., and E. Zuckerman. 2001. “Networks, Diversity, and Productivity: TheSocial Capital of Corporate R&D Teams.” Organization Science 12 (4): 502–17.
———. 2008a. “All in the Family: Reply to Burt, Podolny, van de Rijt, Ban, andSarkar.” Industrial and Corporate Change 17 (5): 979–99.
———. 2008b. “Why Knowledge Does Not Equal Power: The Network RedundancyTrade-off.” Industrial and Corporate Change 17 (5): 903–44.
Reynolds, M., M. Van Alstyne, and S. Aral. 2009. “Privacy Preservation of Measure-ment Functions on Hashed Text.” Pp. 41–45 in Proceedings of the 8th AnnualSecurity Conference: Discourses in Security Assurance and Privacy, edited by G.Dhillon. Washington, D.C.: Information Institute Publishing.
Rodan, S., and D. Galunic. 2004. “More than Network Structure: How KnowledgeHeterogeneity Influences Managerial Performance and Innovativeness.” StrategicManagement Journal 25:541–62.
Salton, G., A. Wong, and C. S. Yang. 1975. “A Vector Space Model for AutomaticIndexing.” Communications of the ACM 18 (11): 613–20.
Schelling, T. C. 1978. Micromotives and Macrobehavior. Toronto: McLeod.Simmel, G. (1922) 1955. Conflict and the Web of Group Affiliation. New York: Free
Press.

Diversity-Bandwidth Trade-off
171
Simon, H. 1991. “Bounded Rationality and Organizational Learning.” OrganizationScience 2 (1): 125–34.
Sparrowe, R., R. Liden, S. Wayne, and M. Kraimer. 2001. “Social Networks and thePerformance of Individuals and Groups.” Academy of Management Journal 44 (2):316–25.
Steinberg, M. W. 1999. “The Talk and Back Talk of Collective Action: A DialogicAnalysis of Repertoires of Discourse among Nineteenth-Century English CottonSpinners.” American Journal of Sociology 105:736–80.
Swedberg, R. 1990. Economics and Sociology. Princeton, N.J.: Princeton UniversityPress.
Szulanski, G. 1996. “Exploring Internal Stickiness: Impediments to the Transfer ofBest Practice within the Firm.” Strategic Management Journal 17:27–43.
Tsai, W., and S. Ghoshal. 1998. “Social Capital and Value Creation: The Role ofIntrafirm Networks.” Academy of Management Journal 41 (4): 464–76.
Uzzi, B. 1996. “The Sources and Consequences of Embeddedness for the EconomicPerformance of Organizations: The Network Effect.” American Sociological Review61:674–98.
———. 1997. “Social Structure and Competition in Interfirm Networks: The Paradoxof Embeddedness.” Administrative Science Quarterly 42:35–67.
Uzzi, B., and J. Spiro. 2005. “Collaboration and Creativity: The Small World Problem.”American Journal of Sociology 111 (2): 447–504.
Van Alstyne, M., and E. Brynjolfsson. 2005. “Global Village or Cyber-Balkans? Mod-eling and Measuring the Integration of Electronic Communities.” Management Sci-ence 51 (June): 851–68
Van Alstyne, M., and N. Bulkley. 2004. “Why Information Should Influence Produc-tivity.” Pp. 145–73 in The Network Society: A Cross-Cultural Perspective, edited byManuel Castells. Cheltenham: Elgar.
Van Alstyne, M., and J. Zhang. 2003. “E-mailNet: A System for Mining Influence andNetwork Topology in Communication.” Paper presented at the meetings of the NorthAmerican Association for Computational, Social, and Organization Sciences, Pitts-burgh, June 22–25.
Walker, G., B. Kogut, and W. Shan. 1997. “Social Capital, Structural Holes and theFormation of an Industry Network.” Organization Science 8 (2): 109–25.
Watts, D. 1999. “Networks, Dynamics, and the Small-World Phenomenon.” AmericanJournal of Sociology 105 (2): 493–527.
Watts, D., and S. Strogatz. 1998. “Collective Dynamics of ‘Small-World’ Networks.”Nature 393:440–42.
Weick, K. 1979. The Social Psychology of Organizing. Reading, Mass.: Addison-Wesley.Weitzman, M. 1998. “Recombinant Growth.” Quarterly Journal of Economics 113 (2):
331–60.Wegner, E. 1987. “Transactive Memory: A Contemporary Analysis of the Group Mind.”
Pp. 185–208 in Theories of Group Behavior, edited by B. Mullen and G. Goethal.New York: Springer-Verlag.
White, H. 1980. “A Heteroscedasticity-Consistent Covariance Matrix Estimator anda Direct Test for Heteroscedasticity.” Econometrica 48 (4): 817–38.
White, H. C. 1995. “Network Switchings and Bayesian Forks: Reconstructing the Socialand Behavioral Sciences.” Social Research 62:1035–63.
———. 2000. “Modeling Discourse in and around Markets.” Poetics 27:117–35.Wu, F., B. Huberman, L. Adamic, and J. Tyler. 2004. “Information Flow in Social
Groups.” Physica A 337:327–35.