The Diurnal and Seasonal Variation of the Northern ... file1. Introduction A front is the ......
14
The Diurnal and Seasonal Variation of the Northern Australian Dryline SARAH J. ARNUP AND MICHAEL J. REEDER Centre for Dynamical Meteorology and Oceanography, Monash University, Clayton, Victoria, Australia (Manuscript received 16 June 2006, in final form 15 December 2006) ABSTRACT The diurnal and seasonal variations of the northern Australian dryline are examined by constructing climatologies of low-level dynamic and thermodynamic variables taken from the high-resolution Australian Bureau of Meteorology’s Limited Area Prediction Scheme (LAPS) forecasts from 2000 to 2003. The development of the dryline is analyzed within the framework of the frontogenesis function applied to the mixing ratio and the airstream diagnostics of Cohen and Schultz. A case study of 12–13 October 2002 illustrating the airmass boundaries over the Australian region is also examined. Daytime surface heating produces sea-breeze circulations around the coast and a large inland heat trough that extends east–west along northern Australia. At night, air parcels accelerate toward low pressure, increasing convergence and deformation within the heat trough. This sharpens the moisture gradient across the tropical and continental airmass boundary into a dryline. This is different than the dryline of the Great Plains in the United States, which generally weakens overnight. The Australian dryline is strongest in spring just poleward of the Gulf of Carpentaria, where the moisture gradient across the heat trough is enhanced by the coast, and the axis of dilatation is closely aligned with mixing ratio isopleths. The dryline is weakest in winter, when the heat trough is weak. The LAPS 3-h forecasts are in good agreement with observations obtained from the Automatic Weather Station network. The 3-h forecasts capture the observed diurnal and seasonal cycle of the airmass boundaries. However, the sea-breeze circulation and ageostrophic flow into the surface heat trough is limited by the model resolution. The LAPS 3-h forecasts may therefore underestimate the nocturnal intensification of the dryline, especially since the inland moisture content is overestimated. 1. Introduction A front is the sloping interface between air masses of different origins and with different thermodynamic properties. Examples in the Australian region include the summertime cool changes that sweep across south- ern Australia, their subtropical extensions that pen- etrate into the low latitudes in the dry season, and the sharp sea breezes common to most of the coastline [see the review by Reeder and Smith (1998) and the refer- ences therein]. A dryline is characterized by a large change in moisture accompanied by a relatively small change in temperature and is another example of an airmass boundary (Cohen and Kreitzberg 1997; Cohen and Schultz 2005). In the Australian region, a dryline forms inland from the northern coastlines from the dif- fuse moisture gradient across the tropical and continen- tal air masses. Despite the prominence of the dryline in the clima- tology of northern Australia, there have been few in- vestigations of its structure, daily evolution, or seasonal variation. One exception is James (1992) who examined the role of a dryline in initiating convection over north- eastern New South Wales (NSW) on 7 December 1979 (all places mentioned in the text are marked in Fig. 1). On this particular day, the synoptic environment over NSW was similar to the synoptic environment that gives rise to the dryline over the Great Plains. Over the Great Plains, moist maritime air is advected from the Gulf of Mexico to the dry plains by the southerly flow associ- ated with a lee cyclone. In James’ case study, a high pressure system centered over the Tasman Sea to the east of Australia advected warm, moist air onshore. A cold front was situated to the west of Tasmania, extend- ing equatorward through Adelaide, which is a common summertime synoptic pattern. The strong northerlies ahead of the front advected hot, dry inland air pole- Corresponding author address: Sarah J. Arnup, P.O. Box 28M, Monash University, Clayton, 3800 Victoria, Australia. E-mail: [email protected] AUGUST 2007 ARNUP AND REEDER 2995 DOI: 10.1175/MWR3455.1 © 2007 American Meteorological Society MWR3455
Transcript of The Diurnal and Seasonal Variation of the Northern ... file1. Introduction A front is the ......

The Diurnal and Seasonal Variation of the Northern Australian Dryline
SARAH J. ARNUP AND MICHAEL J. REEDER
Centre for Dynamical Meteorology and Oceanography, Monash University, Clayton, Victoria, Australia
(Manuscript received 16 June 2006, in final form 15 December 2006)
ABSTRACT
The diurnal and seasonal variations of the northern Australian dryline are examined by constructingclimatologies of low-level dynamic and thermodynamic variables taken from the high-resolution AustralianBureau of Meteorology’s Limited Area Prediction Scheme (LAPS) forecasts from 2000 to 2003. Thedevelopment of the dryline is analyzed within the framework of the frontogenesis function applied to themixing ratio and the airstream diagnostics of Cohen and Schultz. A case study of 12–13 October 2002illustrating the airmass boundaries over the Australian region is also examined. Daytime surface heatingproduces sea-breeze circulations around the coast and a large inland heat trough that extends east–westalong northern Australia. At night, air parcels accelerate toward low pressure, increasing convergence anddeformation within the heat trough. This sharpens the moisture gradient across the tropical and continentalairmass boundary into a dryline. This is different than the dryline of the Great Plains in the United States,which generally weakens overnight. The Australian dryline is strongest in spring just poleward of the Gulfof Carpentaria, where the moisture gradient across the heat trough is enhanced by the coast, and the axisof dilatation is closely aligned with mixing ratio isopleths. The dryline is weakest in winter, when the heattrough is weak. The LAPS 3-h forecasts are in good agreement with observations obtained from theAutomatic Weather Station network. The 3-h forecasts capture the observed diurnal and seasonal cycle ofthe airmass boundaries. However, the sea-breeze circulation and ageostrophic flow into the surface heattrough is limited by the model resolution. The LAPS 3-h forecasts may therefore underestimate thenocturnal intensification of the dryline, especially since the inland moisture content is overestimated.
1. Introduction
A front is the sloping interface between air masses ofdifferent origins and with different thermodynamicproperties. Examples in the Australian region includethe summertime cool changes that sweep across south-ern Australia, their subtropical extensions that pen-etrate into the low latitudes in the dry season, and thesharp sea breezes common to most of the coastline [seethe review by Reeder and Smith (1998) and the refer-ences therein]. A dryline is characterized by a largechange in moisture accompanied by a relatively smallchange in temperature and is another example of anairmass boundary (Cohen and Kreitzberg 1997; Cohenand Schultz 2005). In the Australian region, a drylineforms inland from the northern coastlines from the dif-
fuse moisture gradient across the tropical and continen-tal air masses.
Despite the prominence of the dryline in the clima-tology of northern Australia, there have been few in-vestigations of its structure, daily evolution, or seasonalvariation. One exception is James (1992) who examinedthe role of a dryline in initiating convection over north-eastern New South Wales (NSW) on 7 December 1979(all places mentioned in the text are marked in Fig. 1).On this particular day, the synoptic environment overNSW was similar to the synoptic environment that givesrise to the dryline over the Great Plains. Over the GreatPlains, moist maritime air is advected from the Gulf ofMexico to the dry plains by the southerly flow associ-ated with a lee cyclone. In James’ case study, a highpressure system centered over the Tasman Sea to theeast of Australia advected warm, moist air onshore. Acold front was situated to the west of Tasmania, extend-ing equatorward through Adelaide, which is a commonsummertime synoptic pattern. The strong northerliesahead of the front advected hot, dry inland air pole-
Corresponding author address: Sarah J. Arnup, P.O. Box 28M,Monash University, Clayton, 3800 Victoria, Australia.E-mail: [email protected]
AUGUST 2007 A R N U P A N D R E E D E R 2995
DOI: 10.1175/MWR3455.1
© 2007 American Meteorological Society
MWR3455

ward, producing a dryline between the drier inland airand the moist maritime air.
The aims of this paper are to document the diurnaland seasonal structure of the northern Australiandryline using the Bureau of Meteorology’s LimitedArea Prediction Scheme (LAPS) forecasts; to assessthe degree to which the LAPS 3-h forecasts capturethe diurnal variation of the low-level winds, andhence the diurnal cycle of the dryline; and to show howlarge-scale patterns of convergence and deformationover the northern part of the continent concentraterelatively weak gradients in the moisture into a sharpdryline.
The remainder of the paper is structured as follows.The data used are discussed in section 2. Section 3 out-lines the framework used to diagnose the physicalmechanism behind the formation of the dryline. Twoclosely connected methods are summarized briefly. Thefirst is simply the vector frontogenesis function as de-rived by Keyser et al. (1988) but with the water vapormixing ratio replacing potential temperature. The sec-ond method is that introduced recently by Cohen andSchultz (2005) to analyze the formation of airmassboundaries. This is followed in section 4 with a briefcase study that sets the scene for the climatological dis-cussions later in the paper. The case study examines thelow-level dynamic and thermodynamic environment ofthe individual airmass boundaries. Section 5 discussesseasonal averages of the fields presented in the casestudy. The diagnostic methods described in section 3are applied to the seasonally averaged fields in section6. In section 7, the seasonal averages of the LAPS 3-hforecast are compared with the seasonal averages of theAutomatic Weather Station (AWS) observations. Theconclusions are presented in section 8.
2. Data
A network of Automatic Weather Stations is main-tained by the Bureau of Meteorology over Australiaand surrounding islands. Manual observations aretaken also at remote outstations (the precise locationsare plotted in Fig. 9). Together, these stations providehigh-quality, regular observations of temperature,moisture, wind, pressure, and precipitation. However,the horizontal coverage provided by these stations isvery sparse over the northern and central regions ofAustralia, which are the regions on which the presentstudy focuses. For this reason, the analyses in this paperare based mainly on the Bureau of Meteorology’s op-erational Limited Area Weather Prediction System(Puri et al. 1998).
Briefly, LAPS is a combined forecast numericalmodel and an objective analysis scheme with a horizon-tal resolution of 0.375°. The forecast model is based onthe hydrostatic primitive equations in � coordinates,where � � p/ps, and includes a prognostic equation forthe surface temperature, as well as parameterizations ofthe boundary layer physics, large-scale and convectiveprecipitation, and radiation. Every 6 h, LAPS assimi-lates surface synoptic measurements, ship and driftingbuoy reports, radiosonde and upper-level wind obser-vations, satellite sounding data from the Television In-frared Observation Satellite (TIROS) Operational Ver-tical Sounder, Geostationary Meteorological Satellitecloud-drift winds, and single-level winds from aircraftreports.
The initial conditions are interpolated from the Bu-reau of Meteorology’s lower-resolution Global Analy-sis and Prediction system and consequently are rela-tively featureless. Only after a few hours of integrationdoes the mesoscale structure emerge in LAPS. There-fore, the 3-h forecasts from LAPS are used in this pa-per. These data are used to construct seasonal averagesfor 2000–2003 at 1600 and 0400 Australian eastern stan-dard time (EST), over December, January, February(summer); March, April, May (autumn); June, July,August (winter); and September, October, November(spring). However, the results presented emphasizespring and summer, as these are the seasons in whichthe dryline is most prominent.
The AWS observations are used to verify the LAPS3-h forecasts. Surface observations are taken every 3 h,starting at 0000 local standard time (LST). As there arethree time zones in Australia (not including westerncentral time), only one-third of the area is observed atany particular time and so a match between the LAPSforecast and local observations can be made for onlyone-third of the area at any given time. Since observa-
FIG. 1. Map of Australia with the place names mentioned in thetext marked.
2996 M O N T H L Y W E A T H E R R E V I E W VOLUME 135

tions in the Australian eastern standard time (EST;UTC � 10) and Australian western standard time(WST; UTC � 8) zones differ by 2 h, the LAPS forecastcorresponding to the intermediate time is used for com-parison. For example, the 1800 UTC LAPS forecast(which corresponds to 0200 WST and 0400 EST) will becompared to the 1900 UTC observations in the westerntime zone (0300 WST) and the 1700 UTC observationsin the eastern time zone (0300 EST). Australian centralstandard time is half an hour behind Australian easternstandard time and one and a half hours ahead of Aus-tralian western standard time, and consequently theLAPS forecast time does not correspond to any specificlocal standard time.
3. Deformation and the development of the dryline
Airmass boundaries, including fronts and drylines, aresharpened by differential advection associated with defor-mation and convergence. This section outlines brieflythe framework used to investigate how drylines formand why they form in a particular geographic location.
For the special case of horizontal flow, the materialrate of change of the horizontal gradient of any con-served passive tracer q can be expressed as
D
Dt�q � �nFn � sFs , �1�
where n � ��q/|�q | is the unit vector pointing alongthe tracer gradient toward lower values, s � n ∧ k is theunit vector tangential to the isopleth of q, and k is thevertical unit vector. Here, q is taken to be the watervapor mixing ratio, although in the original derivationof Eq. (1), Keyser et al. (1988) took it to be the poten-tial temperature. In addition,
Fn � �D
Dt|�q | �
12
|�q | �D � E� cos�2��� (2)
and
Fs � |�q |D�
Dt�
12
|�q | �� � E� sin�2���, �3�
where D is the divergence, E is the total deformation, is the vertical component of vorticity, and � is the anglebetween the axis of dilatation and the isopleths of q.1
On a sphere with longitude � and latitude , the
zonal and meridional coordinates can be redefined bydx � (re cos )d� and dy � red , where re is the radiusof the earth. In this case the zonal and meridional com-ponents of the velocity are u � dx/dt and � � dy/dt. Thequantities appearing in Eqs. (2) and (3) are defined byD � �u/�x � (cos )�(�/cos )/�y; E � �u/�x �(cos )�(�/cos )/�y, which is the stretching deforma-tion; F � ��/�x � (cos )�(u/cos )/�y, which is theshearing deformation; E � �E2 � F2; � ��/�x �(cos )�(u/cos )/�y; � � tan�1[�(�q/�x)/(�q/�y)], whichis the angle between the x axis and s; � � 1⁄2 tan�1(F/E),which is the angle between the x axis and the axis ofdilatation; and � � � � �.
The negative of Eq. (2) represents the material rateof change of the magnitude of the horizontal mixingratio gradient |�q | and has been called the accumula-tion of q by Saucier (1955), although this term is notcommonly used. When the conserved quantity is poten-tial temperature, the negative of Eq. (2) is known as the(scalar) frontogenesis function. In keeping with this ter-minology, �Fn will be called the mixing ratio (scalar)frontogenesis function. Equation (2) is written in aform that is independent of the coordinate system cho-sen and shows that total deformation increases the mix-ing ratio gradient provided � � 45°, whereas horizontalconvergence (�D) increases the gradient regardless ofthe orientation of the isopleths. Equation (3) representsthe material rate of change of the direction of the hori-zontal gradient of q in terms of the total deformationand the vertical component of the relative vorticity .Positive relative vorticity rotates the gradient anticlock-wise no matter what the orientation of the isopleths,while the deformation acts to rotate the gradient to-ward the axis of dilatation.
Cohen and Schultz (2005) have recently developed akinematic framework to describe the development ofairmass boundaries. While their theory begins by con-sidering the rate of change of separation betweenneighboring air parcels, some of the key results can bederived simply from the vector mixing ratio frontoge-nesis equation [Eq. (1)]. This is not surprising, as theseparation of neighboring fluid parcels and the forma-tion of filaments is inextricably tied to the formation ofgradients and the development of airmass boundaries.Provided E, D, and are assumed constant (or to varyslowly), Eq. (2) integrates to give |�q | � |�q |0 exp(�t),where |�q |0 is the magnitude of the mixing ratio gra-dient at the initial instant, and � � �1⁄2[D � E cos(2�)]is what Cohen and Schultz call the linear strain rate inthe direction of the gradient, which represents physi-cally the rate at which neighboring air parcels approachone another. The maximum separation rate across theisopleths, � � �1⁄2(D � E) � �i, is called the instan-
1 In the special case when the conserved variable is potentialtemperature and the flow is approximated by its geostrophicequivalent, Eq. (1) is called the vector frontogenesis function(Keyser et al. 1988) and equals the Q vector. To the extent thatthe quasigeostrophic approximation is applicable, the divergenceof the Q vector describes the forcing of vertical motion (Hoskinset al. 1978).
AUGUST 2007 A R N U P A N D R E E D E R 2997

taneous contraction rate by Cohen and Schultz and oc-curs when the axis of dilatation is parallel to the isop-leths of q.
As shown by Eq. (3), the orientation of the mixingratio gradient depends on the total deformation and thevertical component of the relative vorticity. For thisreason, Cohen and Schultz (2005) argue that, to theextent that the flow is steady, the asymptotic orienta-tion of an airmass boundary will be that orientation forwhich the rotational effects of deformation and vortic-ity cancel each other out. This orientation can be de-termined simply by setting Fs � 0. In this case, Eq. (3)shows that � � �1⁄2 sin�1(/E) � �a, which representsphysically the asymptotic angle between the isoplethsof q and the axis of dilatation. Moreover, �a � �a � �,which is what Cohen and Schultz call the asymptoticaxis of dilatation. It follows that the long-term rate atwhich neighboring air parcels approach each another is� � �1⁄2[D � E�1 � (2/E2)] � �a, which is calledthe asymptotic contraction rate by Cohen and Schultz.
4. Case study: 12–13 October 2002
The climatological fields, which are presented in thenext section and form the cornerstone of the paper,greatly smooth the airmass boundaries and emphasizegeographically fixed features. For this reason, the studybegins with a brief examination of the low-level ther-modynamic and wind fields in the Australian regionduring 12–13 October 2002. This case study shows thetypical structure and evolution of the individual airmassboundaries that form the climatology.
The sharp mixing ratio gradient across northern andeastern Australia is the most striking synoptic featureof the period 12–13 October 2002 (Figs. 2a,b). The mix-ing ratio gradient, which defines the dryline, is weakduring the day (Fig. 2a) before intensifying throughoutthe night, inland of the northern coast lines (Fig. 2b).Although not shown, the strong gradients in mixingratio weaken again the following day. This pattern ofchange was frequently observed during the period
FIG. 2. Mixing ratio gradient and potential temperature at 925 hPa at (a) 1300 EST 12 Oct 2002and (b) 0100 EST 13 Oct 2002. The temperature contour interval is 1 K. Light shading indicatesa mixing ratio gradient greater than 4 � 10�5 g kg�1 m�1; dark shading indicates greater than8 � 10�5 g kg�1 m�1. The ordinate is longitude in degrees; the abscissa is latitude in degrees. Theblank areas enclosed with a solid dark line indicate topography above 500 m.
2998 M O N T H L Y W E A T H E R R E V I E W VOLUME 135

2000–2003. In contrast, drylines observed over theGreat Plains are usually strongest during the afternoonand weakest overnight (Schaefer 1986). Typical maxi-mum values of the mixing ratio gradient in the LAPS3-h forecasts were 1–1.5 � 10�4 g kg�1 m�1. There islittle diurnal movement in the position of the sharpmixing ratio gradient.
The potential temperature maximum that occurs inthe northwest of the continent (17°S, 125°W) is anotherregular feature of northern Australia. A secondary maxi-mum is typically located southeast of the Gulf of Carpen-taria in northern Queensland (20°S, 142°W). As shownin Figs. 2a,b, these two maxima form the western andeastern ends of a heat trough that extends across northernAustralia (Fandry and Leslie 1984; Kepert and Smith1992; Adams 1993; Spengler et al. 2005). The drylineforms in the same location as the daytime heat trough.
Dewpoint temperatures are available for 1020 EST12 October and 1050 EST 13 October over northeast-
ern Australia from the Moderate Resolution ImagingSpectroradiometer (MODIS) aboard the Terra satel-lite. Although not shown, the corresponding LAPS 3-hforecasts are highly consistent with MODIS observa-tions.
With the cessation of surface heating overnight, thereis a large rearrangement in the low-level flow. Radia-tive cooling leads to the development of a stable layerof air at the surface. Turbulent mixing is suppressedwithin the stable layer and the surface winds subse-quently readjust to a new balance of forces. During thisreadjustment, the ageostrophic component of the windis accelerated down the pressure gradient (Figs. 3a,b).With time, the Coriolis force produces an anticlockwiseinertial turning of the winds. A similar process has beendocumented by May (1995) in a study based principallyon radiosondes across the continent and boundary layerobservations taken by a wind profiler at Mt. Isa. Innorthern Australia, air is accelerated toward the inland
FIG. 3. Ageostrophic wind and convergence at 925 hPa and mean sea level pressure (MSLP) at(a) 1300 EST 12 Oct 2002 and (b) 0100 EST 13 Oct 2002. The wind reference vector is located inthe bottom left corner of each panel. Light shading indicates convergence less than �5 � 10�5 s�1;dark shading indicates less than �10 � 10�5 s�1. The MSLP contour interval is 2 hPa. Theordinate is longitude in degrees; the abscissa is latitude in degrees. The blank areas enclosed witha solid dark line indicate topography above 500 m.
AUGUST 2007 A R N U P A N D R E E D E R 2999

heat trough from both the dry and moist sides of thedryline (Figs. 3a,b). The mixing ratio gradient is subse-quently sharpened where there is convergence into theheat troughs. The maximum mixing ratio gradient oc-curs prior to sunrise, after which the onset of surfaceheating destroys the stable layer. Turbulent mixingweakens the ageostrophic flow into the trough, and thesharp mixing ratio gradient is eroded.
Figure 4 shows the instantaneous contraction rate,the instantaneous axis of dilatation, and the mixing ra-tio at 1300 EST 12 October and 0100 EST 13 October.The instantaneous contraction rate, which measures themaximum rate at which air parcels approach one an-other, is much larger in the early hours of the morningthan in the early afternoon. Typically, the maximumcontraction rates occur around 0100 EST while the mix-ing ratio gradient continues to strengthen until sunrise.This pronounced increase arises from the nocturnal ac-celeration of the ageostrophic flow toward the heat
troughs as described above. The largest instantaneouscontraction rates occur along the axis of the heattrough, producing the sharp mixing ratio gradients in-land of the northern coasts and south of the Gulf ofCarpentaria. Large instantaneous contraction rates oc-cur overnight also along the cold front that extendsthrough central and southern Australia. Like the northAustralian dryline, the cold front over subtropical Aus-tralia strengthens overnight and weakens during theday (Smith et al. 1995; Deslandes et al. 1999; Reeder etal. 2000; Reeder and Tory 2005). For the most part, theinstantaneous axis of dilatation, which indicates the di-rection along which fluid parcels are stretched mostrapidly, is aligned with the regions of strongest mixingratio gradient.
5. Average low-level fields
The brief case study presented in section 4 shows thatthe low-level synoptic environment of northern Austra-
FIG. 4. Instantaneous axes of dilatation, instantaneous contraction rate [�1⁄2(D � E)], andmixing ratio at 925 hPa at (a) 1300 EST 12 Oct 2002 and (b) 0100 EST 13 Oct 2002. Light shadingindicates a contraction rate of greater than 4 � 10�5 s�1; dark shading indicates rate of contrac-tion greater than 8 � 10�5 s�1. The mixing ratio contour interval is 2 g kg�1 m�1. The ordinateis longitude in degrees; the abscissa is latitude in degrees. The blank areas enclosed with a soliddark line indicate topography above 500 m.
3000 M O N T H L Y W E A T H E R R E V I E W VOLUME 135
lia changes very significantly from day to night, leadingto the development of a dryline within the heat trough.This section examines the mean diurnal changes of thelow-level environment during each season and illus-trates that the development of the dryline is a regularnocturnal feature of northern Australia through thespring and summer.
Figures 2a,b show that the largest moisture gradientsoccur at the boundary between the moist tropical anddry continental air masses. While the coastal gradient isrelatively weak compared to the strong gradient thatmarks the dryline, the coastal gradient occurs every dayin the same geographical location, and consequentlymasks the signal of the dryline, which is less frequent,more intense, and more variable in its location. For thisreason, the model points in the LAPS 3-h forecastswhere the mixing ratio gradient is less than 5.0 � 10�5
g kg�1 m�1 are excluded from the calculation of theaverage. This simple procedure effectively filters thecoastal gradient from the averaged fields. The noctur-nal intensification of the mixing ratio gradient becomesmore pronounced as the threshold is increased; how-ever, a threshold of 5.0 � 10�5 g kg�1 m�1 enables alarge number of grid points to be retained in the aver-ages while excluding the weak coastal gradients. Thegeographical location of the 0400 and 1600 EST mixingratio gradient maxima is not sensitive to the choice ofthreshold.
The average mixing ratio gradients are presented inFigs. 5a–f. For all seasons, the strongest gradients occuralong the northern coast during the day, whereas theyare located inland overnight. During spring and sum-mer there is a pronounced nocturnal intensification ofthe mixing ratio gradient inland south of the Gulf of
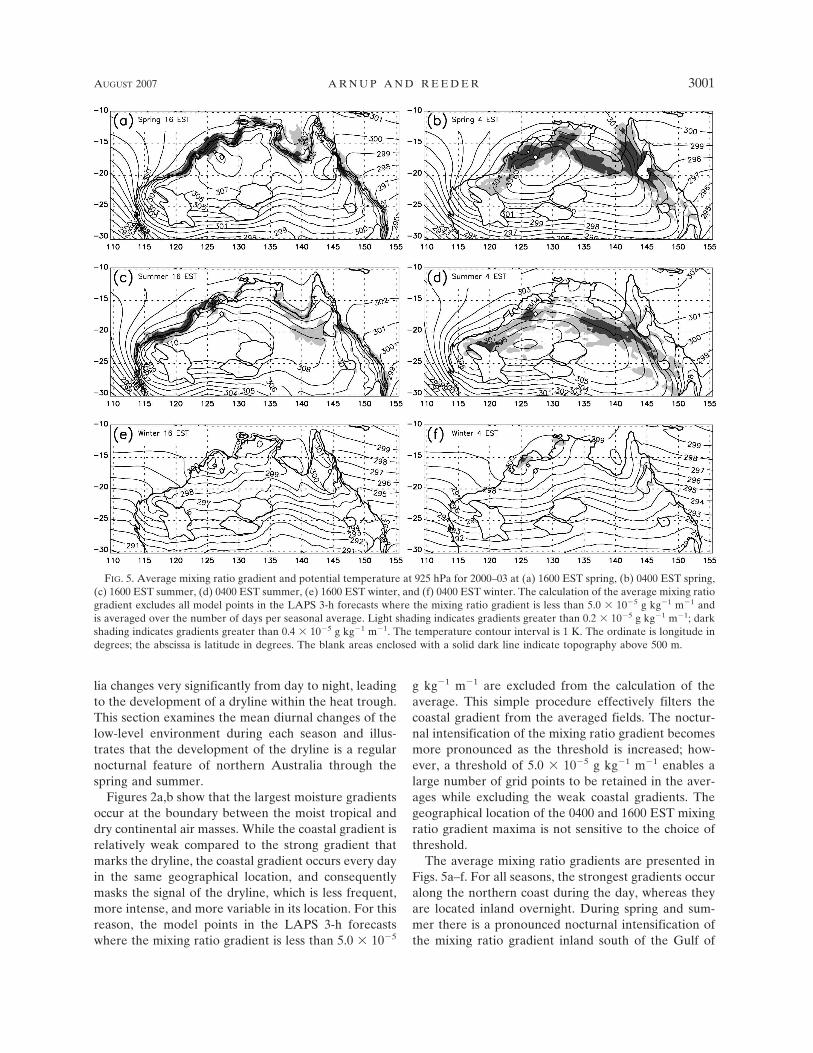
FIG. 5. Average mixing ratio gradient and potential temperature at 925 hPa for 2000–03 at (a) 1600 EST spring, (b) 0400 EST spring,(c) 1600 EST summer, (d) 0400 EST summer, (e) 1600 EST winter, and (f) 0400 EST winter. The calculation of the average mixing ratiogradient excludes all model points in the LAPS 3-h forecasts where the mixing ratio gradient is less than 5.0 � 10�5 g kg�1 m�1 andis averaged over the number of days per seasonal average. Light shading indicates gradients greater than 0.2 � 10�5 g kg�1 m�1; darkshading indicates gradients greater than 0.4 � 10�5 g kg�1 m�1. The temperature contour interval is 1 K. The ordinate is longitude indegrees; the abscissa is latitude in degrees. The blank areas enclosed with a solid dark line indicate topography above 500 m.
AUGUST 2007 A R N U P A N D R E E D E R 3001
Carpentaria (Figs. 5a–d). The nocturnal intensificationof the mixing ratio gradients over Cape York Peninsulaand northwestern Australia is unique to the spring av-erage (Figs. 5a,b). Both the daytime coastal and inlandnocturnal mixing ratio gradients are weak in autumn(not shown) and especially weak in winter (Figs. 5e,f).For brevity, the paper excludes the autumn figures butpresents winter to illustrate the contrast between thesummer and spring seasons.
In all seasons, the potential temperature maximumoccurs during the day in the northwest (15°–20°S,126°W; Figs. 5a,c,e). There is also a secondary maxi-mum to the east in northern Queensland (15°–20°S,142°W). In spring and summer, the two potential tem-perature maxima form a broad heat trough that extendsacross northern Australia and persists into the night(Figs. 6a–d). The highest potential temperatures withinthe heat trough occur in summer (Fig. 5c), at which
time it is large and lies farther poleward than the troughthat develops in spring and autumn (not shown). Inwinter (Figs. 5e,f) the trough is not evident. These heattroughs are an important synoptic feature of the conti-nent and are essential to the development of thedryline. Figures 5b,d show that the dryline developswithin the heat trough between the coastline and thepotential temperature maxima.
Typically, the strongest gradients in potential tem-perature are observed during the day along the coaststhrough spring and summer. Coastal gradients in thediabatic heating drive sea-breeze circulations, produc-ing the sharp daytime mixing ratio gradients observedin Figs. 5a,c. The LAPS 3-h forecasts, which have ahorizontal resolution of 0.375°, are unable to resolvethe sea-breeze fronts that develop along the Australiancoastline during the day. Nonetheless, the LAPS 3-hforecasts capture the broader-scale diabatically forced
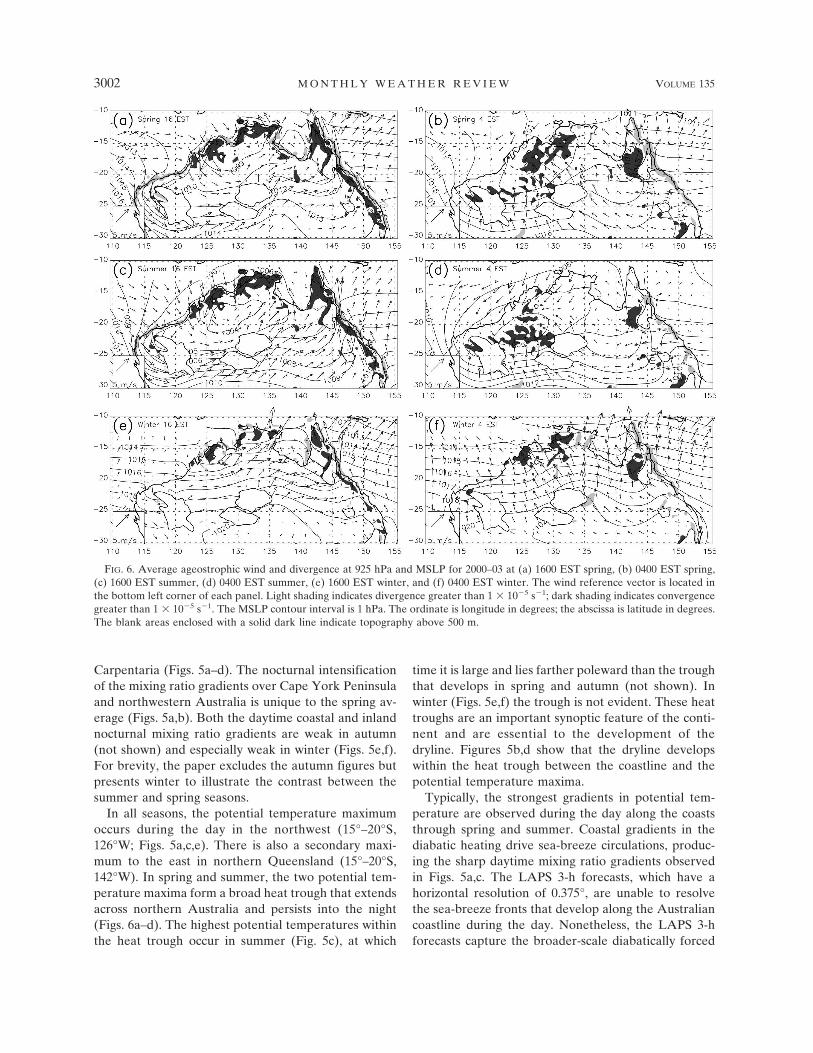
FIG. 6. Average ageostrophic wind and divergence at 925 hPa and MSLP for 2000–03 at (a) 1600 EST spring, (b) 0400 EST spring,(c) 1600 EST summer, (d) 0400 EST summer, (e) 1600 EST winter, and (f) 0400 EST winter. The wind reference vector is located inthe bottom left corner of each panel. Light shading indicates divergence greater than 1 � 10�5 s�1; dark shading indicates convergencegreater than 1 � 10�5 s�1. The MSLP contour interval is 1 hPa. The ordinate is longitude in degrees; the abscissa is latitude in degrees.The blank areas enclosed with a solid dark line indicate topography above 500 m.
3002 M O N T H L Y W E A T H E R R E V I E W VOLUME 135
circulation, generating low-level onshore ageostrophicflow through spring and summer. The ageostrophicflow is directed onshore along the northern and north-western coastlines, and a barrier jet exists along the eastcoast orography. Figures 6a,c,e show that the daytimeconvergence is strongest in the Tropics and subtropics.In these locations, the sea-breeze circulation is a regu-lar, well-developed feature of the climate. The variationin the inland extent of the sea-breeze front is manifestin the relatively broad region of convergence, whiledivergence occurs in a narrow band offshore.
There are large diurnal changes in the low-level windfield over the land at tropical and subtropical latitudes.These changes are especially prominent in the ageo-strophic wind and divergence as shown in Figs. 6a–f. Itis this striking rearrangement of the wind field thatleads to the nocturnal intensification of the northernAustralian mixing ratio gradient. Deslandes et al.(1999) documented a similar dramatic nocturnal changein the low-level wind field and showed that the en-hanced convergence and deformation strengthened thetwo main cold fronts observed during the 1991 CentralAustralian Fronts Experiment [see also Smith et al.(1995) and the modeling results reported by Reederand Tory (2005)].
Figures 6b,d,f show clearly the nocturnal accelerationof air toward the troughs generated by the surface heat-ing maxima (Figs. 5b,d,e). The extent and magnitude ofthe convergence of the low-level flow into the heattroughs are largest in summer (Fig. 6b) and weakest inautumn (not shown) and winter (Fig. 6d), reflecting theannual variation in the intensity of the surface heating.It is this ageostrophic flow that leads to the formationof a dryline. The diurnal changes in Figs. 6a–f also showthat the Coriolis force produces a regular anticlockwiseinertial turning of the ageostrophic wind. As discussedbelow, the daily inland advection of maritime air pro-vides the diffuse moisture gradient that is subsequentlysharpened into the dryline.
6. Development of the dryline
a. Diagnosis of the airstream boundaries
Figure 7 shows the instantaneous contraction ratesand the instantaneous axes of dilatation at 1600 and0400 EST during spring. The seasonal average of theinstantaneous and asymptotic axes of dilatation (notshown) is virtually the same since 2/E2 K 1 over mostof the domain. Hence the orientation of the dryline isset by the orientation of the deformation only. Whilethe diurnal changes in the ageostrophic wind are large(Fig. 6), the changes in the total wind are much smaller,and consequently the changes in the dilatation axes are
small too. During the day the contraction rates are larg-est along the coastline of north and northeastern Aus-tralia, while at night contraction rates are largest in theheat trough. At a given point, the instantaneous con-traction rates are larger than the asymptotic contractionrates (not shown). However, at a given time, the pat-terns of instantaneous and asymptotic contraction rateare very similar, although both change dramaticallyfrom day to night. A comparison of Figs. 5 and 7 showsthat the dryline forms at night where the contractionrates are largest.
b. Mixing ratio frontogenesis
A comparison of Figs. 8a–d and Figs. 5a–d shows thatthe climatological maxima of the mixing ratio fronto-genesis function are in good agreement with the clima-tological maxima of the mixing ratio gradient. Thesefigures show also that the preferred orientation of thedryline is mostly along the axis of dilatation.
During spring, the heat trough is located around17°S, just poleward of the northern coastline, and ex-tends east–west across to the base of the Gulf of Car-pentaria (Figs. 5a,b). As a result, the boundary betweenthe moist tropical and dry continental air masses liespoleward of the Gulf of Carpentaria (Figs. 8a,b). Thecoastal moisture gradient and the daytime sea-breezecirculation act to further enhance the moisture gradientacross the heat trough. Overnight, as air is acceleratedtoward the pressure minima, the contraction rate acrossthe isopleths and the magnitude of the gradient in-crease in the region of the heat trough (just as Figs.7a–d show the instantaneous and asymptotic contrac-tion rates increase). For this reason, the gradient of themixing ratio increases along the northwestern andnortheastern coasts (Fig. 8b). While the contractionrate is weaker poleward of the Gulf of Carpentaria thanin the heat troughs to the east and west (Fig. 6b), theangle between the axis of dilatation and mixing ratioisopleths is less than 45°, and consequently the mixingratio gradient increases rapidly (Fig. 8b). The gradientin the mixing ratio is enhanced also to the north ofCape York Peninsula where the axis of dilatation isoriented along the mixing ratio isopleths.
The mixing ratio gradient and mixing ratio frontoge-nesis function show also strong and frequent develop-ment of the dryline during summer (Figs. 8c,d, 5c,d).The heat trough and the corresponding nocturnal con-vergence and deformation maxima are located fartherpoleward than in spring, and consequently, the drylinemoves farther poleward. Figures 6d, 5d show that theheat trough, convergence, and the contraction rate arestrongest in summer. Despite this, the dryline is clima-tologically weaker both to the west of northern Austra-
AUGUST 2007 A R N U P A N D R E E D E R 3003

lia and over Cape York Peninsula when compared withspring (Figs. 5b,d). This is a result of the weaker back-ground moisture gradient and less favorable alignmentbetween the axis of dilatation and mixing ratio iso-pleths. Since the heat trough is located farther from thecoast and sea-breeze circulation, the background mix-ing ratio gradient is reduced when compared withspring (Figs. 8a–d). To the west of northern Australia,the dryline is then confined to the convergence maximain the region of the heat trough. Monsoonal westerliesadvect moist air over northwest Australia and CapeYork Peninsula, eroding the land–ocean moisture gra-dient. As a result, Cape York Peninsula is not a favor-able location for the development of the dryline in sum-mer. However, the dryline remains strong in the regionswhere the axis of dilatation lies along the heat trough,namely poleward of the Gulf of Carpentaria.
In the autumn and winter, the trough is weak (orabsent altogether) and lies much farther equatorwardthan in spring and summer (Figs. 5e,f). As a result, the
nocturnal acceleration is much weaker so that conver-gence and the contraction rate is reduced. Since thediffuse tropical and continent airmass boundary liesover the ocean, the coastal moisture gradient and sea-breeze circulations cannot act to increase the mixingratio gradient on one side of the boundary. Thus thedevelopment of the dryline is less frequent and weakerin autumn and winter than in spring and summer, asshown in Figs. 8e,f.
7. Comparison between the LAPS 3-h forecastanalyses and the AWS observations
The AWS observational network is relatively sparseand irregular. As a result, it is difficult to quantify thediurnal cycle of the mixing ratio gradient in the AWSobservations. Despite this limitation, the AWS obser-vations presented in this section show strong evidencefor the nocturnal strengthening of the mixing ratio gra-dient. The spring average of the AWS observations for2002 is compared with the corresponding data from
FIG. 7. Average instantaneous contraction rate [�1⁄2(D � E)] and instantaneous axes ofdilatation at 925 hPa for spring 2000–03 at (a) 1600 EST and (b) 0400 EST. Light shading indicatescontraction rate greater than 2 � 10�5 s�1; dark shading indicates contraction rate greater than3 � 10�5 s�1. The ordinate is longitude in degrees; the abscissa is latitude in degrees. The blankareas enclosed with a solid dark line indicate topography above 500 m.
3004 M O N T H L Y W E A T H E R R E V I E W VOLUME 135

LAPS at � � 0.9988 (�10 m) with the purpose of veri-fying the conclusions drawn in earlier sections that werebased on the 3-h model forecasts. Averages were per-formed only at stations that contained more than 45observations in the spring period.
The AWS observations show the large dewpoint tem-perature difference between the tropical and continen-tal air masses (Figs. 9a,b). These figures show thatLAPS accurately captures the location of this bound-ary. During the day (Fig. 9a), there is a pronouncedcoastal gradient in dewpoint temperature, which movesinland at night (Fig. 9b), increasing the moisture on thenorthern side of the dryline.
The low-level winds from the AWS observations andLAPS 3-h forecasts are compared in Figs. 10a–d. TheAWS observations during the day capture the develop-ment of a strong sea-breeze circulation around thenorthern coastline and the heat trough across northernAustralia, while at night they show an acceleration of
the wind toward the heat trough and an inertial turningof the wind (Figs. 10b,d). There is generally good agree-ment between the LAPS 3-h forecasts and the AWSobservations of both wind speed and direction. TheAWS observations verify the nocturnal acceleration ofthe low-level winds toward low pressure that occurredin the LAPS 3-h forecasts. It follows that the nocturnallow-level winds in the AWS observations will act toincrease the background mixing ratio gradient.
Nonetheless, there are some noteworthy differencesbetween the AWS observations and the LAPS 3-h fore-casts. First, the sea-breeze onshore winds are not wellresolved in the LAPS 3-h forecasts (Figs. 10b,d). As aresult, the LAPS 3-h forecasts probably underestimatethe subsequent advection of moist air inland. Second,the pressure minima in the heat lows are underesti-mated in LAPS 3-h forecasts (AWS observations ofpressure are not shown), reducing the nocturnal accel-eration of the wind toward low pressure. Third, over
FIG. 8. Average mixing ratio frontogenesis function and instantaneous axes of dilatation at 925 hPa for 2000–03 at (a) 1600 ESTspring, (b) 0400 EST spring, (c) 1600 EST summer, (d) 0400 EST summer, (e) 1600 EST winter, and (f) 0400 EST winter. Light shadingindicates mixing ratio frontogenesis rate greater than 1 � 10�10 g kg�1 s�1 m�1; dark shading indicates mixing ratio frontogenesis rategreater than 2.5 � 10�10 g kg�1 s�1 m�1. The ordinate is longitude in degrees; the abscissa is latitude in degrees. The blank areasenclosed with a solid dark line indicate topography above 500 m.
AUGUST 2007 A R N U P A N D R E E D E R 3005

the dry interior of the continent when the observeddewpoint is typically less than 5°C, the error in LAPScan be as high as 15°C during the day (Fig. 9a) and 10°Cduring the night (Fig. 9b). In contrast, over the coastaland southern parts of Australia the moisture contentsare in much better agreement with observation. It is notclear why the differences in dewpoint temperature canbe so large, but the three most likely sources of errorare the sparseness of the observations in the arid partsof the continent, the soil moisture scheme that esti-mates surface evaporation from climatology, and theboundary layer scheme, which may underestimateevaporation over the oceans. The differences betweenthe AWS observations and the LAPS 3-h forecasts sug-gest that the forecasts may underestimate the nocturnalincrease in the moisture gradient, through underesti-mating the extremes in the moisture content of the airmasses on either side of the boundary and the accel-eration of air toward that boundary.
8. Conclusions
The most prominent airmass boundaries in the sea-sonal and diurnal climatologies of the Australian regionare those that are determined principally by geography.These are the sea-breeze fronts and the dryline. Thesea-breeze circulation is a regular feature around thenorthern coastline, which is strongest through springand summer when the surface heating is most intense.The sea breeze advects tropical maritime air inland,producing a diffuse strip of moist air around the coast-line. The dryline develops overnight from the weakboundary between the tropical and continental airmasses. Like the sea-breeze circulation, the dryline isstrongest in spring and summer. In contrast to thedryline of the Great Plains in the United States, theAustralian dryline strengthens overnight.
The climatologies reveal a dramatic diurnal rear-rangement of the low-level flow. During the day, sur-
FIG. 9. Average dewpoint temperature for spring 2002. LAPS 3-h forecasts at � � 0.9988(contours) and the AWS observations at 10 m (filled boxes). The contour interval is 2 K. Lightshading indicates dewpoint temperatures greater than 288 K, medium shading is from 278 to 288K, and black shading is temperatures less than 278 K. LAPS 3-h forecast at (a) 1600 EST andAWS observations at 1500 LST and (b) 0400 EST and AWS observations at 0300 LST. Theordinate is longitude in degrees; the abscissa is latitude in degrees.
3006 M O N T H L Y W E A T H E R R E V I E W VOLUME 135

face heating leads to the formation of an extensive heattrough across northern Australia. It is centered to thenorthwest of the continent and extends eastward, frompoleward of the Gulf of Carpentaria to the base ofCape York Peninsula. The location of the trough shiftsfrom 20°S in summer to well equatorward of Australiain winter, as the latitude of the maximum of solar in-solation moves with the seasons. At night, radiativecooling leads to the development of a stable layer andsurface friction is reduced. As surface winds readjust toa new balance of forces, air accelerated toward lowpressure. This increases the low-level convergence anddeformation within the heat trough.
Convergence acts to compress the background mois-ture gradient in the region of the heat trough. Defor-mation increases the moisture gradient where the anglebetween the axis of dilatation and the mixing ratio iso-pleths is less than 45°. These processes lead to the noc-turnal intensification of the diffuse moisture gradientacross the tropical and continental airmass boundary.The largest increases to the moisture gradient occurwhere the heat trough, and hence the axis of dilatation,is aligned with the background moisture gradient.Hence the dryline develops where the mixing-ratiofrontogenesis is largest, which is also the location pre-dicted by the airstream boundary diagnostics of Cohenand Schultz (2005). These results suggest that thedryline is a product of differential moisture advectionand that differences in the surface fluxes of moisture
play little part. Moreover, while the dryline develops inthe extensive heat trough that lies across northern Aus-tralia, the vorticity was found to be small in comparisonwith the deformation. Consequently, the instantaneousand asymptotic axes of dilatation were almost identical,as were the instantaneous and asymptotic contractionrates.
The moisture gradient across the tropical and conti-nental airmass boundary is especially strong in spring,as the heat trough lies just poleward of the Gulf ofCarpentaria. The coastal moisture gradient and the sea-breeze circulation enhance the moisture contrast acrossthe trough. As a result, the dryline is most intense inspring, rather than in summer when the heat trough isstronger but located farther poleward. The dryline isweak and less frequent in autumn and winter when theheat troughs are less well developed, and the tropicaland continental airmass boundary lays equatorward ofthe Australian continent.
The LAPS 3-h forecasts were found to be in goodagreement with the AWS observations, although therewere some discrepancies in the magnitudes of low-levelvariables; LAPS 3-h forecast overestimated the inlandmoisture, and the representation of the sea-breeze cir-culation and the surface heat trough was limited by themodel resolution. As a result, the LAPS 3-h forecastsmay underestimate the nocturnal intensification of thedryline.
The diurnal cycle of the northern Australian dryline
FIG. 10. Average horizontal wind for spring 2002. LAPS 3-h forecasts at � � 0.9988 and the AWS observations at 10 m. The windreference vector is located in the bottom left corner of each panel. (a) LAPS 3-h forecast at 1600 EST, (b) AWS observation at 1500LST, (c) LAPS 3-h forecast at 0400 EST, and (d) AWS observation at 0300 LST. The ordinate is longitude in degrees; the abscissa islatitude in degrees.
AUGUST 2007 A R N U P A N D R E E D E R 3007

is opposite to that documented for the Great Plains ofthe United States. In both the northern Australian andGreat Plains environment, radiative cooling leads tothe development of a nocturnal stable layer. However,nocturnal acceleration of air toward low pressure doesnot strengthen the moisture gradient over the GreatPlains to the extent that is evident over northern Aus-tralia. Rather, horizontal mixing within the stable layerweakens the moisture gradient (Schaefer 1986).
At night, moist air over the Great Plains is confinedbelow a temperature inversion with dry air aloft, andthe remnant daytime mixed layer is shallower over thehigher terrain. During the day, solar heating and theresultant mixing cause the shallower end of the bound-ary layer to grow more rapidly than the deeper part ofthe boundary layer. Consequently, dry air is entrainedat a greater rate into the boundary layer at higher el-evation than at lower elevation, which in turn sharpensthe dryline. However, over northern Australia, the to-pography is flatter than in the Great Plains, and themoist side of the dryline does not have a sharp top.Turbulent mixing erodes the sharp moisture gradientacross the dryline as ageostrophic flow into the heattrough is disrupted.
This paper has illustrated that the dryline is a promi-nent feature of the Australian climate, yet its impor-tance in the mesoscale weather over Australia has re-ceived little attention. In particular, the role of thedryline in initiating convection over northern Australiainvites further work. The differences between thedryline that develops in northern Australia and overthe U.S. Great Plains have only been touched upon inthis paper and warrant further research also.
Acknowledgments. We thank Blair Trewin (Bureauof Meteorology Research Centre) for providing theAWS data. We are grateful to Robert Cohen, DavidSchultz, and Roger Smith for their detailed and con-structive reviews, which greatly improved the manu-script.
REFERENCES
Adams, M., 1993: A linear study of the effects of heating andorography on easterly airstreams with particular reference tonorthern Australia. Aust. Meteor. Mag., 42, 8991–9002.
Cohen, R. A., and C. W. Kreitzberg, 1997: Airstream boundariesin numerical weather simulations. Mon. Wea. Rev., 125, 168–183.
——, and D. M. Schultz, 2005: Contraction rate and its relation-ship for frontogenesis, the Lyapunov exponent, fluid trap-ping, and airstream boundaries. Mon. Wea. Rev., 133, 1353–1369.
Deslandes, R., M. J. Reeder, and G. Mills, 1999: Synoptic analysesof a subtropical cold front observed during the 1991 CentralAustralian Fronts Experiment. Aust. Meteor. Mag., 48, 87–110.
Fandry, C. B., and L. M. Leslie, 1984: A two-layer quasi-geostrophic model of summer trough formation in the Aus-tralian subtropical easterlies. J. Atmos. Sci., 41, 807–818.
Hoskins, B. J., I. Draghici, and H. C. Davies, 1978: A new look atthe �-equation. Quart. J. Roy. Meteor. Soc., 104, 31–38.
James, J. N., 1992: A preliminary study of mesoscale convectivecomplexes over the mid-latitudes of eastern Australia. Tech.Rep. 66, Bureau of Meteorology, Melbourne, Australia, 30pp.
Kepert, J. D., and R. K. Smith, 1992: A simple model of the Aus-tralian west coast trough. Mon. Wea. Rev., 120, 2042–2055.
Keyser, D., M. J. Reeder, and R. J. Reed, 1988: A generalizationof Petterssen’s frontogenesis function and its relation to ver-tical motion. Mon. Wea. Rev., 116, 762–780.
May, P. T., 1995: The Australian nocturnal jet and diurnal varia-tions of the boundary layer winds over Mt. Isa in northeast-ern Australia. Quart. J. Roy. Meteor. Soc., 121, 987–1003.
Puri, K., G. S. Dietachmayer, G. A. Mills, N. E. Davidson, R. A.Bowen, and L. W. Logan, 1998: The new BMRC LimitedArea Prediction Scheme, LAPS. Aust. Meteor. Mag., 47, 203–223.
Reeder, M. J., and R. K. Smith, 1998: Mesoscale meteorology.Meteorology of the Southern Hemisphere, D. Vincent andD. J. Karoly, Eds., Amer. Meteor. Soc., 201–241.
——, and K. J. Tory, 2005: The effect of the continental boundarylayer on the dynamics of fronts in a 2D model of baroclinicinstability. II: Surface heating and cooling. Quart. J. Roy.Meteor. Soc., 131, 2409–2429.
——, R. K. Smith, R. Deslandes, N. J. Tapper, and G. A. Mills,2000: Subtropical fronts observed during the 1996 CentralAustralian Fronts Experiment. Aust. Meteor. Mag., 49, 181–200.
Saucier, W. J., 1955: Principles of Meteorological Analysis. Uni-versity of Chicago Press, 438 pp.
Schaefer, J. T., 1986: The dryline. Mesoscale Meteorology andForecasting, P. S. Ray, Ed., Amer. Meteor. Soc., 549–572.
Smith, R. K., M. J. Reeder, N. J. Tapper, and D. R. Christie, 1995:Central Australian cold fronts. Mon. Wea. Rev., 123, 16–38.
Spengler, T., M. J. Reeder, and R. K. Smith, 2005: The dynamicsof heat lows in simple back-ground flows. Quart. J. Roy. Me-teor. Soc., 131, 3147–3165.
3008 M O N T H L Y W E A T H E R R E V I E W VOLUME 135