January 2008 Chad Young Director, Distribution Channels U.S.

The Distribution of U.S. Oil and Natural Gas Wells by Production Rate
December 2017
Independent Statistics & Analysis
www.eia.gov
U.S. Department of Energy
Washington, DC 20585

U.S. Energy Information Administration | The Distribution of U.S. Oil and Natural Gas Wells by Production Rate i
This report was prepared by the U.S. Energy Information Administration (EIA), the statistical and analytical agency within the U.S. Department of Energy. By law, EIA’s data, analyses, and forecasts are independent of approval by any other officer or employee of the United States Government. The views in this report therefore should not be construed as representing those of the U.S. Department of Energy or other federal agencies.

December 2017
U.S. Energy Information Administration | The Distribution of U.S. Oil and Natural Gas Wells by Production Rate 1
Introduction
This report provides yearly estimates of the number of producing oil and natural gas wells, which are grouped into 26 production volume brackets ranging from less than 1 barrel of oil equivalent per day (BOE/day) to more than 12,800 BOE/day. Wells are also designated as either oil or natural gas wells based on a gas-oil ratio (GOR) of 6,000 cubic feet (cf) of gas to 1 barrel (b) of oil (cf/b) for each year’s production. If the GOR is less than 6,000 cf/b, then the well is classed as an oil well. If the GOR is greater than 6,000 cf/b, then the well is classed as a natural gas well.
The total volumes shown in the distribution tables may not exactly equal other related data, including other EIA sources. Major reasons for discrepancies include: the timing of updates from state and commercial sources, the summed production of available well-level production data versus state-level aggregations of production (sometimes state-level data are available sooner than well-level data), and the definition of a well and which entity is counted and summed.
This report includes four sections: an explanation of what a well is, methodology, frequently asked questions, and suggestions for querying the downloadable Excel data file of individual state data. The distribution tables for the production rates of all U.S. oil and natural gas wells cover the years 2000 through 2016. The Appendix provides summary breakouts for the total United States, each state, the Federal Gulf of Mexico, and the Federal Pacific.
Four figures provide an overview of the distribution of producing oil and natural gas wells between 2000 and 2016 (data for 2016 are less complete than for other years). Figure 1 shows that most of the wells produce less than 15 BOE/day. Figure 2 shows the rapid increase in horizontal wells over the past decade. Figures 3 and 4 show most U.S. oil and natural gas production comes from wells producing between 100 and 3,200 BOE/day. The Appendix C spreadsheet can be used to generate these types of figures for all regions and for additional variables.
The quality and completeness of the available data used to build the tables vary by state. The data originates from state administrative records of monthly well or lease-level natural gas and liquid production. The main commercial data source is Drillinginfo, which is supplemented by IHS Markit. Some state agencies do not make well-production data available until years after production occurs, and others have never made well-production data available. For the late-reporting states–Kentucky, Missouri, and Tennessee–the last year of reported data is used to populate recent missing years to achieve the most complete U.S. total well counts. Data is not available for Illinois and Indiana.

December 2017
U.S. Energy Information Administration | The Distribution of U.S. Oil and Natural Gas Wells by Production Rate 2
Source: U.S Energy Information Administration
Source: U.S Energy Information Administration
-
200,000
400,000
600,000
800,000
1,000,000
1,200,000
2000 2002 2004 2006 2008 2010 2012 2014 2016
> 12,8006,400 - 12,8003,200 - 6,4001,600 - 3,200800 - 1,600400 - 800200 - 400100 - 20050 - 10040 - 5030 - 4025 - 3020 - 2515 - 2012 - 1510 - 128 - 106 - 84 - 62 - 41 - 20 - 1
Figure 1. U.S. total wells by production rate bracketswells
Production rate brackets (BOE/well/day)
-
20,000
40,000
60,000
80,000
100,000
120,000
2000 2002 2004 2006 2008 2010 2012 2014 2016
> 12,8006,400 - 12,8003,200 - 6,4001,600 - 3,200800 - 1,600400 - 800200 - 400100 - 20050 - 10040 - 5030 - 4025 - 3020 - 2515 - 2012 - 1510 - 128 - 106 - 84 - 62 - 41 - 20 - 1
Figure 2. U.S. total horizontal wells by production rate bracketswells
Production rate brackets (BOE/well/day)

December 2017
U.S. Energy Information Administration | The Distribution of U.S. Oil and Natural Gas Wells by Production Rate 3
Source: U.S Energy Information Administration
Source: U.S Energy Information Administration
Considerations when using the distribution tables (i.e., what is a well?)
Consistency with other data sources. The total volumes shown in the distribution tables may not exactly equal other related data, including other EIA sources. Major reasons for discrepancies include: the timing of updates from state and commercial sources, the summed production of available well-level production data versus state-level aggregations of production (sometimes state-level data are available sooner than well-level data), and the definition of a well and which entity is counted and summed.
-
1.4
2.7
4.1
5.5
6.8
8.2
9.6
11.0
-
500
1,000
1,500
2,000
2,500
3,000
3,500
4,000
2000 2002 2004 2006 2008 2010 2012 2014 2016
> 12,8006,400 - 12,8003,200 - 6,4001,600 - 3,200800 - 1,600400 - 800200 - 400100 - 20050 - 10040 - 5030 - 4025 - 3020 - 2515 - 2012 - 1510 - 128 - 106 - 84 - 62 - 41 - 20 - 1
Production rate brackets (BOE/well/day)
Figure 3. Oil production from U.S. wells by production rate bracketsmillion barrels per year million barrels per day
-
13.7
27.4
41.1
54.8
68.5
82.2
95.9
-
5,000
10,000
15,000
20,000
25,000
30,000
35,000
2000 2002 2004 2006 2008 2010 2012 2014 2016
> 12,8006,400 - 12,8003,200 - 6,4001,600 - 3,200800 - 1,600400 - 800200 - 400100 - 20050 - 10040 - 5030 - 4025 - 3020 - 2515 - 2012 - 1510 - 128 - 106 - 84 - 62 - 41 - 20 - 1
Figure 4. Natural gas from U.S. wells by production rate bracketsbillion cubic feet billion cubic feet per day
Production rate brackets (BOE/well/day)

December 2017
U.S. Energy Information Administration | The Distribution of U.S. Oil and Natural Gas Wells by Production Rate 4
This report and the tables include the following types of wells:
• Single wellhead • Sidetrack • Completion • Recompletion • Lease
Every producing entity in the Drillinginfo database is included. When the number of wells on a lease is available, the total lease production is equally distributed among the wells; although, in some cases, the commercial source has allocated individual well production in proportion to well test results. Sometimes, only a lease and its total production are available, with no count of wells. This situation leads to undercounting wells in some areas.
Production volume accounting. We have tried to identify and remove recycled or reinjected natural gas from the gross gas volumes reported by states such as Alaska. We have also attempted to identify fields that have undergone or are undergoing natural gas injection. Production levels in these fields are reduced by an equal share of the field-level injected natural gas reported by the states. Injection wells are not included in the counts unless they were once producing wells; in which case, they are included for their years in production.
The pressure base used to record natural gas volumes varies by state. For consistency, we converted all natural gas volumes to the federal pressure base of 14.73 pounds per square inch absolute (psia). However, we did not make adjustments to account for differences in the temperature base. Because states vary in how they define a well type (oil or gas), we have used a gas-oil ratio of 6,000 cubic feet of natural gas to 1 barrel of oil to designate a well as a natural gas well. Wells with a smaller gas-oil ratio are designated as oil wells.
Finally, we did not include wells that produce exclusively within carbon dioxide (CO2) fields, storage wells, and dry holes.
Methodology
How EIA analyzed and aggregated the data. First, we use the number of days of production activity to convert volumes to a daily rate for the barrels of oil equivalent (BOE) rate classes in the tables. For this calculation, we did not use the reported days on production measure for a well because it is often not available in the database. Instead, we used calendar days for consistency. To determine the months in production for the calculation, we determined the monthly production data for the first month and year of production and the last month and year of production for each well. We counted days of production using the number of calendar days in each month for the first year and last year of production. For the middle years of production, we used full years of 365 (or 366) days for days of production.
Next, we summed the monthly liquid and natural gas volumes, along with the number of days of production, to determine annual totals for each well. We converted the annual natural gas volume to

December 2017
U.S. Energy Information Administration | The Distribution of U.S. Oil and Natural Gas Wells by Production Rate 5
BOE using the relationship of 1 barrel of oil to 6,000 cubic feet of natural gas. We classified the well as an oil well if its production of barrels of oil was greater than the natural gas production converted to BOE, and as a natural gas well if its BOE production was greater than the oil production. The natural gas BOE was then added to the liquid value for a total BOE for each year of the well’s production. We divided this total BOE by the number of calendar days the well was in production status, often a partial year for the first and last years and a full year for middle years. Each year of a well’s production appears in the appropriate BOE rate class in the tables.
Finally, we summed the well counts and production levels for each rate class to produce the yearly state tables for the report.
Frequently Asked Questions
What is the average production rate of a well, and how does this rate differ between oil wells and natural gas wells?
In 2016, the average oil well produced 19 barrels per day (b/d), while the average natural gas well produced about 132,000 cubic feet per day. However, the distribution is generally skewed, with many wells producing smaller volumes per day and fewer wells producing very large volumes per day. In 2016, 80% of the more than 1 million U.S. wells produced 15 barrels of oil equivalent per day (BOE/day) or less, and 5% of the wells produced more than 100 BOE/day.
What are some of the key conclusions that can be drawn from your data?
EIA published several Today In Energy articles in 2016 based on earlier versions of the data, including:
• Oil wells drilled horizontally are among the highest-producing wells on November 4, 2016
• Stripper wells accounted for 11% of U.S. natural gas production in 2015 on July 28, 2016
• Stripper wells accounted for 10% of U.S. oil production in 2015 on June 29, 2016
What is the source of EIA’s data, and how do you collect it?
The data are primarily from Drillinginfo, supplemented by IHS Markit. EIA receives a monthly download from Drillinginfo containing the most recent production information. These data are augmented with data on well completions from a monthly download from IHS Markit. These commercial data sources collect their data from the various state agencies involved in regulating oil and natural gas production.

December 2017
U.S. Energy Information Administration | The Distribution of U.S. Oil and Natural Gas Wells by Production Rate 6
How often is well production data for the Lower 48 states collected?
Some states make data available within a few months after a new well begins production, while other states may take more than 18 months to release that data. The average lag between a new well’s first production and reported production in the database is six to eight months.
In addition, historical data are subject to revision, as some states continue collecting and digitizing older well datasets for inclusion in their databases. Also, states may revise data if they identify inaccuracies.
How often will EIA update this report?
Subject to resource constraints, we plan to update this report in August or September each year as complete or nearly complete data for the prior year are available for most states.
How does counting only wellheads compare to the counts in this report, which also include sidetracks, completions, and recompletions?
EIA estimates of U.S. wellhead counts (e.g., the EIA Natural Gas Annual number of producing natural gas wells) average 3%–4% lower than the counts in this report. For Colorado and New Mexico, wellhead counts are 12%–15% lower than the counts in this report.
Does a natural gas well remain a natural gas well over its entire production history?
In this report, we sometimes classify a well as a natural gas well in one year and an as oil well in another year, and vice versa, depending on a well’s gas- -oil ratio. We used this approach because the respective volumes of liquid and natural gas produced by a well can change significantly over its production history.
How is associated natural gas versus non-associated gas handled?
We did not use that distinction explicitly in this report. The associated/non-associated distinction depends on whether the well is classified as an oil well or a natural gas well. If the well is classified as a natural gas well, then the natural gas is called non-associated gas, and the liquid is called condensate. If the well is classified as an oil well, then the natural gas is called associated gas, and the liquid is called oil.

December 2017
U.S. Energy Information Administration | The Distribution of U.S. Oil and Natural Gas Wells by Production Rate 7
How are lags in data reporting accounted?
We included notes in the tables to indicate states that are missing current data because of a lag in reporting on an annual basis. For missing years, we repeat a state’s latest data. We don’t attempt to estimate data that may be missing within a reported year. See Appendix A for a summary table of missing or incomplete state data.
How long after a well starts producing is it classified into a production-rate bracket?
We include a well in our analysis as soon as data for the first month of production are available in the database.
Do all wells produce both oil and natural gas?
Most wells produce both oil and natural gas, but some wells produce only one or the other.
Does the specific reservoir, formation, or play determine the amount of oil and natural gas produced?
Yes. Different zones within the same reservoir (depending on the hydrocarbon content, depth, and burial history) will produce only liquids, a mix of liquids and natural gas, or only natural gas.
Why do some states have productive drilling sites, while others do not?
The best producing areas are often large basins with thick layers of sedimentary rock that accumulated over long periods of time, which also contain oil and natural gas. States such as North Dakota, Texas, and Pennsylvania have productive drilling sites because they cover large areas of these basins. Subsurface geology and paleogeography are the most important factors in determining whether a state might be an oil and natural gas producer.
Has the productivity of wells changed since horizontal drilling and hydraulic fracturing technology have advanced?
Horizontal drilling and hydraulic fracturing have greatly increased both oil and natural gas production rates and also decline rates of onshore wells in the United States.

December 2017
U.S. Energy Information Administration | The Distribution of U.S. Oil and Natural Gas Wells by Production Rate 8
What is a stripper well?
A stripper well, also called a marginal well, is an oil or natural gas well that is nearing the end of its economically useful life. However, these wells can continue to produce small volumes for long periods of time. There are many of these wells, and together they produced approximately 10% of total U.S. oil and natural gas in 2016. There are several production levels used to define a stripper well. The Interstate Oil and Gas Compact Commission uses 10 b/d or less of oil or 60,000 cubic feet or less of natural gas per day over a 12-month period. The Internal Revenue Service (IRS)—for tax purposes—uses 15 b/d or less of oil or 90,000 cubic feet or less of natural gas per day over a calendar year. EIA uses the IRS definition.
What happens to a well after it stops producing oil or natural gas?
A nonproducing well is usually plugged and abandoned. However, if significant amounts of hydrocarbons are suspected to remain in the reservoir, the well may undergo secondary or tertiary recovery.
What is the difference between wet gas and dry gas?
See the EIA Glossary for definitions for wet natural gas and dry natural gas.
Are any wells still drilled using only conventional drilling practices?
Yes. Many vertical wells are still drilled and completed without hydraulic fracturing; however, these wells and older completion techniques are becoming less common. Based on the larger number of wells and footage drilled, horizontal drilling combined with hydraulic fracturing have become standard practice for oil and natural gas production in the United States.

December 2017
U.S. Energy Information Administration | The Distribution of U.S. Oil and Natural Gas Wells by Production Rate 9
Suggestions for Querying the Appendix C Excel Data File
Data are provided in a flat-file format for all states for each year from 2000 to 2016 and by well-size class. The Filter tool in Excel provides one of the fastest methods for viewing a subset of the data (Figure 5). For example, the filters in Figure 6 are set to select only AK (Alaska) and the year 2016. In Figure 7, the filters are set to select AK totals for all years and to sort chronologically.
Figure 5.
Figure 6.

December 2017
U.S. Energy Information Administration | The Distribution of U.S. Oil and Natural Gas Wells by Production Rate 10
Figure 7.
A pivot table is also set up to help organize the data to make charts. In Figure 8, the United States is selected in cell B1, and the subtotal rows have been deselected in cell A4. Figure 9 shows a chart of the data in Figure 8.
Figure 8.

December 2017
U.S. Energy Information Administration | The Distribution of U.S. Oil and Natural Gas Wells by Production Rate 11
Figure 9.
-
200,000
400,000
600,000
800,000
1,000,000
1,200,000
2000 2002 2004 2006 2008 2010 2012 2014 2016
> 12,8006,400 - 12,8003,200 - 6,4001,600 - 3,200800 - 1,600400 - 800200 - 400100 - 20050 - 10040 - 5030 - 4025 - 3020 - 2515 - 2012 - 1510 - 128 - 106 - 84 - 62 - 41 - 20 - 1
U.S. total wells by production rate bracketswells
Production rate brackets (BOE/well/day)

December 2017
U.S. Energy Information Administration | The Distribution of U.S. Oil and Natural Gas Wells by Production Rate 12
Appendix A Reporting status by state and year .................................................................................................... A1
Availability of completion, well, and lease data by state .................................................................... A2
Appendix B Oil and natural gas well summary statistics:
United States oil and natural gas well summary statistics for years 2000-2016 ................................. B1
Most recent year of available data for each state and federal offshore regions .............................. B18
Appendix C Separate Excel flat file with all data

December 2017
Table A1: Reporting status by state and year
State 2000 ‐ 2012 2013 2014 2015 2016
AK Complete Complete Complete Complete Complete
AL Complete Complete Complete Complete Complete
AR Complete Complete Complete Complete Complete
AZ Complete Complete Complete Complete Complete
CA Complete Complete Complete Complete Complete
CO Complete Complete Complete Complete Complete
FL Complete Complete Complete Complete Complete
Federal Gulf Complete Complete Complete Complete Complete
Federal Pacific Complete Complete Complete Complete Complete
IL NA NA NA NA NA
IN NA NA NA NA NA
KS Complete Complete Complete Complete Complete
KY Complete Complete Incomplete Not Reported Not Reported
LA Complete Complete Complete Complete Complete
MD Complete Complete Complete Complete Complete
MI Complete Complete Complete Complete Complete
MO Complete Complete Complete Not Reported Not Reported
MS Complete Complete Complete Complete Complete
MT Complete Complete Complete Complete Complete
ND Complete Complete Complete Complete Complete
NE Complete Complete Complete Complete Complete
NM Complete Complete Complete Complete Complete
NV Complete Complete Complete Complete Complete
NY Complete Complete Complete Complete Complete
OH Complete Complete Complete Complete Complete
OK Complete Complete Complete Complete Complete
OR Complete Complete Complete Complete Complete
PA Complete Complete Complete Complete Complete
SD Complete Complete Complete Complete Complete
TN Complete Not Reported Not Reported Not Reported Not Reported
TX Complete Complete Complete Complete Complete
UT Complete Complete Complete Complete Complete
VA Complete Complete Complete Complete Complete
WV Complete Complete Complete Complete Complete
WY Complete Complete Complete Complete Complete
Source: State administrative oil & natural gas data thru Drillinginfo. Data available as of November 2017.
Complete = Data is essentially final although small volume changes may occur as states continue processing or correct inacuracies.
Incomplete = Some well or entity level data is available, but does not appear complete because of size of monthly changes in the
Drillinginfo database.
Not Reported = State has not released any well or entity level data for the year.
NA = Not Available. State does not release well or entity level data.
Notes: For late reporting states; the last year of available data is repeated for missing years (TN 2012 used for 2013‐16, KY 2013 used
for 2014‐16 and MO 2014 for 2015‐16). All years are missing for IL and IN.
U.S. Energy Information Administration | The Distribution of U.S. Oil and Natural Gas Wells by Production Rate A1

December 2017
Table A2: Availability of Completion, Well and Lease data by state
State Completion Well Lease
Wells allocated from
leases by Drillinginfo
AK Available NA NA NA
AL Available NA NA NA
AR NA Available NA NA
AZ Available NA NA NA
CA Available NA NA NA
CO NA Available NA Available
FL NA Available NA NA
Federal Gulf Available NA NA NA
Federal Pacific NA NA NA NA
IL NA NA NA NA
IN NA NA NA NA
KS NA NA Available NA
KY Available NA NA NA
LA NA Available Available Available
MD Available NA NA NA
MI NA NA Available NA
MO Available NA NA NA
MS Available NA NA NA
MT Available NA NA NA
ND Available NA NA NA
NE Available NA Available NA
NM Available NA NA NA
NV NA Available NA NA
NY NA Available NA NA
OH NA Available NA NA
OK NA Available Available Available
OR Available NA NA NA
PA NA Available NA NA
SD Available NA NA NA
TN Available NA NA NA
TX Available Available Available Available
UT NA Available NA NA
VA Available NA NA NA
WV NA Available NA NA
WY Available NA NA NA
NA = Not Available.
Source: State administrative oil & natural gas data thru Drillinginfo. Data available as of November 2017.
Notes:
A producing 'entity' in the database is either a completion, well, lease or wells allocated from a lease.
A completion often represents a single well, but there can also be more than one completion per well, or a recompletion within the
same or a different reservoir.
Wells on a lease can be allocated a share of production and listed as separate wells (e.g., Drillinginfo has allocated wells on some
leases in Texas). Sometimes well test data can be used to indicate which wells are producing the most or the least. When this
doesn’t work; equal production is allocated to each well.
U.S. Energy Information Administration | The Distribution of U.S. Oil and Natural Gas Wells by Production Rate A2

December 2017
Appendix B content:
Abbreviation State Tables
US United States 1‐17
AL Alabama 18
AK Alaska 19
AZ Arizona 20
AR Arkansas 21
CA California 22
CO Colorado 23
FG Federal Gulf of Mexico 24
FP Federal Pacific 25
FL Florida 26
KS Kansas 27
KY Kentucky 28
LA Louisiana 29
MD Maryland 30
MI Michigan 31
MS Mississippi 32
MO Missouri 33
MT Montana 34
NE Nebraska 35
NV Nevada 36
NM New Mexico 37
NY New York 38
ND North Dakota 39
OH Ohio 40
OK Oklahoma 41
OR Oregon 42
PA Pennsylvania 43
SD South Dakota 44
TN Tennessee 45
TX Texas 46
UT Utah 47
VA Virginia 48
WV West Virginia 49
WY Wyoming 50
Notes:
1) See Appendix A for last year of available data.
U.S. Energy Information Administration | The Distribution of U.S. Oil and Natural Gas Wells by Production Rate B0

December 2017
Table B1. United States oil and gas well summary statistics, 2000
Annual Annual Annual Annual Annual Annual
oil Oil rate gas Gas rate gas Gas rate oil Oil rate oil gas Horizontal
Prod. rate bracket # of oil % of oil prod. % of oil per Well prod. per well # of gas % of gas prod. % of gas per well prod. per well # of total prod. prod. well
(BOE/day) wells wells (MMbbl) prod. (bbl/day) (Bcf) (Mcf/day) wells wells (Bcf) Prod. (Mcf/Day) (MMbbl) (bbl/Day) wells (MMbbl) (Bcf) count
0 ‐ 1 150,836 39.7 17.3 0.9 0.3 5.1 0.1 83,401 23.3 72.1 0.4 2.4 0.8 0.0 234,237 18.0 77.2 562
1 ‐ 2 46,024 12.1 22.5 1.2 1.4 8.9 0.5 42,686 11.9 126.0 0.7 8.2 1.4 0.1 88,710 23.9 134.9 367
2 ‐ 4 48,013 12.6 46.3 2.5 2.7 20.8 1.2 47,716 13.3 276.1 1.4 16.2 3.4 0.2 95,729 49.6 296.9 559
4 ‐ 6 26,666 7.0 42.9 2.3 4.5 23.3 2.4 28,831 8.1 282.2 1.5 27.5 3.7 0.4 55,497 46.6 305.4 544
6 ‐ 8 17,297 4.6 39.0 2.1 6.3 24.2 3.9 20,697 5.8 284.2 1.5 38.7 3.7 0.5 37,994 42.7 308.4 431
8 ‐ 10 12,904 3.4 37.0 2.0 8.0 25.1 5.4 16,247 4.5 289.6 1.5 50.2 3.3 0.6 29,151 40.4 314.7 388
Subtotal <=10 301,740 79.4 205.0 10.9 1.9 107.4 1.0 239,578 66.9 1,330.2 6.9 15.5 16.2 0.2 541,318 221.1 1,437.5 2,851
10 ‐ 12 9,979 2.6 35.2 1.9 9.9 22.6 6.3 12,392 3.5 271.3 1.4 61.9 2.9 0.7 22,371 38.1 293.9 390
12 ‐ 15 10,601 2.8 45.8 2.4 12.2 28.3 7.5 15,202 4.3 408.7 2.1 76.2 4.0 0.8 25,803 49.8 437.0 482
Subtotal <=15 322,320 84.8 285.9 15.2 2.5 158.2 1.4 267,172 74.6 2,010.2 10.4 21.1 23.1 0.2 589,492 309.0 2,168.4 3,723
15 ‐ 20 12,866 3.4 71.3 3.8 15.7 43.9 9.7 18,672 5.2 652.3 3.4 98.9 5.6 0.8 31,538 76.9 696.2 669
20 ‐ 25 8,608 2.3 61.6 3.3 20.3 37.3 12.3 12,986 3.6 582.8 3.0 127.7 4.9 1.1 21,594 66.5 620.1 567
25 ‐ 30 6,098 1.6 53.2 2.8 24.9 31.3 14.7 9,143 2.6 498.8 2.6 156.3 4.2 1.3 15,241 57.4 530.2 459
30 ‐ 40 7,833 2.1 85.9 4.6 31.4 51.6 18.9 12,032 3.4 825.5 4.3 197.4 6.8 1.6 19,865 92.6 877.1 657
40 ‐ 50 4,824 1.3 67.4 3.6 40.3 42.8 25.6 7,220 2.0 628.7 3.2 255.7 5.1 2.1 12,044 72.5 671.5 483
50 ‐ 100 9,435 2.5 195.0 10.4 61.0 141.8 44.3 14,370 4.0 1,870.6 9.6 392.2 18.2 3.8 23,805 213.2 2,012.3 1,055
Subtotal <=100 371,984 97.9 820.4 43.7 6.2 506.9 3.8 341,595 95.4 7,068.7 36.4 58.4 67.8 0.6 713,579 888.2 7,575.7 7,613
100 ‐ 200 3,947 1.0 156.7 8.3 119.4 137.9 105.0 7,696 2.2 1,906.3 9.8 787.1 18.9 7.8 11,643 175.6 2,044.2 479
200 ‐ 400 1,908 0.5 151.2 8.1 239.1 142.7 225.6 4,183 1.2 2,022.9 10.4 1,579.2 20.2 15.8 6,091 171.4 2,165.6 220
400 ‐ 800 1,142 0.3 183.2 9.8 484.5 184.3 487.6 2,624 0.7 2,485.1 12.8 3,135.6 27.6 34.8 3,766 210.7 2,669.4 113
800 ‐ 1,600 636 0.2 196.2 10.4 929.0 233.9 1,107.7 1,261 0.4 2,202.0 11.3 6,092.2 30.8 85.3 1,897 227.0 2,435.9 54
1,600 ‐ 3,200 205 0.1 112.2 6.0 1,750.9 143.0 2,230.6 478 0.1 1,676.0 8.6 12,000.6 26.1 186.8 683 138.3 1,819.0 10
3,200 ‐ 6,400 64 0.0 71.4 3.8 3,879.0 87.3 4,745.2 170 0.1 1,237.5 6.4 24,142.6 19.6 383.1 234 91.0 1,324.8 12
6,400 ‐ 12,800 33 0.0 75.7 4.0 7,632.5 117.4 11,831.4 40 0.0 578.2 3.0 43,969.9 8.7 659.8 73 84.4 695.5 0
> 12,800 21 0.0 112.3 6.0 15,091.5 228.6 30,708.3 13 0.0 240.0 1.2 66,635.8 16.1 4,482.0 34 128.5 468.6 0
Total 379,940 100.0 1,879.2 100.0 13.9 1,781.9 13.2 358,060 100.0 19,416.6 100.0 153.9 235.9 1.9 738,000 2,115.1 21,198.6 8,501
Notes:
1) Source: State administrative oil & natural gas data thru DrillingInfo.
2) The total volumes shown in the distribution tables may not exactly agree with other related data, including other EIA sources. Major reasons for differences include: the timing of updates from state and commercial sources,
the summed production of available well‐level production data versus state‐level aggregations of production, and how a well is defined and which entities are counted and summed.
3) Wells counted for this report include sidetracks, completions, re‐completions and leases, this includes all oil and/or gas producing 'entities' available in DrillingInfo database.
4) For late reporting states the last year of available data is repeated for missing years (TN 2012 used for 2013‐16, KY 2013 used for 2014‐16 and MO 2014 for 2015‐16). All years are missing for IL and IN.
5) To be consistent between states a GOR of 6,000 (cf/bbl) for each years production was used to define oil versus gas wells. If the GOR was less (greater) than 6,000 (cf/bbl) the well was classed an oil (gas) well.
6) To determine production rate brackets for the first and last year of a wells life the annual production was divided
by the number of days in the productive months. For other years the annual production was divided by 365 or 366 days.
7) Gas volumes have been converted from the various state pressure bases to the Federal base (14.73 psia).
Data available as of November 2017.
Oil wells Gas wells Total wells
U.S. Energy Information Administration | The Distribution of U.S. Oil and Natural Gas Wells by Production Rate B1

December 2017
Table B2. United States oil and gas well summary statistics, 2001
Annual Annual Annual Annual Annual Annual
oil Oil rate gas Gas rate gas Gas rate oil Oil rate oil gas Horizontal
Prod. rate bracket # of oil % of oil prod. % of oil per Well prod. per well # of gas % of gas prod. % of gas per well prod. per well # of total prod. prod. well
(BOE/day) wells wells (MMbbl) prod. (bbl/day) (Bcf) (Mcf/day) wells wells (Bcf) Prod. (Mcf/Day) (MMbbl) (bbl/Day) wells (MMbbl) (Bcf) count
0 ‐ 1 151,007 39.9 17.0 0.9 0.3 5.6 0.1 93,331 24.2 80.4 0.4 2.4 0.8 0.0 244,338 17.8 86.0 589
1 ‐ 2 45,449 12.0 22.1 1.2 1.4 8.9 0.5 46,267 12.0 136.2 0.7 8.2 1.4 0.1 91,716 23.6 145.1 406
2 ‐ 4 48,172 12.7 46.3 2.5 2.7 20.9 1.2 51,612 13.4 298.1 1.5 16.3 3.4 0.2 99,784 49.7 318.9 618
4 ‐ 6 26,723 7.1 43.1 2.3 4.5 22.9 2.4 30,604 7.9 298.4 1.5 27.6 3.6 0.3 57,327 46.7 321.3 547
6 ‐ 8 17,620 4.7 39.4 2.1 6.3 26.3 4.2 22,082 5.7 303.5 1.5 39.0 3.6 0.5 39,702 43.0 329.9 439
8 ‐ 10 12,867 3.4 37.0 2.0 8.1 24.4 5.3 16,724 4.3 298.2 1.5 50.5 3.2 0.5 29,591 40.2 322.6 453
Subtotal <=10 301,838 79.7 205.0 11.0 1.9 109.0 1.0 260,620 67.6 1,414.8 7.2 15.3 16.0 0.2 562,458 221.0 1,523.8 3,052
10 ‐ 12 9,516 2.5 33.4 1.8 9.8 22.4 6.6 13,296 3.5 290.4 1.5 62.0 3.0 0.6 22,812 36.3 312.8 375
12 ‐ 15 10,722 2.8 46.4 2.5 12.2 28.9 7.6 16,918 4.4 453.1 2.3 76.1 4.4 0.7 27,640 50.8 482.0 505
Subtotal <=15 322,076 85.1 284.8 15.3 2.5 160.3 1.4 290,834 75.5 2,158.3 10.9 20.9 23.3 0.2 612,910 308.1 2,318.6 3,932
15 ‐ 20 12,579 3.3 69.7 3.8 15.7 43.9 9.9 19,785 5.1 687.1 3.5 99.0 5.7 0.8 32,364 75.4 731.0 723
20 ‐ 25 8,361 2.2 59.5 3.2 20.3 37.3 12.7 13,575 3.5 608.7 3.1 128.0 4.8 1.0 21,936 64.3 646.0 546
25 ‐ 30 5,938 1.6 51.3 2.8 24.7 32.5 15.7 9,275 2.4 503.3 2.6 156.1 4.2 1.3 15,213 55.5 535.9 449
30 ‐ 40 7,884 2.1 85.6 4.6 31.3 53.3 19.5 12,343 3.2 838.2 4.2 197.2 6.9 1.6 20,227 92.5 891.5 703
40 ‐ 50 4,758 1.3 66.1 3.6 40.2 44.6 27.1 7,403 1.9 642.1 3.3 254.3 5.7 2.3 12,161 71.8 686.6 540
50 ‐ 100 9,408 2.5 193.4 10.4 60.8 146.4 46.0 15,164 3.9 1,968.7 10.0 394.4 18.8 3.8 24,572 212.2 2,115.1 1,121
Subtotal <=100 371,004 98.0 810.3 43.5 6.1 518.3 3.9 368,379 95.6 7,406.5 37.5 57.0 69.5 0.5 739,383 879.8 7,924.8 8,014
100 ‐ 200 3,826 1.0 151.6 8.1 120.0 134.3 106.2 8,221 2.1 2,019.9 10.2 790.4 19.4 7.6 12,047 171.0 2,154.1 547
200 ‐ 400 1,881 0.5 149.6 8.0 239.1 144.0 230.1 4,486 1.2 2,166.4 11.0 1,577.1 23.1 16.8 6,367 172.6 2,310.4 271
400 ‐ 800 1,096 0.3 178.0 9.6 484.2 181.3 493.1 2,581 0.7 2,430.6 12.3 3,115.5 26.8 34.3 3,677 204.8 2,611.9 122
800 ‐ 1,600 580 0.2 174.4 9.4 913.4 206.0 1,078.5 1,141 0.3 2,033.4 10.3 6,011.3 28.9 85.4 1,721 203.3 2,239.3 48
1,600 ‐ 3,200 146 0.0 83.4 4.5 1,788.6 89.6 1,921.4 444 0.1 1,575.7 8.0 12,079.1 24.7 189.1 590 108.1 1,665.3 14
3,200 ‐ 6,400 79 0.0 76.2 4.1 3,596.1 102.5 4,837.3 156 0.0 1,161.1 5.9 23,908.5 19.5 401.6 235 95.7 1,263.6 7
6,400 ‐ 12,800 51 0.0 128.2 6.9 7,743.6 187.9 11,347.2 40 0.0 566.8 2.9 44,333.2 11.7 914.5 91 139.9 754.8 0
> 12,800 24 0.0 110.3 5.9 14,847.4 232.0 31,243.6 20 0.0 388.8 2.0 63,556.0 27.6 4,504.1 44 137.8 620.9 0
Total 378,687 100.0 1,862.0 100.0 13.9 1,795.8 13.4 385,468 100.0 19,749.3 100.0 146.2 251.0 1.9 764,155 2,113.1 21,545.1 9,023
Notes:
1) Source: State administrative oil & natural gas data thru DrillingInfo.
2) The total volumes shown in the distribution tables may not exactly agree with other related data, including other EIA sources. Major reasons for differences include: the timing of updates from state and commercial sources,
the summed production of available well‐level production data versus state‐level aggregations of production, and how a well is defined and which entities are counted and summed.
3) Wells counted for this report include sidetracks, completions, re‐completions and leases, this includes all oil and/or gas producing 'entities' available in DrillingInfo database.
4) For late reporting states the last year of available data is repeated for missing years (TN 2012 used for 2013‐16, KY 2013 used for 2014‐16 and MO 2014 for 2015‐16). All years are missing for IL and IN.
5) To be consistent between states a GOR of 6,000 (cf/bbl) for each years production was used to define oil versus gas wells. If the GOR was less (greater) than 6,000 (cf/bbl) the well was classed an oil (gas) well.
6) To determine production rate brackets for the first and last year of a wells life the annual production was divided
by the number of days in the productive months. For other years the annual production was divided by 365 or 366 days.
7) Gas volumes have been converted from the various state pressure bases to the Federal base (14.73 psia).
Data available as of November 2017.
Oil wells Gas wells Total wells
U.S. Energy Information Administration | The Distribution of U.S. Oil and Natural Gas Wells by Production Rate B2

December 2017
Table B3. United States oil and gas well summary statistics, 2002
Annual Annual Annual Annual Annual Annual
oil Oil rate gas Gas rate gas Gas rate oil Oil rate oil gas Horizontal
Prod. rate bracket # of oil % of oil prod. % of oil per Well prod. per well # of gas % of gas prod. % of gas per well prod. per well # of total prod. prod. well
(BOE/day) wells wells (MMbbl) prod. (bbl/day) (Bcf) (Mcf/day) wells wells (Bcf) Prod. (Mcf/Day) (MMbbl) (bbl/Day) wells (MMbbl) (Bcf) count
0 ‐ 1 148,952 39.9 16.9 0.9 0.3 5.5 0.1 95,881 24.2 82.1 0.4 2.4 0.8 0.0 244,833 17.7 87.6 603
1 ‐ 2 45,719 12.3 22.1 1.2 1.4 9.4 0.6 47,052 11.9 139.3 0.7 8.3 1.4 0.1 92,771 23.5 148.7 410
2 ‐ 4 47,706 12.8 45.7 2.5 2.7 20.9 1.2 52,466 13.2 305.3 1.6 16.3 3.3 0.2 100,172 49.1 326.2 658
4 ‐ 6 26,621 7.1 42.7 2.3 4.5 24.0 2.5 32,217 8.1 316.4 1.7 27.7 3.5 0.3 58,838 46.2 340.4 559
6 ‐ 8 17,283 4.6 38.8 2.1 6.3 25.1 4.1 23,240 5.9 322.0 1.7 39.1 3.5 0.4 40,523 42.4 347.2 493
8 ‐ 10 12,706 3.4 36.7 2.0 8.1 24.7 5.4 17,990 4.5 321.6 1.7 50.6 3.4 0.5 30,696 40.1 346.2 478
Subtotal <=10 298,987 80.1 202.9 11.0 1.9 109.5 1.0 268,846 67.9 1,486.6 7.8 15.5 16.0 0.2 567,833 219.0 1,596.2 3,201
10 ‐ 12 9,444 2.5 33.2 1.8 9.8 22.6 6.7 14,536 3.7 320.4 1.7 62.2 3.1 0.6 23,980 36.3 343.0 409
12 ‐ 15 10,475 2.8 45.0 2.4 12.1 29.3 7.9 17,146 4.3 464.1 2.4 76.4 4.2 0.7 27,621 49.3 493.4 533
Subtotal <=15 318,906 85.5 281.1 15.2 2.5 161.4 1.4 300,528 75.9 2,271.1 11.9 21.3 23.4 0.2 619,434 304.5 2,432.5 4,143
15 ‐ 20 11,968 3.2 66.5 3.6 15.7 42.3 10.0 20,683 5.2 722.8 3.8 98.9 5.9 0.8 32,651 72.4 765.1 714
20 ‐ 25 8,096 2.2 57.9 3.1 20.1 37.9 13.2 13,906 3.5 626.0 3.3 127.8 5.1 1.0 22,002 63.0 663.9 592
25 ‐ 30 5,842 1.6 50.9 2.8 24.8 32.4 15.8 9,606 2.4 527.1 2.8 156.6 4.2 1.3 15,448 55.1 559.6 489
30 ‐ 40 7,670 2.1 83.9 4.5 31.4 51.9 19.4 12,265 3.1 840.7 4.4 197.5 6.9 1.6 19,935 90.8 892.6 783
40 ‐ 50 4,759 1.3 65.7 3.6 40.1 45.2 27.6 7,409 1.9 650.2 3.4 254.5 5.5 2.2 12,168 71.2 695.4 518
50 ‐ 100 8,647 2.3 179.6 9.7 60.9 133.9 45.4 15,422 3.9 2,031.1 10.6 393.7 19.0 3.7 24,069 198.6 2,165.0 1,173
Subtotal <=100 365,888 98.1 785.6 42.5 6.0 505.0 3.9 379,819 95.9 7,669.2 40.2 57.1 70.1 0.5 745,707 855.7 8,174.1 8,412
100 ‐ 200 3,598 1.0 145.6 7.9 120.5 121.7 100.7 8,117 2.1 2,051.7 10.7 792.8 18.9 7.3 11,715 164.5 2,173.4 617
200 ‐ 400 1,825 0.5 147.8 8.0 242.9 131.6 216.3 4,486 1.1 2,229.1 11.7 1,578.8 21.1 15.0 6,311 168.9 2,360.7 256
400 ‐ 800 998 0.3 160.3 8.7 475.9 177.3 526.4 2,228 0.6 2,122.0 11.1 3,109.2 24.6 36.0 3,226 184.9 2,299.4 108
800 ‐ 1,600 543 0.2 162.5 8.8 899.2 199.3 1,102.9 955 0.2 1,716.4 9.0 5,991.3 27.2 94.9 1,498 189.7 1,915.7 42
1,600 ‐ 3,200 152 0.0 86.7 4.7 1,839.6 99.2 2,106.0 394 0.1 1,420.9 7.4 12,143.3 22.8 194.8 546 109.5 1,520.1 8
3,200 ‐ 6,400 80 0.0 95.3 5.2 3,779.0 116.5 4,620.1 136 0.0 973.8 5.1 23,518.5 17.7 426.8 216 113.0 1,090.3 4
6,400 ‐ 12,800 59 0.0 133.3 7.2 7,010.1 211.1 11,101.2 46 0.0 626.6 3.3 44,063.5 16.9 1,186.9 105 150.2 837.7 0
> 12,800 29 0.0 132.8 7.2 13,767.1 241.5 25,026.1 11 0.0 288.4 1.5 74,589.5 12.0 3,114.7 40 144.9 529.8 0
Total 373,172 100.0 1,850.0 100.0 13.9 1,803.3 13.6 396,192 100.0 19,098.0 100.0 136.9 231.3 1.7 769,364 2,081.2 20,901.3 9,447
Notes:
1) Source: State administrative oil & natural gas data thru DrillingInfo.
2) The total volumes shown in the distribution tables may not exactly agree with other related data, including other EIA sources. Major reasons for differences include: the timing of updates from state and commercial sources,
the summed production of available well‐level production data versus state‐level aggregations of production, and how a well is defined and which entities are counted and summed.
3) Wells counted for this report include sidetracks, completions, re‐completions and leases, this includes all oil and/or gas producing 'entities' available in DrillingInfo database.
4) For late reporting states the last year of available data is repeated for missing years (TN 2012 used for 2013‐16, KY 2013 used for 2014‐16 and MO 2014 for 2015‐16). All years are missing for IL and IN.
5) To be consistent between states a GOR of 6,000 (cf/bbl) for each years production was used to define oil versus gas wells. If the GOR was less (greater) than 6,000 (cf/bbl) the well was classed an oil (gas) well.
6) To determine production rate brackets for the first and last year of a wells life the annual production was divided
by the number of days in the productive months. For other years the annual production was divided by 365 or 366 days.
7) Gas volumes have been converted from the various state pressure bases to the Federal base (14.73 psia).
Data available as of November 2017.
Oil wells Gas wells Total wells
U.S. Energy Information Administration | The Distribution of U.S. Oil and Natural Gas Wells by Production Rate B3

December 2017
Table B4. United States oil and gas well summary statistics, 2003
Annual Annual Annual Annual Annual Annual
oil Oil rate gas Gas rate gas Gas rate oil Oil rate oil gas Horizontal
Prod. rate bracket # of oil % of oil prod. % of oil per Well prod. per well # of gas % of gas prod. % of gas per well prod. per well # of total prod. prod. well
(BOE/day) wells wells (MMbbl) prod. (bbl/day) (Bcf) (Mcf/day) wells wells (Bcf) Prod. (Mcf/Day) (MMbbl) (bbl/Day) wells (MMbbl) (Bcf) count
0 ‐ 1 147,286 39.8 16.8 0.9 0.3 5.5 0.1 100,293 24.3 85.7 0.5 2.4 0.8 0.0 247,579 17.6 91.2 621
1 ‐ 2 45,364 12.3 22.1 1.2 1.4 9.0 0.6 48,373 11.7 143.5 0.8 8.3 1.4 0.1 93,737 23.5 152.5 433
2 ‐ 4 48,089 13.0 46.3 2.5 2.7 21.4 1.2 54,136 13.1 316.6 1.7 16.4 3.2 0.2 102,225 49.5 338.1 635
4 ‐ 6 25,968 7.0 41.7 2.3 4.5 23.8 2.6 33,887 8.2 335.6 1.8 27.8 3.6 0.3 59,855 45.3 359.4 618
6 ‐ 8 17,338 4.7 38.8 2.1 6.3 25.4 4.1 24,650 6.0 342.9 1.8 39.2 3.7 0.4 41,988 42.5 368.4 534
8 ‐ 10 12,558 3.4 36.1 2.0 8.1 24.1 5.4 19,523 4.7 351.4 1.8 50.8 3.6 0.5 32,081 39.6 375.5 522
Subtotal <=10 296,603 80.2 201.8 11.0 1.9 109.3 1.0 280,862 68.0 1,575.7 8.2 15.7 16.3 0.2 577,465 218.1 1,685.0 3,363
10 ‐ 12 9,470 2.6 33.3 1.8 9.9 22.1 6.6 15,335 3.7 337.1 1.8 62.2 3.3 0.6 24,805 36.6 359.2 463
12 ‐ 15 10,237 2.8 44.2 2.4 12.2 27.9 7.7 18,418 4.5 497.8 2.6 76.4 4.5 0.7 28,655 48.8 525.7 540
Subtotal <=15 316,310 85.6 279.3 15.2 2.5 159.3 1.4 314,615 76.1 2,410.6 12.6 21.5 24.2 0.2 630,925 303.5 2,569.9 4,366
15 ‐ 20 11,772 3.2 65.3 3.6 15.7 41.3 9.9 21,558 5.2 752.4 3.9 99.0 6.3 0.8 33,330 71.5 793.8 750
20 ‐ 25 8,125 2.2 57.7 3.2 20.2 37.2 13.0 14,002 3.4 627.2 3.3 127.6 5.2 1.1 22,127 62.9 664.3 689
25 ‐ 30 5,586 1.5 48.4 2.6 24.8 29.8 15.3 9,769 2.4 531.3 2.8 156.1 4.5 1.3 15,355 52.9 561.2 527
30 ‐ 40 7,621 2.1 82.2 4.5 31.3 51.7 19.7 12,630 3.1 858.5 4.5 197.2 7.1 1.6 20,251 89.3 910.2 807
40 ‐ 50 4,622 1.3 62.8 3.4 40.1 43.1 27.5 7,716 1.9 668.8 3.5 255.0 5.6 2.1 12,338 68.5 711.8 556
50 ‐ 100 8,594 2.3 177.2 9.7 61.1 129.0 44.5 15,990 3.9 2,074.6 10.8 393.7 19.3 3.7 24,584 196.5 2,203.6 1,348
Subtotal <=100 362,630 98.1 773.0 42.2 6.0 491.5 3.8 396,280 95.9 7,923.3 41.3 56.5 72.1 0.5 758,910 845.1 8,414.8 9,043
100 ‐ 200 3,437 0.9 137.6 7.5 120.7 113.2 99.3 8,680 2.1 2,143.6 11.2 796.7 18.2 6.8 12,117 155.9 2,256.8 629
200 ‐ 400 1,834 0.5 148.2 8.1 242.2 133.8 218.7 4,693 1.1 2,248.2 11.7 1,577.1 20.4 14.3 6,527 168.6 2,381.9 327
400 ‐ 800 948 0.3 149.1 8.1 467.8 173.5 544.4 2,179 0.5 1,983.8 10.3 3,034.8 26.3 40.2 3,127 175.3 2,157.3 138
800 ‐ 1,600 512 0.1 152.8 8.3 894.2 195.2 1,142.2 945 0.2 1,631.1 8.5 5,955.3 25.9 94.7 1,457 178.8 1,826.3 41
1,600 ‐ 3,200 168 0.1 97.0 5.3 1,779.4 127.2 2,333.6 377 0.1 1,362.7 7.1 12,088.8 22.1 196.3 545 119.1 1,489.9 9
3,200 ‐ 6,400 97 0.0 115.9 6.3 3,772.1 141.4 4,602.6 114 0.0 894.7 4.7 24,789.6 13.3 368.2 211 129.2 1,036.2 6
6,400 ‐ 12,800 65 0.0 152.4 8.3 7,022.9 252.7 11,644.5 45 0.0 690.6 3.6 46,136.2 9.9 660.0 110 162.3 943.3 0
> 12,800 23 0.0 106.2 5.8 13,477.1 173.3 21,990.6 10 0.0 302.7 1.6 87,151.7 5.8 1,665.9 33 112.0 475.9 0
Total 369,714 100.0 1,832.2 100.0 13.9 1,801.8 13.7 413,323 100.0 19,180.6 100.0 131.9 214.0 1.5 783,037 2,046.3 20,982.4 10,193
Notes:
1) Source: State administrative oil & natural gas data thru DrillingInfo.
2) The total volumes shown in the distribution tables may not exactly agree with other related data, including other EIA sources. Major reasons for differences include: the timing of updates from state and commercial sources,
the summed production of available well‐level production data versus state‐level aggregations of production, and how a well is defined and which entities are counted and summed.
3) Wells counted for this report include sidetracks, completions, re‐completions and leases, this includes all oil and/or gas producing 'entities' available in DrillingInfo database.
4) For late reporting states the last year of available data is repeated for missing years (TN 2012 used for 2013‐16, KY 2013 used for 2014‐16 and MO 2014 for 2015‐16). All years are missing for IL and IN.
5) To be consistent between states a GOR of 6,000 (cf/bbl) for each years production was used to define oil versus gas wells. If the GOR was less (greater) than 6,000 (cf/bbl) the well was classed an oil (gas) well.
6) To determine production rate brackets for the first and last year of a wells life the annual production was divided
by the number of days in the productive months. For other years the annual production was divided by 365 or 366 days.
7) Gas volumes have been converted from the various state pressure bases to the Federal base (14.73 psia).
Data available as of November 2017.
Oil wells Gas wells Total wells
U.S. Energy Information Administration | The Distribution of U.S. Oil and Natural Gas Wells by Production Rate B4

December 2017
Table B5. United States oil and gas well summary statistics, 2004
Annual Annual Annual Annual Annual Annual
oil Oil rate gas Gas rate gas Gas rate oil Oil rate oil gas Horizontal
Prod. rate bracket # of oil % of oil prod. % of oil per Well prod. per well # of gas % of gas prod. % of gas per well prod. per well # of total prod. prod. well
(BOE/day) wells wells (MMbbl) prod. (bbl/day) (Bcf) (Mcf/day) wells wells (Bcf) Prod. (Mcf/Day) (MMbbl) (bbl/Day) wells (MMbbl) (Bcf) count
0 ‐ 1 149,903 40.4 17.2 1.0 0.3 5.6 0.1 104,006 24.1 87.2 0.5 2.4 0.9 0.0 253,909 18.0 92.8 708
1 ‐ 2 45,578 12.3 22.4 1.3 1.4 9.2 0.6 50,251 11.6 148.7 0.8 8.3 1.4 0.1 95,829 23.8 157.9 465
2 ‐ 4 47,702 12.8 46.1 2.6 2.7 21.3 1.2 56,921 13.2 333.5 1.8 16.4 3.4 0.2 104,623 49.4 354.8 743
4 ‐ 6 26,404 7.1 42.6 2.4 4.5 24.6 2.6 36,089 8.4 358.0 1.9 27.9 3.8 0.3 62,493 46.4 382.6 666
6 ‐ 8 16,960 4.6 38.0 2.2 6.3 25.2 4.1 26,345 6.1 367.0 1.9 39.2 3.9 0.4 43,305 41.9 392.2 589
8 ‐ 10 12,620 3.4 36.4 2.1 8.1 23.9 5.3 20,426 4.7 368.3 1.9 50.8 3.6 0.5 33,046 40.0 392.2 531
Subtotal <=10 299,167 80.5 202.6 11.5 1.9 109.7 1.0 294,038 68.1 1,662.8 8.7 15.9 17.1 0.2 593,205 219.6 1,772.5 3,702
10 ‐ 12 9,138 2.5 32.0 1.8 9.8 21.9 6.7 16,329 3.8 360.6 1.9 62.3 3.3 0.6 25,467 35.3 382.5 451
12 ‐ 15 10,329 2.8 44.4 2.5 12.1 29.1 7.9 19,525 4.5 528.6 2.8 76.5 4.7 0.7 29,854 49.2 557.7 604
Subtotal <=15 318,634 85.8 279.0 15.8 2.4 160.8 1.4 329,892 76.4 2,551.9 13.4 21.7 25.1 0.2 648,526 304.1 2,712.7 4,757
15 ‐ 20 11,919 3.2 66.0 3.7 15.6 42.7 10.1 22,006 5.1 765.9 4.0 98.7 6.5 0.8 33,925 72.5 808.5 816
20 ‐ 25 8,157 2.2 57.8 3.3 20.2 37.4 13.0 14,232 3.3 635.2 3.3 127.5 5.3 1.1 22,389 63.1 672.6 737
25 ‐ 30 5,688 1.5 48.4 2.7 24.6 32.3 16.4 9,817 2.3 534.2 2.8 156.3 4.5 1.3 15,505 52.9 566.4 599
30 ‐ 40 7,431 2.0 80.0 4.5 31.2 51.9 20.2 13,024 3.0 885.4 4.6 197.2 7.5 1.7 20,455 87.4 937.3 885
40 ‐ 50 4,525 1.2 61.6 3.5 40.0 43.2 28.1 7,983 1.9 691.7 3.6 254.8 5.8 2.1 12,508 67.4 734.9 646
50 ‐ 100 8,235 2.2 168.4 9.5 61.0 123.8 44.9 16,738 3.9 2,182.2 11.4 395.9 19.4 3.5 24,973 187.8 2,306.1 1,451
Subtotal <=100 364,589 98.2 761.1 43.1 5.9 492.0 3.8 413,692 95.9 8,246.6 43.2 56.4 74.1 0.5 778,281 835.2 8,738.5 9,891
100 ‐ 200 3,342 0.9 134.3 7.6 121.2 113.3 102.2 9,592 2.2 2,339.2 12.2 794.5 19.8 6.7 12,934 154.1 2,452.5 814
200 ‐ 400 1,771 0.5 144.1 8.2 244.1 129.0 218.4 4,856 1.1 2,305.8 12.1 1,561.7 22.7 15.4 6,627 166.8 2,434.8 528
400 ‐ 800 928 0.3 145.6 8.2 471.0 162.1 524.4 2,114 0.5 1,881.6 9.9 3,037.5 24.8 40.1 3,042 170.5 2,043.7 162
800 ‐ 1,600 480 0.1 136.5 7.7 876.3 186.5 1,196.8 843 0.2 1,470.3 7.7 6,075.4 20.3 83.7 1,323 156.8 1,656.7 34
1,600 ‐ 3,200 186 0.1 106.2 6.0 1,782.3 144.7 2,427.5 283 0.1 1,045.8 5.5 12,017.8 17.2 198.0 469 123.5 1,190.5 10
3,200 ‐ 6,400 93 0.0 114.2 6.5 3,750.4 175.7 5,769.4 115 0.0 829.3 4.3 22,900.2 12.6 346.7 208 126.7 1,004.9 7
6,400 ‐ 12,800 62 0.0 143.4 8.1 7,423.9 213.2 11,037.6 49 0.0 783.4 4.1 49,012.4 14.1 879.1 111 157.4 996.6 0
> 12,800 20 0.0 82.0 4.6 12,215.2 156.0 23,229.8 6 0.0 205.7 1.1 99,202.8 2.8 1,339.0 26 84.8 361.7 0
Total 371,471 100.0 1,767.5 100.0 13.4 1,772.3 13.4 431,550 100.0 19,107.6 100.0 125.9 208.2 1.4 803,021 1,975.7 20,879.9 11,446
Notes:
1) Source: State administrative oil & natural gas data thru DrillingInfo.
2) The total volumes shown in the distribution tables may not exactly agree with other related data, including other EIA sources. Major reasons for differences include: the timing of updates from state and commercial sources,
the summed production of available well‐level production data versus state‐level aggregations of production, and how a well is defined and which entities are counted and summed.
3) Wells counted for this report include sidetracks, completions, re‐completions and leases, this includes all oil and/or gas producing 'entities' available in DrillingInfo database.
4) For late reporting states the last year of available data is repeated for missing years (TN 2012 used for 2013‐16, KY 2013 used for 2014‐16 and MO 2014 for 2015‐16). All years are missing for IL and IN.
5) To be consistent between states a GOR of 6,000 (cf/bbl) for each years production was used to define oil versus gas wells. If the GOR was less (greater) than 6,000 (cf/bbl) the well was classed an oil (gas) well.
6) To determine production rate brackets for the first and last year of a wells life the annual production was divided
by the number of days in the productive months. For other years the annual production was divided by 365 or 366 days.
7) Gas volumes have been converted from the various state pressure bases to the Federal base (14.73 psia).
Data available as of November 2017.
Oil wells Gas wells Total wells
U.S. Energy Information Administration | The Distribution of U.S. Oil and Natural Gas Wells by Production Rate B5

December 2017
Table B6. United States oil and gas well summary statistics, 2005
Annual Annual Annual Annual Annual Annual
oil Oil rate gas Gas rate gas Gas rate oil Oil rate oil gas Horizontal
Prod. rate bracket # of oil % of oil prod. % of oil per Well prod. per well # of gas % of gas prod. % of gas per well prod. per well # of total prod. prod. well
(BOE/day) wells wells (MMbbl) prod. (bbl/day) (Bcf) (Mcf/day) wells wells (Bcf) Prod. (Mcf/Day) (MMbbl) (bbl/Day) wells (MMbbl) (Bcf) count
0 ‐ 1 151,654 40.4 17.2 1.0 0.3 5.9 0.1 108,445 24.0 89.9 0.5 2.3 0.9 0.0 260,099 18.1 95.8 745
1 ‐ 2 46,454 12.4 22.7 1.4 1.4 9.5 0.6 52,320 11.6 155.1 0.8 8.3 1.5 0.1 98,774 24.1 164.6 550
2 ‐ 4 48,279 12.9 46.4 2.8 2.7 21.8 1.3 60,070 13.3 350.9 1.9 16.4 3.5 0.2 108,349 49.8 372.8 855
4 ‐ 6 26,748 7.1 42.7 2.5 4.5 25.5 2.7 38,741 8.6 383.8 2.1 28.0 3.9 0.3 65,489 46.6 409.3 726
6 ‐ 8 17,063 4.6 38.0 2.3 6.2 25.8 4.2 27,913 6.2 388.6 2.1 39.3 3.9 0.4 44,976 41.9 414.3 641
8 ‐ 10 12,682 3.4 36.3 2.2 8.0 24.1 5.3 21,993 4.9 395.7 2.1 50.9 3.8 0.5 34,675 40.1 419.8 558
Subtotal <=10 302,880 80.7 203.3 12.1 1.9 112.5 1.0 309,482 68.5 1,764.0 9.4 16.1 17.4 0.2 612,362 220.7 1,876.5 4,075
10 ‐ 12 9,577 2.6 33.3 2.0 9.8 23.2 6.8 17,565 3.9 386.0 2.1 62.3 3.6 0.6 27,142 36.9 409.2 533
12 ‐ 15 10,593 2.8 44.8 2.7 12.1 29.7 8.0 19,919 4.4 537.5 2.9 76.5 4.8 0.7 30,512 49.6 567.3 656
Subtotal <=15 323,050 86.1 281.5 16.7 2.4 165.4 1.4 346,966 76.8 2,687.6 14.4 21.8 25.8 0.2 670,016 307.3 2,853.0 5,264
15 ‐ 20 12,006 3.2 66.0 3.9 15.6 42.6 10.1 22,410 5.0 775.3 4.1 98.7 6.7 0.9 34,416 72.7 817.8 990
20 ‐ 25 7,961 2.1 55.7 3.3 20.1 37.3 13.5 14,535 3.2 645.2 3.5 127.5 5.4 1.1 22,496 61.2 682.5 825
25 ‐ 30 5,713 1.5 48.8 2.9 24.6 32.6 16.4 10,000 2.2 542.1 2.9 156.6 4.4 1.3 15,713 53.2 574.7 684
30 ‐ 40 7,466 2.0 79.1 4.7 31.0 53.9 21.1 13,401 3.0 907.0 4.9 197.3 7.5 1.6 20,867 86.6 960.9 1,005
40 ‐ 50 4,447 1.2 59.6 3.5 39.9 43.0 28.7 8,266 1.8 713.7 3.8 255.6 5.8 2.1 12,713 65.4 756.7 697
50 ‐ 100 8,009 2.1 161.3 9.6 60.8 121.2 45.7 17,569 3.9 2,293.3 12.3 399.0 18.5 3.2 25,578 179.8 2,414.6 1,737
Subtotal <=100 368,652 98.3 751.9 44.7 5.7 496.0 3.8 433,147 95.9 8,564.2 45.8 56.1 74.1 0.5 801,799 826.0 9,060.2 11,202
100 ‐ 200 3,245 0.9 130.9 7.8 122.5 105.0 98.2 10,429 2.3 2,512.3 13.4 795.3 20.6 6.5 13,674 151.5 2,617.3 1,262
200 ‐ 400 1,685 0.5 134.3 8.0 241.0 116.1 208.3 5,021 1.1 2,327.0 12.4 1,560.1 20.9 14.0 6,706 155.3 2,443.1 741
400 ‐ 800 874 0.2 139.2 8.3 470.6 154.5 522.4 1,929 0.4 1,682.9 9.0 3,030.1 21.3 38.4 2,803 160.5 1,837.4 199
800 ‐ 1,600 436 0.1 131.4 7.8 897.3 174.5 1,191.4 705 0.2 1,231.9 6.6 6,155.0 17.4 87.1 1,141 148.9 1,406.4 44
1,600 ‐ 3,200 166 0.0 96.6 5.7 1,830.1 131.6 2,493.4 236 0.1 846.3 4.5 11,926.3 12.2 172.6 402 108.8 977.9 13
3,200 ‐ 6,400 95 0.0 114.0 6.8 3,612.9 163.2 5,171.7 86 0.0 670.7 3.6 23,517.1 10.1 355.2 181 124.1 833.9 6
6,400 ‐ 12,800 41 0.0 100.4 6.0 7,061.3 134.8 9,479.0 41 0.0 680.8 3.6 48,624.0 11.1 790.8 82 111.5 815.5 0
> 12,800 19 0.0 84.5 5.0 12,918.6 140.4 21,457.4 8 0.0 200.5 1.1 72,471.4 9.6 3,471.6 27 94.1 340.9 0
Total 375,213 100.0 1,683.2 100.0 12.6 1,616.0 12.1 451,602 100.0 18,716.6 100.0 118.3 197.5 1.2 826,815 1,880.7 20,332.6 13,467
Notes:
1) Source: State administrative oil & natural gas data thru DrillingInfo.
2) The total volumes shown in the distribution tables may not exactly agree with other related data, including other EIA sources. Major reasons for differences include: the timing of updates from state and commercial sources,
the summed production of available well‐level production data versus state‐level aggregations of production, and how a well is defined and which entities are counted and summed.
3) Wells counted for this report include sidetracks, completions, re‐completions and leases, this includes all oil and/or gas producing 'entities' available in DrillingInfo database.
4) For late reporting states the last year of available data is repeated for missing years (TN 2012 used for 2013‐16, KY 2013 used for 2014‐16 and MO 2014 for 2015‐16). All years are missing for IL and IN.
5) To be consistent between states a GOR of 6,000 (cf/bbl) for each years production was used to define oil versus gas wells. If the GOR was less (greater) than 6,000 (cf/bbl) the well was classed an oil (gas) well.
6) To determine production rate brackets for the first and last year of a wells life the annual production was divided
by the number of days in the productive months. For other years the annual production was divided by 365 or 366 days.
7) Gas volumes have been converted from the various state pressure bases to the Federal base (14.73 psia).
Data available as of November 2017.
Oil wells Gas wells Total wells
U.S. Energy Information Administration | The Distribution of U.S. Oil and Natural Gas Wells by Production Rate B6

December 2017
Table B7. United States oil and gas well summary statistics, 2006
Annual Annual Annual Annual Annual Annual
oil Oil rate gas Gas rate gas Gas rate oil Oil rate oil gas Horizontal
Prod. rate bracket # of oil % of oil prod. % of oil per Well prod. per well # of gas % of gas prod. % of gas per well prod. per well # of total prod. prod. well
(BOE/day) wells wells (MMbbl) prod. (bbl/day) (Bcf) (Mcf/day) wells wells (Bcf) Prod. (Mcf/Day) (MMbbl) (bbl/Day) wells (MMbbl) (Bcf) count
0 ‐ 1 153,093 40.3 17.6 1.1 0.3 6.0 0.1 115,554 24.1 96.3 0.5 2.4 0.9 0.0 268,647 18.5 102.3 831
1 ‐ 2 47,426 12.5 23.1 1.4 1.4 9.5 0.6 55,749 11.6 164.9 0.9 8.3 1.5 0.1 103,175 24.6 174.3 602
2 ‐ 4 49,404 13.0 47.2 2.9 2.7 22.2 1.3 63,917 13.3 373.8 1.9 16.5 3.5 0.2 113,321 50.8 396.0 893
4 ‐ 6 27,561 7.3 43.5 2.7 4.5 27.0 2.8 41,471 8.6 409.5 2.1 27.9 4.1 0.3 69,032 47.7 436.5 803
6 ‐ 8 17,813 4.7 39.5 2.4 6.2 27.0 4.3 30,227 6.3 420.1 2.2 39.3 4.2 0.4 48,040 43.6 447.1 715
8 ‐ 10 12,698 3.3 36.0 2.2 8.0 24.2 5.4 23,474 4.9 420.9 2.2 50.8 3.9 0.5 36,172 39.9 445.1 647
Subtotal <=10 307,995 81.0 206.9 12.6 1.9 115.9 1.1 330,392 68.9 1,885.5 9.8 16.1 18.2 0.2 638,387 225.1 2,001.3 4,491
10 ‐ 12 9,650 2.5 33.4 2.0 9.8 23.9 7.0 18,372 3.8 405.1 2.1 62.4 3.6 0.6 28,022 37.0 428.9 557
12 ‐ 15 10,752 2.8 45.8 2.8 12.1 30.7 8.1 21,103 4.4 568.2 3.0 76.4 5.1 0.7 31,855 50.8 598.9 838
Subtotal <=15 328,397 86.4 286.1 17.4 2.4 170.4 1.5 369,867 77.1 2,858.7 14.9 21.9 26.8 0.2 698,264 312.9 3,029.1 5,886
15 ‐ 20 12,062 3.2 66.0 4.0 15.7 42.3 10.0 23,000 4.8 795.2 4.1 98.7 7.0 0.9 35,062 73.1 837.4 1,127
20 ‐ 25 8,014 2.1 55.8 3.4 20.1 37.8 13.6 14,984 3.1 665.2 3.5 127.4 5.7 1.1 22,998 61.5 702.9 933
25 ‐ 30 5,710 1.5 48.1 2.9 24.6 33.1 16.9 10,552 2.2 569.9 3.0 156.4 4.6 1.3 16,262 52.8 603.0 784
30 ‐ 40 7,420 2.0 77.7 4.7 30.8 55.1 21.9 13,845 2.9 937.3 4.9 197.4 7.9 1.7 21,265 85.6 992.5 1,173
40 ‐ 50 4,321 1.1 56.9 3.5 39.7 42.6 29.7 8,736 1.8 752.5 3.9 254.6 6.5 2.2 13,057 63.5 795.1 862
50 ‐ 100 7,691 2.0 154.4 9.4 60.8 117.8 46.4 19,182 4.0 2,493.3 13.0 399.0 20.3 3.3 26,873 174.7 2,611.1 2,409
Subtotal <=100 373,615 98.3 745.1 45.4 5.6 499.2 3.8 460,166 95.9 9,072.1 47.1 56.1 78.9 0.5 833,781 824.0 9,571.2 13,174
100 ‐ 200 3,220 0.9 128.7 7.8 121.0 109.2 102.7 11,523 2.4 2,765.2 14.4 796.1 21.2 6.1 14,743 150.0 2,874.4 1,908
200 ‐ 400 1,658 0.4 130.6 8.0 240.3 121.8 224.2 5,201 1.1 2,348.4 12.2 1,547.2 21.1 13.9 6,859 151.7 2,470.2 993
400 ‐ 800 883 0.2 135.1 8.2 461.9 154.9 529.6 1,779 0.4 1,506.8 7.8 3,073.5 18.9 38.5 2,662 153.9 1,661.7 254
800 ‐ 1,600 372 0.1 108.1 6.6 879.8 156.1 1,270.1 687 0.1 1,198.6 6.2 6,063.6 17.5 88.3 1,059 125.6 1,354.7 50
1,600 ‐ 3,200 169 0.0 104.1 6.3 1,864.5 133.0 2,382.4 248 0.1 909.9 4.7 11,947.3 14.3 187.5 417 118.4 1,043.0 14
3,200 ‐ 6,400 95 0.0 113.1 6.9 3,649.1 149.0 4,809.7 88 0.0 675.9 3.5 24,348.2 10.1 364.5 183 123.2 824.9 7
6,400 ‐ 12,800 47 0.0 110.5 6.7 7,026.0 150.6 9,569.8 40 0.0 601.0 3.1 45,195.3 11.9 893.9 87 122.4 751.6 0
> 12,800 13 0.0 66.3 4.0 13,962.2 94.5 19,911.9 6 0.0 174.1 0.9 81,676.2 6.3 2,954.4 19 72.5 268.5 0
Total 380,072 100.0 1,641.6 100.0 12.2 1,568.3 11.7 479,738 100.0 19,252.1 100.0 115.0 200.2 1.2 859,810 1,841.7 20,820.3 16,400
Notes:
1) Source: State administrative oil & natural gas data thru DrillingInfo.
2) The total volumes shown in the distribution tables may not exactly agree with other related data, including other EIA sources. Major reasons for differences include: the timing of updates from state and commercial sources,
the summed production of available well‐level production data versus state‐level aggregations of production, and how a well is defined and which entities are counted and summed.
3) Wells counted for this report include sidetracks, completions, re‐completions and leases, this includes all oil and/or gas producing 'entities' available in DrillingInfo database.
4) For late reporting states the last year of available data is repeated for missing years (TN 2012 used for 2013‐16, KY 2013 used for 2014‐16 and MO 2014 for 2015‐16). All years are missing for IL and IN.
5) To be consistent between states a GOR of 6,000 (cf/bbl) for each years production was used to define oil versus gas wells. If the GOR was less (greater) than 6,000 (cf/bbl) the well was classed an oil (gas) well.
6) To determine production rate brackets for the first and last year of a wells life the annual production was divided
by the number of days in the productive months. For other years the annual production was divided by 365 or 366 days.
7) Gas volumes have been converted from the various state pressure bases to the Federal base (14.73 psia).
Data available as of November 2017.
Oil wells Gas wells Total wells
U.S. Energy Information Administration | The Distribution of U.S. Oil and Natural Gas Wells by Production Rate B7

December 2017
Table B8. United States oil and gas well summary statistics, 2007
Annual Annual Annual Annual Annual Annual
oil Oil rate gas Gas rate gas Gas rate oil Oil rate oil gas Horizontal
Prod. rate bracket # of oil % of oil prod. % of oil per Well prod. per well # of gas % of gas prod. % of gas per well prod. per well # of total prod. prod. well
(BOE/day) wells wells (MMbbl) prod. (bbl/day) (Bcf) (Mcf/day) wells wells (Bcf) Prod. (Mcf/Day) (MMbbl) (bbl/Day) wells (MMbbl) (Bcf) count
0 ‐ 1 150,398 39.8 17.5 1.1 0.3 5.6 0.1 116,694 23.5 98.2 0.5 2.4 0.9 0.0 267,092 18.4 103.8 955
1 ‐ 2 47,378 12.5 23.1 1.4 1.4 9.3 0.5 57,029 11.5 169.4 0.9 8.3 1.5 0.1 104,407 24.6 178.6 702
2 ‐ 4 49,505 13.1 47.3 2.9 2.7 22.8 1.3 66,943 13.5 394.0 2.0 16.6 3.6 0.2 116,448 50.9 416.9 1,062
4 ‐ 6 27,180 7.2 43.1 2.6 4.5 27.1 2.8 44,147 8.9 438.9 2.2 28.0 4.3 0.3 71,327 47.4 466.0 907
6 ‐ 8 18,238 4.8 40.5 2.5 6.2 27.4 4.2 32,119 6.5 449.3 2.3 39.4 4.3 0.4 50,357 44.8 476.7 842
8 ‐ 10 12,827 3.4 36.6 2.2 8.0 25.0 5.5 24,871 5.0 448.1 2.2 50.9 4.1 0.5 37,698 40.7 473.1 752
Subtotal <=10 305,526 80.8 208.2 12.7 1.9 117.1 1.1 341,803 68.8 1,998.0 10.0 16.5 18.6 0.2 647,329 226.8 2,115.1 5,220
10 ‐ 12 9,545 2.5 33.0 2.0 9.8 23.6 7.0 19,146 3.9 423.0 2.1 62.5 3.7 0.6 28,691 36.7 446.6 697
12 ‐ 15 10,839 2.9 46.3 2.8 12.1 31.0 8.1 21,129 4.3 570.0 2.9 76.4 5.0 0.7 31,968 51.4 601.0 938
Subtotal <=15 325,910 86.2 287.5 17.5 2.5 171.7 1.5 382,078 76.9 2,991.0 15.0 22.1 27.4 0.2 707,988 314.9 3,162.7 6,855
15 ‐ 20 12,087 3.2 66.3 4.0 15.6 43.2 10.2 23,319 4.7 807.6 4.0 98.6 7.1 0.9 35,406 73.4 850.9 1,314
20 ‐ 25 8,091 2.1 56.3 3.4 20.1 38.2 13.6 15,059 3.0 671.5 3.4 127.3 5.9 1.1 23,150 62.1 709.7 1,084
25 ‐ 30 5,656 1.5 47.7 2.9 24.5 34.1 17.5 10,741 2.2 582.6 2.9 156.4 5.0 1.3 16,397 52.7 616.7 927
30 ‐ 40 7,412 2.0 77.2 4.7 30.8 55.6 22.2 14,486 2.9 983.3 4.9 197.2 8.5 1.7 21,898 85.7 1,038.9 1,425
40 ‐ 50 4,347 1.2 57.3 3.5 39.5 44.4 30.6 9,172 1.9 792.4 4.0 255.1 6.7 2.2 13,519 64.0 836.8 1,089
50 ‐ 100 7,875 2.1 156.3 9.5 60.4 125.3 48.5 20,868 4.2 2,729.3 13.7 399.9 21.9 3.2 28,743 178.2 2,854.6 3,385
Subtotal <=100 371,378 98.2 748.6 45.7 5.7 512.6 3.9 475,723 95.7 9,557.7 47.9 57.0 82.6 0.5 847,101 831.1 10,070.3 16,079
100 ‐ 200 3,473 0.9 135.1 8.2 120.4 120.7 107.6 12,712 2.6 3,047.3 15.3 799.3 22.4 5.9 16,185 157.5 3,168.0 2,928
200 ‐ 400 1,755 0.5 140.6 8.6 240.5 132.4 226.3 5,588 1.1 2,382.8 11.9 1,539.3 22.8 14.7 7,343 163.4 2,515.1 1,593
400 ‐ 800 926 0.2 140.9 8.6 454.6 171.5 553.6 1,986 0.4 1,606.6 8.0 3,041.5 19.6 37.2 2,912 160.5 1,778.1 410
800 ‐ 1,600 390 0.1 113.6 6.9 892.0 153.8 1,207.6 700 0.1 1,174.3 5.9 6,019.8 15.9 81.6 1,090 129.5 1,328.1 59
1,600 ‐ 3,200 162 0.0 97.6 6.0 1,845.6 129.5 2,448.4 225 0.1 827.8 4.1 12,014.7 13.0 189.1 387 110.6 957.3 11
3,200 ‐ 6,400 85 0.0 98.3 6.0 3,658.7 128.9 4,794.9 89 0.0 679.7 3.4 24,197.8 10.6 376.4 174 108.9 808.6 10
6,400 ‐ 12,800 49 0.0 119.9 7.3 7,364.1 163.1 10,017.7 49 0.0 608.8 3.1 45,550.4 10.9 816.4 98 130.8 771.9 0
> 12,800 9 0.0 44.5 2.7 14,192.8 53.9 17,205.3 3 0.0 89.7 0.5 81,903.3 3.1 2,799.4 12 47.5 143.6 0
Total 378,227 100.0 1,639.0 100.0 12.2 1,566.4 11.7 497,075 100.0 19,974.6 100.0 114.9 200.9 1.2 875,302 1,839.9 21,541.0 21,090
Notes:
1) Source: State administrative oil & natural gas data thru DrillingInfo.
2) The total volumes shown in the distribution tables may not exactly agree with other related data, including other EIA sources. Major reasons for differences include: the timing of updates from state and commercial sources,
the summed production of available well‐level production data versus state‐level aggregations of production, and how a well is defined and which entities are counted and summed.
3) Wells counted for this report include sidetracks, completions, re‐completions and leases, this includes all oil and/or gas producing 'entities' available in DrillingInfo database.
4) For late reporting states the last year of available data is repeated for missing years (TN 2012 used for 2013‐16, KY 2013 used for 2014‐16 and MO 2014 for 2015‐16). All years are missing for IL and IN.
5) To be consistent between states a GOR of 6,000 (cf/bbl) for each years production was used to define oil versus gas wells. If the GOR was less (greater) than 6,000 (cf/bbl) the well was classed an oil (gas) well.
6) To determine production rate brackets for the first and last year of a wells life the annual production was divided
by the number of days in the productive months. For other years the annual production was divided by 365 or 366 days.
7) Gas volumes have been converted from the various state pressure bases to the Federal base (14.73 psia).
Data available as of November 2017.
Oil wells Gas wells Total wells
U.S. Energy Information Administration | The Distribution of U.S. Oil and Natural Gas Wells by Production Rate B8

December 2017
Table B9. United States oil and gas well summary statistics, 2008
Annual Annual Annual Annual Annual Annual
oil Oil rate gas Gas rate gas Gas rate oil Oil rate oil gas Horizontal
Prod. rate bracket # of oil % of oil prod. % of oil per Well prod. per well # of gas % of gas prod. % of gas per well prod. per well # of total prod. prod. well
(BOE/day) wells wells (MMbbl) prod. (bbl/day) (Bcf) (Mcf/day) wells wells (Bcf) Prod. (Mcf/Day) (MMbbl) (bbl/Day) wells (MMbbl) (Bcf) count
0 ‐ 1 157,930 40.0 18.3 1.1 0.3 6.4 0.1 130,974 24.3 108.1 0.5 2.3 1.1 0.0 288,904 19.3 114.5 1,058
1 ‐ 2 50,331 12.7 24.3 1.5 1.4 10.9 0.6 62,811 11.7 186.8 0.9 8.3 1.6 0.1 113,142 26.0 197.8 785
2 ‐ 4 51,240 13.0 48.8 3.0 2.7 24.9 1.4 73,391 13.6 433.0 2.1 16.5 4.0 0.2 124,631 52.8 457.9 1,090
4 ‐ 6 28,203 7.1 44.6 2.8 4.4 28.5 2.8 47,421 8.8 473.3 2.2 28.0 4.6 0.3 75,624 49.2 501.7 1,058
6 ‐ 8 18,673 4.7 41.4 2.6 6.2 27.9 4.2 34,314 6.4 483.6 2.3 39.6 4.4 0.4 52,987 45.8 511.5 1,040
8 ‐ 10 13,060 3.3 37.0 2.3 8.0 25.9 5.6 25,448 4.7 462.0 2.2 50.9 4.2 0.5 38,508 41.2 487.8 942
Subtotal <=10 319,437 80.9 214.4 13.3 1.9 124.5 1.1 374,359 69.5 2,146.7 10.2 16.1 19.9 0.1 693,796 234.3 2,271.2 5,973
10 ‐ 12 10,182 2.6 35.2 2.2 9.8 24.7 6.9 19,439 3.6 432.3 2.0 62.5 3.8 0.6 29,621 39.0 457.0 789
12 ‐ 15 11,109 2.8 47.3 2.9 12.1 31.1 7.9 21,609 4.0 584.6 2.8 76.3 5.4 0.7 32,718 52.8 615.7 1,157
Subtotal <=15 340,728 86.3 296.9 18.4 2.4 180.3 1.5 415,407 77.1 3,163.6 15.0 21.4 29.2 0.2 756,135 326.1 3,343.9 7,919
15 ‐ 20 12,414 3.1 67.3 4.2 15.6 45.8 10.6 24,236 4.5 841.4 4.0 98.6 7.5 0.9 36,650 74.8 887.2 1,616
20 ‐ 25 8,348 2.1 57.9 3.6 20.0 40.7 14.1 15,952 3.0 714.1 3.4 127.3 6.4 1.1 24,300 64.3 754.7 1,485
25 ‐ 30 5,929 1.5 49.4 3.1 24.5 35.5 17.6 11,424 2.1 620.6 2.9 155.9 5.5 1.4 17,353 54.9 656.1 1,136
30 ‐ 40 7,651 1.9 79.0 4.9 30.7 60.3 23.4 15,242 2.8 1,039.4 4.9 197.7 8.8 1.7 22,893 87.7 1,099.7 1,962
40 ‐ 50 4,497 1.1 58.6 3.6 39.6 44.8 30.3 9,979 1.9 869.2 4.1 255.2 7.4 2.2 14,476 66.1 914.1 1,475
50 ‐ 100 8,258 2.1 159.7 9.9 60.1 134.9 50.8 22,645 4.2 3,008.0 14.2 402.4 23.0 3.1 30,903 182.7 3,142.9 4,686
Subtotal <=100 387,825 98.2 768.8 47.5 5.6 542.2 3.9 514,885 95.6 10,256.3 48.5 56.3 87.8 0.5 902,710 856.5 10,798.5 20,279
100 ‐ 200 3,753 1.0 141.9 8.8 119.8 126.8 107.1 14,210 2.6 3,430.8 16.2 801.8 23.3 5.5 17,963 165.2 3,557.6 4,099
200 ‐ 400 1,745 0.4 131.9 8.2 236.8 131.1 235.2 6,370 1.2 2,729.0 12.9 1,550.2 22.7 12.9 8,115 154.6 2,860.1 2,502
400 ‐ 800 935 0.2 142.1 8.8 462.9 164.7 536.3 2,062 0.4 1,618.8 7.7 3,033.1 19.3 36.2 2,997 161.5 1,783.5 694
800 ‐ 1,600 413 0.1 118.5 7.3 896.4 157.5 1,191.5 629 0.1 986.8 4.7 5,868.7 14.8 88.1 1,042 133.3 1,144.3 128
1,600 ‐ 3,200 131 0.0 77.7 4.8 1,779.9 101.4 2,323.1 234 0.0 780.2 3.7 11,942.6 10.6 162.1 365 88.3 881.6 20
3,200 ‐ 6,400 65 0.0 82.4 5.1 3,756.1 100.1 4,566.1 83 0.0 669.8 3.2 24,808.5 10.6 391.3 148 92.9 770.0 8
6,400 ‐ 12,800 41 0.0 93.0 5.8 7,306.2 102.3 8,038.1 34 0.0 552.6 2.6 47,316.9 9.3 799.6 75 102.3 654.9 0
> 12,800 13 0.0 60.9 3.8 15,471.3 50.9 12,934.9 5 0.0 126.7 0.6 76,859.0 3.0 1,826.8 18 63.9 177.6 0
Total 394,921 100.0 1,617.1 100.0 11.6 1,477.0 10.6 538,512 100.0 21,151.0 100.0 111.9 201.4 1.1 933,433 1,818.5 22,627.9 27,730
Notes:
1) Source: State administrative oil & natural gas data thru DrillingInfo.
2) The total volumes shown in the distribution tables may not exactly agree with other related data, including other EIA sources. Major reasons for differences include: the timing of updates from state and commercial sources,
the summed production of available well‐level production data versus state‐level aggregations of production, and how a well is defined and which entities are counted and summed.
3) Wells counted for this report include sidetracks, completions, re‐completions and leases, this includes all oil and/or gas producing 'entities' available in DrillingInfo database.
4) For late reporting states the last year of available data is repeated for missing years (TN 2012 used for 2013‐16, KY 2013 used for 2014‐16 and MO 2014 for 2015‐16). All years are missing for IL and IN.
5) To be consistent between states a GOR of 6,000 (cf/bbl) for each years production was used to define oil versus gas wells. If the GOR was less (greater) than 6,000 (cf/bbl) the well was classed an oil (gas) well.
6) To determine production rate brackets for the first and last year of a wells life the annual production was divided
by the number of days in the productive months. For other years the annual production was divided by 365 or 366 days.
7) Gas volumes have been converted from the various state pressure bases to the Federal base (14.73 psia).
Data available as of November 2017.
Oil wells Gas wells Total wells
U.S. Energy Information Administration | The Distribution of U.S. Oil and Natural Gas Wells by Production Rate B9

December 2017
Table B10. United States oil and gas well summary statistics, 2009
Annual Annual Annual Annual Annual Annual
oil Oil rate gas Gas rate gas Gas rate oil Oil rate oil gas Horizontal
Prod. rate bracket # of oil % of oil prod. % of oil per Well prod. per well # of gas % of gas prod. % of gas per well prod. per well # of total prod. prod. well
(BOE/day) wells wells (MMbbl) prod. (bbl/day) (Bcf) (Mcf/day) wells wells (Bcf) Prod. (Mcf/Day) (MMbbl) (bbl/Day) wells (MMbbl) (Bcf) count
0 ‐ 1 160,137 40.8 18.4 1.1 0.3 6.5 0.1 133,911 24.6 110.8 0.5 2.4 1.0 0.0 294,048 19.4 117.4 1,265
1 ‐ 2 49,402 12.6 23.9 1.4 1.4 10.2 0.6 64,274 11.8 191.3 0.9 8.3 1.7 0.1 113,676 25.5 201.5 855
2 ‐ 4 51,025 13.0 48.3 2.8 2.7 24.8 1.4 75,161 13.8 446.5 2.1 16.6 4.0 0.1 126,186 52.3 471.3 1,291
4 ‐ 6 28,000 7.1 44.3 2.5 4.4 28.5 2.9 47,841 8.8 481.0 2.2 28.0 4.6 0.3 75,841 49.0 509.5 1,234
6 ‐ 8 18,362 4.7 40.6 2.3 6.2 27.8 4.3 34,904 6.4 494.7 2.3 39.5 4.6 0.4 53,266 45.2 522.5 1,123
8 ‐ 10 12,833 3.3 36.4 2.1 8.0 26.6 5.8 25,679 4.7 469.5 2.2 50.9 4.2 0.5 38,512 40.7 496.1 992
Subtotal <=10 319,759 81.4 212.0 12.1 1.9 124.5 1.1 381,770 70.2 2,193.8 10.2 16.1 20.1 0.1 701,529 232.1 2,318.3 6,760
10 ‐ 12 9,692 2.5 33.9 1.9 9.8 23.0 6.7 19,302 3.6 431.1 2.0 62.3 4.0 0.6 28,994 37.9 454.1 944
12 ‐ 15 10,812 2.8 46.3 2.7 12.0 32.0 8.3 21,733 4.0 594.8 2.8 76.3 5.6 0.7 32,545 51.8 626.7 1,280
Subtotal <=15 340,263 86.6 292.1 16.7 2.4 179.4 1.5 422,805 77.7 3,219.7 15.0 21.4 29.7 0.2 763,068 321.8 3,399.1 8,984
15 ‐ 20 12,260 3.1 67.1 3.9 15.5 46.6 10.8 24,094 4.4 848.4 4.0 98.4 7.9 0.9 36,354 75.1 895.0 1,992
20 ‐ 25 8,097 2.1 56.4 3.2 19.9 42.2 14.9 16,079 3.0 730.7 3.4 127.2 6.6 1.1 24,176 63.0 772.9 1,680
25 ‐ 30 5,650 1.4 47.9 2.7 24.4 35.2 17.9 11,537 2.1 639.6 3.0 156.0 5.6 1.4 17,187 53.5 674.8 1,399
30 ‐ 40 7,261 1.9 76.0 4.4 30.4 60.8 24.4 15,771 2.9 1,103.0 5.1 197.5 9.2 1.7 23,032 85.2 1,163.9 2,434
40 ‐ 50 4,303 1.1 57.0 3.3 39.4 44.2 30.6 9,866 1.8 886.1 4.1 255.3 7.4 2.1 14,169 64.3 930.4 1,910
50 ‐ 100 7,956 2.0 158.1 9.1 60.0 137.4 52.2 22,332 4.1 3,122.5 14.5 401.8 22.3 2.9 30,288 180.4 3,259.8 5,777
Subtotal <=100 385,790 98.2 754.5 43.2 5.5 545.9 4.0 522,484 96.0 10,550.0 49.1 56.7 88.8 0.5 908,274 843.3 11,095.9 24,176
100 ‐ 200 3,738 1.0 147.2 8.4 120.3 133.1 108.8 12,996 2.4 3,452.3 16.1 798.4 21.9 5.1 16,734 169.2 3,585.4 4,734
200 ‐ 400 1,813 0.5 140.7 8.1 240.0 135.6 231.2 5,566 1.0 2,586.9 12.0 1,545.1 21.6 12.9 7,379 162.3 2,722.5 2,705
400 ‐ 800 903 0.2 132.8 7.6 458.6 169.9 586.6 1,982 0.4 1,648.8 7.7 3,034.6 18.0 33.1 2,885 150.8 1,818.7 914
800 ‐ 1,600 382 0.1 110.3 6.3 877.2 156.5 1,244.6 700 0.1 1,100.4 5.1 6,074.6 15.2 83.9 1,082 125.5 1,256.9 284
1,600 ‐ 3,200 133 0.0 81.1 4.7 1,854.8 101.1 2,312.3 260 0.1 824.7 3.8 12,013.4 12.5 181.9 393 93.6 925.8 83
3,200 ‐ 6,400 68 0.0 90.0 5.2 3,965.3 92.7 4,082.5 67 0.0 561.7 2.6 25,392.4 8.4 380.3 135 98.4 654.3 3
6,400 ‐ 12,800 47 0.0 112.5 6.5 7,435.6 131.6 8,695.8 38 0.0 544.0 2.5 48,181.5 5.3 467.8 85 117.8 675.6 1
> 12,800 30 0.0 176.5 10.1 18,162.7 136.8 14,083.1 9 0.0 227.3 1.1 84,011.4 3.3 1,204.3 39 179.7 364.2 0
Total 392,904 100.0 1,745.7 100.0 12.5 1,603.1 11.5 544,102 100.0 21,496.2 100.0 111.5 194.9 1.0 937,006 1,940.6 23,099.3 32,900
Notes:
1) Source: State administrative oil & natural gas data thru DrillingInfo.
2) The total volumes shown in the distribution tables may not exactly agree with other related data, including other EIA sources. Major reasons for differences include: the timing of updates from state and commercial sources,
the summed production of available well‐level production data versus state‐level aggregations of production, and how a well is defined and which entities are counted and summed.
3) Wells counted for this report include sidetracks, completions, re‐completions and leases, this includes all oil and/or gas producing 'entities' available in DrillingInfo database.
4) For late reporting states the last year of available data is repeated for missing years (TN 2012 used for 2013‐16, KY 2013 used for 2014‐16 and MO 2014 for 2015‐16). All years are missing for IL and IN.
5) To be consistent between states a GOR of 6,000 (cf/bbl) for each years production was used to define oil versus gas wells. If the GOR was less (greater) than 6,000 (cf/bbl) the well was classed an oil (gas) well.
6) To determine production rate brackets for the first and last year of a wells life the annual production was divided
by the number of days in the productive months. For other years the annual production was divided by 365 or 366 days.
7) Gas volumes have been converted from the various state pressure bases to the Federal base (14.73 psia).
Data available as of November 2017.
Oil wells Gas wells Total wells
U.S. Energy Information Administration | The Distribution of U.S. Oil and Natural Gas Wells by Production Rate B10

December 2017
Table B11. United States oil and gas well summary statistics, 2010
Annual Annual Annual Annual Annual Annual
oil Oil rate gas Gas rate gas Gas rate oil Oil rate oil gas Horizontal
Prod. rate bracket # of oil % of oil prod. % of oil per Well prod. per well # of gas % of gas prod. % of gas per well prod. per well # of total prod. prod. well
(BOE/day) wells wells (MMbbl) prod. (bbl/day) (Bcf) (Mcf/day) wells wells (Bcf) Prod. (Mcf/Day) (MMbbl) (bbl/Day) wells (MMbbl) (Bcf) count
0 ‐ 1 163,624 40.7 18.7 1.1 0.3 7.5 0.1 140,615 25.3 116.1 0.5 2.3 1.1 0.0 304,239 19.8 123.5 1,379
1 ‐ 2 51,198 12.7 24.8 1.4 1.4 10.7 0.6 66,678 12.0 199.6 0.9 8.3 1.7 0.1 117,876 26.4 210.3 955
2 ‐ 4 50,828 12.6 48.0 2.7 2.7 25.0 1.4 76,551 13.8 456.8 2.1 16.6 4.1 0.1 127,379 52.1 481.8 1,459
4 ‐ 6 28,238 7.0 44.5 2.5 4.4 29.5 2.9 48,923 8.8 492.9 2.2 28.0 4.7 0.3 77,161 49.2 522.4 1,392
6 ‐ 8 18,437 4.6 40.6 2.3 6.2 29.1 4.4 35,029 6.3 496.1 2.2 39.4 4.8 0.4 53,466 45.4 525.2 1,294
8 ‐ 10 13,042 3.2 36.5 2.0 8.0 25.9 5.7 25,688 4.6 468.3 2.1 50.7 4.6 0.5 38,730 41.1 494.2 1,156
Subtotal <=10 325,367 80.9 213.1 11.9 1.8 127.6 1.1 393,484 70.7 2,229.8 10.0 15.8 20.9 0.1 718,851 234.0 2,357.5 7,635
10 ‐ 12 9,783 2.4 33.7 1.9 9.8 24.9 7.2 19,308 3.5 430.7 1.9 62.2 4.2 0.6 29,091 37.9 455.6 1,155
12 ‐ 15 10,981 2.7 46.1 2.6 12.0 33.8 8.8 21,681 3.9 592.7 2.7 76.1 5.7 0.7 32,662 51.8 626.4 1,557
Subtotal <=15 346,131 86.1 292.9 16.4 2.4 186.3 1.5 434,473 78.1 3,253.2 14.6 20.9 30.7 0.2 780,604 323.6 3,439.5 10,347
15 ‐ 20 12,247 3.1 66.0 3.7 15.5 47.6 11.1 24,337 4.4 855.1 3.8 98.2 8.2 0.9 36,584 74.2 902.7 2,365
20 ‐ 25 8,233 2.1 56.1 3.1 19.9 42.3 15.0 16,291 2.9 740.6 3.3 127.5 6.5 1.1 24,524 62.6 782.9 1,968
25 ‐ 30 5,750 1.4 47.3 2.6 24.2 36.7 18.8 11,802 2.1 655.7 2.9 156.1 5.7 1.3 17,552 52.9 692.4 1,716
30 ‐ 40 7,509 1.9 75.9 4.2 30.4 61.9 24.8 15,622 2.8 1,094.4 4.9 197.7 9.2 1.7 23,131 85.1 1,156.3 2,829
40 ‐ 50 4,635 1.2 59.2 3.3 39.1 49.8 32.9 9,883 1.8 893.2 4.0 255.8 7.1 2.0 14,518 66.3 943.0 2,227
50 ‐ 100 8,976 2.2 168.0 9.4 59.7 157.4 56.0 21,474 3.9 3,008.4 13.5 402.4 20.4 2.7 30,450 188.4 3,165.8 6,733
Subtotal <=100 393,481 97.9 765.4 42.8 5.5 582.0 4.2 533,882 96.0 10,500.6 47.2 55.0 87.7 0.5 927,363 853.1 11,082.6 28,185
100 ‐ 200 4,387 1.1 162.6 9.1 121.2 145.1 108.2 12,432 2.2 3,229.1 14.5 797.6 21.7 5.4 16,819 184.3 3,374.3 5,571
200 ‐ 400 2,391 0.6 163.1 9.1 237.4 164.9 240.0 5,756 1.0 2,608.3 11.7 1,577.2 20.7 12.5 8,147 183.9 2,773.3 3,864
400 ‐ 800 1,146 0.3 148.4 8.3 457.2 179.8 553.8 2,540 0.5 2,012.9 9.0 3,104.1 19.3 29.7 3,686 167.7 2,192.7 1,877
800 ‐ 1,600 367 0.1 101.3 5.7 885.2 139.1 1,215.2 1,252 0.2 1,848.1 8.3 6,205.5 18.4 61.7 1,619 119.7 1,987.2 886
1,600 ‐ 3,200 129 0.0 75.2 4.2 1,856.3 82.8 2,044.6 261 0.1 726.9 3.3 11,641.0 10.4 167.2 390 85.6 809.7 142
3,200 ‐ 6,400 68 0.0 90.4 5.1 3,960.0 94.3 4,130.2 80 0.0 660.0 3.0 24,705.8 10.4 388.4 148 100.8 754.2 6
6,400 ‐ 12,800 40 0.0 100.2 5.6 7,316.8 133.1 9,718.7 27 0.0 473.1 2.1 49,836.9 6.1 646.7 67 106.3 606.1 1
> 12,800 34 0.0 183.9 10.3 16,980.0 141.3 13,041.1 8 0.0 208.1 0.9 81,436.9 2.8 1,077.1 42 186.7 349.3 0
Total 402,043 100.0 1,790.5 100.0 12.7 1,662.2 11.7 556,238 100.0 22,267.1 100.0 112.7 197.6 1.0 958,281 1,988.0 23,929.4 40,532
Notes:
1) Source: State administrative oil & natural gas data thru DrillingInfo.
2) The total volumes shown in the distribution tables may not exactly agree with other related data, including other EIA sources. Major reasons for differences include: the timing of updates from state and commercial sources,
the summed production of available well‐level production data versus state‐level aggregations of production, and how a well is defined and which entities are counted and summed.
3) Wells counted for this report include sidetracks, completions, re‐completions and leases, this includes all oil and/or gas producing 'entities' available in DrillingInfo database.
4) For late reporting states the last year of available data is repeated for missing years (TN 2012 used for 2013‐16, KY 2013 used for 2014‐16 and MO 2014 for 2015‐16). All years are missing for IL and IN.
5) To be consistent between states a GOR of 6,000 (cf/bbl) for each years production was used to define oil versus gas wells. If the GOR was less (greater) than 6,000 (cf/bbl) the well was classed an oil (gas) well.
6) To determine production rate brackets for the first and last year of a wells life the annual production was divided
by the number of days in the productive months. For other years the annual production was divided by 365 or 366 days.
7) Gas volumes have been converted from the various state pressure bases to the Federal base (14.73 psia).
Data available as of November 2017.
Oil wells Gas wells Total wells
U.S. Energy Information Administration | The Distribution of U.S. Oil and Natural Gas Wells by Production Rate B11

December 2017
Table B12. United States oil and gas well summary statistics, 2011
Annual Annual Annual Annual Annual Annual
oil Oil rate gas Gas rate gas Gas rate oil Oil rate oil gas Horizontal
Prod. rate bracket # of oil % of oil prod. % of oil per Well prod. per well # of gas % of gas prod. % of gas per well prod. per well # of total prod. prod. well
(BOE/day) wells wells (MMbbl) prod. (bbl/day) (Bcf) (Mcf/day) wells wells (Bcf) Prod. (Mcf/Day) (MMbbl) (bbl/Day) wells (MMbbl) (Bcf) count
0 ‐ 1 168,032 40.3 19.4 1.1 0.3 7.5 0.1 146,501 25.9 120.9 0.5 2.3 1.2 0.0 314,533 20.6 128.3 1,536
1 ‐ 2 52,411 12.6 25.2 1.4 1.4 11.1 0.6 68,395 12.1 204.7 0.9 8.3 1.7 0.1 120,806 26.9 215.8 1,019
2 ‐ 4 53,069 12.7 49.3 2.7 2.6 26.1 1.4 78,137 13.8 465.2 2.0 16.5 4.3 0.2 131,206 53.6 491.2 1,772
4 ‐ 6 28,846 6.9 45.1 2.5 4.4 29.5 2.9 49,396 8.7 498.8 2.1 28.0 4.8 0.3 78,242 49.9 528.4 1,619
6 ‐ 8 18,791 4.5 40.8 2.2 6.2 29.6 4.5 34,710 6.1 492.1 2.1 39.4 4.9 0.4 53,501 45.7 521.7 1,535
8 ‐ 10 13,248 3.2 37.2 2.0 8.0 27.1 5.8 25,784 4.6 471.2 2.0 50.7 4.6 0.5 39,032 41.7 498.4 1,434
Subtotal <=10 334,397 80.1 217.0 11.8 1.8 130.9 1.1 402,923 71.3 2,252.9 9.6 15.6 21.3 0.1 737,320 238.3 2,383.7 8,915
10 ‐ 12 9,911 2.4 33.5 1.8 9.7 25.4 7.4 19,158 3.4 428.1 1.8 62.1 4.3 0.6 29,069 37.8 453.6 1,335
12 ‐ 15 11,305 2.7 47.0 2.6 11.9 34.8 8.9 21,394 3.8 584.8 2.5 76.0 5.8 0.8 32,699 52.8 619.7 1,864
Subtotal <=15 355,613 85.2 297.5 16.1 2.4 191.2 1.5 443,475 78.4 3,265.8 13.9 20.5 31.4 0.2 799,088 329.0 3,457.0 12,114
15 ‐ 20 12,848 3.1 67.5 3.7 15.3 52.7 11.9 24,270 4.3 855.5 3.6 98.2 8.2 0.9 37,118 75.7 908.2 2,753
20 ‐ 25 8,526 2.0 57.0 3.1 19.7 45.9 15.9 16,515 2.9 752.3 3.2 127.2 6.9 1.2 25,041 63.9 798.2 2,268
25 ‐ 30 6,133 1.5 49.4 2.7 24.0 40.9 19.9 11,545 2.0 643.5 2.7 156.1 5.7 1.4 17,678 55.1 684.3 2,016
30 ‐ 40 8,039 1.9 79.4 4.3 30.2 69.6 26.5 15,263 2.7 1,071.8 4.6 197.5 8.9 1.6 23,302 88.3 1,141.3 3,294
40 ‐ 50 4,898 1.2 60.2 3.3 38.6 55.6 35.6 9,556 1.7 861.5 3.7 255.1 7.0 2.1 14,454 67.2 917.1 2,754
50 ‐ 100 10,255 2.5 189.0 10.3 59.8 187.3 59.2 20,717 3.7 2,902.3 12.3 401.4 21.1 2.9 30,972 210.1 3,089.6 8,385
Subtotal <=100 406,312 97.4 800.1 43.4 5.6 643.1 4.5 541,341 95.7 10,352.6 44.0 53.4 89.1 0.5 947,653 889.2 10,995.7 33,584
100 ‐ 200 5,480 1.3 194.7 10.6 119.2 199.1 121.9 12,152 2.2 3,161.1 13.4 794.3 25.0 6.3 17,632 219.7 3,360.2 7,323
200 ‐ 400 3,297 0.8 209.9 11.4 234.0 240.4 268.0 6,561 1.2 3,001.3 12.8 1,572.7 28.0 14.7 9,858 237.9 3,241.7 5,894
400 ‐ 800 1,561 0.4 167.4 9.1 439.3 239.4 628.2 3,454 0.6 2,812.8 12.0 3,132.6 29.2 32.5 5,015 196.6 3,052.2 3,347
800 ‐ 1,600 461 0.1 111.6 6.1 871.8 169.7 1,325.4 1,578 0.3 2,446.8 10.4 6,120.9 19.7 49.2 2,039 131.3 2,616.5 1,402
1,600 ‐ 3,200 123 0.0 76.0 4.1 1,877.2 88.6 2,188.4 253 0.0 696.2 3.0 11,713.6 8.7 146.1 376 84.7 784.9 145
3,200 ‐ 6,400 77 0.0 101.2 5.5 3,962.3 110.8 4,340.9 51 0.0 415.9 1.8 24,198.3 4.3 252.6 128 105.5 526.7 6
6,400 ‐ 12,800 34 0.0 89.1 4.8 7,588.0 128.7 10,959.3 27 0.0 466.7 2.0 48,259.8 5.0 514.8 61 94.1 595.4 0
> 12,800 16 0.0 93.7 5.1 16,385.8 64.5 11,280.7 6 0.0 161.0 0.7 86,730.1 1.0 525.3 22 94.7 225.5 0
Total 417,361 100.0 1,843.8 100.0 12.7 1,884.4 12.9 565,423 100.0 23,514.4 100.0 117.0 209.9 1.0 982,784 2,053.7 25,398.7 51,701
Notes:
1) Source: State administrative oil & natural gas data thru DrillingInfo.
2) The total volumes shown in the distribution tables may not exactly agree with other related data, including other EIA sources. Major reasons for differences include: the timing of updates from state and commercial sources,
the summed production of available well‐level production data versus state‐level aggregations of production, and how a well is defined and which entities are counted and summed.
3) Wells counted for this report include sidetracks, completions, re‐completions and leases, this includes all oil and/or gas producing 'entities' available in DrillingInfo database.
4) For late reporting states the last year of available data is repeated for missing years (TN 2012 used for 2013‐16, KY 2013 used for 2014‐16 and MO 2014 for 2015‐16). All years are missing for IL and IN.
5) To be consistent between states a GOR of 6,000 (cf/bbl) for each years production was used to define oil versus gas wells. If the GOR was less (greater) than 6,000 (cf/bbl) the well was classed an oil (gas) well.
6) To determine production rate brackets for the first and last year of a wells life the annual production was divided
by the number of days in the productive months. For other years the annual production was divided by 365 or 366 days.
7) Gas volumes have been converted from the various state pressure bases to the Federal base (14.73 psia).
Data available as of November 2017.
Oil wells Gas wells Total wells
U.S. Energy Information Administration | The Distribution of U.S. Oil and Natural Gas Wells by Production Rate B12

December 2017
Table B13. United States oil and gas well summary statistics, 2012
Annual Annual Annual Annual Annual Annual
oil Oil rate gas Gas rate gas Gas rate oil Oil rate oil gas Horizontal
Prod. rate bracket # of oil % of oil prod. % of oil per Well prod. per well # of gas % of gas prod. % of gas per well prod. per well # of total prod. prod. well
(BOE/day) wells wells (MMbbl) prod. (bbl/day) (Bcf) (Mcf/day) wells wells (Bcf) Prod. (Mcf/Day) (MMbbl) (bbl/Day) wells (MMbbl) (Bcf) count
0 ‐ 1 171,075 39.5 20.0 0.9 0.3 7.6 0.1 152,606 26.8 125.8 0.5 2.3 1.3 0.0 323,681 21.3 133.4 1,749
1 ‐ 2 53,568 12.4 26.0 1.2 1.4 11.3 0.6 69,695 12.3 208.4 0.9 8.3 1.8 0.1 123,263 27.8 219.7 1,165
2 ‐ 4 54,380 12.5 51.1 2.4 2.6 26.8 1.4 77,691 13.7 461.7 1.9 16.5 4.4 0.2 132,071 55.5 488.5 2,029
4 ‐ 6 29,441 6.8 46.5 2.2 4.4 30.4 2.9 48,944 8.6 493.7 2.1 28.0 5.0 0.3 78,385 51.5 524.1 1,845
6 ‐ 8 19,036 4.4 41.9 2.0 6.2 29.7 4.4 34,105 6.0 484.2 2.0 39.3 5.0 0.4 53,141 46.9 513.9 1,800
8 ‐ 10 13,628 3.1 38.3 1.8 8.0 28.7 6.0 24,614 4.3 450.0 1.9 50.6 4.6 0.5 38,242 43.0 478.7 1,626
Subtotal <=10 341,128 78.7 223.9 10.5 1.8 134.6 1.1 407,655 71.6 2,223.8 9.3 15.2 22.0 0.2 748,783 245.9 2,358.4 10,214
10 ‐ 12 10,527 2.4 36.1 1.7 9.7 27.0 7.3 19,094 3.4 426.9 1.8 61.8 4.5 0.7 29,621 40.6 453.9 1,507
12 ‐ 15 11,598 2.7 48.3 2.3 11.9 37.7 9.3 21,041 3.7 575.9 2.4 75.8 5.9 0.8 32,639 54.2 613.6 2,145
Subtotal <=15 363,253 83.8 308.3 14.5 2.4 199.3 1.5 447,790 78.7 3,226.6 13.4 20.1 32.4 0.2 811,043 340.7 3,425.9 13,866
15 ‐ 20 13,291 3.1 70.2 3.3 15.2 57.0 12.4 23,968 4.2 846.2 3.5 98.0 8.5 1.0 37,259 78.8 903.1 3,061
20 ‐ 25 9,113 2.1 61.1 2.9 19.6 51.5 16.5 16,003 2.8 730.3 3.0 126.8 6.9 1.2 25,116 68.0 781.8 2,683
25 ‐ 30 6,315 1.5 51.0 2.4 23.8 45.5 21.2 11,436 2.0 640.2 2.7 155.8 5.7 1.4 17,751 56.7 685.6 2,363
30 ‐ 40 8,651 2.0 86.3 4.1 30.0 80.1 27.8 14,916 2.6 1,052.8 4.4 196.9 9.4 1.8 23,567 95.7 1,132.9 4,073
40 ‐ 50 5,337 1.2 65.9 3.1 38.2 65.8 38.1 9,259 1.6 844.0 3.5 255.5 7.0 2.1 14,596 72.9 909.8 3,283
50 ‐ 100 11,889 2.7 218.6 10.3 59.1 235.0 63.5 20,532 3.6 2,896.2 12.1 398.5 26.0 3.6 32,421 244.7 3,131.3 10,637
Subtotal <=100 417,849 96.4 861.4 40.4 5.8 734.0 5.0 543,904 95.6 10,236.3 42.6 52.4 95.9 0.5 961,753 957.3 10,970.3 39,966
100 ‐ 200 7,404 1.7 259.0 12.2 117.8 298.6 135.8 12,584 2.2 3,369.2 14.0 794.0 33.4 7.9 19,988 292.4 3,667.8 10,563
200 ‐ 400 5,073 1.2 304.8 14.3 228.0 397.0 296.9 7,394 1.3 3,529.1 14.7 1,553.8 41.4 18.2 12,467 346.2 3,926.0 8,985
400 ‐ 800 2,273 0.5 227.2 10.7 431.2 351.6 667.2 3,683 0.7 3,262.3 13.6 3,102.1 34.4 32.7 5,956 261.6 3,613.9 4,568
800 ‐ 1,600 629 0.2 132.0 6.2 834.4 219.2 1,385.6 1,309 0.2 2,176.3 9.1 6,052.7 16.4 45.5 1,938 148.3 2,395.5 1,360
1,600 ‐ 3,200 128 0.0 72.8 3.4 1,893.7 79.0 2,054.4 215 0.0 620.3 2.6 11,828.9 7.1 134.8 343 79.9 699.3 130
3,200 ‐ 6,400 76 0.0 98.3 4.6 3,675.4 104.7 3,914.1 52 0.0 420.1 1.8 25,504.4 5.0 304.4 128 103.3 524.8 8
6,400 ‐ 12,800 39 0.0 104.5 4.9 7,681.7 151.7 11,148.8 23 0.0 361.5 1.5 48,361.7 2.5 330.0 62 107.0 513.1 1
> 12,800 15 0.0 71.9 3.4 14,733.6 58.7 12,017.6 3 0.0 63.2 0.3 82,857.5 0.0 5.9 18 71.9 121.9 1
Total 433,486 100.0 2,131.9 100.0 14.0 2,394.3 15.8 569,167 100.0 24,038.3 100.0 118.3 236.1 1.2 1,002,653 2,368.0 26,432.6 65,582
Notes:
1) Source: State administrative oil & natural gas data thru DrillingInfo.
2) The total volumes shown in the distribution tables may not exactly agree with other related data, including other EIA sources. Major reasons for differences include: the timing of updates from state and commercial sources,
the summed production of available well‐level production data versus state‐level aggregations of production, and how a well is defined and which entities are counted and summed.
3) Wells counted for this report include sidetracks, completions, re‐completions and leases, this includes all oil and/or gas producing 'entities' available in DrillingInfo database.
4) For late reporting states the last year of available data is repeated for missing years (TN 2012 used for 2013‐16, KY 2013 used for 2014‐16 and MO 2014 for 2015‐16). All years are missing for IL and IN.
5) To be consistent between states a GOR of 6,000 (cf/bbl) for each years production was used to define oil versus gas wells. If the GOR was less (greater) than 6,000 (cf/bbl) the well was classed an oil (gas) well.
6) To determine production rate brackets for the first and last year of a wells life the annual production was divided
by the number of days in the productive months. For other years the annual production was divided by 365 or 366 days.
7) Gas volumes have been converted from the various state pressure bases to the Federal base (14.73 psia).
Data available as of November 2017.
Oil wells Gas wells Total wells
U.S. Energy Information Administration | The Distribution of U.S. Oil and Natural Gas Wells by Production Rate B13

December 2017
Table B14. United States oil and gas well summary statistics, 2013
Annual Annual Annual Annual Annual Annual
oil Oil rate gas Gas rate gas Gas rate oil Oil rate oil gas Horizontal
Prod. rate bracket # of oil % of oil prod. % of oil per Well prod. per well # of gas % of gas prod. % of gas per well prod. per well # of total prod. prod. well
(BOE/day) wells wells (MMbbl) prod. (bbl/day) (Bcf) (Mcf/day) wells wells (Bcf) Prod. (Mcf/Day) (MMbbl) (bbl/Day) wells (MMbbl) (Bcf) count
0 ‐ 1 177,494 39.5 20.4 0.8 0.3 7.7 0.1 154,315 27.2 126.4 0.5 2.3 1.2 0.0 331,809 21.7 134.0 2,015
1 ‐ 2 54,556 12.1 26.3 1.1 1.4 11.3 0.6 69,602 12.3 208.2 0.9 8.3 1.8 0.1 124,158 28.1 219.5 1,274
2 ‐ 4 54,286 12.1 50.9 2.1 2.6 26.6 1.4 77,967 13.7 463.2 1.9 16.5 4.5 0.2 132,253 55.4 489.8 2,356
4 ‐ 6 30,095 6.7 47.5 2.0 4.4 30.8 2.9 48,281 8.5 485.9 2.0 27.9 5.1 0.3 78,376 52.6 516.7 2,087
6 ‐ 8 19,199 4.3 42.0 1.7 6.2 30.8 4.5 33,540 5.9 475.4 2.0 39.2 5.0 0.4 52,739 47.0 506.2 2,054
8 ‐ 10 13,920 3.1 39.1 1.6 8.0 29.0 5.9 24,235 4.3 441.4 1.8 50.5 4.8 0.5 38,155 43.9 470.4 1,883
Subtotal <=10 349,550 77.7 226.3 9.3 1.8 136.3 1.1 407,940 71.9 2,200.4 9.2 15.0 22.3 0.2 757,490 248.6 2,336.7 11,669
10 ‐ 12 10,506 2.3 35.8 1.5 9.7 27.4 7.4 18,551 3.3 413.7 1.7 61.8 4.5 0.7 29,057 40.3 441.1 1,746
12 ‐ 15 11,867 2.6 49.5 2.0 11.9 38.3 9.2 20,564 3.6 562.3 2.3 75.7 6.0 0.8 32,431 55.6 600.6 2,439
Subtotal <=15 371,923 82.7 311.6 12.8 2.4 202.0 1.5 447,055 78.8 3,176.4 13.2 19.8 32.9 0.2 818,978 344.4 3,378.3 15,854
15 ‐ 20 13,471 3.0 71.2 2.9 15.2 60.0 12.8 23,459 4.1 830.1 3.5 98.1 8.1 1.0 36,930 79.3 890.1 3,424
20 ‐ 25 9,074 2.0 61.1 2.5 19.6 52.3 16.7 15,471 2.7 706.5 2.9 126.6 6.9 1.2 24,545 68.0 758.8 3,061
25 ‐ 30 6,521 1.5 52.7 2.2 23.7 48.3 21.7 10,998 1.9 613.0 2.6 155.1 6.0 1.5 17,519 58.7 661.3 2,838
30 ‐ 40 9,134 2.0 90.9 3.7 29.7 88.7 29.0 14,503 2.6 1,018.7 4.2 196.0 9.8 1.9 23,637 100.7 1,107.4 4,882
40 ‐ 50 5,825 1.3 73.7 3.0 38.2 74.5 38.6 9,070 1.6 819.9 3.4 252.9 8.3 2.6 14,895 82.0 894.4 4,098
50 ‐ 100 13,717 3.1 259.8 10.7 59.0 309.5 70.2 20,807 3.7 2,913.0 12.1 394.5 32.0 4.3 34,524 291.8 3,222.5 14,347
Subtotal <=100 429,665 95.5 921.0 37.8 6.1 835.3 5.5 541,363 95.4 10,077.5 42.0 51.8 104.0 0.5 971,028 1,025.0 10,912.8 48,504
100 ‐ 200 9,559 2.1 340.3 14.0 116.1 438.4 149.5 13,102 2.3 3,500.7 14.6 779.0 44.7 10.0 22,661 385.1 3,939.1 14,340
200 ‐ 400 6,669 1.5 393.7 16.2 223.2 571.2 323.7 7,748 1.4 3,693.1 15.4 1,520.8 55.8 23.0 14,417 449.5 4,264.2 11,335
400 ‐ 800 3,127 0.7 303.8 12.5 424.8 494.9 692.0 3,591 0.6 3,030.3 12.6 3,003.7 42.7 42.3 6,718 346.5 3,525.2 5,286
800 ‐ 1,600 688 0.2 137.7 5.7 840.4 223.1 1,362.1 1,308 0.2 2,053.8 8.6 6,095.7 18.3 54.2 1,996 155.9 2,276.9 1,471
1,600 ‐ 3,200 127 0.0 74.9 3.1 1,875.8 82.7 2,071.7 278 0.1 746.7 3.1 11,624.5 6.8 105.9 405 81.7 829.4 208
3,200 ‐ 6,400 69 0.0 87.9 3.6 3,760.0 89.2 3,816.1 55 0.0 420.5 1.8 25,635.4 4.0 245.8 124 91.9 509.7 17
6,400 ‐ 12,800 42 0.0 106.2 4.4 7,427.1 131.4 9,184.9 29 0.0 451.7 1.9 46,259.5 3.3 333.1 71 109.5 583.0 2
> 12,800 14 0.0 69.2 2.8 14,121.6 69.7 14,231.4 1 0.0 34.1 0.1 93,288.3 0.0 8.9 15 69.2 103.8 0
Total 449,960 100.0 2,434.8 100.0 15.5 2,935.8 18.7 567,475 100.0 24,008.3 100.0 118.4 279.5 1.4 1,017,435 2,714.3 26,944.1 81,163
Notes:
1) Source: State administrative oil & natural gas data thru DrillingInfo.
2) The total volumes shown in the distribution tables may not exactly agree with other related data, including other EIA sources. Major reasons for differences include: the timing of updates from state and commercial sources,
the summed production of available well‐level production data versus state‐level aggregations of production, and how a well is defined and which entities are counted and summed.
3) Wells counted for this report include sidetracks, completions, re‐completions and leases, this includes all oil and/or gas producing 'entities' available in DrillingInfo database.
4) For late reporting states the last year of available data is repeated for missing years (TN 2012 used for 2013‐16, KY 2013 used for 2014‐16 and MO 2014 for 2015‐16). All years are missing for IL and IN.
5) To be consistent between states a GOR of 6,000 (cf/bbl) for each years production was used to define oil versus gas wells. If the GOR was less (greater) than 6,000 (cf/bbl) the well was classed an oil (gas) well.
6) To determine production rate brackets for the first and last year of a wells life the annual production was divided
by the number of days in the productive months. For other years the annual production was divided by 365 or 366 days.
7) Gas volumes have been converted from the various state pressure bases to the Federal base (14.73 psia).
Data available as of November 2017.
Oil wells Gas wells Total wells
U.S. Energy Information Administration | The Distribution of U.S. Oil and Natural Gas Wells by Production Rate B14

December 2017
Table B15. United States oil and gas well summary statistics, 2014
Annual Annual Annual Annual Annual Annual
oil Oil rate gas Gas rate gas Gas rate oil Oil rate oil gas Horizontal
Prod. rate bracket # of oil % of oil prod. % of oil per Well prod. per well # of gas % of gas prod. % of gas per well prod. per well # of total prod. prod. well
(BOE/day) wells wells (MMbbl) prod. (bbl/day) (Bcf) (Mcf/day) wells wells (Bcf) Prod. (Mcf/Day) (MMbbl) (bbl/Day) wells (MMbbl) (Bcf) count
0 ‐ 1 181,165 38.8 20.6 0.7 0.3 8.1 0.1 162,984 28.3 130.7 0.5 2.3 1.3 0.0 344,149 21.9 138.8 2,364
1 ‐ 2 55,467 11.9 26.7 0.9 1.4 11.6 0.6 69,941 12.1 208.7 0.8 8.3 1.8 0.1 125,408 28.5 220.3 1,416
2 ‐ 4 54,889 11.8 51.3 1.8 2.6 27.1 1.4 77,258 13.4 457.7 1.8 16.4 4.5 0.2 132,147 55.8 484.8 2,636
4 ‐ 6 30,859 6.6 48.4 1.7 4.4 31.7 2.9 48,366 8.4 485.3 1.9 27.8 5.1 0.3 79,225 53.5 517.0 2,370
6 ‐ 8 19,728 4.2 43.1 1.5 6.2 31.6 4.5 33,180 5.8 469.0 1.9 39.2 5.0 0.4 52,908 48.0 500.6 2,301
8 ‐ 10 14,448 3.1 40.5 1.4 8.0 30.4 6.0 23,956 4.2 436.4 1.8 50.5 4.7 0.5 38,404 45.2 466.9 2,082
Subtotal <=10 356,556 76.4 230.5 8.1 1.8 140.4 1.1 415,685 72.2 2,187.8 8.8 14.7 22.4 0.2 772,241 252.9 2,328.2 13,169
10 ‐ 12 10,800 2.3 36.7 1.3 9.7 28.4 7.5 18,073 3.1 403.0 1.6 61.8 4.4 0.7 28,873 41.0 431.4 2,066
12 ‐ 15 12,112 2.6 50.3 1.8 11.8 40.6 9.5 19,992 3.5 547.5 2.2 75.8 5.7 0.8 32,104 55.9 588.1 2,686
Subtotal <=15 379,468 81.3 317.4 11.1 2.4 209.4 1.6 453,750 78.8 3,138.3 12.6 19.3 32.4 0.2 833,218 349.9 3,347.7 17,921
15 ‐ 20 13,879 3.0 73.7 2.6 15.2 62.4 12.9 23,220 4.0 818.7 3.3 97.9 8.4 1.0 37,099 82.1 881.1 4,166
20 ‐ 25 9,568 2.1 64.4 2.3 19.5 57.5 17.4 15,506 2.7 703.4 2.8 126.1 7.3 1.3 25,074 71.7 760.9 3,858
25 ‐ 30 7,068 1.5 57.3 2.0 23.7 53.6 22.1 10,838 1.9 602.1 2.4 154.6 6.2 1.6 17,906 63.5 655.7 3,489
30 ‐ 40 9,450 2.0 94.4 3.3 29.5 98.7 30.8 14,490 2.5 1,012.0 4.1 194.8 11.1 2.1 23,940 105.5 1,110.7 6,216
40 ‐ 50 6,321 1.4 80.6 2.8 38.1 84.4 39.9 9,370 1.6 840.0 3.4 250.7 9.8 2.9 15,691 90.4 924.4 5,349
50 ‐ 100 15,906 3.4 306.2 10.7 58.3 392.6 74.8 21,835 3.8 3,053.2 12.2 393.2 40.6 5.2 37,741 346.8 3,445.8 18,544
Subtotal <=100 441,660 94.6 994.0 34.9 6.4 958.6 6.2 549,009 95.3 10,167.7 40.7 51.6 115.8 0.6 990,669 1,109.8 11,126.3 59,543
100 ‐ 200 11,362 2.4 408.4 14.3 114.6 567.3 159.1 13,701 2.4 3,596.8 14.4 761.0 57.6 12.2 25,063 466.1 4,164.1 17,448
200 ‐ 400 8,284 1.8 493.0 17.3 221.7 760.1 341.9 7,242 1.3 3,446.4 13.8 1,496.6 63.6 27.6 15,526 556.6 4,206.5 12,550
400 ‐ 800 4,268 0.9 392.5 13.8 421.0 662.0 710.1 4,072 0.7 3,442.2 13.8 2,997.6 57.5 50.1 8,340 450.0 4,104.2 6,959
800 ‐ 1,600 936 0.2 165.9 5.8 820.5 272.3 1,346.9 1,556 0.3 2,430.9 9.7 6,115.1 24.1 60.7 2,492 190.0 2,703.2 2,001
1,600 ‐ 3,200 172 0.0 84.8 3.0 1,870.9 97.3 2,145.5 326 0.1 895.4 3.6 11,619.2 5.8 74.7 498 90.6 992.6 298
3,200 ‐ 6,400 67 0.0 84.6 3.0 3,814.2 92.2 4,155.6 72 0.0 532.4 2.1 25,879.6 4.1 197.6 139 88.7 624.6 30
6,400 ‐ 12,800 54 0.0 131.2 4.6 7,468.2 154.3 8,784.1 27 0.0 392.1 1.6 48,260.7 5.0 618.9 81 136.2 546.4 5
> 12,800 21 0.0 96.7 3.4 15,429.6 111.1 17,728.4 2 0.0 59.8 0.2 81,979.4 0.0 5.8 23 96.7 171.0 0
Total 466,824 100.0 2,851.1 100.0 17.6 3,675.1 22.7 576,007 100.0 24,963.7 100.0 121.3 333.6 1.6 1,042,831 3,184.7 28,638.8 98,834
Notes:
1) Source: State administrative oil & natural gas data thru DrillingInfo.
2) The total volumes shown in the distribution tables may not exactly agree with other related data, including other EIA sources. Major reasons for differences include: the timing of updates from state and commercial sources,
the summed production of available well‐level production data versus state‐level aggregations of production, and how a well is defined and which entities are counted and summed.
3) Wells counted for this report include sidetracks, completions, re‐completions and leases, this includes all oil and/or gas producing 'entities' available in DrillingInfo database.
4) For late reporting states the last year of available data is repeated for missing years (TN 2012 used for 2013‐16, KY 2013 used for 2014‐16 and MO 2014 for 2015‐16). All years are missing for IL and IN.
5) To be consistent between states a GOR of 6,000 (cf/bbl) for each years production was used to define oil versus gas wells. If the GOR was less (greater) than 6,000 (cf/bbl) the well was classed an oil (gas) well.
6) To determine production rate brackets for the first and last year of a wells life the annual production was divided
by the number of days in the productive months. For other years the annual production was divided by 365 or 366 days.
7) Gas volumes have been converted from the various state pressure bases to the Federal base (14.73 psia).
Data available as of November 2017.
Oil wells Gas wells Total wells
U.S. Energy Information Administration | The Distribution of U.S. Oil and Natural Gas Wells by Production Rate B15

December 2017
Table B16. United States oil and gas well summary statistics, 2015
Annual Annual Annual Annual Annual Annual
oil Oil rate gas Gas rate gas Gas rate oil Oil rate oil gas Horizontal
Prod. rate bracket # of oil % of oil prod. % of oil per Well prod. per well # of gas % of gas prod. % of gas per well prod. per well # of total prod. prod. well
(BOE/day) wells wells (MMbbl) prod. (bbl/day) (Bcf) (Mcf/day) wells wells (Bcf) Prod. (Mcf/Day) (MMbbl) (bbl/Day) wells (MMbbl) (Bcf) count
0 ‐ 1 182,701 39.4 20.3 0.7 0.3 7.7 0.1 166,411 29.1 129.6 0.5 2.2 1.3 0.0 349,112 21.6 137.3 2,656
1 ‐ 2 53,820 11.6 25.7 0.8 1.4 10.8 0.6 68,381 12.0 202.4 0.8 8.3 1.7 0.1 122,201 27.4 213.1 1,643
2 ‐ 4 53,135 11.5 49.5 1.6 2.6 26.7 1.4 75,952 13.3 447.2 1.7 16.4 4.5 0.2 129,087 54.0 473.9 2,916
4 ‐ 6 30,068 6.5 47.0 1.5 4.4 32.0 3.0 46,650 8.2 465.9 1.8 27.8 5.1 0.3 76,718 52.0 497.9 2,617
6 ‐ 8 19,675 4.3 42.9 1.4 6.2 32.0 4.6 32,098 5.6 453.1 1.8 39.1 4.9 0.4 51,773 47.8 485.2 2,538
8 ‐ 10 13,859 3.0 39.0 1.3 7.9 30.5 6.2 23,316 4.1 424.7 1.7 50.5 4.5 0.5 37,175 43.5 455.2 2,423
Subtotal <=10 353,258 76.3 224.5 7.3 1.8 139.7 1.1 412,808 72.2 2,122.9 8.3 14.4 21.9 0.1 766,066 246.3 2,262.7 14,793
10 ‐ 12 10,651 2.3 36.5 1.2 9.7 28.7 7.6 17,775 3.1 395.6 1.5 61.7 4.4 0.7 28,426 40.9 424.3 2,202
12 ‐ 15 12,192 2.6 51.0 1.7 11.8 42.2 9.8 20,310 3.6 553.3 2.2 75.7 5.9 0.8 32,502 56.9 595.4 3,097
Subtotal <=15 376,101 81.2 312.0 10.2 2.4 210.6 1.6 450,893 78.9 3,071.8 12.0 19.1 32.1 0.2 826,994 344.1 3,282.4 20,092
15 ‐ 20 13,859 3.0 74.1 2.4 15.1 65.5 13.4 22,780 4.0 802.1 3.1 97.6 8.6 1.0 36,639 82.7 867.5 4,982
20 ‐ 25 9,375 2.0 63.7 2.1 19.2 62.0 18.7 15,087 2.6 684.5 2.7 125.7 7.6 1.4 24,462 71.3 746.5 4,646
25 ‐ 30 6,690 1.4 55.5 1.8 23.5 55.3 23.4 10,657 1.9 589.4 2.3 153.6 6.7 1.8 17,347 62.3 644.8 4,215
30 ‐ 40 9,248 2.0 95.3 3.1 29.3 104.2 32.1 14,086 2.5 980.9 3.8 193.3 12.2 2.4 23,334 107.6 1,085.0 7,436
40 ‐ 50 6,457 1.4 84.6 2.8 37.3 100.9 44.5 9,228 1.6 828.1 3.2 249.2 10.9 3.3 15,685 95.4 929.0 6,664
50 ‐ 100 16,445 3.6 330.8 10.8 57.6 450.8 78.5 22,672 4.0 3,174.4 12.4 389.8 47.5 5.8 39,117 378.3 3,625.2 22,735
Subtotal <=100 438,175 94.6 1,016.1 33.2 6.6 1,049.3 6.8 545,403 95.4 10,131.2 39.4 52.0 125.6 0.6 983,578 1,141.7 11,180.4 70,770
100 ‐ 200 11,715 2.5 447.9 14.7 112.3 667.6 167.4 13,145 2.3 3,458.8 13.5 746.7 65.4 14.1 24,860 513.3 4,126.5 18,663
200 ‐ 400 7,771 1.7 515.5 16.9 218.0 868.5 367.3 6,784 1.2 3,368.4 13.1 1,484.6 70.9 31.2 14,555 586.4 4,236.9 11,907
400 ‐ 800 4,226 0.9 443.5 14.5 410.5 845.1 782.1 3,984 0.7 3,622.8 14.1 2,997.6 68.4 56.6 8,210 511.9 4,467.8 6,924
800 ‐ 1,600 1,099 0.2 196.7 6.4 793.0 360.7 1,454.1 1,856 0.3 3,095.0 12.1 6,120.5 27.4 54.2 2,955 224.1 3,455.7 2,463
1,600 ‐ 3,200 156 0.0 76.2 2.5 1,824.6 84.2 2,015.4 355 0.1 1,060.1 4.1 11,684.4 6.2 68.2 511 82.4 1,144.3 339
3,200 ‐ 6,400 66 0.0 74.7 2.4 3,672.8 91.2 4,485.1 62 0.0 498.5 1.9 25,239.1 4.4 221.4 128 79.0 589.7 18
6,400 ‐ 12,800 70 0.0 163.2 5.3 7,396.2 192.1 8,704.9 21 0.0 376.5 1.5 50,094.6 2.1 285.3 91 165.3 568.6 0
> 12,800 27 0.0 124.6 4.1 13,742.4 155.6 17,158.5 2 0.0 79.4 0.3 136,666.4 0.6 972.8 29 125.2 235.0 0
Total 463,305 100.0 3,058.5 100.0 18.9 4,314.2 26.7 571,612 100.0 25,690.6 100.0 126.1 370.9 1.8 1,034,917 3,429.4 30,004.9 111,084
Notes:
1) Source: State administrative oil & natural gas data thru DrillingInfo.
2) The total volumes shown in the distribution tables may not exactly agree with other related data, including other EIA sources. Major reasons for differences include: the timing of updates from state and commercial sources,
the summed production of available well‐level production data versus state‐level aggregations of production, and how a well is defined and which entities are counted and summed.
3) Wells counted for this report include sidetracks, completions, re‐completions and leases, this includes all oil and/or gas producing 'entities' available in DrillingInfo database.
4) For late reporting states the last year of available data is repeated for missing years (TN 2012 used for 2013‐16, KY 2013 used for 2014‐16 and MO 2014 for 2015‐16). All years are missing for IL and IN.
5) To be consistent between states a GOR of 6,000 (cf/bbl) for each years production was used to define oil versus gas wells. If the GOR was less (greater) than 6,000 (cf/bbl) the well was classed an oil (gas) well.
6) To determine production rate brackets for the first and last year of a wells life the annual production was divided
by the number of days in the productive months. For other years the annual production was divided by 365 or 366 days.
7) Gas volumes have been converted from the various state pressure bases to the Federal base (14.73 psia).
Data available as of November 2017.
Oil wells Gas wells Total wells
U.S. Energy Information Administration | The Distribution of U.S. Oil and Natural Gas Wells by Production Rate B16

December 2017
Table B17. United States oil and gas well summary statistics, 2016
Annual Annual Annual Annual Annual Annual
oil Oil rate gas Gas rate gas Gas rate oil Oil rate oil gas Horizontal
Prod. rate bracket # of oil % of oil prod. % of oil per Well prod. per well # of gas % of gas prod. % of gas per well prod. per well # of total prod. prod. well
(BOE/day) wells wells (MMbbl) prod. (bbl/day) (Bcf) (Mcf/day) wells wells (Bcf) Prod. (Mcf/Day) (MMbbl) (bbl/Day) wells (MMbbl) (Bcf) count
0 ‐ 1 176,507 39.6 18.8 0.7 0.3 7.0 0.1 169,811 30.1 125.8 0.5 2.2 1.1 0.0 346,318 19.9 132.8 2,948
1 ‐ 2 51,431 11.5 23.6 0.8 1.4 9.9 0.6 65,006 11.5 188.0 0.7 8.3 1.5 0.1 116,437 25.0 197.9 1,731
2 ‐ 4 51,517 11.6 46.9 1.6 2.6 25.5 1.4 71,606 12.7 408.1 1.6 16.5 3.9 0.2 123,123 50.8 433.6 2,962
4 ‐ 6 28,999 6.5 44.2 1.6 4.4 31.2 3.1 44,800 7.9 430.1 1.7 27.7 4.7 0.3 73,799 48.9 461.3 2,811
6 ‐ 8 18,578 4.2 39.9 1.4 6.2 30.7 4.7 30,823 5.5 414.9 1.6 39.0 4.7 0.4 49,401 44.6 445.6 2,718
8 ‐ 10 13,469 3.0 37.1 1.3 7.9 30.9 6.5 22,411 4.0 386.8 1.5 50.2 4.4 0.6 35,880 41.6 417.7 2,561
Subtotal <=10 340,501 76.4 210.5 7.4 1.8 135.3 1.2 404,457 71.6 1,953.7 7.6 14.1 20.3 0.1 744,958 230.8 2,089.0 15,731
10 ‐ 12 10,092 2.3 34.0 1.2 9.6 28.8 8.2 17,247 3.1 363.6 1.4 61.4 4.3 0.7 27,339 38.2 392.5 2,360
12 ‐ 15 11,793 2.7 48.4 1.7 11.7 42.1 10.2 19,706 3.5 510.2 2.0 75.4 5.8 0.9 31,499 54.2 552.3 3,495
Subtotal <=15 362,386 81.3 292.9 10.3 2.4 206.2 1.7 441,410 78.2 2,827.5 11.1 18.7 30.4 0.2 803,796 323.3 3,033.7 21,586
15 ‐ 20 13,333 3.0 70.2 2.5 15.0 63.6 13.6 22,580 4.0 747.6 2.9 97.1 8.7 1.1 35,913 78.9 811.2 5,519
20 ‐ 25 9,194 2.1 61.6 2.2 19.2 60.6 18.9 15,256 2.7 648.9 2.5 125.0 7.8 1.5 24,450 69.4 709.6 5,323
25 ‐ 30 6,600 1.5 53.7 1.9 23.3 57.5 24.9 10,858 1.9 561.9 2.2 152.6 7.2 1.9 17,458 60.8 619.4 4,852
30 ‐ 40 9,480 2.1 95.8 3.4 29.0 112.3 34.0 14,717 2.6 956.6 3.7 192.8 12.4 2.5 24,197 108.2 1,068.9 9,088
40 ‐ 50 6,618 1.5 84.9 3.0 36.8 110.9 48.0 9,876 1.8 825.8 3.2 247.0 11.8 3.5 16,494 96.7 936.7 7,970
50 ‐ 100 16,963 3.8 337.3 11.8 57.2 488.5 82.9 24,036 4.3 3,135.8 12.3 382.8 52.1 6.4 40,999 389.4 3,624.2 25,841
Subtotal <=100 424,574 95.3 996.3 34.9 7.0 1,099.5 7.7 538,733 95.4 9,704.2 38.0 52.6 130.4 0.7 963,307 1,126.7 10,803.7 80,179
100 ‐ 200 10,309 2.3 386.3 13.5 109.1 623.7 176.1 12,779 2.3 3,164.7 12.4 735.2 69.0 16.0 23,088 455.3 3,788.4 17,323
200 ‐ 400 5,757 1.3 387.4 13.6 213.4 704.7 388.2 6,936 1.2 3,402.2 13.3 1,487.5 72.6 31.7 12,693 460.0 4,106.9 10,146
400 ‐ 800 3,560 0.8 395.1 13.8 413.4 765.4 800.7 4,003 0.7 3,871.1 15.1 3,021.6 58.0 45.3 7,563 453.2 4,636.4 6,427
800 ‐ 1,600 1,088 0.2 197.4 6.9 799.6 363.8 1,473.8 1,688 0.3 3,096.6 12.1 6,260.7 25.5 51.5 2,776 222.8 3,460.5 2,310
1,600 ‐ 3,200 205 0.1 85.7 3.0 1,816.5 103.1 2,185.7 518 0.1 1,393.4 5.5 12,159.3 6.3 55.1 723 92.0 1,496.5 562
3,200 ‐ 6,400 80 0.0 102.2 3.6 3,937.3 114.9 4,425.5 78 0.0 451.6 1.8 24,637.6 4.4 240.0 158 106.6 566.4 45
6,400 ‐ 12,800 74 0.0 184.1 6.5 7,778.7 210.9 8,907.9 29 0.0 380.0 1.5 47,923.8 2.9 368.2 103 187.1 590.9 8
> 12,800 27 0.0 119.8 4.2 13,352.4 132.1 14,728.7 3 0.0 108.2 0.4 141,859.0 0.7 861.4 30 120.4 240.4 1
Total 445,674 100.0 2,854.4 100.0 19.0 4,118.1 27.4 564,767 100.0 25,572.1 100.0 132.5 369.7 1.9 1,010,441 3,224.2 29,690.1 117,001
Notes:
1) Source: State administrative oil & natural gas data thru DrillingInfo.
2) The total volumes shown in the distribution tables may not exactly agree with other related data, including other EIA sources. Major reasons for differences include: the timing of updates from state and commercial sources,
the summed production of available well‐level production data versus state‐level aggregations of production, and how a well is defined and which entities are counted and summed.
3) Wells counted for this report include sidetracks, completions, re‐completions and leases, this includes all oil and/or gas producing 'entities' available in DrillingInfo database.
4) For late reporting states the last year of available data is repeated for missing years (TN 2012 used for 2013‐16, KY 2013 used for 2014‐16 and MO 2014 for 2015‐16). All years are missing for IL and IN.
5) To be consistent between states a GOR of 6,000 (cf/bbl) for each years production was used to define oil versus gas wells. If the GOR was less (greater) than 6,000 (cf/bbl) the well was classed an oil (gas) well.
6) To determine production rate brackets for the first and last year of a wells life the annual production was divided
by the number of days in the productive months. For other years the annual production was divided by 365 or 366 days.
7) Gas volumes have been converted from the various state pressure bases to the Federal base (14.73 psia).
Data available as of November 2017.
Oil wells Gas wells Total wells
U.S. Energy Information Administration | The Distribution of U.S. Oil and Natural Gas Wells by Production Rate B17

December 2017
Table B18. Alaska oil and gas well summary statistics, 2016
Annual Annual Annual Annual Annual Annual
oil Oil rate gas Gas rate gas Gas rate oil Oil rate oil gas Horizontal
Prod. rate bracket # of oil % of oil prod. % of oil per Well prod. per well # of gas % of gas prod. % of gas per well prod. per well # of total prod. prod. well
(BOE/day) wells wells (MMbbl) prod. (bbl/day) (Bcf) (Mcf/day) wells wells (Bcf) Prod. (Mcf/Day) (MMbbl) (bbl/Day) wells (MMbbl) (Bcf) count
0 ‐ 1 10 0.5 0.0 0.0 0.3 0.0 0.0 17 5.0 0.0 0.0 2.2 0.0 0.0 27 0.0 0.0 0
1 ‐ 2 6 0.3 0.0 0.0 1.2 0.0 2.3 3 0.9 0.0 0.0 10.9 0.0 0.0 9 0.0 0.0 0
2 ‐ 4 10 0.5 0.0 0.0 2.8 0.0 2.5 9 2.7 0.0 0.0 17.4 0.0 0.4 19 0.0 0.0 0
4 ‐ 6 11 0.5 0.0 0.0 4.0 0.0 5.9 7 2.1 0.1 0.0 27.4 0.0 0.3 18 0.0 0.1 1
6 ‐ 8 12 0.6 0.0 0.0 5.8 0.0 6.6 3 0.9 0.0 0.0 39.7 0.0 0.5 15 0.0 0.1 0
8 ‐ 10 11 0.5 0.0 0.0 7.4 0.0 7.0 2 0.6 0.0 0.0 49.6 0.0 0.0 13 0.0 0.0 0
Subtotal <=10 60 2.9 0.1 0.0 4.3 0.1 4.8 41 12.1 0.2 0.1 16.4 0.0 0.2 101 0.1 0.3 1
10 ‐ 12 16 0.8 0.1 0.0 10.0 0.0 7.1 0 0.0 0.0 0.0 0.0 0.0 0.0 16 0.1 0.0 0
12 ‐ 15 21 1.0 0.1 0.0 10.8 0.1 15.0 7 2.1 0.2 0.0 77.7 0.0 0.7 28 0.1 0.2 0
Subtotal <=15 97 4.6 0.2 0.1 6.8 0.2 7.4 48 14.2 0.3 0.1 25.5 0.0 0.3 145 0.2 0.5 1
15 ‐ 20 29 1.4 0.1 0.1 14.8 0.1 14.6 8 2.4 0.2 0.1 90.6 0.0 2.3 37 0.2 0.4 0
20 ‐ 25 21 1.0 0.1 0.1 20.5 0.1 13.2 6 1.8 0.2 0.1 116.7 0.0 2.8 27 0.1 0.3 0
25 ‐ 30 28 1.3 0.2 0.1 24.3 0.2 20.9 7 2.1 0.2 0.1 127.5 0.0 5.3 35 0.2 0.4 0
30 ‐ 40 52 2.5 0.5 0.3 30.7 0.4 21.4 18 5.3 1.2 0.3 206.7 0.0 1.4 70 0.5 1.6 0
40 ‐ 50 67 3.2 0.9 0.5 40.5 0.6 27.1 8 2.4 0.7 0.2 243.1 0.0 2.7 75 0.9 1.3 0
50 ‐ 100 312 14.9 7.3 4.3 71.0 3.5 34.4 46 13.6 6.2 1.7 415.3 0.1 4.3 358 7.4 9.7 4
Subtotal <=100 606 29.0 9.4 5.5 48.6 5.1 26.4 141 41.6 9.1 2.5 210.8 0.1 2.4 747 9.5 14.2 5
100 ‐ 200 506 24.2 22.8 13.2 131.3 13.7 78.8 47 13.9 13.3 3.6 826.6 0.1 6.6 553 22.9 26.9 1
200 ‐ 400 491 23.5 41.3 24.0 247.2 40.0 239.5 66 19.5 32.9 8.9 1,476.1 0.7 32.2 557 42.0 73.0 2
400 ‐ 800 342 16.4 50.9 29.6 435.6 87.6 749.2 36 10.6 33.4 9.0 2,694.4 1.2 99.0 378 52.2 121.0 5
800 ‐ 1,600 127 6.1 33.9 19.7 798.8 63.9 1,504.6 23 6.8 47.1 12.7 5,786.7 1.1 135.0 150 35.0 111.1 1
1,600 ‐ 3,200 19 0.9 10.3 6.0 1,938.8 10.0 1,891.0 10 3.0 33.2 9.0 10,581.3 1.4 448.0 29 11.7 43.3 0
3,200 ‐ 6,400 0 0.0 0.0 0.0 0.0 0.0 0.0 7 2.1 60.5 16.4 28,769.6 0.6 277.7 7 0.6 60.5 0
6,400 ‐ 12,800 1 0.1 3.4 2.0 9,374.6 1.5 4,143.7 9 2.7 140.5 38.0 44,286.3 1.8 569.1 10 5.2 142.0 0
> 12,800 0 0.0 0.0 0.0 0.0 0.0 0.0 0 0.0 0.0 0.0 0.0 0.0 0.0 0 0.0 0.0 0
Total 2,092 100.0 172.1 100.0 246.1 221.9 317.3 339 100.0 370.1 100.0 3,351.9 7.1 63.9 2,431 179.2 592.0 14
Notes:
1) Source: State administrative oil & natural gas data thru DrillingInfo.
2) The total volumes shown in the distribution tables may not exactly agree with other related data, including other EIA sources. Major reasons for differences include: the timing of updates from state and commercial sources,
the summed production of available well‐level production data versus state‐level aggregations of production, and how a well is defined and which entities are counted and summed.
3) Wells counted for this report include sidetracks, completions, re‐completions and leases, this includes all oil and/or gas producing 'entities' available in DrillingInfo database.
4) For late reporting states the last year of available data is repeated for missing years (TN 2012 used for 2013‐16, KY 2013 used for 2014‐16 and MO 2014 for 2015‐16). All years are missing for IL and IN.
5) To be consistent between states a GOR of 6,000 (cf/bbl) for each years production was used to define oil versus gas wells. If the GOR was less (greater) than 6,000 (cf/bbl) the well was classed an oil (gas) well.
6) To determine production rate brackets for the first and last year of a wells life the annual production was divided
by the number of days in the productive months. For other years the annual production was divided by 365 or 366 days.
7) Gas volumes have been converted from the various state pressure bases to the Federal base (14.73 psia).
Data available as of November 2017.
Oil wells Gas wells Total wells
U.S. Energy Information Administration | The Distribution of U.S. Oil and Natural Gas Wells by Production Rate B18

December 2017
Table B19. Alabama oil and gas well summary statistics, 2016
Annual Annual Annual Annual Annual Annual
oil Oil rate gas Gas rate gas Gas rate oil Oil rate oil gas Horizontal
Prod. rate bracket # of oil % of oil prod. % of oil per Well prod. per well # of gas % of gas prod. % of gas per well prod. per well # of total prod. prod. well
(BOE/day) wells wells (MMbbl) prod. (bbl/day) (Bcf) (Mcf/day) wells wells (Bcf) Prod. (Mcf/Day) (MMbbl) (bbl/Day) wells (MMbbl) (Bcf) count
0 ‐ 1 43 7.8 0.0 0.1 0.3 0.0 0.1 497 8.3 0.4 0.3 3.0 0.0 0.0 540 0.0 0.4 2
1 ‐ 2 28 5.1 0.0 0.2 1.5 0.0 0.9 635 10.6 2.1 1.4 9.3 0.0 0.0 663 0.0 2.1 0
2 ‐ 4 60 10.8 0.0 0.7 2.9 0.0 0.5 1,526 25.5 9.9 6.4 17.9 0.0 0.0 1,586 0.0 9.9 0
4 ‐ 6 62 11.2 0.1 1.3 4.8 0.0 0.9 1,284 21.5 13.8 8.8 29.5 0.0 0.0 1,346 0.1 13.8 0
6 ‐ 8 40 7.2 0.1 1.3 6.9 0.0 1.1 835 14.0 12.6 8.1 41.4 0.0 0.0 875 0.1 12.6 3
8 ‐ 10 29 5.2 0.1 1.3 8.8 0.0 1.8 507 8.5 9.9 6.3 53.3 0.0 0.0 536 0.1 9.9 0
Subtotal <=10 262 47.3 0.3 4.7 4.2 0.1 0.8 5,284 88.4 48.7 31.2 25.9 0.0 0.0 5,546 0.3 48.7 5
10 ‐ 12 21 3.8 0.1 1.1 10.3 0.0 5.4 265 4.4 6.3 4.0 65.0 0.0 0.0 286 0.1 6.3 2
12 ‐ 15 26 4.7 0.1 1.6 12.9 0.0 2.8 204 3.4 5.8 3.7 78.4 0.0 0.0 230 0.1 5.9 1
Subtotal <=15 309 55.8 0.5 7.4 5.4 0.1 1.3 5,753 96.2 60.8 39.0 29.6 0.0 0.0 6,062 0.5 60.9 8
15 ‐ 20 31 5.6 0.2 2.2 16.0 0.1 7.8 96 1.6 3.4 2.2 100.5 0.0 0.1 127 0.2 3.5 2
20 ‐ 25 33 6.0 0.2 3.4 20.2 0.1 12.0 25 0.4 1.1 0.7 130.2 0.0 0.1 58 0.2 1.3 4
25 ‐ 30 24 4.3 0.2 3.0 24.4 0.2 21.0 9 0.2 0.5 0.3 156.8 0.0 0.8 33 0.2 0.7 0
30 ‐ 40 26 4.7 0.3 3.6 31.7 0.2 22.1 9 0.2 0.6 0.4 183.2 0.0 2.2 35 0.3 0.8 1
40 ‐ 50 17 3.1 0.2 2.8 39.8 0.1 28.1 6 0.1 0.6 0.4 257.4 0.0 3.1 23 0.2 0.7 1
50 ‐ 100 50 9.0 1.0 14.0 57.5 1.4 80.0 21 0.4 1.7 1.1 339.6 0.1 13.3 71 1.0 3.0 3
Subtotal <=100 490 88.5 2.5 36.5 16.4 2.2 14.1 5,919 99.0 68.7 44.1 32.6 0.1 0.0 6,409 2.6 70.9 19
100 ‐ 200 33 6.0 1.4 19.4 118.5 1.7 144.9 15 0.3 2.6 1.7 646.2 0.1 27.8 48 1.5 4.3 2
200 ‐ 400 22 4.0 1.6 23.3 208.7 2.9 373.0 13 0.2 5.6 3.6 1,396.7 0.3 69.1 35 1.9 8.5 1
400 ‐ 800 8 1.4 1.0 13.9 372.1 1.5 593.4 13 0.2 13.3 8.5 2,787.0 0.4 79.9 21 1.3 14.8 1
800 ‐ 1,600 1 0.2 0.5 7.0 1,319.7 0.6 1,661.6 14 0.2 36.4 23.4 7,110.8 0.3 54.2 15 0.8 37.0 0
1,600 ‐ 3,200 0 0.0 0.0 0.0 0.0 0.0 0.0 5 0.1 21.7 13.9 11,873.2 0.0 3.9 5 0.0 21.7 0
3,200 ‐ 6,400 0 0.0 0.0 0.0 0.0 0.0 0.0 1 0.0 7.6 4.9 20,696.9 0.0 8.7 1 0.0 7.6 0
6,400 ‐ 12,800 0 0.0 0.0 0.0 0.0 0.0 0.0 0 0.0 0.0 0.0 0.0 0.0 0.0 0 0.0 0.0 0
> 12,800 0 0.0 0.0 0.0 0.0 0.0 0.0 0 0.0 0.0 0.0 0.0 0.0 0.0 0 0.0 0.0 0
Total 554 100.0 7.0 100.0 39.4 8.9 50.2 5,980 100.0 155.9 100.0 73.3 1.2 0.5 6,534 8.1 164.8 23
Notes:
1) Source: State administrative oil & natural gas data thru DrillingInfo.
2) The total volumes shown in the distribution tables may not exactly agree with other related data, including other EIA sources. Major reasons for differences include: the timing of updates from state and commercial sources,
the summed production of available well‐level production data versus state‐level aggregations of production, and how a well is defined and which entities are counted and summed.
3) Wells counted for this report include sidetracks, completions, re‐completions and leases, this includes all oil and/or gas producing 'entities' available in DrillingInfo database.
4) For late reporting states the last year of available data is repeated for missing years (TN 2012 used for 2013‐16, KY 2013 used for 2014‐16 and MO 2014 for 2015‐16). All years are missing for IL and IN.
5) To be consistent between states a GOR of 6,000 (cf/bbl) for each years production was used to define oil versus gas wells. If the GOR was less (greater) than 6,000 (cf/bbl) the well was classed an oil (gas) well.
6) To determine production rate brackets for the first and last year of a wells life the annual production was divided
by the number of days in the productive months. For other years the annual production was divided by 365 or 366 days.
7) Gas volumes have been converted from the various state pressure bases to the Federal base (14.73 psia).
Data available as of November 2017.
Oil wells Gas wells Total wells
U.S. Energy Information Administration | The Distribution of U.S. Oil and Natural Gas Wells by Production Rate B19

December 2017
Table B20. Arkansas oil and gas well summary statistics, 2016
Annual Annual Annual Annual Annual Annual
oil Oil rate gas Gas rate gas Gas rate oil Oil rate oil gas Horizontal
Prod. rate bracket # of oil % of oil prod. % of oil per Well prod. per well # of gas % of gas prod. % of gas per well prod. per well # of total prod. prod. well
(BOE/day) wells wells (MMbbl) prod. (bbl/day) (Bcf) (Mcf/day) wells wells (Bcf) Prod. (Mcf/Day) (MMbbl) (bbl/Day) wells (MMbbl) (Bcf) count
0 ‐ 1 378 20.2 0.1 1.1 0.5 0.0 0.0 363 3.7 0.4 0.1 3.5 0.0 0.0 741 0.1 0.4 22
1 ‐ 2 279 14.9 0.1 2.5 1.5 0.0 0.0 443 4.5 1.4 0.2 9.1 0.0 0.0 722 0.1 1.4 14
2 ‐ 4 353 18.8 0.4 6.6 2.9 0.0 0.1 884 9.0 5.6 0.7 17.9 0.0 0.0 1,237 0.4 5.6 36
4 ‐ 6 256 13.7 0.4 8.2 4.8 0.0 0.4 726 7.4 7.7 0.9 29.5 0.0 0.0 982 0.4 7.7 32
6 ‐ 8 143 7.6 0.4 6.7 6.9 0.0 0.8 508 5.2 7.5 0.9 41.7 0.0 0.0 651 0.4 7.6 60
8 ‐ 10 104 5.6 0.3 5.9 8.5 0.1 2.2 382 3.9 7.2 0.9 53.4 0.0 0.1 486 0.3 7.3 64
Subtotal <=10 1,513 80.7 1.6 31.0 3.2 0.2 0.3 3,306 33.8 29.9 3.6 25.7 0.0 0.0 4,819 1.7 30.0 228
10 ‐ 12 69 3.7 0.3 4.9 10.4 0.1 3.4 320 3.3 7.4 0.9 65.2 0.0 0.1 389 0.3 7.5 61
12 ‐ 15 63 3.4 0.3 5.5 12.6 0.1 5.9 389 4.0 11.2 1.4 79.7 0.0 0.1 452 0.3 11.3 139
Subtotal <=15 1,645 87.8 2.2 41.3 3.9 0.4 0.7 4,015 41.0 48.5 5.9 34.2 0.1 0.0 5,660 2.2 48.9 428
15 ‐ 20 79 4.2 0.4 8.4 15.6 0.3 10.4 565 5.8 21.0 2.6 103.0 0.0 0.2 644 0.5 21.3 297
20 ‐ 25 50 2.7 0.3 6.4 19.5 0.3 15.0 473 4.8 22.9 2.8 133.7 0.0 0.2 523 0.4 23.1 343
25 ‐ 30 30 1.6 0.3 4.9 23.6 0.3 24.3 434 4.4 25.6 3.1 163.4 0.0 0.3 464 0.3 25.9 341
30 ‐ 40 23 1.2 0.3 4.7 29.9 0.2 22.0 773 7.9 58.9 7.2 210.1 0.0 0.1 796 0.3 59.1 713
40 ‐ 50 13 0.7 0.2 3.3 37.3 0.2 38.7 642 6.6 62.8 7.7 269.1 0.0 0.0 655 0.2 63.0 615
50 ‐ 100 22 1.2 0.5 9.4 61.9 0.1 10.9 2,049 20.9 321.6 39.3 430.2 0.0 0.0 2,071 0.5 321.7 2,008
Subtotal <=100 1,862 99.4 4.2 78.4 6.6 1.7 2.6 8,951 91.4 561.2 68.5 174.9 0.2 0.1 10,813 4.4 562.8 4,745
100 ‐ 200 6 0.3 0.3 5.9 141.7 0.0 20.9 743 7.6 207.6 25.3 765.6 0.0 0.0 749 0.3 207.6 738
200 ‐ 400 2 0.1 0.2 2.9 210.6 0.2 299.3 88 0.9 41.8 5.1 1,539.1 0.0 0.0 90 0.2 42.1 88
400 ‐ 800 3 0.2 0.4 7.4 495.2 0.5 590.2 14 0.1 8.5 1.0 2,782.4 0.0 0.0 17 0.4 9.0 14
800 ‐ 1,600 1 0.1 0.3 5.5 795.5 1.7 4,715.2 0 0.0 0.0 0.0 0.0 0.0 0.0 1 0.3 1.7 0
1,600 ‐ 3,200 0 0.0 0.0 0.0 0.0 0.0 0.0 0 0.0 0.0 0.0 0.0 0.0 0.0 0 0.0 0.0 0
3,200 ‐ 6,400 0 0.0 0.0 0.0 0.0 0.0 0.0 0 0.0 0.0 0.0 0.0 0.0 0.0 0 0.0 0.0 0
6,400 ‐ 12,800 0 0.0 0.0 0.0 0.0 0.0 0.0 0 0.0 0.0 0.0 0.0 0.0 0.0 0 0.0 0.0 0
> 12,800 0 0.0 0.0 0.0 0.0 0.0 0.0 0 0.0 0.0 0.0 0.0 0.0 0.0 0 0.0 0.0 0
Total 1,874 100.0 5.3 100.0 8.3 4.1 6.5 9,796 100.0 819.1 100.0 233.3 0.2 0.1 11,670 5.6 823.2 5,585
Notes:
1) Source: State administrative oil & natural gas data thru DrillingInfo.
2) The total volumes shown in the distribution tables may not exactly agree with other related data, including other EIA sources. Major reasons for differences include: the timing of updates from state and commercial sources,
the summed production of available well‐level production data versus state‐level aggregations of production, and how a well is defined and which entities are counted and summed.
3) Wells counted for this report include sidetracks, completions, re‐completions and leases, this includes all oil and/or gas producing 'entities' available in DrillingInfo database.
4) For late reporting states the last year of available data is repeated for missing years (TN 2012 used for 2013‐16, KY 2013 used for 2014‐16 and MO 2014 for 2015‐16). All years are missing for IL and IN.
5) To be consistent between states a GOR of 6,000 (cf/bbl) for each years production was used to define oil versus gas wells. If the GOR was less (greater) than 6,000 (cf/bbl) the well was classed an oil (gas) well.
6) To determine production rate brackets for the first and last year of a wells life the annual production was divided
by the number of days in the productive months. For other years the annual production was divided by 365 or 366 days.
7) Gas volumes have been converted from the various state pressure bases to the Federal base (14.73 psia).
Data available as of November 2017.
Oil wells Gas wells Total wells
U.S. Energy Information Administration | The Distribution of U.S. Oil and Natural Gas Wells by Production Rate B20

December 2017
Table B21. Arizona oil and gas well summary statistics, 2016
Annual Annual Annual Annual Annual Annual
oil Oil rate gas Gas rate gas Gas rate oil Oil rate oil gas Horizontal
Prod. rate bracket # of oil % of oil prod. % of oil per Well prod. per well # of gas % of gas prod. % of gas per well prod. per well # of total prod. prod. well
(BOE/day) wells wells (MMbbl) prod. (bbl/day) (Bcf) (Mcf/day) wells wells (Bcf) Prod. (Mcf/Day) (MMbbl) (bbl/Day) wells (MMbbl) (Bcf) count
0 ‐ 1 8 61.5 0.0 20.4 0.7 0.0 0.0 0 0.0 0.0 0.0 0.0 0.0 0.0 8 0.0 0.0 0
1 ‐ 2 1 7.7 0.0 1.9 1.5 0.0 0.0 0 0.0 0.0 0.0 0.0 0.0 0.0 1 0.0 0.0 0
2 ‐ 4 1 7.7 0.0 5.9 2.1 0.0 0.0 0 0.0 0.0 0.0 0.0 0.0 0.0 1 0.0 0.0 0
4 ‐ 6 2 15.4 0.0 29.0 4.7 0.0 0.0 1 33.3 0.0 22.8 33.4 0.0 0.0 3 0.0 0.0 0
6 ‐ 8 0 0.0 0.0 0.0 0.0 0.0 0.0 0 0.0 0.0 0.0 0.0 0.0 0.0 0 0.0 0.0 0
8 ‐ 10 1 7.7 0.0 42.9 8.7 0.0 0.0 1 33.3 0.0 34.0 49.8 0.0 0.0 2 0.0 0.0 0
Subtotal <=10 13 100.0 0.0 100.0 2.2 0.0 0.0 2 66.7 0.0 56.8 41.6 0.0 0.0 15 0.0 0.0 0
10 ‐ 12 0 0.0 0.0 0.0 0.0 0.0 0.0 1 33.3 0.0 43.2 63.3 0.0 0.0 1 0.0 0.0 0
12 ‐ 15 0 0.0 0.0 0.0 0.0 0.0 0.0 0 0.0 0.0 0.0 0.0 0.0 0.0 0 0.0 0.0 0
Subtotal <=15 13 100.0 0.0 100.0 2.2 0.0 0.0 3 100.0 0.1 100.0 48.8 0.0 0.0 16 0.0 0.1 0
15 ‐ 20 0 0.0 0.0 0.0 0.0 0.0 0.0 0 0.0 0.0 0.0 0.0 0.0 0.0 0 0.0 0.0 0
20 ‐ 25 0 0.0 0.0 0.0 0.0 0.0 0.0 0 0.0 0.0 0.0 0.0 0.0 0.0 0 0.0 0.0 0
25 ‐ 30 0 0.0 0.0 0.0 0.0 0.0 0.0 0 0.0 0.0 0.0 0.0 0.0 0.0 0 0.0 0.0 0
30 ‐ 40 0 0.0 0.0 0.0 0.0 0.0 0.0 0 0.0 0.0 0.0 0.0 0.0 0.0 0 0.0 0.0 0
40 ‐ 50 0 0.0 0.0 0.0 0.0 0.0 0.0 0 0.0 0.0 0.0 0.0 0.0 0.0 0 0.0 0.0 0
50 ‐ 100 0 0.0 0.0 0.0 0.0 0.0 0.0 0 0.0 0.0 0.0 0.0 0.0 0.0 0 0.0 0.0 0
Subtotal <=100 13 100.0 0.0 100.0 2.2 0.0 0.0 3 100.0 0.1 100.0 48.8 0.0 0.0 16 0.0 0.1 0
100 ‐ 200 0 0.0 0.0 0.0 0.0 0.0 0.0 0 0.0 0.0 0.0 0.0 0.0 0.0 0 0.0 0.0 0
200 ‐ 400 0 0.0 0.0 0.0 0.0 0.0 0.0 0 0.0 0.0 0.0 0.0 0.0 0.0 0 0.0 0.0 0
400 ‐ 800 0 0.0 0.0 0.0 0.0 0.0 0.0 0 0.0 0.0 0.0 0.0 0.0 0.0 0 0.0 0.0 0
800 ‐ 1,600 0 0.0 0.0 0.0 0.0 0.0 0.0 0 0.0 0.0 0.0 0.0 0.0 0.0 0 0.0 0.0 0
1,600 ‐ 3,200 0 0.0 0.0 0.0 0.0 0.0 0.0 0 0.0 0.0 0.0 0.0 0.0 0.0 0 0.0 0.0 0
3,200 ‐ 6,400 0 0.0 0.0 0.0 0.0 0.0 0.0 0 0.0 0.0 0.0 0.0 0.0 0.0 0 0.0 0.0 0
6,400 ‐ 12,800 0 0.0 0.0 0.0 0.0 0.0 0.0 0 0.0 0.0 0.0 0.0 0.0 0.0 0 0.0 0.0 0
> 12,800 0 0.0 0.0 0.0 0.0 0.0 0.0 0 0.0 0.0 0.0 0.0 0.0 0.0 0 0.0 0.0 0
Total 13 100.0 0.0 100.0 2.2 0.0 0.0 3 100.0 0.1 100.0 48.8 0.0 0.0 16 0.0 0.1 0
Notes:
1) Source: State administrative oil & natural gas data thru DrillingInfo.
2) The total volumes shown in the distribution tables may not exactly agree with other related data, including other EIA sources. Major reasons for differences include: the timing of updates from state and commercial sources,
the summed production of available well‐level production data versus state‐level aggregations of production, and how a well is defined and which entities are counted and summed.
3) Wells counted for this report include sidetracks, completions, re‐completions and leases, this includes all oil and/or gas producing 'entities' available in DrillingInfo database.
4) For late reporting states the last year of available data is repeated for missing years (TN 2012 used for 2013‐16, KY 2013 used for 2014‐16 and MO 2014 for 2015‐16). All years are missing for IL and IN.
5) To be consistent between states a GOR of 6,000 (cf/bbl) for each years production was used to define oil versus gas wells. If the GOR was less (greater) than 6,000 (cf/bbl) the well was classed an oil (gas) well.
6) To determine production rate brackets for the first and last year of a wells life the annual production was divided
by the number of days in the productive months. For other years the annual production was divided by 365 or 366 days.
7) Gas volumes have been converted from the various state pressure bases to the Federal base (14.73 psia).
Data available as of November 2017.
Oil wells Gas wells Total wells
U.S. Energy Information Administration | The Distribution of U.S. Oil and Natural Gas Wells by Production Rate B21

December 2017
Table B22. California oil and gas well summary statistics, 2016
Annual Annual Annual Annual Annual Annual
oil Oil rate gas Gas rate gas Gas rate oil Oil rate oil gas Horizontal
Prod. rate bracket # of oil % of oil prod. % of oil per Well prod. per well # of gas % of gas prod. % of gas per well prod. per well # of total prod. prod. well
(BOE/day) wells wells (MMbbl) prod. (bbl/day) (Bcf) (Mcf/day) wells wells (Bcf) Prod. (Mcf/Day) (MMbbl) (bbl/Day) wells (MMbbl) (Bcf) count
0 ‐ 1 6,452 13.2 0.9 0.5 0.5 0.1 0.1 506 12.7 0.3 0.2 1.9 0.0 0.0 6,958 0.9 0.4 77
1 ‐ 2 5,386 11.0 2.6 1.4 1.4 0.5 0.3 238 6.0 0.6 0.4 8.0 0.0 0.2 5,624 2.6 1.1 66
2 ‐ 4 7,716 15.8 7.5 4.1 2.8 1.9 0.7 415 10.4 2.1 1.4 15.4 0.1 0.4 8,131 7.6 3.9 166
4 ‐ 6 5,547 11.4 9.1 5.0 4.7 2.7 1.4 352 8.8 3.1 2.2 26.0 0.1 0.6 5,899 9.2 5.9 151
6 ‐ 8 4,194 8.6 9.7 5.3 6.6 3.2 2.2 273 6.9 3.3 2.3 35.2 0.1 1.0 4,467 9.8 6.4 119
8 ‐ 10 3,143 6.4 9.4 5.2 8.5 3.2 2.9 257 6.5 4.0 2.8 45.9 0.1 1.3 3,400 9.5 7.2 100
Subtotal <=10 32,438 66.4 39.1 21.6 3.6 11.6 1.1 2,041 51.2 13.4 9.3 20.4 0.4 0.5 34,479 39.5 25.0 679
10 ‐ 12 2,533 5.2 9.3 5.1 10.4 3.1 3.4 182 4.6 3.5 2.5 55.5 0.1 1.7 2,715 9.4 6.6 99
12 ‐ 15 2,897 5.9 13.0 7.2 12.8 4.4 4.3 235 5.9 5.7 4.0 68.8 0.2 2.0 3,132 13.2 10.1 129
Subtotal <=15 37,868 77.5 61.4 33.8 4.8 19.0 1.5 2,458 61.7 22.7 15.7 28.2 0.6 0.8 40,326 62.0 41.7 907
15 ‐ 20 3,318 6.8 19.1 10.5 16.4 5.8 5.0 298 7.5 9.2 6.4 87.9 0.3 2.8 3,616 19.4 15.0 173
20 ‐ 25 2,117 4.3 15.7 8.6 21.2 4.8 6.5 194 4.9 7.8 5.4 112.2 0.3 3.7 2,311 16.0 12.6 122
25 ‐ 30 1,367 2.8 12.3 6.8 25.9 4.1 8.6 175 4.4 8.5 5.9 139.9 0.2 4.0 1,542 12.6 12.6 84
30 ‐ 40 1,633 3.3 18.4 10.1 32.7 5.6 9.9 242 6.1 15.0 10.4 174.2 0.5 5.9 1,875 18.9 20.6 127
40 ‐ 50 914 1.9 13.3 7.3 42.5 3.9 12.5 145 3.6 11.7 8.1 225.1 0.4 7.2 1,059 13.7 15.6 98
50 ‐ 100 1,280 2.6 26.5 14.6 63.8 7.6 18.2 362 9.1 44.1 30.6 342.4 1.5 11.4 1,642 28.0 51.7 134
Subtotal <=100 48,497 99.3 166.8 91.8 10.2 50.7 3.1 3,874 97.2 119.0 82.4 91.0 3.8 2.9 52,371 170.5 169.7 1,645
100 ‐ 200 306 0.6 10.6 5.9 123.5 2.7 31.7 95 2.4 20.6 14.2 638.4 0.6 19.4 401 11.3 23.3 43
200 ‐ 400 61 0.1 4.1 2.2 245.5 0.9 52.1 9 0.2 2.2 1.5 1,412.9 0.0 11.4 70 4.1 3.0 9
400 ‐ 800 1 0.0 0.2 0.1 493.7 0.0 105.2 4 0.1 2.4 1.6 2,964.2 0.0 5.9 5 0.2 2.4 0
800 ‐ 1,600 0 0.0 0.0 0.0 0.0 0.0 0.0 2 0.1 0.4 0.3 6,661.1 0.0 0.0 2 0.0 0.4 0
1,600 ‐ 3,200 0 0.0 0.0 0.0 0.0 0.0 0.0 0 0.0 0.0 0.0 0.0 0.0 0.0 0 0.0 0.0 0
3,200 ‐ 6,400 0 0.0 0.0 0.0 0.0 0.0 0.0 0 0.0 0.0 0.0 0.0 0.0 0.0 0 0.0 0.0 0
6,400 ‐ 12,800 0 0.0 0.0 0.0 0.0 0.0 0.0 0 0.0 0.0 0.0 0.0 0.0 0.0 0 0.0 0.0 0
> 12,800 0 0.0 0.0 0.0 0.0 0.0 0.0 0 0.0 0.0 0.0 0.0 0.0 0.0 0 0.0 0.0 0
Total 48,865 100.0 181.6 100.0 11.0 54.4 3.3 3,984 100.0 144.5 100.0 107.7 4.4 3.3 52,849 186.1 198.9 1,697
Notes:
1) Source: State administrative oil & natural gas data thru DrillingInfo.
2) The total volumes shown in the distribution tables may not exactly agree with other related data, including other EIA sources. Major reasons for differences include: the timing of updates from state and commercial sources,
the summed production of available well‐level production data versus state‐level aggregations of production, and how a well is defined and which entities are counted and summed.
3) Wells counted for this report include sidetracks, completions, re‐completions and leases, this includes all oil and/or gas producing 'entities' available in DrillingInfo database.
4) For late reporting states the last year of available data is repeated for missing years (TN 2012 used for 2013‐16, KY 2013 used for 2014‐16 and MO 2014 for 2015‐16). All years are missing for IL and IN.
5) To be consistent between states a GOR of 6,000 (cf/bbl) for each years production was used to define oil versus gas wells. If the GOR was less (greater) than 6,000 (cf/bbl) the well was classed an oil (gas) well.
6) To determine production rate brackets for the first and last year of a wells life the annual production was divided
by the number of days in the productive months. For other years the annual production was divided by 365 or 366 days.
7) Gas volumes have been converted from the various state pressure bases to the Federal base (14.73 psia).
Data available as of November 2017.
Oil wells Gas wells Total wells
U.S. Energy Information Administration | The Distribution of U.S. Oil and Natural Gas Wells by Production Rate B22

December 2017
Table B23. Colorado oil and gas well summary statistics, 2016
Annual Annual Annual Annual Annual Annual
oil Oil rate gas Gas rate gas Gas rate oil Oil rate oil gas Horizontal
Prod. rate bracket # of oil % of oil prod. % of oil per Well prod. per well # of gas % of gas prod. % of gas per well prod. per well # of total prod. prod. well
(BOE/day) wells wells (MMbbl) prod. (bbl/day) (Bcf) (Mcf/day) wells wells (Bcf) Prod. (Mcf/Day) (MMbbl) (bbl/Day) wells (MMbbl) (Bcf) count
0 ‐ 1 2,161 24.3 0.2 0.2 0.3 0.3 0.5 6,794 14.8 5.3 0.4 2.5 0.1 0.0 8,955 0.3 5.6 38
1 ‐ 2 1,001 11.3 0.4 0.5 1.1 0.7 2.2 4,665 10.2 12.3 0.8 7.9 0.3 0.2 5,666 0.6 13.0 15
2 ‐ 4 1,157 13.0 0.8 1.1 2.2 1.8 4.6 7,342 16.0 37.7 2.6 15.2 1.0 0.4 8,499 1.8 39.5 34
4 ‐ 6 626 7.0 0.7 1.0 3.5 1.8 8.6 4,846 10.6 41.6 2.9 25.4 1.2 0.7 5,472 1.9 43.5 45
6 ‐ 8 398 4.5 0.7 0.9 5.2 1.4 10.5 3,181 7.0 39.8 2.7 36.5 1.0 0.9 3,579 1.7 41.3 50
8 ‐ 10 228 2.6 0.5 0.7 6.9 0.9 11.9 2,450 5.4 41.7 2.9 49.0 0.7 0.8 2,678 1.2 42.7 45
Subtotal <=10 5,571 62.6 3.3 4.4 1.9 7.0 4.0 29,278 64.0 178.5 12.2 18.4 4.1 0.4 34,849 7.4 185.5 227
10 ‐ 12 147 1.7 0.4 0.6 8.5 0.7 14.9 2,072 4.5 45.0 3.1 61.9 0.5 0.7 2,219 0.9 45.7 43
12 ‐ 15 177 2.0 0.7 0.9 11.0 0.9 14.4 2,560 5.6 69.2 4.7 77.0 0.5 0.6 2,737 1.2 70.0 73
Subtotal <=15 5,895 66.3 4.4 5.9 2.4 8.6 4.6 33,910 74.1 292.6 20.0 25.8 5.1 0.5 39,805 9.5 301.2 343
15 ‐ 20 237 2.7 1.2 1.6 14.2 1.6 19.7 2,781 6.1 97.7 6.7 100.2 0.6 0.6 3,018 1.8 99.4 130
20 ‐ 25 214 2.4 1.4 1.8 18.2 2.1 27.8 1,668 3.6 75.1 5.2 129.0 0.5 0.8 1,882 1.8 77.2 166
25 ‐ 30 198 2.2 1.5 1.9 21.0 2.7 38.6 1,067 2.3 58.4 4.0 158.5 0.3 0.9 1,265 1.8 61.1 169
30 ‐ 40 353 4.0 3.1 4.1 24.8 7.5 59.9 1,345 2.9 91.5 6.3 197.6 0.8 1.7 1,698 3.9 99.0 386
40 ‐ 50 243 2.7 2.7 3.6 31.4 6.9 80.6 856 1.9 74.2 5.1 249.0 0.9 3.0 1,099 3.6 81.1 325
50 ‐ 100 629 7.1 10.1 13.4 46.8 30.5 140.4 2,376 5.2 310.5 21.3 374.4 6.4 7.7 3,005 16.5 341.0 1,275
Subtotal <=100 7,769 87.3 24.4 32.3 9.7 59.9 23.9 44,003 96.1 1,000.1 68.5 67.3 14.5 1.0 51,772 38.9 1,060.0 2,794
100 ‐ 200 395 4.4 12.1 16.0 93.2 37.6 290.2 1,255 2.7 264.3 18.1 647.3 12.9 31.6 1,650 25.0 301.9 1,150
200 ‐ 400 497 5.6 22.7 30.0 185.8 67.2 549.7 418 0.9 138.9 9.5 1,147.8 8.6 71.1 915 31.3 206.1 799
400 ‐ 800 221 2.5 15.7 20.7 327.4 53.4 1,117.6 85 0.2 44.1 3.0 1,969.0 3.7 167.1 306 19.4 97.5 300
800 ‐ 1,600 14 0.2 0.8 1.1 634.9 2.1 1,686.4 9 0.0 12.8 0.9 5,902.8 0.1 44.5 23 0.9 14.9 21
1,600 ‐ 3,200 0 0.0 0.0 0.0 0.0 0.0 0.0 0 0.0 0.0 0.0 0.0 0.0 0.0 0 0.0 0.0 0
3,200 ‐ 6,400 0 0.0 0.0 0.0 0.0 0.0 0.0 0 0.0 0.0 0.0 0.0 0.0 0.0 0 0.0 0.0 0
6,400 ‐ 12,800 0 0.0 0.0 0.0 0.0 0.0 0.0 0 0.0 0.0 0.0 0.0 0.0 0.0 0 0.0 0.0 0
> 12,800 0 0.0 0.0 0.0 0.0 0.0 0.0 0 0.0 0.0 0.0 0.0 0.0 0.0 0 0.0 0.0 0
Total 8,896 100.0 75.6 100.0 27.0 220.3 78.6 45,770 100.0 1,460.1 100.0 94.8 39.9 2.6 54,666 115.5 1,680.4 5,064
Notes:
1) Source: State administrative oil & natural gas data thru DrillingInfo.
2) The total volumes shown in the distribution tables may not exactly agree with other related data, including other EIA sources. Major reasons for differences include: the timing of updates from state and commercial sources,
the summed production of available well‐level production data versus state‐level aggregations of production, and how a well is defined and which entities are counted and summed.
3) Wells counted for this report include sidetracks, completions, re‐completions and leases, this includes all oil and/or gas producing 'entities' available in DrillingInfo database.
4) For late reporting states the last year of available data is repeated for missing years (TN 2012 used for 2013‐16, KY 2013 used for 2014‐16 and MO 2014 for 2015‐16). All years are missing for IL and IN.
5) To be consistent between states a GOR of 6,000 (cf/bbl) for each years production was used to define oil versus gas wells. If the GOR was less (greater) than 6,000 (cf/bbl) the well was classed an oil (gas) well.
6) To determine production rate brackets for the first and last year of a wells life the annual production was divided
by the number of days in the productive months. For other years the annual production was divided by 365 or 366 days.
7) Gas volumes have been converted from the various state pressure bases to the Federal base (14.73 psia).
Data available as of November 2017.
Oil wells Gas wells Total wells
U.S. Energy Information Administration | The Distribution of U.S. Oil and Natural Gas Wells by Production Rate B23

December 2017
Table B24. Federal GOM oil and gas well summary statistics, 2016
Annual Annual Annual Annual Annual Annual
oil Oil rate gas Gas rate gas Gas rate oil Oil rate oil gas Horizontal
Prod. rate bracket # of oil % of oil prod. % of oil per Well prod. per well # of gas % of gas prod. % of gas per well prod. per well # of total prod. prod. well
(BOE/day) wells wells (MMbbl) prod. (bbl/day) (Bcf) (Mcf/day) wells wells (Bcf) Prod. (Mcf/Day) (MMbbl) (bbl/Day) wells (MMbbl) (Bcf) count
0 ‐ 1 37 1.3 0.0 0.0 0.3 0.0 0.3 36 3.7 0.0 0.0 2.0 0.0 0.0 73 0.0 0.0 0
1 ‐ 2 19 0.7 0.0 0.0 1.1 0.0 1.6 18 1.8 0.0 0.0 8.0 0.0 0.0 37 0.0 0.0 0
2 ‐ 4 25 0.9 0.0 0.0 2.3 0.0 4.2 46 4.7 0.2 0.0 16.0 0.0 0.4 71 0.0 0.2 0
4 ‐ 6 33 1.1 0.0 0.0 4.1 0.1 6.1 34 3.4 0.2 0.0 27.0 0.0 0.6 67 0.0 0.3 0
6 ‐ 8 28 1.0 0.0 0.0 5.2 0.1 10.4 18 1.8 0.2 0.0 33.2 0.0 1.7 46 0.1 0.3 0
8 ‐ 10 42 1.4 0.1 0.0 7.4 0.1 9.7 29 2.9 0.4 0.1 43.9 0.0 1.4 71 0.1 0.5 0
Subtotal <=10 184 6.3 0.2 0.0 4.0 0.3 6.2 181 18.3 1.0 0.2 22.3 0.0 0.7 365 0.2 1.3 0
10 ‐ 12 34 1.2 0.1 0.0 8.9 0.1 12.7 20 2.0 0.3 0.1 54.3 0.0 1.7 54 0.1 0.5 0
12 ‐ 15 56 1.9 0.2 0.0 10.8 0.3 15.8 21 2.1 0.4 0.1 69.3 0.0 1.6 77 0.2 0.7 0
Subtotal <=15 274 9.4 0.5 0.1 6.3 0.7 9.3 222 22.5 1.7 0.3 30.7 0.1 0.9 496 0.5 2.4 0
15 ‐ 20 104 3.6 0.5 0.1 14.0 0.7 20.8 43 4.4 1.1 0.2 85.7 0.0 3.1 147 0.5 1.8 0
20 ‐ 25 118 4.0 0.7 0.1 18.2 1.0 26.0 37 3.8 1.1 0.2 103.1 0.1 5.2 155 0.8 2.1 0
25 ‐ 30 102 3.5 0.8 0.1 22.5 1.0 30.2 28 2.8 1.0 0.2 129.9 0.0 5.7 130 0.8 2.0 0
30 ‐ 40 227 7.8 2.2 0.4 28.8 2.8 37.3 44 4.5 2.1 0.4 162.6 0.1 7.6 271 2.3 4.9 0
40 ‐ 50 195 6.7 2.5 0.4 37.3 3.2 46.7 39 4.0 2.6 0.5 211.4 0.1 9.6 234 2.6 5.7 0
50 ‐ 100 613 20.9 12.9 2.3 60.2 14.9 69.6 122 12.4 13.0 2.3 360.1 0.4 11.1 735 13.3 27.9 0
Subtotal <=100 1,633 55.8 20.0 3.5 37.0 24.3 44.9 535 54.2 22.7 3.9 152.3 0.8 5.4 2,168 20.8 47.0 0
100 ‐ 200 499 17.1 19.9 3.5 118.4 21.3 126.6 152 15.4 34.6 6.0 764.9 0.8 17.0 651 20.7 55.9 0
200 ‐ 400 263 9.0 20.7 3.6 231.8 23.5 263.7 134 13.6 67.1 11.7 1,592.5 1.1 26.0 397 21.8 90.6 0
400 ‐ 800 155 5.3 24.3 4.2 471.0 27.9 539.4 81 8.2 75.0 13.1 3,040.0 1.4 54.7 236 25.7 102.9 0
800 ‐ 1,600 121 4.1 38.6 6.7 937.0 45.7 1,108.4 53 5.4 106.0 18.5 5,889.9 2.1 119.0 174 40.8 151.7 0
1,600 ‐ 3,200 83 2.8 50.1 8.8 1,915.8 53.4 2,039.3 17 1.7 66.5 11.6 12,323.4 1.4 262.5 100 51.6 119.9 0
3,200 ‐ 6,400 73 2.5 99.1 17.3 3,962.5 111.8 4,470.0 11 1.1 71.0 12.4 19,885.2 2.5 696.5 84 101.6 182.7 0
6,400 ‐ 12,800 73 2.5 180.7 31.5 7,753.6 209.4 8,982.7 2 0.2 26.3 4.6 41,036.9 1.1 1,736.9 75 181.8 235.7 0
> 12,800 27 0.9 119.8 20.9 13,352.4 132.1 14,728.7 2 0.2 105.5 18.4 144,152.5 0.7 897.9 29 120.4 237.7 0
Total 2,927 100.0 573.3 100.0 587.8 649.4 665.8 987 100.0 574.6 100.0 1,988.1 11.8 40.9 3,914 585.1 1,224.0 0
Notes:
1) Source: State administrative oil & natural gas data thru DrillingInfo.
2) The total volumes shown in the distribution tables may not exactly agree with other related data, including other EIA sources. Major reasons for differences include: the timing of updates from state and commercial sources,
the summed production of available well‐level production data versus state‐level aggregations of production, and how a well is defined and which entities are counted and summed.
3) Wells counted for this report include sidetracks, completions, re‐completions and leases, this includes all oil and/or gas producing 'entities' available in DrillingInfo database.
4) For late reporting states the last year of available data is repeated for missing years (TN 2012 used for 2013‐16, KY 2013 used for 2014‐16 and MO 2014 for 2015‐16). All years are missing for IL and IN.
5) To be consistent between states a GOR of 6,000 (cf/bbl) for each years production was used to define oil versus gas wells. If the GOR was less (greater) than 6,000 (cf/bbl) the well was classed an oil (gas) well.
6) To determine production rate brackets for the first and last year of a wells life the annual production was divided
by the number of days in the productive months. For other years the annual production was divided by 365 or 366 days.
7) Gas volumes have been converted from the various state pressure bases to the Federal base (14.73 psia).
Data available as of November 2017.
Oil wells Gas wells Total wells
U.S. Energy Information Administration | The Distribution of U.S. Oil and Natural Gas Wells by Production Rate B24

December 2017
Table B25. Florida oil and gas well summary statistics, 2016
Annual Annual Annual Annual Annual Annual
oil Oil rate gas Gas rate gas Gas rate oil Oil rate oil gas Horizontal
Prod. rate bracket # of oil % of oil prod. % of oil per Well prod. per well # of gas % of gas prod. % of gas per well prod. per well # of total prod. prod. well
(BOE/day) wells wells (MMbbl) prod. (bbl/day) (Bcf) (Mcf/day) wells wells (Bcf) Prod. (Mcf/Day) (MMbbl) (bbl/Day) wells (MMbbl) (Bcf) count
0 ‐ 1 1 3.5 0.0 0.0 0.4 0.0 0.0 0 0.0 0.0 0.0 0.0 0.0 0.0 1 0.0 0.0 0
1 ‐ 2 0 0.0 0.0 0.0 0.0 0.0 0.0 1 2.3 0.0 0.0 6.8 0.0 0.0 1 0.0 0.0 0
2 ‐ 4 0 0.0 0.0 0.0 0.0 0.0 0.0 0 0.0 0.0 0.0 0.0 0.0 0.0 0 0.0 0.0 0
4 ‐ 6 0 0.0 0.0 0.0 0.0 0.0 0.0 0 0.0 0.0 0.0 0.0 0.0 0.0 0 0.0 0.0 0
6 ‐ 8 0 0.0 0.0 0.0 0.0 0.0 0.0 0 0.0 0.0 0.0 0.0 0.0 0.0 0 0.0 0.0 0
8 ‐ 10 0 0.0 0.0 0.0 0.0 0.0 0.0 0 0.0 0.0 0.0 0.0 0.0 0.0 0 0.0 0.0 0
Subtotal <=10 1 3.5 0.0 0.0 0.4 0.0 0.0 1 2.3 0.0 0.0 6.8 0.0 0.0 2 0.0 0.0 0
10 ‐ 12 1 3.5 0.0 0.4 9.8 0.0 0.0 1 2.3 0.0 0.1 61.1 0.0 0.0 2 0.0 0.0 0
12 ‐ 15 2 6.9 0.0 1.0 12.0 0.0 10.9 1 2.3 0.0 0.1 37.2 0.0 5.8 3 0.0 0.0 0
Subtotal <=15 4 13.8 0.0 1.3 8.0 0.0 5.5 3 7.0 0.0 0.1 32.5 0.0 3.0 7 0.0 0.0 0
15 ‐ 20 1 3.5 0.0 0.7 16.3 0.0 0.0 0 0.0 0.0 0.0 0.0 0.0 0.0 1 0.0 0.0 0
20 ‐ 25 0 0.0 0.0 0.0 0.0 0.0 0.0 1 2.3 0.0 0.2 105.4 0.0 4.1 1 0.0 0.0 0
25 ‐ 30 2 6.9 0.0 2.8 27.6 0.0 2.0 0 0.0 0.0 0.0 0.0 0.0 0.0 2 0.0 0.0 0
30 ‐ 40 3 10.3 0.0 3.1 20.6 0.1 77.7 2 4.7 0.1 0.5 145.0 0.0 11.0 5 0.0 0.2 0
40 ‐ 50 3 10.3 0.0 5.6 37.4 0.1 54.4 1 2.3 0.0 0.0 259.1 0.0 0.0 4 0.0 0.1 0
50 ‐ 100 7 24.1 0.2 22.8 65.3 0.0 17.7 3 7.0 0.2 1.1 311.2 0.0 11.4 10 0.2 0.3 0
Subtotal <=100 20 69.0 0.3 36.3 37.8 0.2 28.2 10 23.3 0.4 2.0 147.8 0.0 7.5 30 0.3 0.6 0
100 ‐ 200 6 20.7 0.3 40.3 135.1 0.1 51.2 7 16.3 2.0 10.0 773.8 0.1 26.3 13 0.4 2.1 0
200 ‐ 400 3 10.3 0.2 23.4 156.7 0.6 528.3 16 37.2 7.5 37.8 1,311.8 0.5 87.3 19 0.7 8.1 0
400 ‐ 800 0 0.0 0.0 0.0 0.0 0.0 0.0 9 20.9 7.7 38.9 2,352.3 0.5 147.1 9 0.5 7.7 0
800 ‐ 1,600 0 0.0 0.0 0.0 0.0 0.0 0.0 1 2.3 2.3 11.4 6,180.7 0.1 342.3 1 0.1 2.3 0
1,600 ‐ 3,200 0 0.0 0.0 0.0 0.0 0.0 0.0 0 0.0 0.0 0.0 0.0 0.0 0.0 0 0.0 0.0 0
3,200 ‐ 6,400 0 0.0 0.0 0.0 0.0 0.0 0.0 0 0.0 0.0 0.0 0.0 0.0 0.0 0 0.0 0.0 0
6,400 ‐ 12,800 0 0.0 0.0 0.0 0.0 0.0 0.0 0 0.0 0.0 0.0 0.0 0.0 0.0 0 0.0 0.0 0
> 12,800 0 0.0 0.0 0.0 0.0 0.0 0.0 0 0.0 0.0 0.0 0.0 0.0 0.0 0 0.0 0.0 0
Total 29 100.0 0.7 100.0 71.1 0.9 86.2 43 100.0 19.9 100.0 1,360.1 1.2 81.8 72 1.9 20.8 0
Notes:
1) Source: State administrative oil & natural gas data thru DrillingInfo.
2) The total volumes shown in the distribution tables may not exactly agree with other related data, including other EIA sources. Major reasons for differences include: the timing of updates from state and commercial sources,
the summed production of available well‐level production data versus state‐level aggregations of production, and how a well is defined and which entities are counted and summed.
3) Wells counted for this report include sidetracks, completions, re‐completions and leases, this includes all oil and/or gas producing 'entities' available in DrillingInfo database.
4) For late reporting states the last year of available data is repeated for missing years (TN 2012 used for 2013‐16, KY 2013 used for 2014‐16 and MO 2014 for 2015‐16). All years are missing for IL and IN.
5) To be consistent between states a GOR of 6,000 (cf/bbl) for each years production was used to define oil versus gas wells. If the GOR was less (greater) than 6,000 (cf/bbl) the well was classed an oil (gas) well.
6) To determine production rate brackets for the first and last year of a wells life the annual production was divided
by the number of days in the productive months. For other years the annual production was divided by 365 or 366 days.
7) Gas volumes have been converted from the various state pressure bases to the Federal base (14.73 psia).
Data available as of November 2017.
Oil wells Gas wells Total wells
U.S. Energy Information Administration | The Distribution of U.S. Oil and Natural Gas Wells by Production Rate B25

December 2017
Table B26. Federal Pacific oil and gas well summary statistics, 2016
Annual Annual Annual Annual Annual Annual
oil Oil rate gas Gas rate gas Gas rate oil Oil rate oil gas Horizontal
Prod. rate bracket # of oil % of oil prod. % of oil per Well prod. per well # of gas % of gas prod. % of gas per well prod. per well # of total prod. prod. well
(BOE/day) wells wells (MMbbl) prod. (bbl/day) (Bcf) (Mcf/day) wells wells (Bcf) Prod. (Mcf/Day) (MMbbl) (bbl/Day) wells (MMbbl) (Bcf) count
0 ‐ 1 1 0.3 0.0 0.0 0.5 0.0 0.0 1 7.7 0.0 0.2 3.4 0.0 0.0 2 0.0 0.0 0
1 ‐ 2 0 0.0 0.0 0.0 0.0 0.0 0.0 0 0.0 0.0 0.0 0.0 0.0 0.0 0 0.0 0.0 0
2 ‐ 4 1 0.3 0.0 0.0 1.8 0.0 2.7 0 0.0 0.0 0.0 0.0 0.0 0.0 1 0.0 0.0 0
4 ‐ 6 6 2.0 0.0 0.1 4.5 0.0 4.3 2 15.4 0.0 1.8 19.6 0.0 1.7 8 0.0 0.0 0
6 ‐ 8 11 3.7 0.0 0.3 5.9 0.0 6.9 0 0.0 0.0 0.0 0.0 0.0 0.0 11 0.0 0.0 0
8 ‐ 10 15 5.0 0.0 0.6 7.8 0.0 8.0 0 0.0 0.0 0.0 0.0 0.0 0.0 15 0.0 0.0 0
Subtotal <=10 34 11.3 0.1 1.1 6.4 0.1 6.8 3 23.1 0.0 2.0 14.2 0.0 1.2 37 0.1 0.1 0
10 ‐ 12 8 2.7 0.0 0.4 9.0 0.0 11.6 0 0.0 0.0 0.0 0.0 0.0 0.0 8 0.0 0.0 0
12 ‐ 15 18 6.0 0.1 1.1 11.3 0.1 13.4 1 7.7 0.0 1.7 37.1 0.0 6.1 19 0.1 0.1 0
Subtotal <=15 60 20.0 0.2 2.6 8.3 0.2 9.6 4 30.8 0.0 3.7 19.9 0.0 2.4 64 0.2 0.2 0
15 ‐ 20 34 11.3 0.2 2.8 15.0 0.2 14.0 0 0.0 0.0 0.0 0.0 0.0 0.0 34 0.2 0.2 0
20 ‐ 25 22 7.3 0.2 2.4 20.2 0.1 12.8 1 7.7 0.0 3.1 67.2 0.0 9.3 23 0.2 0.1 0
25 ‐ 30 19 6.3 0.2 2.6 24.2 0.1 16.7 1 7.7 0.0 2.7 99.5 0.0 10.8 20 0.2 0.1 0
30 ‐ 40 29 9.7 0.3 5.2 31.4 0.3 27.1 2 15.4 0.1 16.7 181.0 0.0 9.0 31 0.3 0.4 0
40 ‐ 50 21 7.0 0.3 4.4 39.8 0.2 31.0 0 0.0 0.0 0.0 0.0 0.0 0.0 21 0.3 0.2 0
50 ‐ 100 62 20.7 1.3 21.1 62.4 1.0 48.4 4 30.8 0.4 49.7 269.0 0.0 23.0 66 1.4 1.4 0
Subtotal <=100 247 82.3 2.6 41.1 30.6 2.1 24.8 12 92.3 0.6 75.9 141.8 0.1 11.7 259 2.7 2.7 0
100 ‐ 200 34 11.3 1.5 23.5 121.0 0.9 72.2 1 7.7 0.2 24.1 522.2 0.0 13.6 35 1.5 1.1 0
200 ‐ 400 14 4.7 1.2 18.6 250.5 0.6 118.7 0 0.0 0.0 0.0 0.0 0.0 0.0 14 1.2 0.6 0
400 ‐ 800 4 1.3 0.8 12.3 537.1 0.2 108.9 0 0.0 0.0 0.0 0.0 0.0 0.0 4 0.8 0.2 0
800 ‐ 1,600 1 0.3 0.3 4.5 780.5 0.0 124.4 0 0.0 0.0 0.0 0.0 0.0 0.0 1 0.3 0.0 0
1,600 ‐ 3,200 0 0.0 0.0 0.0 0.0 0.0 0.0 0 0.0 0.0 0.0 0.0 0.0 0.0 0 0.0 0.0 0
3,200 ‐ 6,400 0 0.0 0.0 0.0 0.0 0.0 0.0 0 0.0 0.0 0.0 0.0 0.0 0.0 0 0.0 0.0 0
6,400 ‐ 12,800 0 0.0 0.0 0.0 0.0 0.0 0.0 0 0.0 0.0 0.0 0.0 0.0 0.0 0 0.0 0.0 0
> 12,800 0 0.0 0.0 0.0 0.0 0.0 0.0 0 0.0 0.0 0.0 0.0 0.0 0.0 0 0.0 0.0 0
Total 300 100.0 6.4 100.0 61.0 3.8 36.2 13 100.0 0.8 100.0 172.1 0.1 11.9 313 6.5 4.6 0
Notes:
1) Source: State administrative oil & natural gas data thru DrillingInfo.
2) The total volumes shown in the distribution tables may not exactly agree with other related data, including other EIA sources. Major reasons for differences include: the timing of updates from state and commercial sources,
the summed production of available well‐level production data versus state‐level aggregations of production, and how a well is defined and which entities are counted and summed.
3) Wells counted for this report include sidetracks, completions, re‐completions and leases, this includes all oil and/or gas producing 'entities' available in DrillingInfo database.
4) For late reporting states the last year of available data is repeated for missing years (TN 2012 used for 2013‐16, KY 2013 used for 2014‐16 and MO 2014 for 2015‐16). All years are missing for IL and IN.
5) To be consistent between states a GOR of 6,000 (cf/bbl) for each years production was used to define oil versus gas wells. If the GOR was less (greater) than 6,000 (cf/bbl) the well was classed an oil (gas) well.
6) To determine production rate brackets for the first and last year of a wells life the annual production was divided
by the number of days in the productive months. For other years the annual production was divided by 365 or 366 days.
7) Gas volumes have been converted from the various state pressure bases to the Federal base (14.73 psia).
Data available as of November 2017.
Oil wells Gas wells Total wells
U.S. Energy Information Administration | The Distribution of U.S. Oil and Natural Gas Wells by Production Rate B26

December 2017
Table B27. Kansas oil and gas well summary statistics, 2016
Annual Annual Annual Annual Annual Annual
oil Oil rate gas Gas rate gas Gas rate oil Oil rate oil gas Horizontal
Prod. rate bracket # of oil % of oil prod. % of oil per Well prod. per well # of gas % of gas prod. % of gas per well prod. per well # of total prod. prod. well
(BOE/day) wells wells (MMbbl) prod. (bbl/day) (Bcf) (Mcf/day) wells wells (Bcf) Prod. (Mcf/Day) (MMbbl) (bbl/Day) wells (MMbbl) (Bcf) count
0 ‐ 1 28,674 55.9 3.2 8.9 0.3 0.0 0.0 3,910 17.2 3.1 1.3 2.4 0.0 0.0 32,584 3.2 3.1 1
1 ‐ 2 9,120 17.8 4.5 12.5 1.5 0.1 0.0 3,153 13.9 9.6 4.0 8.8 0.0 0.0 12,273 4.5 9.7 0
2 ‐ 4 7,977 15.6 7.7 21.4 2.8 0.3 0.1 4,978 21.9 30.5 12.8 17.4 0.1 0.1 12,955 7.8 30.8 0
4 ‐ 6 2,524 4.9 4.1 11.4 4.7 0.4 0.4 4,148 18.3 43.6 18.3 29.4 0.1 0.1 6,672 4.2 43.9 0
6 ‐ 8 869 1.7 2.1 5.8 6.7 0.3 1.1 3,180 14.0 47.1 19.8 41.2 0.1 0.1 4,049 2.1 47.5 0
8 ‐ 10 531 1.0 1.6 4.6 8.7 0.2 1.2 1,562 6.9 29.5 12.4 52.5 0.1 0.1 2,093 1.7 29.7 0
Subtotal <=10 49,695 96.9 23.1 64.5 1.4 1.3 0.1 20,931 92.3 163.3 68.8 22.3 0.4 0.1 70,626 23.5 164.7 1
10 ‐ 12 339 0.7 1.3 3.6 10.7 0.1 1.1 618 2.7 14.0 5.9 63.8 0.1 0.2 957 1.3 14.2 0
12 ‐ 15 328 0.6 1.5 4.1 13.0 0.2 2.2 403 1.8 10.6 4.4 76.0 0.1 0.6 731 1.5 10.8 0
Subtotal <=15 50,362 98.2 25.9 72.1 1.5 1.7 0.1 21,952 96.8 187.9 79.1 24.5 0.5 0.1 72,314 26.4 189.7 1
15 ‐ 20 313 0.6 1.8 5.1 16.7 0.4 3.7 261 1.2 8.2 3.4 96.2 0.1 1.0 574 1.9 8.6 0
20 ‐ 25 172 0.3 1.3 3.6 21.4 0.3 4.5 119 0.5 4.6 1.9 120.4 0.1 2.2 291 1.4 4.8 0
25 ‐ 30 143 0.3 1.2 3.4 26.2 0.3 6.3 77 0.3 3.3 1.4 141.7 0.1 3.7 220 1.3 3.6 0
30 ‐ 40 112 0.2 1.3 3.5 33.3 0.3 7.8 69 0.3 4.0 1.7 181.6 0.1 4.2 181 1.4 4.3 0
40 ‐ 50 66 0.1 0.9 2.5 43.1 0.1 6.7 67 0.3 4.8 2.0 232.9 0.1 6.5 133 1.0 4.9 1
50 ‐ 100 86 0.2 1.9 5.3 69.2 0.6 20.1 88 0.4 9.8 4.1 353.6 0.3 9.2 174 2.2 10.4 0
Subtotal <=100 51,254 99.9 34.3 95.6 2.0 3.7 0.2 22,633 99.8 222.6 93.7 28.2 1.3 0.2 73,887 35.6 226.3 2
100 ‐ 200 22 0.0 0.7 1.9 105.2 0.7 117.4 39 0.2 8.4 3.5 632.5 0.4 27.3 61 1.0 9.1 0
200 ‐ 400 8 0.0 0.6 1.8 221.8 0.8 296.3 10 0.0 4.4 1.9 1,205.5 0.2 63.2 18 0.9 5.3 0
400 ‐ 800 3 0.0 0.3 0.8 272.3 1.4 1,285.5 3 0.0 2.1 0.9 1,921.6 0.2 170.8 6 0.5 3.5 0
800 ‐ 1,600 0 0.0 0.0 0.0 0.0 0.0 0.0 0 0.0 0.0 0.0 0.0 0.0 0.0 0 0.0 0.0 0
1,600 ‐ 3,200 0 0.0 0.0 0.0 0.0 0.0 0.0 0 0.0 0.0 0.0 0.0 0.0 0.0 0 0.0 0.0 0
3,200 ‐ 6,400 0 0.0 0.0 0.0 0.0 0.0 0.0 0 0.0 0.0 0.0 0.0 0.0 0.0 0 0.0 0.0 0
6,400 ‐ 12,800 0 0.0 0.0 0.0 0.0 0.0 0.0 0 0.0 0.0 0.0 0.0 0.0 0.0 0 0.0 0.0 0
> 12,800 0 0.0 0.0 0.0 0.0 0.0 0.0 0 0.0 0.0 0.0 0.0 0.0 0.0 0 0.0 0.0 0
Total 51,287 100.0 35.9 100.0 2.1 6.7 0.4 22,685 100.0 237.5 100.0 30.0 2.0 0.3 73,972 38.0 244.2 2
Notes:
1) Source: State administrative oil & natural gas data thru DrillingInfo.
2) The total volumes shown in the distribution tables may not exactly agree with other related data, including other EIA sources. Major reasons for differences include: the timing of updates from state and commercial sources,
the summed production of available well‐level production data versus state‐level aggregations of production, and how a well is defined and which entities are counted and summed.
3) Wells counted for this report include sidetracks, completions, re‐completions and leases, this includes all oil and/or gas producing 'entities' available in DrillingInfo database.
4) For late reporting states the last year of available data is repeated for missing years (TN 2012 used for 2013‐16, KY 2013 used for 2014‐16 and MO 2014 for 2015‐16). All years are missing for IL and IN.
5) To be consistent between states a GOR of 6,000 (cf/bbl) for each years production was used to define oil versus gas wells. If the GOR was less (greater) than 6,000 (cf/bbl) the well was classed an oil (gas) well.
6) To determine production rate brackets for the first and last year of a wells life the annual production was divided
by the number of days in the productive months. For other years the annual production was divided by 365 or 366 days.
7) Gas volumes have been converted from the various state pressure bases to the Federal base (14.73 psia).
Data available as of November 2017.
Oil wells Gas wells Total wells
U.S. Energy Information Administration | The Distribution of U.S. Oil and Natural Gas Wells by Production Rate B27

December 2017
Table B28. Kentucky oil and gas well summary statistics, 2013
Annual Annual Annual Annual Annual Annual
oil Oil rate gas Gas rate gas Gas rate oil Oil rate oil gas Horizontal
Prod. rate bracket # of oil % of oil prod. % of oil per Well prod. per well # of gas % of gas prod. % of gas per well prod. per well # of total prod. prod. well
(BOE/day) wells wells (MMbbl) prod. (bbl/day) (Bcf) (Mcf/day) wells wells (Bcf) Prod. (Mcf/Day) (MMbbl) (bbl/Day) wells (MMbbl) (Bcf) count
0 ‐ 1 3,641 70.8 0.5 21.3 0.4 0.0 0.0 3,930 27.0 4.4 4.3 3.2 0.0 0.0 7,571 0.5 4.4 30
1 ‐ 2 731 14.2 0.4 16.9 1.4 0.1 0.3 3,428 23.6 10.9 10.9 8.8 0.0 0.0 4,159 0.4 11.0 10
2 ‐ 4 460 8.9 0.4 19.5 2.6 0.2 1.1 3,729 25.6 22.9 22.8 17.0 0.0 0.0 4,189 0.5 23.0 46
4 ‐ 6 149 2.9 0.2 10.9 4.4 0.1 2.3 1,619 11.1 16.8 16.7 28.8 0.0 0.0 1,768 0.3 16.9 83
6 ‐ 8 57 1.1 0.1 5.4 6.3 0.1 3.4 684 4.7 10.1 10.0 40.9 0.0 0.1 741 0.1 10.1 138
8 ‐ 10 20 0.4 0.0 2.3 7.7 0.0 7.4 368 2.5 6.9 6.9 52.7 0.0 0.2 388 0.1 6.9 129
Subtotal <=10 5,058 98.3 1.6 76.1 0.9 0.5 0.3 13,758 94.5 71.8 71.5 14.6 0.1 0.0 18,816 1.8 72.3 436
10 ‐ 12 20 0.4 0.1 2.9 9.8 0.0 7.3 254 1.7 5.8 5.8 64.9 0.0 0.1 274 0.1 5.9 124
12 ‐ 15 18 0.4 0.1 3.1 11.5 0.1 9.9 180 1.2 5.0 5.0 79.4 0.0 0.1 198 0.1 5.1 116
Subtotal <=15 5,096 99.1 1.8 82.2 1.0 0.6 0.3 14,192 97.5 82.7 82.3 16.3 0.1 0.0 19,288 1.9 83.3 676
15 ‐ 20 14 0.3 0.1 3.1 14.6 0.1 14.8 148 1.0 5.4 5.4 104.3 0.0 0.1 162 0.1 5.5 120
20 ‐ 25 8 0.2 0.1 2.8 21.0 0.0 6.5 88 0.6 4.0 4.0 131.9 0.0 0.2 96 0.1 4.0 70
25 ‐ 30 11 0.2 0.1 3.9 26.4 0.0 11.1 44 0.3 2.4 2.4 163.2 0.0 0.1 55 0.1 2.4 34
30 ‐ 40 6 0.1 0.0 2.2 29.5 0.0 26.8 43 0.3 2.8 2.8 203.1 0.0 0.1 49 0.0 2.9 36
40 ‐ 50 4 0.1 0.1 2.7 42.0 0.0 7.8 23 0.2 1.5 1.5 268.6 0.0 0.0 27 0.1 1.6 15
50 ‐ 100 6 0.1 0.1 3.1 77.4 0.0 5.7 17 0.1 1.5 1.5 358.1 0.0 1.1 23 0.1 1.5 17
Subtotal <=100 5,145 100.0 2.2 100.0 1.2 0.8 0.4 14,555 100.0 100.3 99.9 19.3 0.1 0.0 19,700 2.3 101.1 968
100 ‐ 200 0 0.0 0.0 0.0 0.0 0.0 0.0 2 0.0 0.1 0.1 706.6 0.0 0.0 2 0.0 0.1 2
200 ‐ 400 0 0.0 0.0 0.0 0.0 0.0 0.0 0 0.0 0.0 0.0 0.0 0.0 0.0 0 0.0 0.0 0
400 ‐ 800 0 0.0 0.0 0.0 0.0 0.0 0.0 0 0.0 0.0 0.0 0.0 0.0 0.0 0 0.0 0.0 0
800 ‐ 1,600 0 0.0 0.0 0.0 0.0 0.0 0.0 0 0.0 0.0 0.0 0.0 0.0 0.0 0 0.0 0.0 0
1,600 ‐ 3,200 0 0.0 0.0 0.0 0.0 0.0 0.0 0 0.0 0.0 0.0 0.0 0.0 0.0 0 0.0 0.0 0
3,200 ‐ 6,400 0 0.0 0.0 0.0 0.0 0.0 0.0 0 0.0 0.0 0.0 0.0 0.0 0.0 0 0.0 0.0 0
6,400 ‐ 12,800 0 0.0 0.0 0.0 0.0 0.0 0.0 0 0.0 0.0 0.0 0.0 0.0 0.0 0 0.0 0.0 0
> 12,800 0 0.0 0.0 0.0 0.0 0.0 0.0 0 0.0 0.0 0.0 0.0 0.0 0.0 0 0.0 0.0 0
Total 5,145 100.0 2.2 100.0 1.2 0.8 0.4 14,557 100.0 100.4 100.0 19.3 0.1 0.0 19,702 2.3 101.2 970
Notes:
1) Source: State administrative oil & natural gas data thru DrillingInfo.
2) The total volumes shown in the distribution tables may not exactly agree with other related data, including other EIA sources. Major reasons for differences include: the timing of updates from state and commercial sources,
the summed production of available well‐level production data versus state‐level aggregations of production, and how a well is defined and which entities are counted and summed.
3) Wells counted for this report include sidetracks, completions, re‐completions and leases, this includes all oil and/or gas producing 'entities' available in DrillingInfo database.
4) For late reporting states the last year of available data is repeated for missing years (TN 2012 used for 2013‐16, KY 2013 used for 2014‐16 and MO 2014 for 2015‐16). All years are missing for IL and IN.
5) To be consistent between states a GOR of 6,000 (cf/bbl) for each years production was used to define oil versus gas wells. If the GOR was less (greater) than 6,000 (cf/bbl) the well was classed an oil (gas) well.
6) To determine production rate brackets for the first and last year of a wells life the annual production was divided
by the number of days in the productive months. For other years the annual production was divided by 365 or 366 days.
7) Gas volumes have been converted from the various state pressure bases to the Federal base (14.73 psia).
Data available as of November 2017.
Oil wells Gas wells Total wells
U.S. Energy Information Administration | The Distribution of U.S. Oil and Natural Gas Wells by Production Rate B28

December 2017
Table B29. Louisiana oil and gas well summary statistics, 2016
Annual Annual Annual Annual Annual Annual
oil Oil rate gas Gas rate gas Gas rate oil Oil rate oil gas Horizontal
Prod. rate bracket # of oil % of oil prod. % of oil per Well prod. per well # of gas % of gas prod. % of gas per well prod. per well # of total prod. prod. well
(BOE/day) wells wells (MMbbl) prod. (bbl/day) (Bcf) (Mcf/day) wells wells (Bcf) Prod. (Mcf/Day) (MMbbl) (bbl/Day) wells (MMbbl) (Bcf) count
0 ‐ 1 12,576 66.2 1.3 2.7 0.3 0.1 0.0 7,586 42.7 3.5 0.2 1.3 0.0 0.0 20,162 1.3 3.6 18
1 ‐ 2 1,452 7.6 0.7 1.4 1.4 0.1 0.1 537 3.0 1.4 0.1 8.1 0.0 0.1 1,989 0.7 1.5 11
2 ‐ 4 876 4.6 0.8 1.7 2.7 0.2 0.8 720 4.1 3.8 0.2 16.6 0.1 0.2 1,596 0.8 4.1 20
4 ‐ 6 587 3.1 0.9 1.9 4.5 0.5 2.6 614 3.5 5.6 0.3 27.9 0.1 0.3 1,201 1.0 6.1 19
6 ‐ 8 439 2.3 0.9 1.9 6.2 0.6 4.3 538 3.0 7.1 0.4 39.6 0.1 0.4 977 1.0 7.7 22
8 ‐ 10 322 1.7 0.9 1.8 7.9 0.7 6.6 548 3.1 9.4 0.5 50.8 0.1 0.5 870 1.0 10.1 29
Subtotal <=10 16,252 85.5 5.5 11.3 1.0 2.3 0.4 10,543 59.3 30.8 1.8 8.5 0.3 0.1 26,795 5.8 33.1 119
10 ‐ 12 227 1.2 0.7 1.5 9.4 0.7 9.5 559 3.2 11.9 0.7 62.0 0.1 0.6 786 0.8 12.6 29
12 ‐ 15 307 1.6 1.2 2.5 11.8 1.0 10.1 708 4.0 18.5 1.1 76.9 0.2 0.7 1,015 1.4 19.6 39
Subtotal <=15 16,786 88.3 7.4 15.4 1.3 4.0 0.7 11,810 66.5 61.2 3.6 15.1 0.6 0.1 28,596 8.0 65.2 187
15 ‐ 20 375 2.0 2.0 4.1 15.3 1.6 12.4 959 5.4 32.4 1.9 99.9 0.2 0.7 1,334 2.2 34.0 93
20 ‐ 25 290 1.5 1.9 3.9 19.1 1.9 18.7 557 3.1 23.6 1.4 128.4 0.2 0.9 847 2.1 25.5 73
25 ‐ 30 230 1.2 1.9 3.9 23.8 1.8 22.5 420 2.4 22.0 1.3 157.8 0.2 1.1 650 2.0 23.8 101
30 ‐ 40 333 1.8 3.4 7.0 29.6 3.3 28.8 604 3.4 39.9 2.3 200.8 0.2 1.1 937 3.6 43.2 229
40 ‐ 50 204 1.1 2.8 5.7 38.8 2.5 35.4 448 2.5 39.1 2.3 261.6 0.2 1.2 652 2.9 41.7 257
50 ‐ 100 470 2.5 9.9 20.5 61.0 7.8 48.4 1,481 8.3 211.8 12.3 418.6 0.7 1.4 1,951 10.5 219.6 1,082
Subtotal <=100 18,688 98.3 29.2 60.5 4.5 22.9 3.6 16,279 91.6 430.0 25.0 77.5 2.2 0.4 34,967 31.4 452.9 2,022
100 ‐ 200 221 1.2 9.3 19.4 123.2 6.7 88.9 703 4.0 190.9 11.1 801.9 0.9 3.7 924 10.2 197.6 539
200 ‐ 400 74 0.4 5.7 11.8 224.7 5.4 212.4 305 1.7 164.8 9.6 1,602.5 1.2 11.5 379 6.9 170.2 208
400 ‐ 800 18 0.1 2.5 5.3 458.4 2.8 509.9 227 1.3 250.9 14.6 3,241.4 1.3 17.3 245 3.9 253.7 175
800 ‐ 1,600 7 0.0 1.3 2.8 736.1 2.5 1,388.4 143 0.8 311.6 18.1 6,737.3 0.9 20.4 150 2.3 314.1 127
1,600 ‐ 3,200 1 0.0 0.1 0.3 1,156.1 0.3 2,788.4 99 0.6 297.6 17.3 12,820.8 0.5 23.4 100 0.7 298.0 89
3,200 ‐ 6,400 0 0.0 0.0 0.0 0.0 0.0 0.0 11 0.1 57.2 3.3 24,040.9 0.8 351.0 11 0.8 57.2 5
6,400 ‐ 12,800 0 0.0 0.0 0.0 0.0 0.0 0.0 1 0.0 14.2 0.8 38,813.3 0.0 0.0 1 0.0 14.2 0
> 12,800 0 0.0 0.0 0.0 0.0 0.0 0.0 0 0.0 0.0 0.0 0.0 0.0 0.0 0 0.0 0.0 0
Total 19,009 100.0 48.2 100.0 7.4 40.7 6.2 17,768 100.0 1,717.3 100.0 284.2 8.0 1.3 36,777 56.2 1,758.0 3,165
Notes:
1) Source: State administrative oil & natural gas data thru DrillingInfo.
2) The total volumes shown in the distribution tables may not exactly agree with other related data, including other EIA sources. Major reasons for differences include: the timing of updates from state and commercial sources,
the summed production of available well‐level production data versus state‐level aggregations of production, and how a well is defined and which entities are counted and summed.
3) Wells counted for this report include sidetracks, completions, re‐completions and leases, this includes all oil and/or gas producing 'entities' available in DrillingInfo database.
4) For late reporting states the last year of available data is repeated for missing years (TN 2012 used for 2013‐16, KY 2013 used for 2014‐16 and MO 2014 for 2015‐16). All years are missing for IL and IN.
5) To be consistent between states a GOR of 6,000 (cf/bbl) for each years production was used to define oil versus gas wells. If the GOR was less (greater) than 6,000 (cf/bbl) the well was classed an oil (gas) well.
6) To determine production rate brackets for the first and last year of a wells life the annual production was divided
by the number of days in the productive months. For other years the annual production was divided by 365 or 366 days.
7) Gas volumes have been converted from the various state pressure bases to the Federal base (14.73 psia).
Data available as of November 2017.
Oil wells Gas wells Total wells
U.S. Energy Information Administration | The Distribution of U.S. Oil and Natural Gas Wells by Production Rate B29

December 2017
Table B30. Maryland oil and gas well summary statistics, 2016
Annual Annual Annual Annual Annual Annual
oil Oil rate gas Gas rate gas Gas rate oil Oil rate oil gas Horizontal
Prod. rate bracket # of oil % of oil prod. % of oil per Well prod. per well # of gas % of gas prod. % of gas per well prod. per well # of total prod. prod. well
(BOE/day) wells wells (MMbbl) prod. (bbl/day) (Bcf) (Mcf/day) wells wells (Bcf) Prod. (Mcf/Day) (MMbbl) (bbl/Day) wells (MMbbl) (Bcf) count
0 ‐ 1 0 0.0 0.0 0.0 0.0 0.0 0.0 0 0.0 0.0 0.0 0.0 0.0 0.0 0 0.0 0.0 0
1 ‐ 2 0 0.0 0.0 0.0 0.0 0.0 0.0 0 0.0 0.0 0.0 0.0 0.0 0.0 0 0.0 0.0 0
2 ‐ 4 0 0.0 0.0 0.0 0.0 0.0 0.0 1 100.0 0.0 100.0 16.0 0.0 0.0 1 0.0 0.0 0
4 ‐ 6 0 0.0 0.0 0.0 0.0 0.0 0.0 0 0.0 0.0 0.0 0.0 0.0 0.0 0 0.0 0.0 0
6 ‐ 8 0 0.0 0.0 0.0 0.0 0.0 0.0 0 0.0 0.0 0.0 0.0 0.0 0.0 0 0.0 0.0 0
8 ‐ 10 0 0.0 0.0 0.0 0.0 0.0 0.0 0 0.0 0.0 0.0 0.0 0.0 0.0 0 0.0 0.0 0
Subtotal <=10 0 0.0 0.0 0.0 0.0 0.0 0.0 1 100.0 0.0 100.0 16.0 0.0 0.0 1 0.0 0.0 0
10 ‐ 12 0 0.0 0.0 0.0 0.0 0.0 0.0 0 0.0 0.0 0.0 0.0 0.0 0.0 0 0.0 0.0 0
12 ‐ 15 0 0.0 0.0 0.0 0.0 0.0 0.0 0 0.0 0.0 0.0 0.0 0.0 0.0 0 0.0 0.0 0
Subtotal <=15 0 0.0 0.0 0.0 0.0 0.0 0.0 1 100.0 0.0 100.0 16.0 0.0 0.0 1 0.0 0.0 0
15 ‐ 20 0 0.0 0.0 0.0 0.0 0.0 0.0 0 0.0 0.0 0.0 0.0 0.0 0.0 0 0.0 0.0 0
20 ‐ 25 0 0.0 0.0 0.0 0.0 0.0 0.0 0 0.0 0.0 0.0 0.0 0.0 0.0 0 0.0 0.0 0
25 ‐ 30 0 0.0 0.0 0.0 0.0 0.0 0.0 0 0.0 0.0 0.0 0.0 0.0 0.0 0 0.0 0.0 0
30 ‐ 40 0 0.0 0.0 0.0 0.0 0.0 0.0 0 0.0 0.0 0.0 0.0 0.0 0.0 0 0.0 0.0 0
40 ‐ 50 0 0.0 0.0 0.0 0.0 0.0 0.0 0 0.0 0.0 0.0 0.0 0.0 0.0 0 0.0 0.0 0
50 ‐ 100 0 0.0 0.0 0.0 0.0 0.0 0.0 0 0.0 0.0 0.0 0.0 0.0 0.0 0 0.0 0.0 0
Subtotal <=100 0 0.0 0.0 0.0 0.0 0.0 0.0 1 100.0 0.0 100.0 16.0 0.0 0.0 1 0.0 0.0 0
100 ‐ 200 0 0.0 0.0 0.0 0.0 0.0 0.0 0 0.0 0.0 0.0 0.0 0.0 0.0 0 0.0 0.0 0
200 ‐ 400 0 0.0 0.0 0.0 0.0 0.0 0.0 0 0.0 0.0 0.0 0.0 0.0 0.0 0 0.0 0.0 0
400 ‐ 800 0 0.0 0.0 0.0 0.0 0.0 0.0 0 0.0 0.0 0.0 0.0 0.0 0.0 0 0.0 0.0 0
800 ‐ 1,600 0 0.0 0.0 0.0 0.0 0.0 0.0 0 0.0 0.0 0.0 0.0 0.0 0.0 0 0.0 0.0 0
1,600 ‐ 3,200 0 0.0 0.0 0.0 0.0 0.0 0.0 0 0.0 0.0 0.0 0.0 0.0 0.0 0 0.0 0.0 0
3,200 ‐ 6,400 0 0.0 0.0 0.0 0.0 0.0 0.0 0 0.0 0.0 0.0 0.0 0.0 0.0 0 0.0 0.0 0
6,400 ‐ 12,800 0 0.0 0.0 0.0 0.0 0.0 0.0 0 0.0 0.0 0.0 0.0 0.0 0.0 0 0.0 0.0 0
> 12,800 0 0.0 0.0 0.0 0.0 0.0 0.0 0 0.0 0.0 0.0 0.0 0.0 0.0 0 0.0 0.0 0
Total 0 0.0 0.0 0.0 0.0 0.0 0.0 1 100.0 0.0 100.0 16.0 0.0 0.0 1 0.0 0.0 0
Notes:
1) Source: State administrative oil & natural gas data thru DrillingInfo.
2) The total volumes shown in the distribution tables may not exactly agree with other related data, including other EIA sources. Major reasons for differences include: the timing of updates from state and commercial sources,
the summed production of available well‐level production data versus state‐level aggregations of production, and how a well is defined and which entities are counted and summed.
3) Wells counted for this report include sidetracks, completions, re‐completions and leases, this includes all oil and/or gas producing 'entities' available in DrillingInfo database.
4) For late reporting states the last year of available data is repeated for missing years (TN 2012 used for 2013‐16, KY 2013 used for 2014‐16 and MO 2014 for 2015‐16). All years are missing for IL and IN.
5) To be consistent between states a GOR of 6,000 (cf/bbl) for each years production was used to define oil versus gas wells. If the GOR was less (greater) than 6,000 (cf/bbl) the well was classed an oil (gas) well.
6) To determine production rate brackets for the first and last year of a wells life the annual production was divided
by the number of days in the productive months. For other years the annual production was divided by 365 or 366 days.
7) Gas volumes have been converted from the various state pressure bases to the Federal base (14.73 psia).
Data available as of November 2017.
Oil wells Gas wells Total wells
U.S. Energy Information Administration | The Distribution of U.S. Oil and Natural Gas Wells by Production Rate B30

December 2017
Table B31. Michigan oil and gas well summary statistics, 2016
Annual Annual Annual Annual Annual Annual
oil Oil rate gas Gas rate gas Gas rate oil Oil rate oil gas Horizontal
Prod. rate bracket # of oil % of oil prod. % of oil per Well prod. per well # of gas % of gas prod. % of gas per well prod. per well # of total prod. prod. well
(BOE/day) wells wells (MMbbl) prod. (bbl/day) (Bcf) (Mcf/day) wells wells (Bcf) Prod. (Mcf/Day) (MMbbl) (bbl/Day) wells (MMbbl) (Bcf) count
0 ‐ 1 810 32.2 0.1 2.7 0.5 0.0 0.0 458 4.8 0.5 0.5 3.0 0.0 0.0 1,268 0.1 0.5 10
1 ‐ 2 565 22.5 0.3 5.5 1.4 0.0 0.2 1,164 12.2 3.9 4.1 9.3 0.0 0.0 1,729 0.3 3.9 11
2 ‐ 4 456 18.2 0.4 8.2 2.7 0.1 0.7 3,577 37.4 23.4 24.4 17.9 0.0 0.0 4,033 0.4 23.5 17
4 ‐ 6 160 6.4 0.2 4.4 4.5 0.2 3.0 2,740 28.6 28.8 30.0 28.8 0.0 0.0 2,900 0.2 29.0 8
6 ‐ 8 139 5.5 0.3 5.7 6.3 0.3 5.7 986 10.3 14.5 15.1 40.2 0.0 0.0 1,125 0.3 14.7 10
8 ‐ 10 61 2.4 0.2 3.0 7.9 0.1 6.9 296 3.1 5.6 5.8 52.0 0.0 0.1 357 0.2 5.7 9
Subtotal <=10 2,191 87.2 1.5 29.6 2.1 0.7 0.9 9,221 96.3 76.6 79.9 22.9 0.0 0.0 11,412 1.6 77.4 65
10 ‐ 12 47 1.9 0.1 2.9 9.7 0.1 6.7 102 1.1 2.3 2.4 63.1 0.0 0.6 149 0.2 2.4 6
12 ‐ 15 52 2.1 0.2 3.9 11.7 0.2 9.9 85 0.9 2.5 2.6 81.0 0.0 0.5 137 0.2 2.7 12
Subtotal <=15 2,290 91.1 1.9 36.4 2.4 1.0 1.3 9,408 98.2 81.5 84.9 23.8 0.1 0.0 11,698 2.0 82.4 83
15 ‐ 20 56 2.2 0.3 5.5 15.6 0.2 10.4 42 0.4 1.4 1.5 94.0 0.0 1.3 98 0.3 1.6 10
20 ‐ 25 35 1.4 0.2 3.9 18.4 0.3 24.8 28 0.3 1.2 1.3 127.1 0.0 1.1 63 0.2 1.5 7
25 ‐ 30 22 0.9 0.2 3.4 23.7 0.1 20.5 23 0.2 1.2 1.3 154.1 0.0 2.1 45 0.2 1.4 3
30 ‐ 40 24 1.0 0.2 4.6 30.2 0.2 26.2 20 0.2 1.1 1.2 168.7 0.0 6.9 44 0.3 1.3 5
40 ‐ 50 12 0.5 0.2 3.3 39.4 0.2 39.4 5 0.1 0.4 0.4 254.6 0.0 4.2 17 0.2 0.6 0
50 ‐ 100 47 1.9 1.0 18.5 57.7 1.2 71.8 27 0.3 3.5 3.7 385.5 0.1 8.6 74 1.0 4.7 5
Subtotal <=100 2,486 98.9 3.9 75.5 4.6 3.1 3.7 9,553 99.8 90.3 94.1 26.1 0.3 0.1 12,039 4.1 93.5 113
100 ‐ 200 22 0.9 0.8 15.9 116.4 0.6 85.8 21 0.2 4.2 4.4 583.4 0.2 24.9 43 1.0 4.9 13
200 ‐ 400 5 0.2 0.4 8.6 248.8 0.3 189.2 2 0.0 0.6 0.6 1,235.6 0.0 43.3 7 0.5 0.9 2
400 ‐ 800 0 0.0 0.0 0.0 0.0 0.0 0.0 1 0.0 0.8 0.9 2,424.6 0.0 0.0 1 0.0 0.8 0
800 ‐ 1,600 0 0.0 0.0 0.0 0.0 0.0 0.0 0 0.0 0.0 0.0 0.0 0.0 0.0 0 0.0 0.0 0
1,600 ‐ 3,200 0 0.0 0.0 0.0 0.0 0.0 0.0 0 0.0 0.0 0.0 0.0 0.0 0.0 0 0.0 0.0 0
3,200 ‐ 6,400 0 0.0 0.0 0.0 0.0 0.0 0.0 0 0.0 0.0 0.0 0.0 0.0 0.0 0 0.0 0.0 0
6,400 ‐ 12,800 0 0.0 0.0 0.0 0.0 0.0 0.0 0 0.0 0.0 0.0 0.0 0.0 0.0 0 0.0 0.0 0
> 12,800 0 0.0 0.0 0.0 0.0 0.0 0.0 0 0.0 0.0 0.0 0.0 0.0 0.0 0 0.0 0.0 0
Total 2,513 100.0 5.1 100.0 6.1 4.1 4.8 9,577 100.0 96.0 100.0 27.6 0.5 0.1 12,090 5.6 100.1 128
Notes:
1) Source: State administrative oil & natural gas data thru DrillingInfo.
2) The total volumes shown in the distribution tables may not exactly agree with other related data, including other EIA sources. Major reasons for differences include: the timing of updates from state and commercial sources,
the summed production of available well‐level production data versus state‐level aggregations of production, and how a well is defined and which entities are counted and summed.
3) Wells counted for this report include sidetracks, completions, re‐completions and leases, this includes all oil and/or gas producing 'entities' available in DrillingInfo database.
4) For late reporting states the last year of available data is repeated for missing years (TN 2012 used for 2013‐16, KY 2013 used for 2014‐16 and MO 2014 for 2015‐16). All years are missing for IL and IN.
5) To be consistent between states a GOR of 6,000 (cf/bbl) for each years production was used to define oil versus gas wells. If the GOR was less (greater) than 6,000 (cf/bbl) the well was classed an oil (gas) well.
6) To determine production rate brackets for the first and last year of a wells life the annual production was divided
by the number of days in the productive months. For other years the annual production was divided by 365 or 366 days.
7) Gas volumes have been converted from the various state pressure bases to the Federal base (14.73 psia).
Data available as of November 2017.
Oil wells Gas wells Total wells
U.S. Energy Information Administration | The Distribution of U.S. Oil and Natural Gas Wells by Production Rate B31

December 2017
Table B32. Missouri oil and gas well summary statistics, 2014
Annual Annual Annual Annual Annual Annual
oil Oil rate gas Gas rate gas Gas rate oil Oil rate oil gas Horizontal
Prod. rate bracket # of oil % of oil prod. % of oil per Well prod. per well # of gas % of gas prod. % of gas per well prod. per well # of total prod. prod. well
(BOE/day) wells wells (MMbbl) prod. (bbl/day) (Bcf) (Mcf/day) wells wells (Bcf) Prod. (Mcf/Day) (MMbbl) (bbl/Day) wells (MMbbl) (Bcf) count
0 ‐ 1 3 12.5 0.0 0.2 0.4 0.0 0.0 5 83.3 0.0 34.8 1.4 0.0 0.0 8 0.0 0.0 0
1 ‐ 2 2 8.3 0.0 0.5 1.5 0.0 0.0 0 0.0 0.0 0.0 0.0 0.0 0.0 2 0.0 0.0 0
2 ‐ 4 4 16.7 0.0 1.6 2.8 0.0 0.0 1 16.7 0.0 65.2 15.3 0.0 0.0 5 0.0 0.0 0
4 ‐ 6 3 12.5 0.0 2.1 4.9 0.0 0.0 0 0.0 0.0 0.0 0.0 0.0 0.0 3 0.0 0.0 0
6 ‐ 8 2 8.3 0.0 1.7 7.4 0.0 0.0 0 0.0 0.0 0.0 0.0 0.0 0.0 2 0.0 0.0 0
8 ‐ 10 0 0.0 0.0 0.0 0.0 0.0 0.0 0 0.0 0.0 0.0 0.0 0.0 0.0 0 0.0 0.0 0
Subtotal <=10 14 58.3 0.0 6.0 3.1 0.0 0.0 6 100.0 0.0 100.0 3.5 0.0 0.0 20 0.0 0.0 0
10 ‐ 12 0 0.0 0.0 0.0 0.0 0.0 0.0 0 0.0 0.0 0.0 0.0 0.0 0.0 0 0.0 0.0 0
12 ‐ 15 2 8.3 0.0 4.5 13.9 0.0 0.0 0 0.0 0.0 0.0 0.0 0.0 0.0 2 0.0 0.0 0
Subtotal <=15 16 66.7 0.0 10.5 4.6 0.0 0.0 6 100.0 0.0 100.0 3.5 0.0 0.0 22 0.0 0.0 0
15 ‐ 20 1 4.2 0.0 3.6 19.3 0.0 0.0 0 0.0 0.0 0.0 0.0 0.0 0.0 1 0.0 0.0 0
20 ‐ 25 2 8.3 0.0 6.9 21.3 0.0 0.0 0 0.0 0.0 0.0 0.0 0.0 0.0 2 0.0 0.0 0
25 ‐ 30 1 4.2 0.0 3.6 25.4 0.0 0.0 0 0.0 0.0 0.0 0.0 0.0 0.0 1 0.0 0.0 0
30 ‐ 40 1 4.2 0.0 4.8 34.3 0.0 0.0 0 0.0 0.0 0.0 0.0 0.0 0.0 1 0.0 0.0 0
40 ‐ 50 0 0.0 0.0 0.0 0.0 0.0 0.0 0 0.0 0.0 0.0 0.0 0.0 0.0 0 0.0 0.0 0
50 ‐ 100 2 8.3 0.0 28.6 76.7 0.0 0.0 0 0.0 0.0 0.0 0.0 0.0 0.0 2 0.0 0.0 0
Subtotal <=100 23 95.8 0.0 58.0 16.8 0.0 0.0 6 100.0 0.0 100.0 3.5 0.0 0.0 29 0.0 0.0 0
100 ‐ 200 0 0.0 0.0 0.0 0.0 0.0 0.0 0 0.0 0.0 0.0 0.0 0.0 0.0 0 0.0 0.0 0
200 ‐ 400 1 4.2 0.0 42.0 225.7 0.0 0.0 0 0.0 0.0 0.0 0.0 0.0 0.0 1 0.0 0.0 0
400 ‐ 800 0 0.0 0.0 0.0 0.0 0.0 0.0 0 0.0 0.0 0.0 0.0 0.0 0.0 0 0.0 0.0 0
800 ‐ 1,600 0 0.0 0.0 0.0 0.0 0.0 0.0 0 0.0 0.0 0.0 0.0 0.0 0.0 0 0.0 0.0 0
1,600 ‐ 3,200 0 0.0 0.0 0.0 0.0 0.0 0.0 0 0.0 0.0 0.0 0.0 0.0 0.0 0 0.0 0.0 0
3,200 ‐ 6,400 0 0.0 0.0 0.0 0.0 0.0 0.0 0 0.0 0.0 0.0 0.0 0.0 0.0 0 0.0 0.0 0
6,400 ‐ 12,800 0 0.0 0.0 0.0 0.0 0.0 0.0 0 0.0 0.0 0.0 0.0 0.0 0.0 0 0.0 0.0 0
> 12,800 0 0.0 0.0 0.0 0.0 0.0 0.0 0 0.0 0.0 0.0 0.0 0.0 0.0 0 0.0 0.0 0
Total 24 100.0 0.1 100.0 27.6 0.0 0.0 6 100.0 0.0 100.0 3.5 0.0 0.0 30 0.1 0.0 0
Notes:
1) Source: State administrative oil & natural gas data thru DrillingInfo.
2) The total volumes shown in the distribution tables may not exactly agree with other related data, including other EIA sources. Major reasons for differences include: the timing of updates from state and commercial sources,
the summed production of available well‐level production data versus state‐level aggregations of production, and how a well is defined and which entities are counted and summed.
3) Wells counted for this report include sidetracks, completions, re‐completions and leases, this includes all oil and/or gas producing 'entities' available in DrillingInfo database.
4) For late reporting states the last year of available data is repeated for missing years (TN 2012 used for 2013‐16, KY 2013 used for 2014‐16 and MO 2014 for 2015‐16). All years are missing for IL and IN.
5) To be consistent between states a GOR of 6,000 (cf/bbl) for each years production was used to define oil versus gas wells. If the GOR was less (greater) than 6,000 (cf/bbl) the well was classed an oil (gas) well.
6) To determine production rate brackets for the first and last year of a wells life the annual production was divided
by the number of days in the productive months. For other years the annual production was divided by 365 or 366 days.
7) Gas volumes have been converted from the various state pressure bases to the Federal base (14.73 psia).
Data available as of November 2017.
Oil wells Gas wells Total wells
U.S. Energy Information Administration | The Distribution of U.S. Oil and Natural Gas Wells by Production Rate B32

December 2017
Table B33. Mississippi oil and gas well summary statistics, 2016
Annual Annual Annual Annual Annual Annual
oil Oil rate gas Gas rate gas Gas rate oil Oil rate oil gas Horizontal
Prod. rate bracket # of oil % of oil prod. % of oil per Well prod. per well # of gas % of gas prod. % of gas per well prod. per well # of total prod. prod. well
(BOE/day) wells wells (MMbbl) prod. (bbl/day) (Bcf) (Mcf/day) wells wells (Bcf) Prod. (Mcf/Day) (MMbbl) (bbl/Day) wells (MMbbl) (Bcf) count
0 ‐ 1 197 9.9 0.0 0.1 0.3 0.0 0.0 111 7.4 0.1 0.2 3.1 0.0 0.0 308 0.0 0.1 8
1 ‐ 2 75 3.8 0.0 0.2 1.4 0.0 0.2 146 9.8 0.4 1.1 9.3 0.0 0.0 221 0.0 0.5 7
2 ‐ 4 166 8.3 0.1 0.7 2.9 0.0 0.5 539 36.0 3.2 7.6 17.7 0.0 0.0 705 0.1 3.2 15
4 ‐ 6 145 7.3 0.2 1.1 4.9 0.0 0.9 203 13.6 2.0 4.7 28.3 0.0 0.1 348 0.2 2.0 4
6 ‐ 8 136 6.8 0.3 1.5 6.8 0.1 1.3 83 5.5 1.2 2.8 40.1 0.0 0.1 219 0.3 1.2 7
8 ‐ 10 104 5.2 0.3 1.4 8.7 0.1 1.9 48 3.2 0.9 2.1 54.1 0.0 0.1 152 0.3 1.0 8
Subtotal <=10 823 41.2 1.0 5.0 4.1 0.2 0.8 1,130 75.4 7.8 18.5 20.7 0.0 0.0 1,953 1.0 8.0 49
10 ‐ 12 69 3.5 0.3 1.3 10.7 0.0 1.9 50 3.3 1.1 2.6 63.3 0.0 0.4 119 0.3 1.1 10
12 ‐ 15 125 6.3 0.6 2.9 13.1 0.1 2.2 51 3.4 1.3 3.1 76.8 0.0 0.4 176 0.6 1.4 18
Subtotal <=15 1,017 50.9 1.8 9.2 5.8 0.3 1.1 1,231 82.2 10.2 24.2 24.8 0.0 0.1 2,248 1.9 10.6 77
15 ‐ 20 158 7.9 0.9 4.4 17.0 0.1 2.4 51 3.4 1.8 4.1 101.0 0.0 0.4 209 0.9 1.9 26
20 ‐ 25 119 6.0 0.9 4.5 22.0 0.1 2.8 40 2.7 1.7 4.1 130.0 0.0 0.6 159 0.9 1.9 25
25 ‐ 30 87 4.4 0.8 4.2 27.2 0.1 2.2 27 1.8 1.2 2.9 151.4 0.0 2.1 114 0.8 1.3 18
30 ‐ 40 151 7.6 1.8 9.1 34.1 0.3 4.8 32 2.1 2.0 4.7 198.7 0.0 1.8 183 1.8 2.3 18
40 ‐ 50 95 4.8 1.4 7.2 43.4 0.2 7.4 16 1.1 1.1 2.6 230.2 0.0 5.3 111 1.4 1.3 11
50 ‐ 100 236 11.8 5.7 28.8 68.6 0.8 10.1 52 3.5 6.7 15.9 407.3 0.1 5.0 288 5.8 7.5 36
Subtotal <=100 1,863 93.2 13.3 67.3 22.1 2.0 3.3 1,449 96.7 24.8 58.5 51.3 0.2 0.4 3,312 13.5 26.7 211
100 ‐ 200 113 5.7 4.6 23.4 123.0 2.1 54.5 32 2.1 7.1 16.7 767.1 0.1 10.4 145 4.7 9.1 45
200 ‐ 400 19 1.0 1.4 7.3 226.5 1.5 237.4 13 0.9 5.9 13.8 1,412.9 0.1 28.3 32 1.6 7.4 14
400 ‐ 800 3 0.2 0.4 2.1 393.0 1.0 971.1 3 0.2 3.0 7.1 3,001.1 0.1 100.2 6 0.5 4.0 1
800 ‐ 1,600 0 0.0 0.0 0.0 0.0 0.0 0.0 1 0.1 1.6 3.8 4,391.5 0.1 401.4 1 0.1 1.6 1
1,600 ‐ 3,200 0 0.0 0.0 0.0 0.0 0.0 0.0 0 0.0 0.0 0.0 0.0 0.0 0.0 0 0.0 0.0 0
3,200 ‐ 6,400 0 0.0 0.0 0.0 0.0 0.0 0.0 0 0.0 0.0 0.0 0.0 0.0 0.0 0 0.0 0.0 0
6,400 ‐ 12,800 0 0.0 0.0 0.0 0.0 0.0 0.0 0 0.0 0.0 0.0 0.0 0.0 0.0 0 0.0 0.0 0
> 12,800 0 0.0 0.0 0.0 0.0 0.0 0.0 0 0.0 0.0 0.0 0.0 0.0 0.0 0 0.0 0.0 0
Total 1,998 100.0 19.8 100.0 30.5 6.5 10.1 1,498 100.0 42.3 100.0 85.0 0.6 1.3 3,496 20.4 48.9 272
Notes:
1) Source: State administrative oil & natural gas data thru DrillingInfo.
2) The total volumes shown in the distribution tables may not exactly agree with other related data, including other EIA sources. Major reasons for differences include: the timing of updates from state and commercial sources,
the summed production of available well‐level production data versus state‐level aggregations of production, and how a well is defined and which entities are counted and summed.
3) Wells counted for this report include sidetracks, completions, re‐completions and leases, this includes all oil and/or gas producing 'entities' available in DrillingInfo database.
4) For late reporting states the last year of available data is repeated for missing years (TN 2012 used for 2013‐16, KY 2013 used for 2014‐16 and MO 2014 for 2015‐16). All years are missing for IL and IN.
5) To be consistent between states a GOR of 6,000 (cf/bbl) for each years production was used to define oil versus gas wells. If the GOR was less (greater) than 6,000 (cf/bbl) the well was classed an oil (gas) well.
6) To determine production rate brackets for the first and last year of a wells life the annual production was divided
by the number of days in the productive months. For other years the annual production was divided by 365 or 366 days.
7) Gas volumes have been converted from the various state pressure bases to the Federal base (14.73 psia).
Data available as of November 2017.
Oil wells Gas wells Total wells
U.S. Energy Information Administration | The Distribution of U.S. Oil and Natural Gas Wells by Production Rate B33
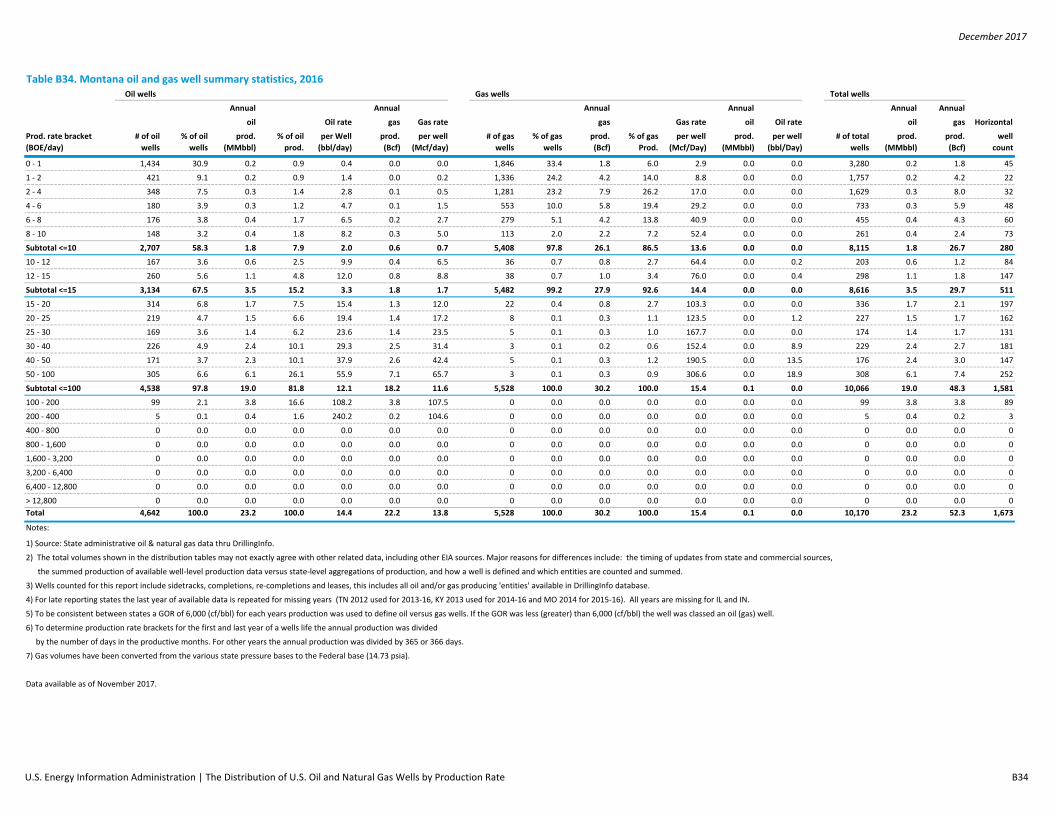
December 2017
Table B34. Montana oil and gas well summary statistics, 2016
Annual Annual Annual Annual Annual Annual
oil Oil rate gas Gas rate gas Gas rate oil Oil rate oil gas Horizontal
Prod. rate bracket # of oil % of oil prod. % of oil per Well prod. per well # of gas % of gas prod. % of gas per well prod. per well # of total prod. prod. well
(BOE/day) wells wells (MMbbl) prod. (bbl/day) (Bcf) (Mcf/day) wells wells (Bcf) Prod. (Mcf/Day) (MMbbl) (bbl/Day) wells (MMbbl) (Bcf) count
0 ‐ 1 1,434 30.9 0.2 0.9 0.4 0.0 0.0 1,846 33.4 1.8 6.0 2.9 0.0 0.0 3,280 0.2 1.8 45
1 ‐ 2 421 9.1 0.2 0.9 1.4 0.0 0.2 1,336 24.2 4.2 14.0 8.8 0.0 0.0 1,757 0.2 4.2 22
2 ‐ 4 348 7.5 0.3 1.4 2.8 0.1 0.5 1,281 23.2 7.9 26.2 17.0 0.0 0.0 1,629 0.3 8.0 32
4 ‐ 6 180 3.9 0.3 1.2 4.7 0.1 1.5 553 10.0 5.8 19.4 29.2 0.0 0.0 733 0.3 5.9 48
6 ‐ 8 176 3.8 0.4 1.7 6.5 0.2 2.7 279 5.1 4.2 13.8 40.9 0.0 0.0 455 0.4 4.3 60
8 ‐ 10 148 3.2 0.4 1.8 8.2 0.3 5.0 113 2.0 2.2 7.2 52.4 0.0 0.0 261 0.4 2.4 73
Subtotal <=10 2,707 58.3 1.8 7.9 2.0 0.6 0.7 5,408 97.8 26.1 86.5 13.6 0.0 0.0 8,115 1.8 26.7 280
10 ‐ 12 167 3.6 0.6 2.5 9.9 0.4 6.5 36 0.7 0.8 2.7 64.4 0.0 0.2 203 0.6 1.2 84
12 ‐ 15 260 5.6 1.1 4.8 12.0 0.8 8.8 38 0.7 1.0 3.4 76.0 0.0 0.4 298 1.1 1.8 147
Subtotal <=15 3,134 67.5 3.5 15.2 3.3 1.8 1.7 5,482 99.2 27.9 92.6 14.4 0.0 0.0 8,616 3.5 29.7 511
15 ‐ 20 314 6.8 1.7 7.5 15.4 1.3 12.0 22 0.4 0.8 2.7 103.3 0.0 0.0 336 1.7 2.1 197
20 ‐ 25 219 4.7 1.5 6.6 19.4 1.4 17.2 8 0.1 0.3 1.1 123.5 0.0 1.2 227 1.5 1.7 162
25 ‐ 30 169 3.6 1.4 6.2 23.6 1.4 23.5 5 0.1 0.3 1.0 167.7 0.0 0.0 174 1.4 1.7 131
30 ‐ 40 226 4.9 2.4 10.1 29.3 2.5 31.4 3 0.1 0.2 0.6 152.4 0.0 8.9 229 2.4 2.7 181
40 ‐ 50 171 3.7 2.3 10.1 37.9 2.6 42.4 5 0.1 0.3 1.2 190.5 0.0 13.5 176 2.4 3.0 147
50 ‐ 100 305 6.6 6.1 26.1 55.9 7.1 65.7 3 0.1 0.3 0.9 306.6 0.0 18.9 308 6.1 7.4 252
Subtotal <=100 4,538 97.8 19.0 81.8 12.1 18.2 11.6 5,528 100.0 30.2 100.0 15.4 0.1 0.0 10,066 19.0 48.3 1,581
100 ‐ 200 99 2.1 3.8 16.6 108.2 3.8 107.5 0 0.0 0.0 0.0 0.0 0.0 0.0 99 3.8 3.8 89
200 ‐ 400 5 0.1 0.4 1.6 240.2 0.2 104.6 0 0.0 0.0 0.0 0.0 0.0 0.0 5 0.4 0.2 3
400 ‐ 800 0 0.0 0.0 0.0 0.0 0.0 0.0 0 0.0 0.0 0.0 0.0 0.0 0.0 0 0.0 0.0 0
800 ‐ 1,600 0 0.0 0.0 0.0 0.0 0.0 0.0 0 0.0 0.0 0.0 0.0 0.0 0.0 0 0.0 0.0 0
1,600 ‐ 3,200 0 0.0 0.0 0.0 0.0 0.0 0.0 0 0.0 0.0 0.0 0.0 0.0 0.0 0 0.0 0.0 0
3,200 ‐ 6,400 0 0.0 0.0 0.0 0.0 0.0 0.0 0 0.0 0.0 0.0 0.0 0.0 0.0 0 0.0 0.0 0
6,400 ‐ 12,800 0 0.0 0.0 0.0 0.0 0.0 0.0 0 0.0 0.0 0.0 0.0 0.0 0.0 0 0.0 0.0 0
> 12,800 0 0.0 0.0 0.0 0.0 0.0 0.0 0 0.0 0.0 0.0 0.0 0.0 0.0 0 0.0 0.0 0
Total 4,642 100.0 23.2 100.0 14.4 22.2 13.8 5,528 100.0 30.2 100.0 15.4 0.1 0.0 10,170 23.2 52.3 1,673
Notes:
1) Source: State administrative oil & natural gas data thru DrillingInfo.
2) The total volumes shown in the distribution tables may not exactly agree with other related data, including other EIA sources. Major reasons for differences include: the timing of updates from state and commercial sources,
the summed production of available well‐level production data versus state‐level aggregations of production, and how a well is defined and which entities are counted and summed.
3) Wells counted for this report include sidetracks, completions, re‐completions and leases, this includes all oil and/or gas producing 'entities' available in DrillingInfo database.
4) For late reporting states the last year of available data is repeated for missing years (TN 2012 used for 2013‐16, KY 2013 used for 2014‐16 and MO 2014 for 2015‐16). All years are missing for IL and IN.
5) To be consistent between states a GOR of 6,000 (cf/bbl) for each years production was used to define oil versus gas wells. If the GOR was less (greater) than 6,000 (cf/bbl) the well was classed an oil (gas) well.
6) To determine production rate brackets for the first and last year of a wells life the annual production was divided
by the number of days in the productive months. For other years the annual production was divided by 365 or 366 days.
7) Gas volumes have been converted from the various state pressure bases to the Federal base (14.73 psia).
Data available as of November 2017.
Oil wells Gas wells Total wells
U.S. Energy Information Administration | The Distribution of U.S. Oil and Natural Gas Wells by Production Rate B34

December 2017
Table B35. North Dakota oil and gas well summary statistics, 2016
Annual Annual Annual Annual Annual Annual
oil Oil rate gas Gas rate gas Gas rate oil Oil rate oil gas Horizontal
Prod. rate bracket # of oil % of oil prod. % of oil per Well prod. per well # of gas % of gas prod. % of gas per well prod. per well # of total prod. prod. well
(BOE/day) wells wells (MMbbl) prod. (bbl/day) (Bcf) (Mcf/day) wells wells (Bcf) Prod. (Mcf/Day) (MMbbl) (bbl/Day) wells (MMbbl) (Bcf) count
0 ‐ 1 278 2.0 0.0 0.0 0.4 0.0 0.2 141 31.0 0.1 0.5 2.1 0.0 0.0 419 0.0 0.1 97
1 ‐ 2 198 1.4 0.1 0.0 1.4 0.0 0.6 49 10.8 0.1 0.9 8.5 0.0 0.1 247 0.1 0.2 57
2 ‐ 4 358 2.6 0.3 0.1 2.8 0.2 1.4 65 14.3 0.3 2.1 15.3 0.0 0.4 423 0.3 0.5 107
4 ‐ 6 274 2.0 0.4 0.1 4.5 0.2 2.5 47 10.3 0.4 2.4 25.3 0.0 0.7 321 0.4 0.6 113
6 ‐ 8 262 1.9 0.5 0.2 6.3 0.4 4.4 20 4.4 0.2 1.4 33.1 0.0 1.4 282 0.6 0.6 125
8 ‐ 10 234 1.7 0.6 0.2 8.0 0.5 6.3 12 2.6 0.1 0.9 39.7 0.0 2.4 246 0.6 0.7 130
Subtotal <=10 1,604 11.5 2.0 0.5 4.0 1.3 2.6 334 73.4 1.3 8.2 12.8 0.0 0.4 1,938 2.1 2.6 629
10 ‐ 12 193 1.4 0.6 0.2 9.5 0.6 8.3 6 1.3 0.1 0.4 40.4 0.0 4.3 199 0.6 0.6 117
12 ‐ 15 308 2.2 1.3 0.3 11.8 1.2 10.7 10 2.2 0.2 1.1 56.5 0.0 4.1 318 1.3 1.3 220
Subtotal <=15 2,105 15.1 3.9 1.0 5.8 3.0 4.5 350 76.9 1.5 9.7 14.5 0.1 0.6 2,455 4.0 4.6 966
15 ‐ 20 459 3.3 2.4 0.6 15.1 2.4 15.0 15 3.3 0.3 2.0 77.3 0.0 4.7 474 2.4 2.7 354
20 ‐ 25 457 3.3 3.1 0.8 19.1 3.3 20.4 7 1.5 0.2 1.4 86.2 0.0 8.0 464 3.1 3.5 376
25 ‐ 30 474 3.4 3.9 1.0 23.4 4.3 25.3 5 1.1 0.1 0.9 97.3 0.0 11.3 479 3.9 4.4 421
30 ‐ 40 991 7.1 10.5 2.8 29.3 12.5 35.1 16 3.5 0.8 5.1 144.2 0.1 11.3 1,007 10.5 13.3 946
40 ‐ 50 945 6.8 12.6 3.4 37.1 16.3 47.8 5 1.1 0.3 1.8 189.7 0.0 12.3 950 12.6 16.6 929
50 ‐ 100 4,037 29.0 85.9 22.8 58.8 125.9 86.2 21 4.6 2.1 13.3 286.1 0.2 25.5 4,058 86.1 128.0 4,013
Subtotal <=100 9,468 67.9 122.3 32.5 36.8 167.7 50.4 419 92.1 5.4 34.1 42.0 0.4 3.0 9,887 122.7 173.1 8,005
100 ‐ 200 2,825 20.3 109.8 29.2 108.1 172.6 170.1 19 4.2 4.3 27.0 642.4 0.3 37.9 2,844 110.0 176.9 2,823
200 ‐ 400 1,035 7.4 73.5 19.5 215.2 121.4 355.5 16 3.5 5.0 31.5 860.1 0.6 101.1 1,051 74.1 126.3 1,048
400 ‐ 800 485 3.5 55.7 14.8 419.0 96.3 724.9 1 0.2 1.2 7.4 3,199.8 0.0 41.9 486 55.7 97.5 485
800 ‐ 1,600 124 0.9 15.0 4.0 784.4 26.8 1,400.9 0 0.0 0.0 0.0 0.0 0.0 0.0 124 15.0 26.8 124
1,600 ‐ 3,200 5 0.0 0.3 0.1 1,451.1 0.4 1,823.0 0 0.0 0.0 0.0 0.0 0.0 0.0 5 0.3 0.4 5
3,200 ‐ 6,400 0 0.0 0.0 0.0 0.0 0.0 0.0 0 0.0 0.0 0.0 0.0 0.0 0.0 0 0.0 0.0 0
6,400 ‐ 12,800 0 0.0 0.0 0.0 0.0 0.0 0.0 0 0.0 0.0 0.0 0.0 0.0 0.0 0 0.0 0.0 0
> 12,800 0 0.0 0.0 0.0 0.0 0.0 0.0 0 0.0 0.0 0.0 0.0 0.0 0.0 0 0.0 0.0 0
Total 13,942 100.0 376.6 100.0 77.9 585.2 121.1 455 100.0 15.7 100.0 112.2 1.2 8.8 14,397 377.8 601.0 12,490
Notes:
1) Source: State administrative oil & natural gas data thru DrillingInfo.
2) The total volumes shown in the distribution tables may not exactly agree with other related data, including other EIA sources. Major reasons for differences include: the timing of updates from state and commercial sources,
the summed production of available well‐level production data versus state‐level aggregations of production, and how a well is defined and which entities are counted and summed.
3) Wells counted for this report include sidetracks, completions, re‐completions and leases, this includes all oil and/or gas producing 'entities' available in DrillingInfo database.
4) For late reporting states the last year of available data is repeated for missing years (TN 2012 used for 2013‐16, KY 2013 used for 2014‐16 and MO 2014 for 2015‐16). All years are missing for IL and IN.
5) To be consistent between states a GOR of 6,000 (cf/bbl) for each years production was used to define oil versus gas wells. If the GOR was less (greater) than 6,000 (cf/bbl) the well was classed an oil (gas) well.
6) To determine production rate brackets for the first and last year of a wells life the annual production was divided
by the number of days in the productive months. For other years the annual production was divided by 365 or 366 days.
7) Gas volumes have been converted from the various state pressure bases to the Federal base (14.73 psia).
Data available as of November 2017.
Oil wells Gas wells Total wells
U.S. Energy Information Administration | The Distribution of U.S. Oil and Natural Gas Wells by Production Rate B35

December 2017
Table B36. Nebraska oil and gas well summary statistics, 2016
Annual Annual Annual Annual Annual Annual
oil Oil rate gas Gas rate gas Gas rate oil Oil rate oil gas Horizontal
Prod. rate bracket # of oil % of oil prod. % of oil per Well prod. per well # of gas % of gas prod. % of gas per well prod. per well # of total prod. prod. well
(BOE/day) wells wells (MMbbl) prod. (bbl/day) (Bcf) (Mcf/day) wells wells (Bcf) Prod. (Mcf/Day) (MMbbl) (bbl/Day) wells (MMbbl) (Bcf) count
0 ‐ 1 734 34.7 0.1 6.8 0.6 0.0 0.0 57 38.3 0.0 9.7 2.2 0.0 0.0 791 0.1 0.0 0
1 ‐ 2 638 30.2 0.4 16.9 1.6 0.0 0.0 43 28.9 0.1 29.6 9.0 0.0 0.0 681 0.4 0.1 0
2 ‐ 4 369 17.5 0.4 17.6 2.8 0.0 0.0 49 32.9 0.3 60.7 15.9 0.0 0.0 418 0.4 0.3 0
4 ‐ 6 145 6.9 0.3 12.0 5.0 0.0 0.6 0 0.0 0.0 0.0 0.0 0.0 0.0 145 0.3 0.0 0
6 ‐ 8 80 3.8 0.2 9.2 6.9 0.0 0.6 0 0.0 0.0 0.0 0.0 0.0 0.0 80 0.2 0.0 0
8 ‐ 10 41 1.9 0.1 6.3 9.1 0.0 0.0 0 0.0 0.0 0.0 0.0 0.0 0.0 41 0.1 0.0 0
Subtotal <=10 2,007 94.9 1.5 68.6 2.0 0.1 0.1 149 100.0 0.5 100.0 8.7 0.0 0.0 2,156 1.5 0.5 0
10 ‐ 12 21 1.0 0.1 3.8 10.9 0.0 0.0 0 0.0 0.0 0.0 0.0 0.0 0.0 21 0.1 0.0 0
12 ‐ 15 31 1.5 0.1 7.0 13.4 0.0 0.0 0 0.0 0.0 0.0 0.0 0.0 0.0 31 0.1 0.0 0
Subtotal <=15 2,059 97.4 1.7 79.4 2.3 0.1 0.1 149 100.0 0.5 100.0 8.7 0.0 0.0 2,208 1.7 0.5 0
15 ‐ 20 24 1.1 0.1 6.4 17.5 0.0 0.0 0 0.0 0.0 0.0 0.0 0.0 0.0 24 0.1 0.0 1
20 ‐ 25 7 0.3 0.0 2.0 21.2 0.0 0.0 0 0.0 0.0 0.0 0.0 0.0 0.0 7 0.0 0.0 0
25 ‐ 30 9 0.4 0.1 2.6 26.7 0.0 0.0 0 0.0 0.0 0.0 0.0 0.0 0.0 9 0.1 0.0 0
30 ‐ 40 8 0.4 0.1 4.0 35.6 0.0 0.0 0 0.0 0.0 0.0 0.0 0.0 0.0 8 0.1 0.0 0
40 ‐ 50 5 0.2 0.1 3.9 44.9 0.0 0.0 0 0.0 0.0 0.0 0.0 0.0 0.0 5 0.1 0.0 0
50 ‐ 100 3 0.1 0.0 1.8 63.9 0.0 0.0 0 0.0 0.0 0.0 0.0 0.0 0.0 3 0.0 0.0 0
Subtotal <=100 2,115 100.0 2.1 100.0 2.8 0.1 0.1 149 100.0 0.5 100.0 8.7 0.0 0.0 2,264 2.1 0.5 1
100 ‐ 200 0 0.0 0.0 0.0 0.0 0.0 0.0 0 0.0 0.0 0.0 0.0 0.0 0.0 0 0.0 0.0 0
200 ‐ 400 0 0.0 0.0 0.0 0.0 0.0 0.0 0 0.0 0.0 0.0 0.0 0.0 0.0 0 0.0 0.0 0
400 ‐ 800 0 0.0 0.0 0.0 0.0 0.0 0.0 0 0.0 0.0 0.0 0.0 0.0 0.0 0 0.0 0.0 0
800 ‐ 1,600 0 0.0 0.0 0.0 0.0 0.0 0.0 0 0.0 0.0 0.0 0.0 0.0 0.0 0 0.0 0.0 0
1,600 ‐ 3,200 0 0.0 0.0 0.0 0.0 0.0 0.0 0 0.0 0.0 0.0 0.0 0.0 0.0 0 0.0 0.0 0
3,200 ‐ 6,400 0 0.0 0.0 0.0 0.0 0.0 0.0 0 0.0 0.0 0.0 0.0 0.0 0.0 0 0.0 0.0 0
6,400 ‐ 12,800 0 0.0 0.0 0.0 0.0 0.0 0.0 0 0.0 0.0 0.0 0.0 0.0 0.0 0 0.0 0.0 0
> 12,800 0 0.0 0.0 0.0 0.0 0.0 0.0 0 0.0 0.0 0.0 0.0 0.0 0.0 0 0.0 0.0 0
Total 2,115 100.0 2.1 100.0 2.8 0.1 0.1 149 100.0 0.5 100.0 8.7 0.0 0.0 2,264 2.1 0.5 1
Notes:
1) Source: State administrative oil & natural gas data thru DrillingInfo.
2) The total volumes shown in the distribution tables may not exactly agree with other related data, including other EIA sources. Major reasons for differences include: the timing of updates from state and commercial sources,
the summed production of available well‐level production data versus state‐level aggregations of production, and how a well is defined and which entities are counted and summed.
3) Wells counted for this report include sidetracks, completions, re‐completions and leases, this includes all oil and/or gas producing 'entities' available in DrillingInfo database.
4) For late reporting states the last year of available data is repeated for missing years (TN 2012 used for 2013‐16, KY 2013 used for 2014‐16 and MO 2014 for 2015‐16). All years are missing for IL and IN.
5) To be consistent between states a GOR of 6,000 (cf/bbl) for each years production was used to define oil versus gas wells. If the GOR was less (greater) than 6,000 (cf/bbl) the well was classed an oil (gas) well.
6) To determine production rate brackets for the first and last year of a wells life the annual production was divided
by the number of days in the productive months. For other years the annual production was divided by 365 or 366 days.
7) Gas volumes have been converted from the various state pressure bases to the Federal base (14.73 psia).
Data available as of November 2017.
Oil wells Gas wells Total wells
U.S. Energy Information Administration | The Distribution of U.S. Oil and Natural Gas Wells by Production Rate B36

December 2017
Table B37. New Mexico oil and gas well summary statistics, 2016
Annual Annual Annual Annual Annual Annual
oil Oil rate gas Gas rate gas Gas rate oil Oil rate oil gas Horizontal
Prod. rate bracket # of oil % of oil prod. % of oil per Well prod. per well # of gas % of gas prod. % of gas per well prod. per well # of total prod. prod. well
(BOE/day) wells wells (MMbbl) prod. (bbl/day) (Bcf) (Mcf/day) wells wells (Bcf) Prod. (Mcf/Day) (MMbbl) (bbl/Day) wells (MMbbl) (Bcf) count
0 ‐ 1 3,488 19.7 0.4 0.4 0.4 0.3 0.2 4,790 11.8 3.4 0.3 2.3 0.0 0.0 8,278 0.5 3.7 95
1 ‐ 2 2,128 12.0 0.9 0.7 1.2 1.0 1.4 3,197 7.9 9.2 0.9 8.4 0.1 0.1 5,325 1.0 10.2 71
2 ‐ 4 2,557 14.4 2.1 1.7 2.3 3.0 3.4 5,687 14.0 32.5 3.2 16.4 0.4 0.2 8,244 2.5 35.5 137
4 ‐ 6 1,696 9.6 2.3 1.9 3.9 3.8 6.5 4,831 11.9 46.8 4.6 27.6 0.6 0.4 6,527 2.9 50.6 176
6 ‐ 8 1,128 6.4 2.1 1.7 5.2 4.0 10.1 4,059 10.0 55.4 5.4 38.9 0.7 0.5 5,187 2.7 59.4 187
8 ‐ 10 888 5.0 2.1 1.7 6.6 4.3 13.9 3,264 8.1 57.3 5.6 50.3 0.7 0.6 4,152 2.7 61.7 161
Subtotal <=10 11,885 66.9 9.8 8.1 2.5 16.4 4.1 25,828 63.7 204.6 19.9 23.3 2.5 0.3 37,713 12.3 221.0 827
10 ‐ 12 603 3.4 1.7 1.4 8.1 3.7 17.4 2,688 6.6 57.8 5.6 61.6 0.6 0.7 3,291 2.4 61.5 158
12 ‐ 15 677 3.8 2.3 1.9 9.9 5.1 21.6 2,900 7.2 76.4 7.4 75.5 0.9 0.8 3,577 3.2 81.5 208
Subtotal <=15 13,165 74.2 13.9 11.5 3.1 25.3 5.7 31,416 77.5 338.8 33.0 31.5 4.0 0.4 44,581 17.9 364.1 1,193
15 ‐ 20 771 4.3 3.5 2.9 13.0 7.0 26.0 2,902 7.2 97.7 9.5 97.5 1.0 1.0 3,673 4.5 104.7 359
20 ‐ 25 517 2.9 3.0 2.5 16.5 6.3 34.8 1,712 4.2 72.2 7.0 125.7 0.8 1.3 2,229 3.7 78.5 309
25 ‐ 30 347 2.0 2.4 2.0 19.9 5.5 44.9 985 2.4 51.0 5.0 153.3 0.6 1.7 1,332 3.0 56.5 204
30 ‐ 40 528 3.0 4.7 3.9 25.1 10.6 57.0 1,121 2.8 71.6 7.0 192.2 0.9 2.3 1,649 5.5 82.2 363
40 ‐ 50 382 2.2 4.3 3.6 31.7 10.6 78.3 606 1.5 48.8 4.8 246.4 0.7 3.5 988 5.0 59.4 349
50 ‐ 100 907 5.1 16.4 13.6 50.8 38.2 118.2 1,115 2.8 132.4 12.9 362.0 3.1 8.4 2,022 19.5 170.6 1,010
Subtotal <=100 16,617 93.6 48.1 39.8 8.5 103.4 18.3 39,857 98.3 812.5 79.0 59.8 11.0 0.8 56,474 59.2 915.9 3,787
100 ‐ 200 519 2.9 18.0 14.8 99.7 43.6 242.1 444 1.1 92.6 9.0 626.4 4.9 33.3 963 22.9 136.1 746
200 ‐ 400 284 1.6 18.1 15.0 199.5 43.1 474.2 185 0.5 71.2 6.9 1,153.5 5.0 81.1 469 23.1 114.3 403
400 ‐ 800 226 1.3 23.3 19.3 382.1 60.2 985.2 52 0.1 38.6 3.8 2,150.3 3.5 194.3 278 26.8 98.8 269
800 ‐ 1,600 93 0.5 11.4 9.4 762.0 24.7 1,660.5 16 0.0 13.3 1.3 4,054.8 1.3 398.8 109 12.7 38.0 109
1,600 ‐ 3,200 15 0.1 2.1 1.7 1,307.9 4.3 2,702.7 0 0.0 0.0 0.0 0.0 0.0 0.0 15 2.1 4.3 15
3,200 ‐ 6,400 0 0.0 0.0 0.0 0.0 0.0 0.0 0 0.0 0.0 0.0 0.0 0.0 0.0 0 0.0 0.0 0
6,400 ‐ 12,800 0 0.0 0.0 0.0 0.0 0.0 0.0 0 0.0 0.0 0.0 0.0 0.0 0.0 0 0.0 0.0 0
> 12,800 0 0.0 0.0 0.0 0.0 0.0 0.0 0 0.0 0.0 0.0 0.0 0.0 0.0 0 0.0 0.0 0
Total 17,754 100.0 121.0 100.0 20.2 279.3 46.5 40,554 100.0 1,028.1 100.0 74.4 25.7 1.9 58,308 146.7 1,307.4 5,329
Notes:
1) Source: State administrative oil & natural gas data thru DrillingInfo.
2) The total volumes shown in the distribution tables may not exactly agree with other related data, including other EIA sources. Major reasons for differences include: the timing of updates from state and commercial sources,
the summed production of available well‐level production data versus state‐level aggregations of production, and how a well is defined and which entities are counted and summed.
3) Wells counted for this report include sidetracks, completions, re‐completions and leases, this includes all oil and/or gas producing 'entities' available in DrillingInfo database.
4) For late reporting states the last year of available data is repeated for missing years (TN 2012 used for 2013‐16, KY 2013 used for 2014‐16 and MO 2014 for 2015‐16). All years are missing for IL and IN.
5) To be consistent between states a GOR of 6,000 (cf/bbl) for each years production was used to define oil versus gas wells. If the GOR was less (greater) than 6,000 (cf/bbl) the well was classed an oil (gas) well.
6) To determine production rate brackets for the first and last year of a wells life the annual production was divided
by the number of days in the productive months. For other years the annual production was divided by 365 or 366 days.
7) Gas volumes have been converted from the various state pressure bases to the Federal base (14.73 psia).
Data available as of November 2017.
Oil wells Gas wells Total wells
U.S. Energy Information Administration | The Distribution of U.S. Oil and Natural Gas Wells by Production Rate B37

December 2017
Table B38. Nevada oil and gas well summary statistics, 2016
Annual Annual Annual Annual Annual Annual
oil Oil rate gas Gas rate gas Gas rate oil Oil rate oil gas Horizontal
Prod. rate bracket # of oil % of oil prod. % of oil per Well prod. per well # of gas % of gas prod. % of gas per well prod. per well # of total prod. prod. well
(BOE/day) wells wells (MMbbl) prod. (bbl/day) (Bcf) (Mcf/day) wells wells (Bcf) Prod. (Mcf/Day) (MMbbl) (bbl/Day) wells (MMbbl) (Bcf) count
0 ‐ 1 13 19.4 0.0 0.5 0.4 0.0 0.0 0 0.0 0.0 0.0 0.0 0.0 0.0 13 0.0 0.0 0
1 ‐ 2 6 9.0 0.0 0.8 1.4 0.0 0.0 0 0.0 0.0 0.0 0.0 0.0 0.0 6 0.0 0.0 0
2 ‐ 4 6 9.0 0.0 1.7 3.0 0.0 0.0 0 0.0 0.0 0.0 0.0 0.0 0.0 6 0.0 0.0 0
4 ‐ 6 5 7.5 0.0 3.3 5.1 0.0 0.0 0 0.0 0.0 0.0 0.0 0.0 0.0 5 0.0 0.0 0
6 ‐ 8 5 7.5 0.0 4.0 7.1 0.0 0.0 0 0.0 0.0 0.0 0.0 0.0 0.0 5 0.0 0.0 0
8 ‐ 10 5 7.5 0.0 6.3 9.5 0.0 0.0 0 0.0 0.0 0.0 0.0 0.0 0.0 5 0.0 0.0 0
Subtotal <=10 40 59.7 0.0 16.5 3.9 0.0 0.0 0 0.0 0.0 0.0 0.0 0.0 0.0 40 0.0 0.0 0
10 ‐ 12 3 4.5 0.0 4.2 10.7 0.0 0.0 0 0.0 0.0 0.0 0.0 0.0 0.0 3 0.0 0.0 0
12 ‐ 15 6 9.0 0.0 10.9 13.7 0.0 0.0 0 0.0 0.0 0.0 0.0 0.0 0.0 6 0.0 0.0 0
Subtotal <=15 49 73.1 0.1 31.6 5.8 0.0 0.0 0 0.0 0.0 0.0 0.0 0.0 0.0 49 0.1 0.0 0
15 ‐ 20 7 10.5 0.0 13.2 16.2 0.0 0.4 0 0.0 0.0 0.0 0.0 0.0 0.0 7 0.0 0.0 0
20 ‐ 25 1 1.5 0.0 3.3 24.8 0.0 0.0 0 0.0 0.0 0.0 0.0 0.0 0.0 1 0.0 0.0 0
25 ‐ 30 4 6.0 0.0 14.2 26.8 0.0 0.0 0 0.0 0.0 0.0 0.0 0.0 0.0 4 0.0 0.0 0
30 ‐ 40 3 4.5 0.0 14.2 35.8 0.0 0.0 0 0.0 0.0 0.0 0.0 0.0 0.0 3 0.0 0.0 0
40 ‐ 50 2 3.0 0.0 11.9 45.1 0.0 1.8 0 0.0 0.0 0.0 0.0 0.0 0.0 2 0.0 0.0 0
50 ‐ 100 1 1.5 0.0 11.6 87.6 0.0 0.0 0 0.0 0.0 0.0 0.0 0.0 0.0 1 0.0 0.0 0
Subtotal <=100 67 100.0 0.3 100.0 12.9 0.0 0.1 0 0.0 0.0 0.0 0.0 0.0 0.0 67 0.3 0.0 0
100 ‐ 200 0 0.0 0.0 0.0 0.0 0.0 0.0 0 0.0 0.0 0.0 0.0 0.0 0.0 0 0.0 0.0 0
200 ‐ 400 0 0.0 0.0 0.0 0.0 0.0 0.0 0 0.0 0.0 0.0 0.0 0.0 0.0 0 0.0 0.0 0
400 ‐ 800 0 0.0 0.0 0.0 0.0 0.0 0.0 0 0.0 0.0 0.0 0.0 0.0 0.0 0 0.0 0.0 0
800 ‐ 1,600 0 0.0 0.0 0.0 0.0 0.0 0.0 0 0.0 0.0 0.0 0.0 0.0 0.0 0 0.0 0.0 0
1,600 ‐ 3,200 0 0.0 0.0 0.0 0.0 0.0 0.0 0 0.0 0.0 0.0 0.0 0.0 0.0 0 0.0 0.0 0
3,200 ‐ 6,400 0 0.0 0.0 0.0 0.0 0.0 0.0 0 0.0 0.0 0.0 0.0 0.0 0.0 0 0.0 0.0 0
6,400 ‐ 12,800 0 0.0 0.0 0.0 0.0 0.0 0.0 0 0.0 0.0 0.0 0.0 0.0 0.0 0 0.0 0.0 0
> 12,800 0 0.0 0.0 0.0 0.0 0.0 0.0 0 0.0 0.0 0.0 0.0 0.0 0.0 0 0.0 0.0 0
Total 67 100.0 0.3 100.0 12.9 0.0 0.1 0 0.0 0.0 0.0 0.0 0.0 0.0 67 0.3 0.0 0
Notes:
1) Source: State administrative oil & natural gas data thru DrillingInfo.
2) The total volumes shown in the distribution tables may not exactly agree with other related data, including other EIA sources. Major reasons for differences include: the timing of updates from state and commercial sources,
the summed production of available well‐level production data versus state‐level aggregations of production, and how a well is defined and which entities are counted and summed.
3) Wells counted for this report include sidetracks, completions, re‐completions and leases, this includes all oil and/or gas producing 'entities' available in DrillingInfo database.
4) For late reporting states the last year of available data is repeated for missing years (TN 2012 used for 2013‐16, KY 2013 used for 2014‐16 and MO 2014 for 2015‐16). All years are missing for IL and IN.
5) To be consistent between states a GOR of 6,000 (cf/bbl) for each years production was used to define oil versus gas wells. If the GOR was less (greater) than 6,000 (cf/bbl) the well was classed an oil (gas) well.
6) To determine production rate brackets for the first and last year of a wells life the annual production was divided
by the number of days in the productive months. For other years the annual production was divided by 365 or 366 days.
7) Gas volumes have been converted from the various state pressure bases to the Federal base (14.73 psia).
Data available as of November 2017.
Oil wells Gas wells Total wells
U.S. Energy Information Administration | The Distribution of U.S. Oil and Natural Gas Wells by Production Rate B38

December 2017
Table B39. New York oil and gas well summary statistics, 2016
Annual Annual Annual Annual Annual Annual
oil Oil rate gas Gas rate gas Gas rate oil Oil rate oil gas Horizontal
Prod. rate bracket # of oil % of oil prod. % of oil per Well prod. per well # of gas % of gas prod. % of gas per well prod. per well # of total prod. prod. well
(BOE/day) wells wells (MMbbl) prod. (bbl/day) (Bcf) (Mcf/day) wells wells (Bcf) Prod. (Mcf/Day) (MMbbl) (bbl/Day) wells (MMbbl) (Bcf) count
0 ‐ 1 2,565 84.3 0.1 56.9 0.2 0.2 0.4 6,577 86.3 4.3 32.3 2.0 0.0 0.0 9,142 0.1 4.5 10
1 ‐ 2 246 8.1 0.0 20.6 1.2 0.0 1.1 761 10.0 2.2 16.8 8.0 0.0 0.0 1,007 0.0 2.3 8
2 ‐ 4 132 4.3 0.0 8.2 2.6 0.0 1.1 176 2.3 1.0 7.9 16.2 0.0 0.0 308 0.0 1.0 9
4 ‐ 6 55 1.8 0.0 6.9 4.7 0.0 0.8 31 0.4 0.3 2.4 27.7 0.0 0.0 86 0.0 0.3 3
6 ‐ 8 19 0.6 0.0 3.3 6.4 0.0 0.0 13 0.2 0.2 1.4 39.9 0.0 0.0 32 0.0 0.2 3
8 ‐ 10 19 0.6 0.0 2.4 8.5 0.0 0.0 12 0.2 0.2 1.8 53.5 0.0 0.0 31 0.0 0.2 6
Subtotal <=10 3,036 99.8 0.2 98.3 0.3 0.3 0.4 7,570 99.3 8.3 62.6 3.3 0.0 0.0 10,606 0.2 8.5 39
10 ‐ 12 0 0.0 0.0 0.0 0.0 0.0 0.0 1 0.0 0.0 0.2 68.0 0.0 0.0 1 0.0 0.0 0
12 ‐ 15 2 0.1 0.0 0.4 12.9 0.0 0.0 6 0.1 0.2 1.3 79.9 0.0 0.0 8 0.0 0.2 3
Subtotal <=15 3,038 99.8 0.2 98.7 0.3 0.3 0.4 7,577 99.4 8.5 64.1 3.4 0.0 0.0 10,615 0.2 8.7 42
15 ‐ 20 5 0.2 0.0 1.3 17.8 0.0 0.0 16 0.2 0.6 4.7 106.0 0.0 0.0 21 0.0 0.6 7
20 ‐ 25 0 0.0 0.0 0.0 0.0 0.0 0.0 6 0.1 0.3 2.2 133.1 0.0 0.0 6 0.0 0.3 2
25 ‐ 30 0 0.0 0.0 0.0 0.0 0.0 0.0 4 0.1 0.2 1.8 165.9 0.0 0.0 4 0.0 0.2 3
30 ‐ 40 0 0.0 0.0 0.0 0.0 0.0 0.0 6 0.1 0.5 3.6 219.0 0.0 0.0 6 0.0 0.5 2
40 ‐ 50 0 0.0 0.0 0.0 0.0 0.0 0.0 2 0.0 0.2 1.6 283.3 0.0 0.0 2 0.0 0.2 1
50 ‐ 100 0 0.0 0.0 0.0 0.0 0.0 0.0 8 0.1 1.1 8.6 388.3 0.0 0.0 8 0.0 1.1 0
Subtotal <=100 3,043 100.0 0.2 100.0 0.3 0.3 0.4 7,619 99.9 11.4 86.7 4.6 0.0 0.0 10,662 0.2 11.7 57
100 ‐ 200 0 0.0 0.0 0.0 0.0 0.0 0.0 3 0.0 0.8 5.8 690.8 0.0 0.0 3 0.0 0.8 2
200 ‐ 400 0 0.0 0.0 0.0 0.0 0.0 0.0 2 0.0 1.0 7.6 1,364.8 0.0 0.0 2 0.0 1.0 1
400 ‐ 800 0 0.0 0.0 0.0 0.0 0.0 0.0 0 0.0 0.0 0.0 0.0 0.0 0.0 0 0.0 0.0 0
800 ‐ 1,600 0 0.0 0.0 0.0 0.0 0.0 0.0 0 0.0 0.0 0.0 0.0 0.0 0.0 0 0.0 0.0 0
1,600 ‐ 3,200 0 0.0 0.0 0.0 0.0 0.0 0.0 0 0.0 0.0 0.0 0.0 0.0 0.0 0 0.0 0.0 0
3,200 ‐ 6,400 0 0.0 0.0 0.0 0.0 0.0 0.0 0 0.0 0.0 0.0 0.0 0.0 0.0 0 0.0 0.0 0
6,400 ‐ 12,800 0 0.0 0.0 0.0 0.0 0.0 0.0 0 0.0 0.0 0.0 0.0 0.0 0.0 0 0.0 0.0 0
> 12,800 0 0.0 0.0 0.0 0.0 0.0 0.0 0 0.0 0.0 0.0 0.0 0.0 0.0 0 0.0 0.0 0
Total 3,043 100.0 0.2 100.0 0.3 0.3 0.4 7,624 100.0 13.2 100.0 5.3 0.0 0.0 10,667 0.2 13.4 60
Notes:
1) Source: State administrative oil & natural gas data thru DrillingInfo.
2) The total volumes shown in the distribution tables may not exactly agree with other related data, including other EIA sources. Major reasons for differences include: the timing of updates from state and commercial sources,
the summed production of available well‐level production data versus state‐level aggregations of production, and how a well is defined and which entities are counted and summed.
3) Wells counted for this report include sidetracks, completions, re‐completions and leases, this includes all oil and/or gas producing 'entities' available in DrillingInfo database.
4) For late reporting states the last year of available data is repeated for missing years (TN 2012 used for 2013‐16, KY 2013 used for 2014‐16 and MO 2014 for 2015‐16). All years are missing for IL and IN.
5) To be consistent between states a GOR of 6,000 (cf/bbl) for each years production was used to define oil versus gas wells. If the GOR was less (greater) than 6,000 (cf/bbl) the well was classed an oil (gas) well.
6) To determine production rate brackets for the first and last year of a wells life the annual production was divided
by the number of days in the productive months. For other years the annual production was divided by 365 or 366 days.
7) Gas volumes have been converted from the various state pressure bases to the Federal base (14.73 psia).
Data available as of November 2017.
Oil wells Gas wells Total wells
U.S. Energy Information Administration | The Distribution of U.S. Oil and Natural Gas Wells by Production Rate B39

December 2017
Table B40. Ohio oil and gas well summary statistics, 2016
Annual Annual Annual Annual Annual Annual
oil Oil rate gas Gas rate gas Gas rate oil Oil rate oil gas Horizontal
Prod. rate bracket # of oil % of oil prod. % of oil per Well prod. per well # of gas % of gas prod. % of gas per well prod. per well # of total prod. prod. well
(BOE/day) wells wells (MMbbl) prod. (bbl/day) (Bcf) (Mcf/day) wells wells (Bcf) Prod. (Mcf/Day) (MMbbl) (bbl/Day) wells (MMbbl) (Bcf) count
0 ‐ 1 10,846 84.0 1.0 15.2 0.3 1.3 0.4 23,747 75.6 15.2 1.1 1.8 0.3 0.0 34,593 1.3 16.6 17
1 ‐ 2 1,250 9.7 0.5 6.9 1.0 1.0 2.2 4,061 12.9 10.9 0.8 7.4 0.2 0.2 5,311 0.7 11.8 3
2 ‐ 4 489 3.8 0.4 5.4 2.0 0.7 3.9 1,602 5.1 8.3 0.6 14.5 0.2 0.3 2,091 0.5 9.0 3
4 ‐ 6 108 0.8 0.1 2.1 3.7 0.3 6.7 310 1.0 2.8 0.2 25.6 0.1 0.5 418 0.2 3.1 3
6 ‐ 8 55 0.4 0.1 1.7 5.5 0.2 8.4 111 0.4 1.4 0.1 36.2 0.0 0.9 166 0.1 1.5 3
8 ‐ 10 26 0.2 0.1 0.9 6.4 0.1 14.6 61 0.2 1.0 0.1 47.9 0.0 0.9 87 0.1 1.1 3
Subtotal <=10 12,774 99.0 2.1 32.2 0.5 3.6 0.8 29,892 95.1 39.6 2.8 3.7 0.8 0.1 42,666 2.9 43.2 32
10 ‐ 12 18 0.1 0.1 0.8 8.4 0.1 15.6 31 0.1 0.6 0.0 57.7 0.0 1.3 49 0.1 0.7 3
12 ‐ 15 15 0.1 0.1 0.9 10.8 0.1 15.1 24 0.1 0.6 0.0 73.4 0.0 1.1 39 0.1 0.7 1
Subtotal <=15 12,807 99.2 2.3 33.9 0.5 3.8 0.8 29,947 95.3 40.8 2.9 3.8 0.8 0.1 42,754 3.1 44.5 36
15 ‐ 20 12 0.1 0.1 0.9 13.0 0.1 25.0 21 0.1 0.6 0.0 96.5 0.0 1.3 33 0.1 0.7 3
20 ‐ 25 9 0.1 0.0 0.7 14.9 0.1 39.0 17 0.1 0.7 0.1 121.6 0.0 1.9 26 0.1 0.8 8
25 ‐ 30 2 0.0 0.0 0.3 25.1 0.0 22.6 15 0.1 0.8 0.1 145.0 0.0 3.5 17 0.0 0.8 7
30 ‐ 40 7 0.1 0.1 1.0 25.1 0.1 55.5 18 0.1 1.1 0.1 178.5 0.0 5.6 25 0.1 1.2 12
40 ‐ 50 6 0.1 0.1 0.8 25.3 0.3 119.7 16 0.1 1.2 0.1 207.8 0.1 11.1 22 0.1 1.5 20
50 ‐ 100 11 0.1 0.2 2.3 41.9 0.7 198.3 152 0.5 20.8 1.5 377.0 0.9 15.6 163 1.0 21.5 158
Subtotal <=100 12,854 99.6 2.6 39.8 0.6 5.1 1.1 30,186 96.1 66.0 4.7 6.1 1.8 0.2 43,040 4.5 71.1 244
100 ‐ 200 5 0.0 0.1 2.1 82.1 0.7 410.3 270 0.9 74.3 5.3 758.8 1.9 19.3 275 2.0 75.0 275
200 ‐ 400 18 0.1 1.0 15.1 167.5 5.0 835.2 328 1.0 171.2 12.1 1,459.4 5.1 43.1 346 6.1 176.2 346
400 ‐ 800 27 0.2 2.4 36.6 290.2 11.6 1,379.9 287 0.9 286.4 20.3 3,004.8 4.8 50.7 314 7.3 297.9 314
800 ‐ 1,600 2 0.0 0.2 2.6 558.3 0.8 2,524.9 229 0.7 472.3 33.5 6,639.3 1.3 17.7 231 1.4 473.1 229
1,600 ‐ 3,200 1 0.0 0.3 4.0 1,075.4 1.4 5,728.3 126 0.4 333.8 23.7 12,541.2 0.1 2.8 127 0.3 335.2 127
3,200 ‐ 6,400 0 0.0 0.0 0.0 0.0 0.0 0.0 2 0.0 4.5 0.3 29,761.7 0.0 0.0 2 0.0 4.5 2
6,400 ‐ 12,800 0 0.0 0.0 0.0 0.0 0.0 0.0 0 0.0 0.0 0.0 0.0 0.0 0.0 0 0.0 0.0 0
> 12,800 0 0.0 0.0 0.0 0.0 0.0 0.0 1 0.0 2.7 0.2 87,704.2 0.0 0.0 1 0.0 2.7 1
Total 12,907 100.0 6.7 100.0 1.5 24.6 5.4 31,429 100.0 1,411.3 100.0 125.9 14.9 1.3 44,336 21.6 1,435.8 1,538
Notes:
1) Source: State administrative oil & natural gas data thru DrillingInfo.
2) The total volumes shown in the distribution tables may not exactly agree with other related data, including other EIA sources. Major reasons for differences include: the timing of updates from state and commercial sources,
the summed production of available well‐level production data versus state‐level aggregations of production, and how a well is defined and which entities are counted and summed.
3) Wells counted for this report include sidetracks, completions, re‐completions and leases, this includes all oil and/or gas producing 'entities' available in DrillingInfo database.
4) For late reporting states the last year of available data is repeated for missing years (TN 2012 used for 2013‐16, KY 2013 used for 2014‐16 and MO 2014 for 2015‐16). All years are missing for IL and IN.
5) To be consistent between states a GOR of 6,000 (cf/bbl) for each years production was used to define oil versus gas wells. If the GOR was less (greater) than 6,000 (cf/bbl) the well was classed an oil (gas) well.
6) To determine production rate brackets for the first and last year of a wells life the annual production was divided
by the number of days in the productive months. For other years the annual production was divided by 365 or 366 days.
7) Gas volumes have been converted from the various state pressure bases to the Federal base (14.73 psia).
Data available as of November 2017.
Oil wells Gas wells Total wells
U.S. Energy Information Administration | The Distribution of U.S. Oil and Natural Gas Wells by Production Rate B40
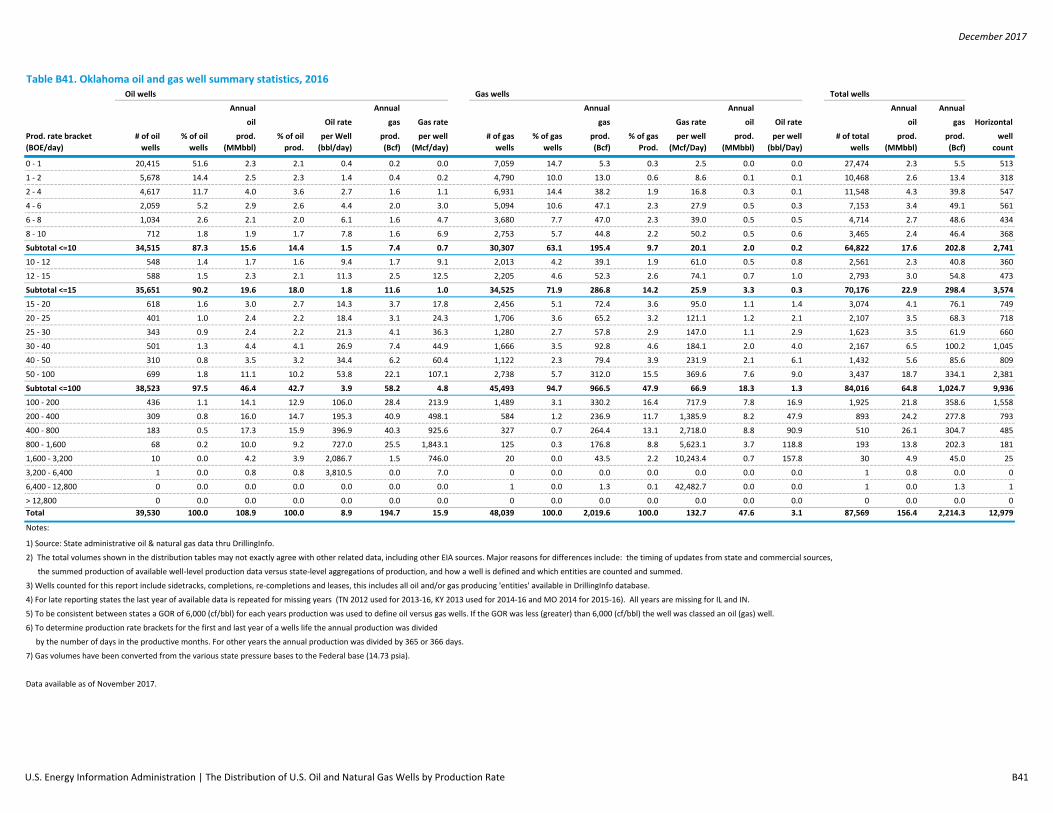
December 2017
Table B41. Oklahoma oil and gas well summary statistics, 2016
Annual Annual Annual Annual Annual Annual
oil Oil rate gas Gas rate gas Gas rate oil Oil rate oil gas Horizontal
Prod. rate bracket # of oil % of oil prod. % of oil per Well prod. per well # of gas % of gas prod. % of gas per well prod. per well # of total prod. prod. well
(BOE/day) wells wells (MMbbl) prod. (bbl/day) (Bcf) (Mcf/day) wells wells (Bcf) Prod. (Mcf/Day) (MMbbl) (bbl/Day) wells (MMbbl) (Bcf) count
0 ‐ 1 20,415 51.6 2.3 2.1 0.4 0.2 0.0 7,059 14.7 5.3 0.3 2.5 0.0 0.0 27,474 2.3 5.5 513
1 ‐ 2 5,678 14.4 2.5 2.3 1.4 0.4 0.2 4,790 10.0 13.0 0.6 8.6 0.1 0.1 10,468 2.6 13.4 318
2 ‐ 4 4,617 11.7 4.0 3.6 2.7 1.6 1.1 6,931 14.4 38.2 1.9 16.8 0.3 0.1 11,548 4.3 39.8 547
4 ‐ 6 2,059 5.2 2.9 2.6 4.4 2.0 3.0 5,094 10.6 47.1 2.3 27.9 0.5 0.3 7,153 3.4 49.1 561
6 ‐ 8 1,034 2.6 2.1 2.0 6.1 1.6 4.7 3,680 7.7 47.0 2.3 39.0 0.5 0.5 4,714 2.7 48.6 434
8 ‐ 10 712 1.8 1.9 1.7 7.8 1.6 6.9 2,753 5.7 44.8 2.2 50.2 0.5 0.6 3,465 2.4 46.4 368
Subtotal <=10 34,515 87.3 15.6 14.4 1.5 7.4 0.7 30,307 63.1 195.4 9.7 20.1 2.0 0.2 64,822 17.6 202.8 2,741
10 ‐ 12 548 1.4 1.7 1.6 9.4 1.7 9.1 2,013 4.2 39.1 1.9 61.0 0.5 0.8 2,561 2.3 40.8 360
12 ‐ 15 588 1.5 2.3 2.1 11.3 2.5 12.5 2,205 4.6 52.3 2.6 74.1 0.7 1.0 2,793 3.0 54.8 473
Subtotal <=15 35,651 90.2 19.6 18.0 1.8 11.6 1.0 34,525 71.9 286.8 14.2 25.9 3.3 0.3 70,176 22.9 298.4 3,574
15 ‐ 20 618 1.6 3.0 2.7 14.3 3.7 17.8 2,456 5.1 72.4 3.6 95.0 1.1 1.4 3,074 4.1 76.1 749
20 ‐ 25 401 1.0 2.4 2.2 18.4 3.1 24.3 1,706 3.6 65.2 3.2 121.1 1.2 2.1 2,107 3.5 68.3 718
25 ‐ 30 343 0.9 2.4 2.2 21.3 4.1 36.3 1,280 2.7 57.8 2.9 147.0 1.1 2.9 1,623 3.5 61.9 660
30 ‐ 40 501 1.3 4.4 4.1 26.9 7.4 44.9 1,666 3.5 92.8 4.6 184.1 2.0 4.0 2,167 6.5 100.2 1,045
40 ‐ 50 310 0.8 3.5 3.2 34.4 6.2 60.4 1,122 2.3 79.4 3.9 231.9 2.1 6.1 1,432 5.6 85.6 809
50 ‐ 100 699 1.8 11.1 10.2 53.8 22.1 107.1 2,738 5.7 312.0 15.5 369.6 7.6 9.0 3,437 18.7 334.1 2,381
Subtotal <=100 38,523 97.5 46.4 42.7 3.9 58.2 4.8 45,493 94.7 966.5 47.9 66.9 18.3 1.3 84,016 64.8 1,024.7 9,936
100 ‐ 200 436 1.1 14.1 12.9 106.0 28.4 213.9 1,489 3.1 330.2 16.4 717.9 7.8 16.9 1,925 21.8 358.6 1,558
200 ‐ 400 309 0.8 16.0 14.7 195.3 40.9 498.1 584 1.2 236.9 11.7 1,385.9 8.2 47.9 893 24.2 277.8 793
400 ‐ 800 183 0.5 17.3 15.9 396.9 40.3 925.6 327 0.7 264.4 13.1 2,718.0 8.8 90.9 510 26.1 304.7 485
800 ‐ 1,600 68 0.2 10.0 9.2 727.0 25.5 1,843.1 125 0.3 176.8 8.8 5,623.1 3.7 118.8 193 13.8 202.3 181
1,600 ‐ 3,200 10 0.0 4.2 3.9 2,086.7 1.5 746.0 20 0.0 43.5 2.2 10,243.4 0.7 157.8 30 4.9 45.0 25
3,200 ‐ 6,400 1 0.0 0.8 0.8 3,810.5 0.0 7.0 0 0.0 0.0 0.0 0.0 0.0 0.0 1 0.8 0.0 0
6,400 ‐ 12,800 0 0.0 0.0 0.0 0.0 0.0 0.0 1 0.0 1.3 0.1 42,482.7 0.0 0.0 1 0.0 1.3 1
> 12,800 0 0.0 0.0 0.0 0.0 0.0 0.0 0 0.0 0.0 0.0 0.0 0.0 0.0 0 0.0 0.0 0
Total 39,530 100.0 108.9 100.0 8.9 194.7 15.9 48,039 100.0 2,019.6 100.0 132.7 47.6 3.1 87,569 156.4 2,214.3 12,979
Notes:
1) Source: State administrative oil & natural gas data thru DrillingInfo.
2) The total volumes shown in the distribution tables may not exactly agree with other related data, including other EIA sources. Major reasons for differences include: the timing of updates from state and commercial sources,
the summed production of available well‐level production data versus state‐level aggregations of production, and how a well is defined and which entities are counted and summed.
3) Wells counted for this report include sidetracks, completions, re‐completions and leases, this includes all oil and/or gas producing 'entities' available in DrillingInfo database.
4) For late reporting states the last year of available data is repeated for missing years (TN 2012 used for 2013‐16, KY 2013 used for 2014‐16 and MO 2014 for 2015‐16). All years are missing for IL and IN.
5) To be consistent between states a GOR of 6,000 (cf/bbl) for each years production was used to define oil versus gas wells. If the GOR was less (greater) than 6,000 (cf/bbl) the well was classed an oil (gas) well.
6) To determine production rate brackets for the first and last year of a wells life the annual production was divided
by the number of days in the productive months. For other years the annual production was divided by 365 or 366 days.
7) Gas volumes have been converted from the various state pressure bases to the Federal base (14.73 psia).
Data available as of November 2017.
Oil wells Gas wells Total wells
U.S. Energy Information Administration | The Distribution of U.S. Oil and Natural Gas Wells by Production Rate B41

December 2017
Table B42. Oregon oil and gas well summary statistics, 2016
Annual Annual Annual Annual Annual Annual
oil Oil rate gas Gas rate gas Gas rate oil Oil rate oil gas Horizontal
Prod. rate bracket # of oil % of oil prod. % of oil per Well prod. per well # of gas % of gas prod. % of gas per well prod. per well # of total prod. prod. well
(BOE/day) wells wells (MMbbl) prod. (bbl/day) (Bcf) (Mcf/day) wells wells (Bcf) Prod. (Mcf/Day) (MMbbl) (bbl/Day) wells (MMbbl) (Bcf) count
0 ‐ 1 0 0.0 0.0 0.0 0.0 0.0 0.0 2 18.2 0.0 0.2 1.6 0.0 0.0 2 0.0 0.0 0
1 ‐ 2 0 0.0 0.0 0.0 0.0 0.0 0.0 0 0.0 0.0 0.0 0.0 0.0 0.0 0 0.0 0.0 0
2 ‐ 4 0 0.0 0.0 0.0 0.0 0.0 0.0 2 18.2 0.0 4.0 23.3 0.0 0.0 2 0.0 0.0 0
4 ‐ 6 0 0.0 0.0 0.0 0.0 0.0 0.0 3 27.3 0.0 9.6 28.7 0.0 0.0 3 0.0 0.0 0
6 ‐ 8 0 0.0 0.0 0.0 0.0 0.0 0.0 0 0.0 0.0 0.0 0.0 0.0 0.0 0 0.0 0.0 0
8 ‐ 10 0 0.0 0.0 0.0 0.0 0.0 0.0 1 9.1 0.0 6.8 59.3 0.0 0.0 1 0.0 0.0 0
Subtotal <=10 0 0.0 0.0 0.0 0.0 0.0 0.0 8 72.7 0.1 20.6 28.0 0.0 0.0 8 0.0 0.1 0
10 ‐ 12 0 0.0 0.0 0.0 0.0 0.0 0.0 0 0.0 0.0 0.0 0.0 0.0 0.0 0 0.0 0.0 0
12 ‐ 15 0 0.0 0.0 0.0 0.0 0.0 0.0 1 9.1 0.0 9.5 82.3 0.0 0.0 1 0.0 0.0 0
Subtotal <=15 0 0.0 0.0 0.0 0.0 0.0 0.0 9 81.8 0.1 30.1 35.3 0.0 0.0 9 0.0 0.1 0
15 ‐ 20 0 0.0 0.0 0.0 0.0 0.0 0.0 1 9.1 0.0 11.1 96.6 0.0 0.0 1 0.0 0.0 0
20 ‐ 25 0 0.0 0.0 0.0 0.0 0.0 0.0 0 0.0 0.0 0.0 0.0 0.0 0.0 0 0.0 0.0 0
25 ‐ 30 0 0.0 0.0 0.0 0.0 0.0 0.0 0 0.0 0.0 0.0 0.0 0.0 0.0 0 0.0 0.0 0
30 ‐ 40 0 0.0 0.0 0.0 0.0 0.0 0.0 0 0.0 0.0 0.0 0.0 0.0 0.0 0 0.0 0.0 0
40 ‐ 50 0 0.0 0.0 0.0 0.0 0.0 0.0 0 0.0 0.0 0.0 0.0 0.0 0.0 0 0.0 0.0 0
50 ‐ 100 0 0.0 0.0 0.0 0.0 0.0 0.0 1 9.1 0.2 58.8 511.8 0.0 0.0 1 0.0 0.2 0
Subtotal <=100 0 0.0 0.0 0.0 0.0 0.0 0.0 11 100.0 0.3 100.0 92.5 0.0 0.0 11 0.0 0.3 0
100 ‐ 200 0 0.0 0.0 0.0 0.0 0.0 0.0 0 0.0 0.0 0.0 0.0 0.0 0.0 0 0.0 0.0 0
200 ‐ 400 0 0.0 0.0 0.0 0.0 0.0 0.0 0 0.0 0.0 0.0 0.0 0.0 0.0 0 0.0 0.0 0
400 ‐ 800 0 0.0 0.0 0.0 0.0 0.0 0.0 0 0.0 0.0 0.0 0.0 0.0 0.0 0 0.0 0.0 0
800 ‐ 1,600 0 0.0 0.0 0.0 0.0 0.0 0.0 0 0.0 0.0 0.0 0.0 0.0 0.0 0 0.0 0.0 0
1,600 ‐ 3,200 0 0.0 0.0 0.0 0.0 0.0 0.0 0 0.0 0.0 0.0 0.0 0.0 0.0 0 0.0 0.0 0
3,200 ‐ 6,400 0 0.0 0.0 0.0 0.0 0.0 0.0 0 0.0 0.0 0.0 0.0 0.0 0.0 0 0.0 0.0 0
6,400 ‐ 12,800 0 0.0 0.0 0.0 0.0 0.0 0.0 0 0.0 0.0 0.0 0.0 0.0 0.0 0 0.0 0.0 0
> 12,800 0 0.0 0.0 0.0 0.0 0.0 0.0 0 0.0 0.0 0.0 0.0 0.0 0.0 0 0.0 0.0 0
Total 0 0.0 0.0 0.0 0.0 0.0 0.0 11 100.0 0.3 100.0 92.5 0.0 0.0 11 0.0 0.3 0
Notes:
1) Source: State administrative oil & natural gas data thru DrillingInfo.
2) The total volumes shown in the distribution tables may not exactly agree with other related data, including other EIA sources. Major reasons for differences include: the timing of updates from state and commercial sources,
the summed production of available well‐level production data versus state‐level aggregations of production, and how a well is defined and which entities are counted and summed.
3) Wells counted for this report include sidetracks, completions, re‐completions and leases, this includes all oil and/or gas producing 'entities' available in DrillingInfo database.
4) For late reporting states the last year of available data is repeated for missing years (TN 2012 used for 2013‐16, KY 2013 used for 2014‐16 and MO 2014 for 2015‐16). All years are missing for IL and IN.
5) To be consistent between states a GOR of 6,000 (cf/bbl) for each years production was used to define oil versus gas wells. If the GOR was less (greater) than 6,000 (cf/bbl) the well was classed an oil (gas) well.
6) To determine production rate brackets for the first and last year of a wells life the annual production was divided
by the number of days in the productive months. For other years the annual production was divided by 365 or 366 days.
7) Gas volumes have been converted from the various state pressure bases to the Federal base (14.73 psia).
Data available as of November 2017.
Oil wells Gas wells Total wells
U.S. Energy Information Administration | The Distribution of U.S. Oil and Natural Gas Wells by Production Rate B42

December 2017
Table B43. Pennsylvania oil and gas well summary statistics, 2016
Annual Annual Annual Annual Annual Annual
oil Oil rate gas Gas rate gas Gas rate oil Oil rate oil gas Horizontal
Prod. rate bracket # of oil % of oil prod. % of oil per Well prod. per well # of gas % of gas prod. % of gas per well prod. per well # of total prod. prod. well
(BOE/day) wells wells (MMbbl) prod. (bbl/day) (Bcf) (Mcf/day) wells wells (Bcf) Prod. (Mcf/Day) (MMbbl) (bbl/Day) wells (MMbbl) (Bcf) count
0 ‐ 1 10,497 92.7 0.7 62.7 0.2 1.4 0.4 45,272 66.4 35.5 0.7 2.2 0.3 0.0 55,769 1.0 36.9 25
1 ‐ 2 677 6.0 0.2 19.5 0.9 0.7 2.9 10,966 16.1 32.7 0.6 8.2 0.1 0.0 11,643 0.3 33.4 22
2 ‐ 4 86 0.8 0.1 5.0 2.1 0.1 4.3 3,520 5.2 20.0 0.4 15.7 0.0 0.0 3,606 0.1 20.1 28
4 ‐ 6 23 0.2 0.0 1.9 4.7 0.0 3.2 568 0.8 5.8 0.1 28.5 0.0 0.0 591 0.0 5.8 30
6 ‐ 8 15 0.1 0.0 1.2 4.4 0.0 14.2 237 0.4 3.5 0.1 41.2 0.0 0.1 252 0.0 3.5 27
8 ‐ 10 5 0.0 0.0 0.8 5.9 0.0 19.4 139 0.2 2.6 0.1 53.4 0.0 0.1 144 0.0 2.6 24
Subtotal <=10 11,303 99.8 1.0 91.1 0.3 2.2 0.6 60,702 89.1 100.1 1.9 4.7 0.4 0.0 72,005 1.4 102.4 156
10 ‐ 12 14 0.1 0.0 2.3 7.2 0.1 22.3 95 0.1 2.2 0.0 66.1 0.0 0.0 109 0.0 2.3 15
12 ‐ 15 3 0.0 0.0 0.5 10.1 0.0 21.4 111 0.2 3.1 0.1 80.0 0.0 0.1 114 0.0 3.1 20
Subtotal <=15 11,320 100.0 1.0 94.0 0.3 2.3 0.7 60,908 89.4 105.4 2.0 4.9 0.4 0.0 72,228 1.5 107.8 191
15 ‐ 20 1 0.0 0.0 0.2 19.2 0.0 0.0 89 0.1 3.3 0.1 103.7 0.0 0.1 90 0.0 3.3 26
20 ‐ 25 1 0.0 0.0 0.5 14.1 0.0 47.5 73 0.1 3.3 0.1 132.8 0.0 0.1 74 0.0 3.3 35
25 ‐ 30 0 0.0 0.0 0.0 0.0 0.0 0.0 61 0.1 3.6 0.1 165.6 0.0 0.4 61 0.0 3.6 42
30 ‐ 40 1 0.0 0.0 0.1 31.3 0.0 0.0 128 0.2 9.3 0.2 208.8 0.0 0.3 129 0.0 9.3 110
40 ‐ 50 0 0.0 0.0 0.0 0.0 0.0 0.0 159 0.2 15.5 0.3 270.8 0.0 0.3 159 0.0 15.5 146
50 ‐ 100 0 0.0 0.0 0.0 0.0 0.0 0.0 1,155 1.7 184.2 3.5 443.3 0.5 1.2 1,155 0.5 184.2 1,148
Subtotal <=100 11,323 100.0 1.0 94.7 0.3 2.3 0.7 62,573 91.8 324.5 6.2 14.7 1.0 0.0 73,896 2.0 326.8 1,698
100 ‐ 200 1 0.0 0.1 5.3 159.5 0.0 10.0 1,626 2.4 503.7 9.7 860.0 1.1 1.9 1,627 1.2 503.7 1,621
200 ‐ 400 0 0.0 0.0 0.0 0.0 0.0 0.0 1,775 2.6 1,076.3 20.6 1,708.4 1.8 2.8 1,775 1.8 1,076.3 1,774
400 ‐ 800 0 0.0 0.0 0.0 0.0 0.0 0.0 1,419 2.1 1,609.6 30.9 3,332.0 1.2 2.4 1,419 1.2 1,609.6 1,414
800 ‐ 1,600 0 0.0 0.0 0.0 0.0 0.0 0.0 614 0.9 1,261.8 24.2 6,575.3 0.1 0.6 614 0.1 1,261.8 612
1,600 ‐ 3,200 0 0.0 0.0 0.0 0.0 0.0 0.0 146 0.2 406.1 7.8 12,091.5 0.0 0.1 146 0.0 406.1 146
3,200 ‐ 6,400 0 0.0 0.0 0.0 0.0 0.0 0.0 11 0.0 32.8 0.6 21,034.9 0.0 0.0 11 0.0 32.8 10
6,400 ‐ 12,800 0 0.0 0.0 0.0 0.0 0.0 0.0 1 0.0 1.4 0.0 45,830.2 0.0 0.0 1 0.0 1.4 1
> 12,800 0 0.0 0.0 0.0 0.0 0.0 0.0 0 0.0 0.0 0.0 0.0 0.0 0.0 0 0.0 0.0 0
Total 11,324 100.0 1.1 100.0 0.3 2.3 0.7 68,165 100.0 5,216.2 100.0 216.8 5.2 0.2 79,489 6.3 5,218.6 7,276
Notes:
1) Source: State administrative oil & natural gas data thru DrillingInfo.
2) The total volumes shown in the distribution tables may not exactly agree with other related data, including other EIA sources. Major reasons for differences include: the timing of updates from state and commercial sources,
the summed production of available well‐level production data versus state‐level aggregations of production, and how a well is defined and which entities are counted and summed.
3) Wells counted for this report include sidetracks, completions, re‐completions and leases, this includes all oil and/or gas producing 'entities' available in DrillingInfo database.
4) For late reporting states the last year of available data is repeated for missing years (TN 2012 used for 2013‐16, KY 2013 used for 2014‐16 and MO 2014 for 2015‐16). All years are missing for IL and IN.
5) To be consistent between states a GOR of 6,000 (cf/bbl) for each years production was used to define oil versus gas wells. If the GOR was less (greater) than 6,000 (cf/bbl) the well was classed an oil (gas) well.
6) To determine production rate brackets for the first and last year of a wells life the annual production was divided
by the number of days in the productive months. For other years the annual production was divided by 365 or 366 days.
7) Gas volumes have been converted from the various state pressure bases to the Federal base (14.73 psia).
Data available as of November 2017.
Oil wells Gas wells Total wells
U.S. Energy Information Administration | The Distribution of U.S. Oil and Natural Gas Wells by Production Rate B43

December 2017
Table B44. South Dakota oil and gas well summary statistics, 2016
Annual Annual Annual Annual Annual Annual
oil Oil rate gas Gas rate gas Gas rate oil Oil rate oil gas Horizontal
Prod. rate bracket # of oil % of oil prod. % of oil per Well prod. per well # of gas % of gas prod. % of gas per well prod. per well # of total prod. prod. well
(BOE/day) wells wells (MMbbl) prod. (bbl/day) (Bcf) (Mcf/day) wells wells (Bcf) Prod. (Mcf/Day) (MMbbl) (bbl/Day) wells (MMbbl) (Bcf) count
0 ‐ 1 7 6.5 0.0 0.1 0.5 0.0 0.0 18 17.1 0.0 0.2 3.1 0.0 0.0 25 0.0 0.0 5
1 ‐ 2 2 1.9 0.0 0.1 1.6 0.0 0.0 16 15.2 0.0 0.5 8.7 0.0 0.0 18 0.0 0.0 1
2 ‐ 4 4 3.7 0.0 0.4 2.6 0.0 0.0 12 11.4 0.1 0.7 15.9 0.0 0.0 16 0.0 0.1 1
4 ‐ 6 4 3.7 0.0 0.6 5.2 0.0 1.1 4 3.8 0.0 0.4 27.7 0.0 0.0 8 0.0 0.0 3
6 ‐ 8 3 2.8 0.0 0.6 7.2 0.0 0.0 2 1.9 0.0 0.3 35.9 0.0 1.8 5 0.0 0.0 0
8 ‐ 10 7 6.5 0.0 2.1 8.8 0.0 0.3 0 0.0 0.0 0.0 0.0 0.0 0.0 7 0.0 0.0 3
Subtotal <=10 27 25.0 0.0 3.8 4.5 0.0 0.3 52 49.5 0.2 2.1 11.5 0.0 0.1 79 0.0 0.2 13
10 ‐ 12 5 4.6 0.0 1.9 11.1 0.0 1.3 0 0.0 0.0 0.0 0.0 0.0 0.0 5 0.0 0.0 3
12 ‐ 15 5 4.6 0.0 1.8 11.8 0.0 11.6 1 1.0 0.0 0.3 77.8 0.0 1.9 6 0.0 0.0 4
Subtotal <=15 37 34.3 0.1 7.4 6.4 0.0 1.9 53 50.5 0.2 2.4 12.8 0.0 0.1 90 0.1 0.3 20
15 ‐ 20 13 12.0 0.1 7.4 16.7 0.0 3.2 1 1.0 0.0 0.2 56.7 0.0 8.4 14 0.1 0.0 11
20 ‐ 25 11 10.2 0.1 7.9 21.1 0.0 2.0 1 1.0 0.0 0.4 119.8 0.0 3.2 12 0.1 0.0 12
25 ‐ 30 8 7.4 0.1 6.7 24.7 0.0 16.7 2 1.9 0.1 1.1 146.1 0.0 5.3 10 0.1 0.2 7
30 ‐ 40 15 13.9 0.2 16.7 33.1 0.1 11.2 7 6.7 0.4 4.3 173.7 0.0 8.9 22 0.2 0.5 20
40 ‐ 50 7 6.5 0.1 10.3 43.4 0.0 16.5 1 1.0 0.1 0.7 230.7 0.0 3.6 8 0.1 0.1 7
50 ‐ 100 13 12.0 0.3 27.9 63.3 0.1 17.4 16 15.2 2.3 23.1 385.9 0.1 13.3 29 0.4 2.3 27
Subtotal <=100 104 96.3 0.9 84.3 24.7 0.3 7.6 81 77.1 3.1 32.2 112.3 0.1 3.9 185 1.0 3.4 104
100 ‐ 200 4 3.7 0.2 15.7 115.6 0.1 36.4 20 19.1 4.9 50.3 677.3 0.2 22.3 24 0.3 5.0 24
200 ‐ 400 0 0.0 0.0 0.0 0.0 0.0 0.0 4 3.8 1.7 17.5 1,171.1 0.1 38.0 4 0.1 1.7 4
400 ‐ 800 0 0.0 0.0 0.0 0.0 0.0 0.0 0 0.0 0.0 0.0 0.0 0.0 0.0 0 0.0 0.0 0
800 ‐ 1,600 0 0.0 0.0 0.0 0.0 0.0 0.0 0 0.0 0.0 0.0 0.0 0.0 0.0 0 0.0 0.0 0
1,600 ‐ 3,200 0 0.0 0.0 0.0 0.0 0.0 0.0 0 0.0 0.0 0.0 0.0 0.0 0.0 0 0.0 0.0 0
3,200 ‐ 6,400 0 0.0 0.0 0.0 0.0 0.0 0.0 0 0.0 0.0 0.0 0.0 0.0 0.0 0 0.0 0.0 0
6,400 ‐ 12,800 0 0.0 0.0 0.0 0.0 0.0 0.0 0 0.0 0.0 0.0 0.0 0.0 0.0 0 0.0 0.0 0
> 12,800 0 0.0 0.0 0.0 0.0 0.0 0.0 0 0.0 0.0 0.0 0.0 0.0 0.0 0 0.0 0.0 0
Total 108 100.0 1.1 100.0 28.1 0.3 8.7 105 100.0 9.8 100.0 266.2 0.3 8.9 213 1.4 10.1 132
Notes:
1) Source: State administrative oil & natural gas data thru DrillingInfo.
2) The total volumes shown in the distribution tables may not exactly agree with other related data, including other EIA sources. Major reasons for differences include: the timing of updates from state and commercial sources,
the summed production of available well‐level production data versus state‐level aggregations of production, and how a well is defined and which entities are counted and summed.
3) Wells counted for this report include sidetracks, completions, re‐completions and leases, this includes all oil and/or gas producing 'entities' available in DrillingInfo database.
4) For late reporting states the last year of available data is repeated for missing years (TN 2012 used for 2013‐16, KY 2013 used for 2014‐16 and MO 2014 for 2015‐16). All years are missing for IL and IN.
5) To be consistent between states a GOR of 6,000 (cf/bbl) for each years production was used to define oil versus gas wells. If the GOR was less (greater) than 6,000 (cf/bbl) the well was classed an oil (gas) well.
6) To determine production rate brackets for the first and last year of a wells life the annual production was divided
by the number of days in the productive months. For other years the annual production was divided by 365 or 366 days.
7) Gas volumes have been converted from the various state pressure bases to the Federal base (14.73 psia).
Data available as of November 2017.
Oil wells Gas wells Total wells
U.S. Energy Information Administration | The Distribution of U.S. Oil and Natural Gas Wells by Production Rate B44

December 2017
Table B45. Tennessee oil and gas well summary statistics, 2012
Annual Annual Annual Annual Annual Annual
oil Oil rate gas Gas rate gas Gas rate oil Oil rate oil gas Horizontal
Prod. rate bracket # of oil % of oil prod. % of oil per Well prod. per well # of gas % of gas prod. % of gas per well prod. per well # of total prod. prod. well
(BOE/day) wells wells (MMbbl) prod. (bbl/day) (Bcf) (Mcf/day) wells wells (Bcf) Prod. (Mcf/Day) (MMbbl) (bbl/Day) wells (MMbbl) (Bcf) count
0 ‐ 1 645 73.5 0.1 19.7 0.3 0.0 0.0 559 54.4 0.5 8.1 2.3 0.0 0.0 1,204 0.1 0.5 2
1 ‐ 2 117 13.3 0.1 13.3 1.3 0.0 0.5 217 21.1 0.6 10.9 8.0 0.0 0.1 334 0.1 0.6 2
2 ‐ 4 72 8.2 0.1 16.0 2.6 0.0 1.3 108 10.5 0.6 10.9 16.0 0.0 0.1 180 0.1 0.7 10
4 ‐ 6 17 1.9 0.0 7.5 4.6 0.0 1.4 45 4.4 0.5 8.2 29.0 0.0 0.1 62 0.0 0.5 5
6 ‐ 8 9 1.0 0.0 5.2 6.0 0.0 2.1 30 2.9 0.5 7.7 41.0 0.0 0.0 39 0.0 0.5 2
8 ‐ 10 5 0.6 0.0 3.7 8.7 0.0 2.9 8 0.8 0.2 2.7 53.5 0.0 0.2 13 0.0 0.2 3
Subtotal <=10 865 98.5 0.2 65.4 0.8 0.1 0.3 967 94.2 2.8 48.5 8.0 0.0 0.0 1,832 0.3 2.9 24
10 ‐ 12 3 0.3 0.0 1.3 11.7 0.0 0.0 10 1.0 0.2 4.1 65.8 0.0 0.0 13 0.0 0.2 1
12 ‐ 15 1 0.1 0.0 1.3 13.7 0.0 0.0 12 1.2 0.3 6.0 79.1 0.0 0.1 13 0.0 0.3 2
Subtotal <=15 869 99.0 0.3 68.1 0.9 0.1 0.3 989 96.3 3.4 58.6 9.4 0.0 0.0 1,858 0.3 3.5 27
15 ‐ 20 3 0.3 0.0 3.1 15.2 0.0 6.3 14 1.4 0.5 9.3 105.2 0.0 0.0 17 0.0 0.5 3
20 ‐ 25 2 0.2 0.0 4.4 22.9 0.0 0.0 7 0.7 0.3 5.9 133.7 0.0 0.0 9 0.0 0.3 1
25 ‐ 30 0 0.0 0.0 0.0 0.0 0.0 0.0 2 0.2 0.1 2.0 158.9 0.0 0.0 2 0.0 0.1 0
30 ‐ 40 1 0.1 0.0 3.2 33.3 0.0 0.0 9 0.9 0.7 12.2 214.8 0.0 0.0 10 0.0 0.7 1
40 ‐ 50 0 0.0 0.0 0.0 0.0 0.0 0.0 3 0.3 0.3 4.9 257.2 0.0 0.0 3 0.0 0.3 0
50 ‐ 100 3 0.3 0.1 21.2 73.1 0.0 0.0 3 0.3 0.4 7.3 385.8 0.0 1.1 6 0.1 0.4 0
Subtotal <=100 878 100.0 0.4 100.0 1.3 0.1 0.3 1,027 100.0 5.8 100.0 15.5 0.0 0.0 1,905 0.4 5.9 32
100 ‐ 200 0 0.0 0.0 0.0 0.0 0.0 0.0 0 0.0 0.0 0.0 0.0 0.0 0.0 0 0.0 0.0 0
200 ‐ 400 0 0.0 0.0 0.0 0.0 0.0 0.0 0 0.0 0.0 0.0 0.0 0.0 0.0 0 0.0 0.0 0
400 ‐ 800 0 0.0 0.0 0.0 0.0 0.0 0.0 0 0.0 0.0 0.0 0.0 0.0 0.0 0 0.0 0.0 0
800 ‐ 1,600 0 0.0 0.0 0.0 0.0 0.0 0.0 0 0.0 0.0 0.0 0.0 0.0 0.0 0 0.0 0.0 0
1,600 ‐ 3,200 0 0.0 0.0 0.0 0.0 0.0 0.0 0 0.0 0.0 0.0 0.0 0.0 0.0 0 0.0 0.0 0
3,200 ‐ 6,400 0 0.0 0.0 0.0 0.0 0.0 0.0 0 0.0 0.0 0.0 0.0 0.0 0.0 0 0.0 0.0 0
6,400 ‐ 12,800 0 0.0 0.0 0.0 0.0 0.0 0.0 0 0.0 0.0 0.0 0.0 0.0 0.0 0 0.0 0.0 0
> 12,800 0 0.0 0.0 0.0 0.0 0.0 0.0 0 0.0 0.0 0.0 0.0 0.0 0.0 0 0.0 0.0 0
Total 878 100.0 0.4 100.0 1.3 0.1 0.3 1,027 100.0 5.8 100.0 15.5 0.0 0.0 1,905 0.4 5.9 32
Notes:
1) Source: State administrative oil & natural gas data thru DrillingInfo.
2) The total volumes shown in the distribution tables may not exactly agree with other related data, including other EIA sources. Major reasons for differences include: the timing of updates from state and commercial sources,
the summed production of available well‐level production data versus state‐level aggregations of production, and how a well is defined and which entities are counted and summed.
3) Wells counted for this report include sidetracks, completions, re‐completions and leases, this includes all oil and/or gas producing 'entities' available in DrillingInfo database.
4) For late reporting states the last year of available data is repeated for missing years (TN 2012 used for 2013‐16, KY 2013 used for 2014‐16 and MO 2014 for 2015‐16). All years are missing for IL and IN.
5) To be consistent between states a GOR of 6,000 (cf/bbl) for each years production was used to define oil versus gas wells. If the GOR was less (greater) than 6,000 (cf/bbl) the well was classed an oil (gas) well.
6) To determine production rate brackets for the first and last year of a wells life the annual production was divided
by the number of days in the productive months. For other years the annual production was divided by 365 or 366 days.
7) Gas volumes have been converted from the various state pressure bases to the Federal base (14.73 psia).
Data available as of November 2017.
Oil wells Gas wells Total wells
U.S. Energy Information Administration | The Distribution of U.S. Oil and Natural Gas Wells by Production Rate B45

December 2017
Table B46. Texas oil and gas well summary statistics, 2016
Annual Annual Annual Annual Annual Annual
oil Oil rate gas Gas rate gas Gas rate oil Oil rate oil gas Horizontal
Prod. rate bracket # of oil % of oil prod. % of oil per Well prod. per well # of gas % of gas prod. % of gas per well prod. per well # of total prod. prod. well
(BOE/day) wells wells (MMbbl) prod. (bbl/day) (Bcf) (Mcf/day) wells wells (Bcf) Prod. (Mcf/Day) (MMbbl) (bbl/Day) wells (MMbbl) (Bcf) count
0 ‐ 1 65,251 37.1 7.0 0.7 0.3 2.6 0.1 22,489 16.6 16.2 0.3 2.2 0.3 0.0 87,740 7.2 18.8 1,799
1 ‐ 2 19,905 11.3 9.2 0.9 1.3 4.8 0.7 12,474 9.2 34.3 0.5 8.1 0.5 0.1 32,379 9.7 39.1 988
2 ‐ 4 21,234 12.1 19.4 2.0 2.6 14.1 1.9 16,878 12.5 91.7 1.4 16.0 1.5 0.3 38,112 20.9 105.8 1,576
4 ‐ 6 12,942 7.4 19.7 2.0 4.3 17.5 3.8 11,020 8.2 100.0 1.5 26.7 1.8 0.5 23,962 21.5 117.5 1,339
6 ‐ 8 8,278 4.7 17.5 1.8 6.0 16.7 5.7 8,219 6.1 104.9 1.6 37.6 1.9 0.7 16,497 19.4 121.7 1,291
8 ‐ 10 5,885 3.4 15.9 1.6 7.6 16.8 8.0 6,686 5.0 110.5 1.7 48.7 1.9 0.9 12,571 17.9 127.3 1,293
Subtotal <=10 133,495 75.9 88.8 8.9 1.9 72.5 1.6 77,766 57.5 457.6 7.1 17.6 7.9 0.3 211,261 96.7 530.1 8,286
10 ‐ 12 4,321 2.5 14.1 1.4 9.3 15.6 10.3 5,473 4.1 111.0 1.7 59.5 1.9 1.0 9,794 16.0 126.6 1,148
12 ‐ 15 4,917 2.8 19.4 2.0 11.2 22.4 12.9 6,573 4.9 165.2 2.6 73.5 2.7 1.2 11,490 22.1 187.6 1,774
Subtotal <=15 142,733 81.2 122.4 12.3 2.5 110.5 2.2 89,812 66.4 733.8 11.3 24.4 12.5 0.4 232,545 134.9 844.4 11,208
15 ‐ 20 5,426 3.1 27.3 2.8 14.3 34.6 18.1 8,202 6.1 265.2 4.1 94.6 4.4 1.6 13,628 31.7 299.8 2,812
20 ‐ 25 3,681 2.1 23.6 2.4 18.2 31.9 24.6 5,836 4.3 244.3 3.8 122.1 4.0 2.0 9,517 27.6 276.2 2,805
25 ‐ 30 2,501 1.4 19.6 2.0 22.1 27.9 31.6 4,201 3.1 214.5 3.3 149.2 3.6 2.5 6,702 23.2 242.4 2,526
30 ‐ 40 3,674 2.1 35.8 3.6 27.8 53.1 41.2 6,006 4.4 384.4 5.9 189.1 6.3 3.1 9,680 42.1 437.5 4,716
40 ‐ 50 2,578 1.5 31.7 3.2 35.1 52.0 57.7 4,093 3.0 335.4 5.2 242.1 6.0 4.4 6,671 37.7 387.4 4,090
50 ‐ 100 6,366 3.6 122.5 12.3 55.1 206.8 93.1 9,310 6.9 1,157.5 17.9 366.3 26.7 8.4 15,676 149.1 1,364.3 11,675
Subtotal <=100 166,959 95.0 382.9 38.5 6.6 516.8 8.9 127,460 94.3 3,335.1 51.5 77.7 63.5 1.5 294,419 446.4 3,851.9 39,832
100 ‐ 200 3,921 2.2 143.7 14.5 106.5 269.3 199.5 4,481 3.3 1,041.3 16.1 694.8 32.9 21.9 8,402 176.6 1,310.6 6,931
200 ‐ 400 2,517 1.4 170.4 17.1 210.3 336.4 415.2 2,005 1.5 851.3 13.2 1,328.4 34.6 54.0 4,522 205.0 1,187.7 3,970
400 ‐ 800 1,817 1.0 194.3 19.5 416.4 367.9 788.6 874 0.7 687.6 10.6 2,625.2 26.1 99.7 2,691 220.4 1,055.5 2,484
800 ‐ 1,600 518 0.3 83.2 8.4 768.9 163.9 1,514.3 284 0.2 381.9 5.9 5,346.8 12.3 172.0 802 95.5 545.8 736
1,600 ‐ 3,200 70 0.0 18.1 1.8 1,586.3 31.5 2,764.2 55 0.0 113.6 1.8 11,517.5 1.7 176.6 125 19.8 145.1 116
3,200 ‐ 6,400 6 0.0 2.3 0.2 3,115.3 3.1 4,192.0 18 0.0 50.7 0.8 22,200.6 0.4 164.8 24 2.7 53.8 23
6,400 ‐ 12,800 0 0.0 0.0 0.0 0.0 0.0 0.0 4 0.0 12.4 0.2 45,275.6 0.0 0.0 4 0.0 12.4 4
> 12,800 0 0.0 0.0 0.0 0.0 0.0 0.0 0 0.0 0.0 0.0 0.0 0.0 0.0 0 0.0 0.0 0
Total 175,808 100.0 995.0 100.0 16.4 1,689.0 27.9 135,181 100.0 6,473.8 100.0 142.5 171.6 3.8 310,989 1,166.5 8,162.8 54,096
Notes:
1) Source: State administrative oil & natural gas data thru DrillingInfo.
2) The total volumes shown in the distribution tables may not exactly agree with other related data, including other EIA sources. Major reasons for differences include: the timing of updates from state and commercial sources,
the summed production of available well‐level production data versus state‐level aggregations of production, and how a well is defined and which entities are counted and summed.
3) Wells counted for this report include sidetracks, completions, re‐completions and leases, this includes all oil and/or gas producing 'entities' available in DrillingInfo database.
4) For late reporting states the last year of available data is repeated for missing years (TN 2012 used for 2013‐16, KY 2013 used for 2014‐16 and MO 2014 for 2015‐16). All years are missing for IL and IN.
5) To be consistent between states a GOR of 6,000 (cf/bbl) for each years production was used to define oil versus gas wells. If the GOR was less (greater) than 6,000 (cf/bbl) the well was classed an oil (gas) well.
6) To determine production rate brackets for the first and last year of a wells life the annual production was divided
by the number of days in the productive months. For other years the annual production was divided by 365 or 366 days.
7) Gas volumes have been converted from the various state pressure bases to the Federal base (14.73 psia).
Data available as of November 2017.
Oil wells Gas wells Total wells
U.S. Energy Information Administration | The Distribution of U.S. Oil and Natural Gas Wells by Production Rate B46

December 2017
Table B47. Utah oil and gas well summary statistics, 2016
Annual Annual Annual Annual Annual Annual
oil Oil rate gas Gas rate gas Gas rate oil Oil rate oil gas Horizontal
Prod. rate bracket # of oil % of oil prod. % of oil per Well prod. per well # of gas % of gas prod. % of gas per well prod. per well # of total prod. prod. well
(BOE/day) wells wells (MMbbl) prod. (bbl/day) (Bcf) (Mcf/day) wells wells (Bcf) Prod. (Mcf/Day) (MMbbl) (bbl/Day) wells (MMbbl) (Bcf) count
0 ‐ 1 238 5.7 0.0 0.1 0.3 0.0 0.3 396 4.7 0.3 0.1 2.5 0.0 0.0 634 0.0 0.3 8
1 ‐ 2 119 2.8 0.0 0.1 1.3 0.0 1.3 371 4.4 1.1 0.3 8.9 0.0 0.1 490 0.0 1.1 6
2 ‐ 4 360 8.6 0.3 1.1 2.6 0.4 3.1 751 8.9 4.3 1.3 16.8 0.0 0.2 1,111 0.3 4.6 5
4 ‐ 6 403 9.6 0.6 2.1 4.2 0.7 5.3 737 8.7 6.7 2.1 27.2 0.1 0.5 1,140 0.7 7.5 5
6 ‐ 8 364 8.7 0.8 2.8 5.9 0.9 6.9 650 7.7 8.4 2.6 38.5 0.1 0.5 1,014 0.9 9.3 9
8 ‐ 10 372 8.9 1.0 3.6 7.5 1.2 9.2 617 7.3 10.1 3.1 49.7 0.2 0.7 989 1.1 11.3 4
Subtotal <=10 1,856 44.3 2.7 9.8 4.5 3.2 5.4 3,522 41.8 30.9 9.5 26.6 0.4 0.4 5,378 3.1 34.1 37
10 ‐ 12 284 6.8 0.9 3.4 9.2 1.1 11.0 570 6.8 11.6 3.6 61.0 0.2 0.8 854 1.1 12.7 6
12 ‐ 15 370 8.8 1.5 5.4 11.0 1.9 14.2 724 8.6 18.3 5.7 75.5 0.2 0.9 1,094 1.7 20.2 5
Subtotal <=15 2,510 59.9 5.1 18.6 6.1 6.2 7.5 4,816 57.1 60.7 18.8 38.1 0.8 0.5 7,326 5.9 67.0 48
15 ‐ 20 391 9.3 2.0 7.4 14.4 2.4 17.0 891 10.6 29.4 9.1 98.0 0.3 1.0 1,282 2.3 31.7 14
20 ‐ 25 295 7.0 1.9 7.0 18.2 2.6 24.8 701 8.3 30.9 9.5 128.1 0.2 1.0 996 2.1 33.5 5
25 ‐ 30 191 4.6 1.5 5.4 21.4 2.4 35.5 499 5.9 27.2 8.4 157.1 0.2 1.2 690 1.7 29.6 10
30 ‐ 40 221 5.3 2.2 8.0 28.1 3.1 40.4 555 6.6 37.1 11.5 197.3 0.3 1.4 776 2.4 40.3 13
40 ‐ 50 138 3.3 1.7 6.3 35.4 2.7 55.3 326 3.9 28.7 8.9 256.8 0.2 1.6 464 1.9 31.4 6
50 ‐ 100 279 6.7 5.2 18.9 54.3 8.7 91.2 491 5.8 61.9 19.1 379.2 0.7 4.0 770 5.8 70.6 20
Subtotal <=100 4,025 96.1 19.5 71.5 14.3 28.1 20.6 8,279 98.2 276.0 85.2 99.7 2.7 1.0 12,304 22.2 304.1 116
100 ‐ 200 107 2.6 3.6 13.4 106.3 6.7 194.8 109 1.3 26.7 8.2 753.7 0.3 7.5 216 3.9 33.3 19
200 ‐ 400 38 0.9 2.2 8.0 215.1 3.5 343.8 32 0.4 13.3 4.1 1,487.8 0.1 14.4 70 2.3 16.8 7
400 ‐ 800 17 0.4 1.4 5.2 485.0 1.2 428.1 8 0.1 7.9 2.5 3,063.0 0.2 83.7 25 1.6 9.2 10
800 ‐ 1,600 3 0.1 0.5 1.9 768.7 1.8 2,628.2 0 0.0 0.0 0.0 0.0 0.0 0.0 3 0.5 1.8 2
1,600 ‐ 3,200 0 0.0 0.0 0.0 0.0 0.0 0.0 0 0.0 0.0 0.0 0.0 0.0 0.0 0 0.0 0.0 0
3,200 ‐ 6,400 0 0.0 0.0 0.0 0.0 0.0 0.0 0 0.0 0.0 0.0 0.0 0.0 0.0 0 0.0 0.0 0
6,400 ‐ 12,800 0 0.0 0.0 0.0 0.0 0.0 0.0 0 0.0 0.0 0.0 0.0 0.0 0.0 0 0.0 0.0 0
> 12,800 0 0.0 0.0 0.0 0.0 0.0 0.0 0 0.0 0.0 0.0 0.0 0.0 0.0 0 0.0 0.0 0
Total 4,190 100.0 27.3 100.0 19.3 41.3 29.2 8,428 100.0 323.8 100.0 115.0 3.3 1.2 12,618 30.5 365.1 154
Notes:
1) Source: State administrative oil & natural gas data thru DrillingInfo.
2) The total volumes shown in the distribution tables may not exactly agree with other related data, including other EIA sources. Major reasons for differences include: the timing of updates from state and commercial sources,
the summed production of available well‐level production data versus state‐level aggregations of production, and how a well is defined and which entities are counted and summed.
3) Wells counted for this report include sidetracks, completions, re‐completions and leases, this includes all oil and/or gas producing 'entities' available in DrillingInfo database.
4) For late reporting states the last year of available data is repeated for missing years (TN 2012 used for 2013‐16, KY 2013 used for 2014‐16 and MO 2014 for 2015‐16). All years are missing for IL and IN.
5) To be consistent between states a GOR of 6,000 (cf/bbl) for each years production was used to define oil versus gas wells. If the GOR was less (greater) than 6,000 (cf/bbl) the well was classed an oil (gas) well.
6) To determine production rate brackets for the first and last year of a wells life the annual production was divided
by the number of days in the productive months. For other years the annual production was divided by 365 or 366 days.
7) Gas volumes have been converted from the various state pressure bases to the Federal base (14.73 psia).
Data available as of November 2017.
Oil wells Gas wells Total wells
U.S. Energy Information Administration | The Distribution of U.S. Oil and Natural Gas Wells by Production Rate B47

December 2017
Table B48. Virginia oil and gas well summary statistics, 2016
Annual Annual Annual Annual Annual Annual
oil Oil rate gas Gas rate gas Gas rate oil Oil rate oil gas Horizontal
Prod. rate bracket # of oil % of oil prod. % of oil per Well prod. per well # of gas % of gas prod. % of gas per well prod. per well # of total prod. prod. well
(BOE/day) wells wells (MMbbl) prod. (bbl/day) (Bcf) (Mcf/day) wells wells (Bcf) Prod. (Mcf/Day) (MMbbl) (bbl/Day) wells (MMbbl) (Bcf) count
0 ‐ 1 6 85.7 0.0 55.2 0.2 0.0 0.0 552 6.8 0.6 0.5 3.4 0.0 0.0 558 0.0 0.6 5
1 ‐ 2 1 14.3 0.0 44.8 1.5 0.0 0.0 834 10.2 2.7 2.3 9.0 0.0 0.0 835 0.0 2.7 3
2 ‐ 4 0 0.0 0.0 0.0 0.0 0.0 0.0 1,934 23.7 12.6 10.5 18.0 0.0 0.0 1,934 0.0 12.6 4
4 ‐ 6 0 0.0 0.0 0.0 0.0 0.0 0.0 1,393 17.1 14.9 12.4 29.6 0.0 0.0 1,393 0.0 14.9 16
6 ‐ 8 0 0.0 0.0 0.0 0.0 0.0 0.0 1,022 12.5 15.4 12.8 41.4 0.0 0.0 1,022 0.0 15.4 20
8 ‐ 10 0 0.0 0.0 0.0 0.0 0.0 0.0 728 8.9 14.2 11.8 53.8 0.0 0.0 728 0.0 14.2 23
Subtotal <=10 7 100.0 0.0 100.0 0.3 0.0 0.0 6,463 79.3 60.5 50.3 25.9 0.0 0.0 6,470 0.0 60.5 71
10 ‐ 12 0 0.0 0.0 0.0 0.0 0.0 0.0 492 6.0 11.8 9.8 65.8 0.0 0.0 492 0.0 11.8 8
12 ‐ 15 0 0.0 0.0 0.0 0.0 0.0 0.0 542 6.7 15.7 13.1 79.9 0.0 0.0 542 0.0 15.7 18
Subtotal <=15 7 100.0 0.0 100.0 0.3 0.0 0.0 7,497 92.0 88.0 73.2 32.5 0.0 0.0 7,504 0.0 88.0 97
15 ‐ 20 0 0.0 0.0 0.0 0.0 0.0 0.0 410 5.0 15.0 12.4 102.2 0.0 0.0 410 0.0 15.0 11
20 ‐ 25 0 0.0 0.0 0.0 0.0 0.0 0.0 115 1.4 5.2 4.3 132.0 0.0 0.0 115 0.0 5.2 1
25 ‐ 30 0 0.0 0.0 0.0 0.0 0.0 0.0 37 0.5 2.1 1.8 163.4 0.0 0.0 37 0.0 2.1 3
30 ‐ 40 0 0.0 0.0 0.0 0.0 0.0 0.0 45 0.6 3.1 2.6 205.0 0.0 0.0 45 0.0 3.1 1
40 ‐ 50 0 0.0 0.0 0.0 0.0 0.0 0.0 11 0.1 0.9 0.7 266.9 0.0 0.0 11 0.0 0.9 1
50 ‐ 100 0 0.0 0.0 0.0 0.0 0.0 0.0 19 0.2 2.3 1.9 419.2 0.0 0.0 19 0.0 2.3 1
Subtotal <=100 7 100.0 0.0 100.0 0.3 0.0 0.0 8,134 99.8 116.5 96.9 39.7 0.0 0.0 8,141 0.0 116.5 115
100 ‐ 200 0 0.0 0.0 0.0 0.0 0.0 0.0 17 0.2 3.6 3.0 804.1 0.0 0.0 17 0.0 3.6 0
200 ‐ 400 0 0.0 0.0 0.0 0.0 0.0 0.0 1 0.0 0.2 0.1 1,277.3 0.0 0.0 1 0.0 0.2 0
400 ‐ 800 0 0.0 0.0 0.0 0.0 0.0 0.0 0 0.0 0.0 0.0 0.0 0.0 0.0 0 0.0 0.0 0
800 ‐ 1,600 0 0.0 0.0 0.0 0.0 0.0 0.0 0 0.0 0.0 0.0 0.0 0.0 0.0 0 0.0 0.0 0
1,600 ‐ 3,200 0 0.0 0.0 0.0 0.0 0.0 0.0 0 0.0 0.0 0.0 0.0 0.0 0.0 0 0.0 0.0 0
3,200 ‐ 6,400 0 0.0 0.0 0.0 0.0 0.0 0.0 0 0.0 0.0 0.0 0.0 0.0 0.0 0 0.0 0.0 0
6,400 ‐ 12,800 0 0.0 0.0 0.0 0.0 0.0 0.0 0 0.0 0.0 0.0 0.0 0.0 0.0 0 0.0 0.0 0
> 12,800 0 0.0 0.0 0.0 0.0 0.0 0.0 0 0.0 0.0 0.0 0.0 0.0 0.0 0 0.0 0.0 0
Total 7 100.0 0.0 100.0 0.3 0.0 0.0 8,152 100.0 120.2 100.0 40.9 0.0 0.0 8,159 0.0 120.2 115
Notes:
1) Source: State administrative oil & natural gas data thru DrillingInfo.
2) The total volumes shown in the distribution tables may not exactly agree with other related data, including other EIA sources. Major reasons for differences include: the timing of updates from state and commercial sources,
the summed production of available well‐level production data versus state‐level aggregations of production, and how a well is defined and which entities are counted and summed.
3) Wells counted for this report include sidetracks, completions, re‐completions and leases, this includes all oil and/or gas producing 'entities' available in DrillingInfo database.
4) For late reporting states the last year of available data is repeated for missing years (TN 2012 used for 2013‐16, KY 2013 used for 2014‐16 and MO 2014 for 2015‐16). All years are missing for IL and IN.
5) To be consistent between states a GOR of 6,000 (cf/bbl) for each years production was used to define oil versus gas wells. If the GOR was less (greater) than 6,000 (cf/bbl) the well was classed an oil (gas) well.
6) To determine production rate brackets for the first and last year of a wells life the annual production was divided
by the number of days in the productive months. For other years the annual production was divided by 365 or 366 days.
7) Gas volumes have been converted from the various state pressure bases to the Federal base (14.73 psia).
Data available as of November 2017.
Oil wells Gas wells Total wells
U.S. Energy Information Administration | The Distribution of U.S. Oil and Natural Gas Wells by Production Rate B48

December 2017
Table B49. West Virginia oil and gas well summary statistics, 2016
Annual Annual Annual Annual Annual Annual
oil Oil rate gas Gas rate gas Gas rate oil Oil rate oil gas Horizontal
Prod. rate bracket # of oil % of oil prod. % of oil per Well prod. per well # of gas % of gas prod. % of gas per well prod. per well # of total prod. prod. well
(BOE/day) wells wells (MMbbl) prod. (bbl/day) (Bcf) (Mcf/day) wells wells (Bcf) Prod. (Mcf/Day) (MMbbl) (bbl/Day) wells (MMbbl) (Bcf) count
0 ‐ 1 3,012 81.3 0.2 31.1 0.3 0.3 0.4 29,920 56.2 23.3 1.7 2.3 0.1 0.0 32,932 0.3 23.6 77
1 ‐ 2 332 9.0 0.1 13.0 1.1 0.1 1.6 10,355 19.4 31.0 2.3 8.5 0.1 0.0 10,687 0.2 31.1 66
2 ‐ 4 202 5.5 0.1 18.5 2.4 0.2 2.7 6,963 13.1 40.1 2.9 16.5 0.1 0.0 7,165 0.2 40.2 125
4 ‐ 6 85 2.3 0.1 10.7 4.1 0.1 4.9 2,187 4.1 21.6 1.6 28.7 0.0 0.0 2,272 0.1 21.7 118
6 ‐ 8 30 0.8 0.0 5.9 5.3 0.1 8.1 876 1.6 11.9 0.9 40.9 0.0 0.1 906 0.1 12.0 86
8 ‐ 10 18 0.5 0.0 5.6 7.3 0.1 10.6 429 0.8 7.4 0.5 53.2 0.0 0.1 447 0.1 7.5 59
Subtotal <=10 3,679 99.3 0.7 84.8 0.6 0.9 0.8 50,730 95.2 135.2 9.8 7.7 0.3 0.0 54,409 1.0 136.1 531
10 ‐ 12 5 0.1 0.0 1.4 8.5 0.0 13.4 234 0.4 4.9 0.4 65.0 0.0 0.0 239 0.0 4.9 42
12 ‐ 15 7 0.2 0.0 3.2 10.5 0.0 13.7 159 0.3 3.9 0.3 79.1 0.0 0.1 166 0.0 3.9 31
Subtotal <=15 3,691 99.6 0.7 89.5 0.6 0.9 0.9 51,123 96.0 144.0 10.5 8.1 0.3 0.0 54,814 1.0 145.0 604
15 ‐ 20 6 0.2 0.0 4.0 17.3 0.0 4.1 132 0.3 3.8 0.3 101.0 0.0 0.1 138 0.0 3.8 32
20 ‐ 25 5 0.1 0.0 1.5 23.5 0.0 1.3 61 0.1 2.2 0.2 131.2 0.0 0.3 66 0.0 2.2 13
25 ‐ 30 1 0.0 0.0 1.3 27.7 0.0 0.0 36 0.1 1.6 0.1 163.4 0.0 0.0 37 0.0 1.6 9
30 ‐ 40 0 0.0 0.0 0.0 0.0 0.0 0.0 47 0.1 2.7 0.2 200.7 0.0 1.2 47 0.0 2.7 24
40 ‐ 50 0 0.0 0.0 0.0 0.0 0.0 0.0 35 0.1 2.7 0.2 265.3 0.0 0.4 35 0.0 2.7 22
50 ‐ 100 0 0.0 0.0 0.0 0.0 0.0 0.0 219 0.4 34.5 2.5 446.8 0.3 3.8 219 0.3 34.5 207
Subtotal <=100 3,703 100.0 0.8 96.2 0.7 1.0 0.9 51,653 97.0 191.6 13.9 10.7 0.6 0.0 55,356 1.4 192.5 911
100 ‐ 200 0 0.0 0.0 0.0 0.0 0.0 0.0 459 0.9 137.0 10.0 840.8 1.1 6.9 459 1.1 137.0 459
200 ‐ 400 1 0.0 0.0 0.7 178.6 0.0 177.7 557 1.1 322.8 23.5 1,653.2 1.5 7.5 558 1.5 322.8 555
400 ‐ 800 1 0.0 0.0 3.1 264.4 0.1 1,516.1 405 0.8 421.6 30.6 3,191.4 2.2 16.6 406 2.2 421.7 406
800 ‐ 1,600 0 0.0 0.0 0.0 0.0 0.0 0.0 153 0.3 241.3 17.5 6,154.6 1.1 28.8 153 1.1 241.3 153
1,600 ‐ 3,200 0 0.0 0.0 0.0 0.0 0.0 0.0 35 0.1 53.2 3.9 10,920.4 0.3 64.9 35 0.3 53.2 35
3,200 ‐ 6,400 0 0.0 0.0 0.0 0.0 0.0 0.0 1 0.0 2.2 0.2 36,456.5 0.0 0.0 1 0.0 2.2 1
6,400 ‐ 12,800 0 0.0 0.0 0.0 0.0 0.0 0.0 2 0.0 6.2 0.5 51,474.7 0.0 4.8 2 0.0 6.2 2
> 12,800 0 0.0 0.0 0.0 0.0 0.0 0.0 0 0.0 0.0 0.0 0.0 0.0 0.0 0 0.0 0.0 0
Total 3,705 100.0 0.8 100.0 0.7 1.1 1.0 53,265 100.0 1,375.8 100.0 74.7 6.8 0.4 56,970 7.6 1,376.9 2,522
Notes:
1) Source: State administrative oil & natural gas data thru DrillingInfo.
2) The total volumes shown in the distribution tables may not exactly agree with other related data, including other EIA sources. Major reasons for differences include: the timing of updates from state and commercial sources,
the summed production of available well‐level production data versus state‐level aggregations of production, and how a well is defined and which entities are counted and summed.
3) Wells counted for this report include sidetracks, completions, re‐completions and leases, this includes all oil and/or gas producing 'entities' available in DrillingInfo database.
4) For late reporting states the last year of available data is repeated for missing years (TN 2012 used for 2013‐16, KY 2013 used for 2014‐16 and MO 2014 for 2015‐16). All years are missing for IL and IN.
5) To be consistent between states a GOR of 6,000 (cf/bbl) for each years production was used to define oil versus gas wells. If the GOR was less (greater) than 6,000 (cf/bbl) the well was classed an oil (gas) well.
6) To determine production rate brackets for the first and last year of a wells life the annual production was divided
by the number of days in the productive months. For other years the annual production was divided by 365 or 366 days.
7) Gas volumes have been converted from the various state pressure bases to the Federal base (14.73 psia).
Data available as of November 2017.
Oil wells Gas wells Total wells
U.S. Energy Information Administration | The Distribution of U.S. Oil and Natural Gas Wells by Production Rate B49

December 2017
Table B50. Wyoming oil and gas well summary statistics, 2016
Annual Annual Annual Annual Annual Annual
oil Oil rate gas Gas rate gas Gas rate oil Oil rate oil gas Horizontal
Prod. rate bracket # of oil % of oil prod. % of oil per Well prod. per well # of gas % of gas prod. % of gas per well prod. per well # of total prod. prod. well
(BOE/day) wells wells (MMbbl) prod. (bbl/day) (Bcf) (Mcf/day) wells wells (Bcf) Prod. (Mcf/Day) (MMbbl) (bbl/Day) wells (MMbbl) (Bcf) count
0 ‐ 1 2,063 20.5 0.3 0.5 0.4 0.1 0.1 2,179 9.2 1.2 0.1 2.1 0.0 0.0 4,242 0.3 1.3 43
1 ‐ 2 1,039 10.3 0.5 0.8 1.4 0.3 0.8 1,106 4.7 3.1 0.2 8.5 0.0 0.1 2,145 0.5 3.4 31
2 ‐ 4 1,391 13.8 1.2 2.2 2.6 0.8 1.7 1,887 8.0 10.9 0.6 16.8 0.1 0.2 3,278 1.3 11.7 41
4 ‐ 6 899 8.9 1.4 2.4 4.5 0.7 2.4 1,417 6.0 14.0 0.8 28.6 0.1 0.2 2,316 1.5 14.8 51
6 ‐ 8 652 6.5 1.4 2.6 6.5 0.6 2.6 1,336 5.6 18.6 1.0 40.4 0.1 0.3 1,988 1.6 19.2 60
8 ‐ 10 490 4.9 1.5 2.6 8.5 0.4 2.4 1,141 4.8 20.7 1.2 52.2 0.1 0.3 1,631 1.6 21.1 29
Subtotal <=10 6,534 64.8 6.2 11.1 2.9 2.8 1.3 9,066 38.3 68.6 3.8 23.3 0.5 0.2 15,600 6.7 71.5 255
10 ‐ 12 378 3.8 1.4 2.4 10.3 0.5 3.6 1,154 4.9 25.7 1.4 63.6 0.2 0.4 1,532 1.5 26.2 41
12 ‐ 15 506 5.0 2.3 4.1 12.8 0.7 4.1 1,556 6.6 42.6 2.4 78.2 0.3 0.5 2,062 2.5 43.3 62
Subtotal <=15 7,418 73.6 9.9 17.5 4.0 4.0 1.6 11,776 49.7 136.9 7.6 35.2 0.9 0.2 19,194 10.8 140.9 358
15 ‐ 20 544 5.4 3.2 5.7 16.5 1.0 5.3 2,157 9.1 76.2 4.3 100.6 0.5 0.7 2,701 3.7 77.2 89
20 ‐ 25 390 3.9 2.9 5.2 21.1 1.0 7.2 1,768 7.5 80.3 4.5 129.1 0.6 0.9 2,158 3.5 81.3 66
25 ‐ 30 273 2.7 2.5 4.4 25.8 0.9 9.7 1,415 6.0 78.0 4.4 156.6 0.6 1.3 1,688 3.1 79.0 79
30 ‐ 40 344 3.4 3.8 6.8 31.9 2.1 17.8 1,889 8.0 132.6 7.4 198.8 1.0 1.5 2,233 4.8 134.7 139
40 ‐ 50 222 2.2 3.1 5.5 40.2 2.1 26.7 1,236 5.2 112.6 6.3 254.9 0.9 2.1 1,458 4.0 114.6 120
50 ‐ 100 522 5.2 11.3 20.0 61.6 9.8 53.7 2,136 9.0 292.8 16.3 385.8 2.7 3.5 2,658 13.9 302.6 383
Subtotal <=100 9,713 96.3 36.6 65.0 11.2 21.0 6.4 22,377 94.5 909.4 50.8 119.1 7.2 0.9 32,090 43.8 930.4 1,234
100 ‐ 200 228 2.3 8.6 15.3 110.4 10.6 136.2 734 3.1 190.1 10.6 761.2 2.5 9.9 962 11.0 200.7 244
200 ‐ 400 89 0.9 5.6 9.9 207.8 10.0 369.7 375 1.6 180.4 10.1 1,505.7 3.0 25.0 464 8.6 190.4 120
400 ‐ 800 45 0.5 4.1 7.3 375.7 10.6 978.3 155 0.7 113.6 6.3 2,858.0 2.5 62.7 200 6.6 124.2 64
800 ‐ 1,600 8 0.1 1.3 2.2 678.4 3.7 1,988.8 21 0.1 31.1 1.7 5,389.6 0.8 138.4 29 2.1 34.8 14
1,600 ‐ 3,200 1 0.0 0.2 0.3 1,643.8 0.2 2,339.8 5 0.0 24.3 1.4 13,281.2 0.1 72.0 6 0.3 24.5 4
3,200 ‐ 6,400 0 0.0 0.0 0.0 0.0 0.0 0.0 16 0.1 165.1 9.2 28,193.6 0.1 19.6 16 0.1 165.1 4
6,400 ‐ 12,800 0 0.0 0.0 0.0 0.0 0.0 0.0 9 0.0 177.7 9.9 53,942.1 0.0 0.0 9 0.0 177.7 0
> 12,800 0 0.0 0.0 0.0 0.0 0.0 0.0 0 0.0 0.0 0.0 0.0 0.0 0.0 0 0.0 0.0 0
Total 10,084 100.0 56.3 100.0 16.6 56.1 16.5 23,692 100.0 1,791.8 100.0 222.2 16.1 2.0 33,776 72.4 1,847.9 1,684
Notes:
1) Source: State administrative oil & natural gas data thru DrillingInfo.
2) The total volumes shown in the distribution tables may not exactly agree with other related data, including other EIA sources. Major reasons for differences include: the timing of updates from state and commercial sources,
the summed production of available well‐level production data versus state‐level aggregations of production, and how a well is defined and which entities are counted and summed.
3) Wells counted for this report include sidetracks, completions, re‐completions and leases, this includes all oil and/or gas producing 'entities' available in DrillingInfo database.
4) For late reporting states the last year of available data is repeated for missing years (TN 2012 used for 2013‐16, KY 2013 used for 2014‐16 and MO 2014 for 2015‐16). All years are missing for IL and IN.
5) To be consistent between states a GOR of 6,000 (cf/bbl) for each years production was used to define oil versus gas wells. If the GOR was less (greater) than 6,000 (cf/bbl) the well was classed an oil (gas) well.
6) To determine production rate brackets for the first and last year of a wells life the annual production was divided
by the number of days in the productive months. For other years the annual production was divided by 365 or 366 days.
7) Gas volumes have been converted from the various state pressure bases to the Federal base (14.73 psia).
Data available as of November 2017.
Oil wells Gas wells Total wells
U.S. Energy Information Administration | The Distribution of U.S. Oil and Natural Gas Wells by Production Rate B50