The Dirty Laundry of Employee Award Programs: Evidence ... Files/13-069_72eed050-c2d7-4dc1... ·...
36
Copyright © 2013 by Timothy Gubler, Ian Larkin, and Lamar Pierce Working papers are in draft form. This working paper is distributed for purposes of comment and discussion only. It may not be reproduced without permission of the copyright holder. Copies of working papers are available from the author. The Dirty Laundry of Employee Award Programs: Evidence from the Field Timothy Gubler Ian Larkin Lamar Pierce Working Paper 13-069 February 11, 2013
Transcript of The Dirty Laundry of Employee Award Programs: Evidence ... Files/13-069_72eed050-c2d7-4dc1... ·...
Copyright © 2013 by Timothy Gubler, Ian Larkin, and Lamar Pierce
Working papers are in draft form. This working paper is distributed for purposes of comment and discussion only. It may not be reproduced without permission of the copyright holder. Copies of working papers are available from the author.
The Dirty Laundry of Employee Award Programs: Evidence from the Field Timothy Gubler Ian Larkin Lamar Pierce
Working Paper
13-069 February 11, 2013

The Dirty Laundry of Employee Award Programs: Evidence from the Field
Timothy Gubler
Olin School of Business, Washington University in St. Louis [email protected]
Ian Larkin
Harvard Business School [email protected]
Lamar Pierce
Olin School of Business, Washington University in St. Louis [email protected]
February 11, 2013
Many scholars and practitioners have recently argued that corporate awards are a “free” way to motivate employees. We use field data from an attendance award program implemented at one of five industrial laundry plants to show that awards can carry significant spillover costs and may be less effective at motivating employees than the literature suggests. Our quasi-experimental setting shows that two types of unintended consequences limit gains from the reward program. First, employees strategically game the program, improving timeliness only when eligible for the award, and call in sick to retain eligibility. Second, employees with perfect pre-program attendance or high productivity suffered a 6-8% productivity decrease after program introduction, suggesting they were demotivated by awards for good behavior they already exhibited. Overall, our results suggest the award program decreased plant productivity by 1.4%, and that positive effects from awards are accompanied by more complex employee responses that limit program effectiveness.
1. Introduction
The use of employee award programs is widespread. Over 80 percent of companies use programs
that provide awards such as “employee of the month”, “top salesperson”, or “best innovation” (Garr 2012).
A small but growing literature in management and economics argues that employee award programs are so
common because they positively influence the behavior and performance of individual workers, and thereby
improve firm performance. This work suggests that even awards with minimal or no financial benefits can
spur positive motivational effects through several psychological mechanisms. First, awards may increase
self-esteem (Kuhnen and Tymula 2012) or identity with the employer (Akerlof and Kranton 2005;
Neckermann et al. 2012), which can improve employee performance after winning an award. Second,
competition driven by the desire for positive social comparisons with peers (Festinger 1954) may motivate
effort even before an award is granted (Markham et al. 2002; Moldovanu et al 2007; Kosfeld and
Neckermann 2011).1 These ex-post and ex-ante performance gains have led several researchers to suggest
that awards programs with low marginal costs are a “free” method by which firms can boost employee
productivity (Besley and Ghatak 2008; Blanes i Vidal and Nossol 2011).2
Despite this emerging evidence of award program benefits, there are reasons to believe such
programs might carry unexpected costs. Larkin (2010) finds that award programs increase strategic “gaming”
by salespeople that may not not benefit the firm. Malmendier and Tate (2009) find that CEOs suffer
decreased performance after receiving an award from major financial publications, likely due to distraction
and overly risky decisions. Other research suggests that simply providing feedback on relative standing, which
is a frequent component of a corporate award system, can dramatically reduce performance (Barankay 2012).
This lower performance could occur due to reduced motivation born of employee envy or perceptions of
unfairness, particularly if an award program is viewed as a type of compensation that is not clearly linked to
employee contributions (De Boer et al. 2002; Nickerson and Zenger 2008; Fehr et al. 2009; Larkin et al.
2012). Furthermore, an award program designed to reward prosocial behavior might “crowd out” the
intrinsic motivation of employees (Frey and Meier, 2004), or it may reduce the signaling value of prosocial
behavior might demotivate employees seeking to project a prosocial image (Ariely et al. 2009). If awards
indeed lead to significant gaming, reduced motivation, or crowding out from perceptions of unfairness or
decreased signaling value, are these “spillover costs” large enough to undermine potential program benefits to
the firm?
In this paper, we simultaneously examine the costs and benefits of an attendance award program that
1 Similarly, awards may improve employee career prospects, motivating workers through the potential to win extrinsic benefits 2 An extensive practitioner literature also claims extensive benefits to the firm from awards programs (e.g. Davidson 1999; Boyle 1996).

was implemented in an industrial laundry plant. The award was independently implemented in only one of the
firm’s five plant by the plant manager, allowing us to investigate the effect of the award in a
quasi-experimental way, using employees at the four plants that did not implement the award as a
quasi-control group..We first examine the award program’s intended impact on the attendance behavior of all
relevant employees. Specifically, we investigate the heterogeneous responses of employees with poor vs.
outstanding historical attendance records, as well as those of highly productive employees vs. those who are
less productive. Second, our data allow us to examine the effect of the award not only on attendance, which
was the rationale for the award, but also on individual worker productivity, which the manager instituting the
award did not expect to be affected by the program.
Our setting is a privately-owned industrial laundry company with five plants distributed across three
states in the Midwestern United States. In March 2011, the managers at one of the plants independently
implemented an attendance award program, which continued for nine months until corporate headquarters
intervened and discontinued it.3 Each employee with perfect attendance for a given month, defined as not
having any unexcused absences or tardy shift arrivals, was entered in a drawing for a $75 gift card to a local
restaurant or store. On the first Tuesday of the following month, the plant manager would hold a meeting
attended by the entire plant where all award-eligible employees would put their name in a hat and the
previous month’s winner would then draw out one new winner. The plant manager then reminded the
employees that they were all eligible for the next month’s award, until they had an unexcused absence or
tardy. At the end of the sixth award month, the plant manager held an additional drawing for a $100 gift card
for all employees with perfect records over the entire six-month period. The expected monetary value of each
monthly award was less than $5, but the award brought significant recognition from management and peers.
We use a 21-month panel of daily worker-level data at all five plants that spans a year before and nine
months after the introduction of the award policy. The data, which measure attendance, tardiness, and
productivity, cover all workers at both the award plant and the four plants that did not introduce the award.
These daily data, combined with award eligibility lists from the plant manager, allow us to compare the
program’s impact on worker behavior in the “treated” plant with behavior of the baseline group in four
“untreated” plants. We use a difference-in-differences model with both worker and time fixed effects to
examine the causal effect of the award on tardiness, attendance, and productivity. We find that the award on
average reduced the likelihood and average level of tardiness (defined as being more than five minutes late for
a shift) and increased punctuality (defined as “punching in” on time) among workers that were participating
in the program.
However, we find that the award did not appear to lead to a habituation of punctuality or other good
3 The decision to shut down the program was primarily based on the owners’ judgment that workers should not be given an award for behavior that was expected of all employees. The firm had not examined the effect of the award before sharing the data with us.
attendance behavior, but instead led to strategic gaming that varied by employee type. Employees who were
often tardy before the award introduction did just enough to avoid being disqualified by being five minutes
late, but still tended to arrive late for their shifts. Employees with few tardies in the pre-treatment period
arrived somewhat earlier for their shifts, but this effect appears to be completely due to a desire to avoid
disqualification (most likely from risk aversion). Once an employee became disqualified from the award, she
immediately reverted to her previous behavior. Most interestingly, employees were 50% more likely to have
an unplanned “single absence” after the award was implemented, suggesting that employees who would
otherwise have arrived to work tardy on a certain day might instead either call in sick to avoid disqualification
or else simply stay home because they would be disqualified from the award regardless.
Most seriously, we find that two highly valued employee groups – the most productive workers and
the most consistently punctual workers – suffered a 6-8% decrease in productivity after the award was
instituted. Employee pay was on average only weakly tied to individual productivity, but was unrelated to
marginal productivity for the most productive employees, who suffered no decrease in pay from the 6-8%
productivity loss.4 In our setting, however, the extrinsic rewards (for attendance) reduced the intrinsic
motivation in a completely separate domain: (uncompensated) productivity.
Although there are several explanations for why the award caused this productivity decrease, it is
consistent with a “crowding out” effect (Deci and Ryan 1985), where the introduction of extrinsic rewards
reduced intrinsic motivation, defined as motivation that does not stem from extrinsic benefits.5 One likely
mechanism for this “crowding out” is demotivation due to perceptions of unfairness (Akerlof and Yellen
1988; 1990; Cooper, Dyck, and Frohlich 1992; Larkin et al. 2012), since employees who “did the right thing”
may have questioned why an award was necessary to promote this behavior, or felt it was unfair that those
with poor pre-program attendance could win the award.6 Another possible mechanism is that the
introduction of the award for attendance decreased the image value of high productivity (e.g. Ariely et al.
2009). There were no other productivity effects from the award.
The plant manager anticipated that the award’s direct cost of $75 per month would easily “pay for
itself” through improved attendance, which would directly increase productivity. Better attendance should
directly increase productivity, but more importantly should increase the productivity of peers, due to the
assembly-line nature of the work and the potential for bottlenecks and idling time if an upstream worker were
late or absent. At worst, the manager felt he would only be required to spend $75 on the gift card every
month. However, our basic regression results estimate that the award led to an overall decrease in plant
4 We will explain the compensation system in Section III. 5 However, as discussed in the final section of the paper, we cannot show that intrinsic motivation leads some employees to continue to be productive beyond the point of increased compensation. A host of extrinsic factors, such as peer pressure or cultural norms, might also explain why this group of employees continued to work even when not paid for it. 6 In fact, throughout the course of the award program only one individual from the “consistently punctual” or “notardy” group won the award, and it was not until the September drawing—7 months after the program began.
productivity of 1.4%, and thereby increased costs of roughly $1,500 per month. Overall, these results suggests
awards do not always represent “free” motivation, and that even a very simple award program can have
unplanned, negative outcomes that are significant to the overall performance of the firm.
This paper contributes to two important and growing literatures in economics and management.
First, our paper is the first to demonstrate in the field the complex positive and negative impacts of employee
awards programs. While we find similar positive effects to prior studies (e.g. Markham et al. 2002; Neckerman
et al. 2012), we also demonstrate that negative effects such as employee gaming and crowding out may
overwhelm these benefits and render the program as value destroying. We also contribute to the literature on
the complex interaction between extrinsic and intrinsic motivation (e.g. Deci and Ryan 1985; Frey and
Oberholzer-Gee 1997).7 Our study shows that the introduction of rewards for one activity may crowd out
intrinsic motivation in another, the first evidence of such spillovers of which we are aware.
The paper proceeds as follows. Section II discusses the literature and theoretical background behind
award programs. Section III describes our empirical setting and data. Section IV presents our empirical
approach and results, while Section V concludes.
2. Literature and Theoretical Background
2.1 Benefits of Award Programs
Why might awards with little monetary or career value improve positive behavior such as
productivity and reduce negative outcomes such as absenteeism and tardiness? A small body of research on
awards almost exclusively finds positive effects from awards. Meta–analysis by Stajkovic and Luthans (1997)
found that the use of monetary performance feedback and social recognition increased productivity at
manufacturing organizations by 33% and at service organizations by 13%. Kosfeld and Neckermann (2011)
used experiments with students to demonstrate a short-term motivational effect from awards. In a field
setting, Neckermann, Cueni, and Frey (2012) found that the introduction of several unannounced symbolic
awards in a call center increased performance among both award recipients and non-recipients on tasks
completely different than those for which the awards were given. While their study lacked a control group, it
nevertheless suggests strong short-term motivation from awards.
A large body of research in sociology, economics and psychology suggests that much of this
motivation may be based in employees caring about status and social recognition by peers and employers
(Greenberg 1988). Economic theorists have argued that individuals are motivated to seek social approval
(Akerlof 1980; Benabou and Tirole 2006; Andreoni and Bernheim 2007; Ellingsen and Johannesson 2008;
Moldovanu et al. 2007), which explains widespread evidence of increased prosocial behavior in public settings
(Andreoni and Petrie 2004; Dana et al. 2006; O’Reilly and Chatman 1986).
7 See Gneezy et al. (2011) for more extensive discussion of this literature.

Empirical evidence on peer effects in prosocial and antisocial behavior also supports the motivational
power of peer recognition. Ichino and Maggi (2000), for example, showed that peer culture negatively
impacted the absenteeism of coworkers at an Italian bank. Mas and Moretti (2009) found that supermarket
workers increased effort when high-skilled peers were watching them. Similarly, Hars and Ou (2001) showed
that volunteer time and effort increased when recognized by important peers. Employees may even be willing
to pay for peer recognition, based on evidence from a small number of laboratory (e.g., Huberman et al.
2004) and field (e.g., Larkin 2010) studies.
2.2 Potential Costs of Award Programs
There are several reasons, however, to believe that award programs might not provide universally
positive outcomes. Awards programs might carry costs simply because employees learn to “game” the system,
much as they do with monetary rewards (Kerr 1975; Oyer 1998; Larkin 2013). “Gaming” is traditionally
defined as taking unintended actions in response to an incentive system that increase the employee’s objective
function, at the expense of the employer’s objectives. Employees motivated by the award program might
either manipulate perceptions of their behavior or simply strategically engage in only those activities that
improve their award eligibility, when those activities are relevant for the award. Similar to the
calendar-based gaming behavior in Oyer (1998) and Larkin (2013), monthly or annual awards might only
motivate desired behavior toward the end of the eligibility period among those employees who still perceive
some likelihood of winning. Similar results have been theorized and observed among low-performers in
tournament-based compensation systems (Che and Gayle 2003; Fullerton and McAfee 1999; Boudreau et al.
2011; Minor 2012).
Other potential costs may come from the same peer comparisons that generate some benefits.
Although peer comparisons can have many positive effects (as detailed above), they have also been shown to
have negative consequences. For example, a series of laboratory experiments suggest that employees make
value-destroying decisions when these decisions would also lead to a salient reduction in peer recognition
(e.g., Garcia et al. 2006). Recent empirical work shows that peer recognition can motivate cheating and
dishonesty (e.g., Edelman and Larkin 2013) as well as decreased job satisfaction and intention to quit (Card et
al. 2012). These problems may be exacerbated by awards based on subjective or unclear metrics, which might
induce feelings of envy (Nickerson and Zenger 2008) or inequity (Adams 1963). This may explain recent
contradictory field evidence on how peer comparisons impact worker performance. Barankay (2012), for
example, shows that the introduction of a tool that reveals to all furniture salespeople their relative sales
productivity led to large productivity decreases across the performance distribution. In contrast, Blanes i
Vidal and Nossol (2011) find that a very similar ranking system used for warehouse employees led to large
increases in productivity, again with no differences across employee types.
In addition, the introduction of an award for prosocial behavior could have negative effects on

motivation and productivity because it “crowds out” some employees’ intrinsic motivation. One mechanism
through which intrinsic motivation might be crowded out is fairness. Perceptions of unfairness are known to
motivate decreased effort and productivity (Akerlof and Yellen 1988; 1990; Cooper, Dyck, and Frohlich
1993) while increasing other counterproductive behaviors (Skarlicki and Folger 1997; Ambrose et al. 2002;
Gino and Pierce 2009). Employees who were already performing at the level required to win an award may
perceive it to be unfair that some employees receive awards despite only engaging in this behavior after the
program was implemented. Recent work suggests another mechanism for crowding out based on workers
being motivated to engage in prosocial behavior by the positive image that such acts project to others
(Benabou and Tirole 2006; Lacetera and Macis 2010). The introduction of extrinsic rewards might be
demotivating by reducing the signaling value of such behavior, thereby “crowding out” image motivation
(Gneezy and Rustichini 2000a; Ariely et al. 2009). Additionally, workers may be demotivated if they perceive
the award program as biased, similar to recent experimental work on performance feedback (Ederer and Fehr
2009).
Since employee awards are usefully thought of as an additional way to incentivize employees, it
would be surprising if employees did not respond to these incentives in dysfunctional ways. However, this
possibility has been largely ignored by the research on awards. In sum, there have been very few studies that
attempt to evaluate a more comprehensive set of costs and benefits of awards, despite the clear predictions
from the social comparisons and incentive systems gaming literatures that employee awards systems are likely
to result in detrimental behavior in some circumstances.
2.3 Award Programs for Attendance
Like other prosocial behaviors, firms commonly seek to motivate punctuality and attendance through
award programs. Absenteeism, defined as unexcused job absence or significant unexcused late arrival to work,
is a large cost for many businesses. Navarro and Bass (2006) estimate that absenteeism costs employers as
much as 15% of payroll, while Delonzor (2005) puts the aggregate cost to US organizations at $3 billion a
year. Absenteeism is particularly costly in workplaces with traditional production lines, where jobs are highly
interrelated, workers tend to specialize in only a few tasks, and production time is important. An unplanned
absence or significant lateness can greatly affect productivity of downstream workers, meaning that the cost
of absenteeism is not limited to the missing employee. Because of the significant costs of absenteeism, many
companies have established formal programs to try to reduce it (Pauly et al. 2002).
The existing evidence on the efficacy of these programs is mixed, despite the historical perception
among managers that such programs are effective (Scott and Markham 1982). Research in the management
literature (Knight et al. 2001) asserts that awards tied to specific attendance goals should lead to employees
reducing absenteeism. Camden, Price, and Ludwig (2011) find empirical evidence that a public feedback and
credit reward system decreased absenteeism among grocery store workers, but their experiment lacked a
control group to account for the counterfactual. In a classic study, Pedalino and Gamboa (1974) find that the
introduction of a lottery award system reduced absenteeism among hourly workers at a manufacturing plant.
While this study did feature a control group, it did not statistically account for pre-treatment differences
between the groups. In a quasi-experiment, Markham, Scott, and McKee (2002) find that public recognition
decreases absenteeism at manufacturing plants. However, their attendance metrics were at the plant-level
rather than the employee-level, so they could not explore the differential effect of awards on different worker
groups nor pinpoint potential strategic gaming behaviors.
3. Empirical Setting
3.1 Industrial Laundry Production
The setting for this study is a private commercial laundry services company in the Midwestern United
States, which we will refer to as LaundryCo.8 LaundryCo is a leading regional provider of work uniforms,
professional work apparel, and commercial laundry cleaning services. Their services primarily include the
selling, cleaning, and repairing of work uniforms and small workplace items such as mats, towels, and mop
heads. Nearly all of the cleaning services occur at five plants, which are similar in layout, machinery, staffing
positions, and products.9 Figure 1 presents a photograph of the interior of a typical plant.
The basic production flow of the plants is detailed in Figure 2. Each day route-service representatives
drop off soiled uniforms, and the dirty uniforms are taken through a complex, interrelated process so that the
cleaned garments can be returned to customers. This involves sorting the uniforms by garment type and the
amount of soil; washing the garment with the appropriate water temperature and chemical mix; drying the
garment; pressing it; doing quality inspection so that garments with missing buttons or other problems are
fixed; and ensuring the garment ends up on the correct rack, so that the RSR can quickly and easily load the
clean garments to return to customers. Non-uniform items undergo a similar process, but extra steps are
often involved, such as rolling laundered floor mats. Workers are cross-trained on many different tasks within
the plant, but tend to specialize in a relatively small number of tasks. As with most labor-intensive service
operations, LaundryCo is highly dependent on the efficiency of its workers. Inefficiency occurs both when
there are mistakes, such as garments being sorted incorrectly, and when the productivity of upstream workers
lags, leaving downstream workers idle as they wait for garments. For example, if the worker operating the
dryer gets behind, then the worker operating the pressing machine will stand idle until she has uniforms to
press.
LaundryCo tracks productivity for each worker, measuring how many garments a worker processes
8 The largest public companies similar to LaundryCo are Cintas and Aramark. 9 A very small volume of medical facility linens and uniforms are cleaned in a separate facility, since they require different standards.
for each task each day. The company then uses the task’s time-studied rate,10 determined by corporate
headquarters, to calculate the employee’s productivity on that task given the amount of time spent on it. The
scores are normalized such that 100 reflects performance that meets expectations. For example, the
time-studied rate for “pressing dress shirts” is 50.4 seconds, meaning an employee would have to press over
71 shirts in an hour to earn a score of 100. For each worker, the system computes an overall daily
productivity rate, equal to the weighted average (by time spent) of the worker’s productivity scores on each
task that day. For example, a worker who spent two hours pressing dress shirts with an efficiency score of 80,
two hours rolling mats with a score of 140, and four hours sorting cleaned clothes with a score of 160 would
have a final daily productivity of 135.
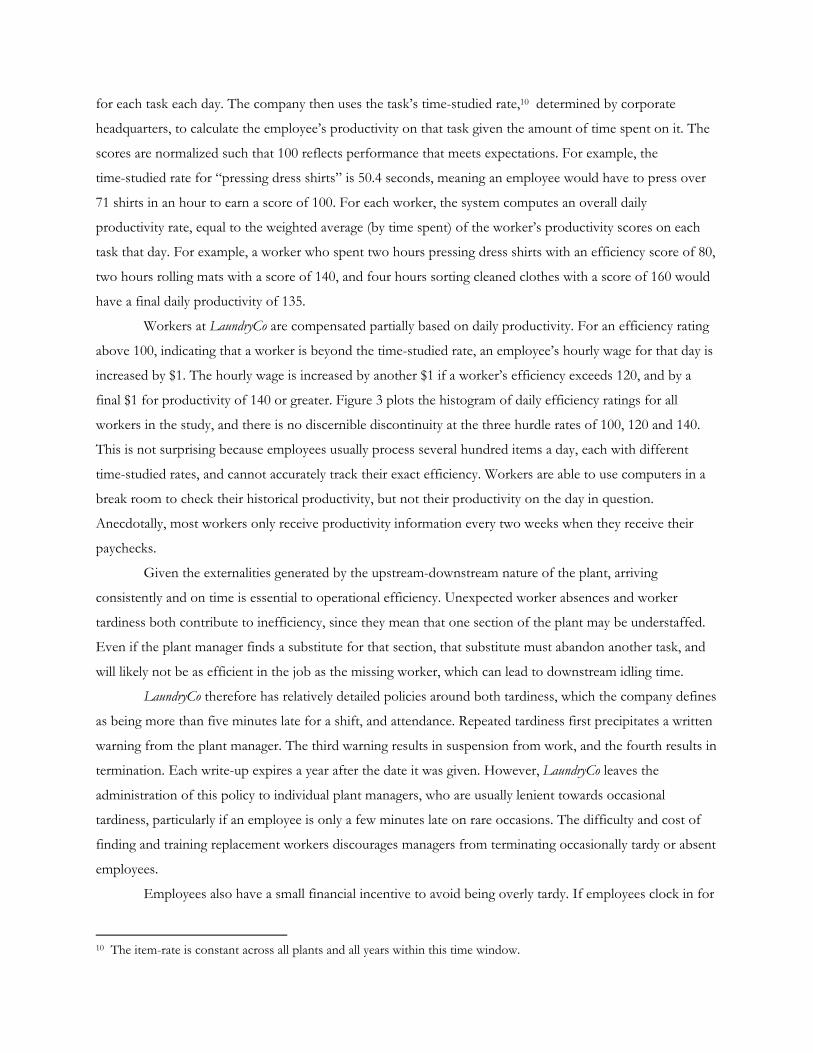
Workers at LaundryCo are compensated partially based on daily productivity. For an efficiency rating
above 100, indicating that a worker is beyond the time-studied rate, an employee’s hourly wage for that day is
increased by $1. The hourly wage is increased by another $1 if a worker’s efficiency exceeds 120, and by a
final $1 for productivity of 140 or greater. Figure 3 plots the histogram of daily efficiency ratings for all
workers in the study, and there is no discernible discontinuity at the three hurdle rates of 100, 120 and 140.
This is not surprising because employees usually process several hundred items a day, each with different
time-studied rates, and cannot accurately track their exact efficiency. Workers are able to use computers in a
break room to check their historical productivity, but not their productivity on the day in question.
Anecdotally, most workers only receive productivity information every two weeks when they receive their
paychecks.
Given the externalities generated by the upstream-downstream nature of the plant, arriving
consistently and on time is essential to operational efficiency. Unexpected worker absences and worker
tardiness both contribute to inefficiency, since they mean that one section of the plant may be understaffed.
Even if the plant manager finds a substitute for that section, that substitute must abandon another task, and
will likely not be as efficient in the job as the missing worker, which can lead to downstream idling time.
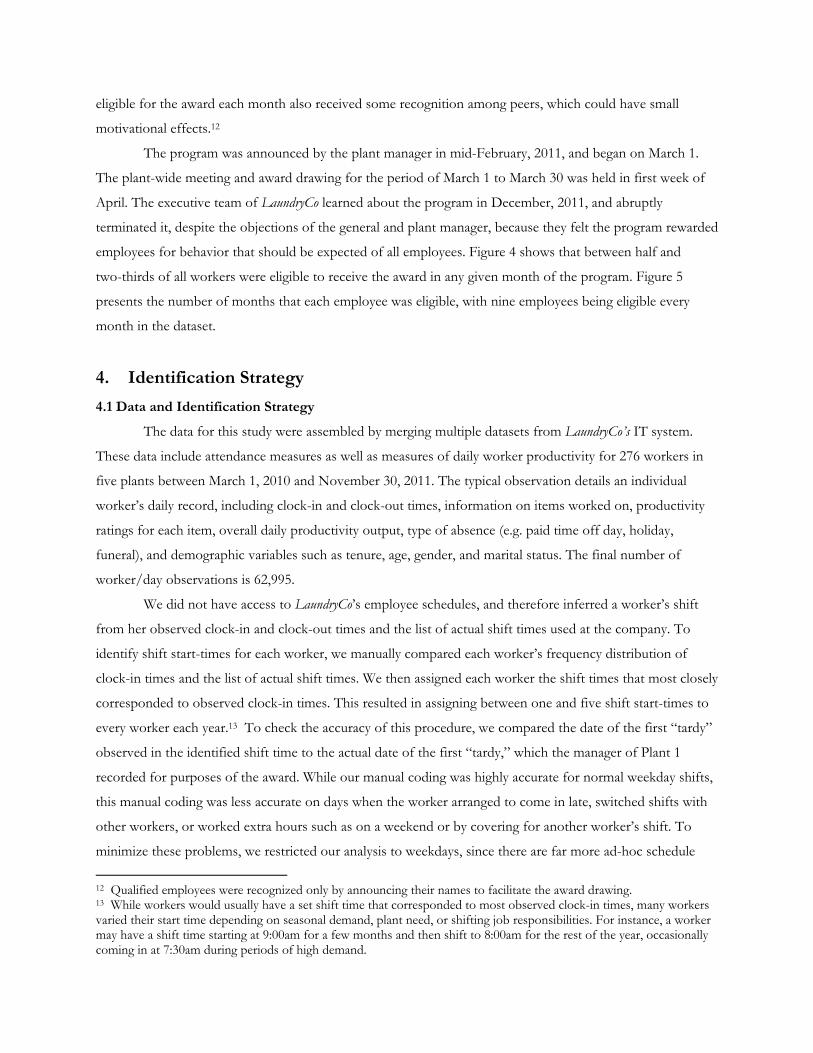
LaundryCo therefore has relatively detailed policies around both tardiness, which the company defines
as being more than five minutes late for a shift, and attendance. Repeated tardiness first precipitates a written
warning from the plant manager. The third warning results in suspension from work, and the fourth results in
termination. Each write-up expires a year after the date it was given. However, LaundryCo leaves the
administration of this policy to individual plant managers, who are usually lenient towards occasional
tardiness, particularly if an employee is only a few minutes late on rare occasions. The difficulty and cost of
finding and training replacement workers discourages managers from terminating occasionally tardy or absent
employees.
Employees also have a small financial incentive to avoid being overly tardy. If employees clock in for
10 The item-rate is constant across all plants and all years within this time window.

their shift more than 7 minutes late, the clock-in time rounds up to the next 15 minute interval, resulting in
the loss of 15 minutes of wages for the day. If they clock in less than 7 minutes late, their clock-in time is
rounded down to the 15-minute interval below. It is important to note that these 15-minute thresholds only
affect the number of minutes for which an employee was paid, and not the efficiency calculation, which uses
an employee’s actual clock-in and clock-out times. Also, employees often clock in a few minutes early,
resulting in them “working for free” for the first few minutes of their shift.
Employees could be absent for excused reasons, such as vacation days. Sickness is considered an
excused absence if the employee notified the manager of their illness even a few minutes before the start of
their shift. There are no specific absence policies in place to avoid unexcused absences. If an employee does
not show up and was not excused they simply lose one of their paid-time off (PTO) or vacation days. If
unexcused absences become a problem, however, the worker is warned by the plant manager and potentially
terminated.
Each of the plants has around 35 employees, many of whom have worked for LaundryCo for many
years. As a family-owned company with a long history in the local area, LaundryCo puts significant effort into
building a “friendly” workplace through programs such as birthday recognition and company events. Since
employees switch between tasks on the production line, they interact with their colleagues frequently over the
course of a day. Each plant utilizes a general manager and a plant manager. The plant manager focuses on
plant efficiency and worker productivity. These managers enjoy substantial autonomy in the policies they
pursue to increase plant efficiency.
3.2 Attendance Award Program
In an effort to encourage higher employee attendance and decrease employee tardiness, the general
and plant manager at one LaundryCo plant (hereafter referred to as “Plant 1”) independently decided to
implement an attendance awards program. The implementation of the program at Plant 1, as opposed to the
other facilities, appears to be somewhat random, allowing us to treat it as “quasi-experimental.” The
corporate headquarters was unaware of the decision to implement the local program. Furthermore, the award
program does not appear to have been created to address a problem exceptional to Plant 1.11 All employees
without an excused absence or tardy in the previous month were eligible for the award. For the purpose of
the award, an unexcused absence was defined as an unexpected absence where the employee did not notify
the plant management before the absence, while “tardy” was defined as being more than five minutes late. All
eligible employees were announced at a monthly plant-wide meeting, where the plant manager or the previous
winner randomly drew the name of one award-winning employee for a $75 gift card to a local restaurant or
store. Although we define the “award winner” as the employee receiving the gift card, employees who were
11 We will address differences in the plants later in the descriptive statistics.
eligible for the award each month also received some recognition among peers, which could have small
motivational effects.12
The program was announced by the plant manager in mid-February, 2011, and began on March 1.
The plant-wide meeting and award drawing for the period of March 1 to March 30 was held in first week of
April. The executive team of LaundryCo learned about the program in December, 2011, and abruptly
terminated it, despite the objections of the general and plant manager, because they felt the program rewarded
employees for behavior that should be expected of all employees. Figure 4 shows that between half and
two-thirds of all workers were eligible to receive the award in any given month of the program. Figure 5
presents the number of months that each employee was eligible, with nine employees being eligible every
month in the dataset.
4. Identification Strategy
4.1 Data and Identification Strategy
The data for this study were assembled by merging multiple datasets from LaundryCo’s IT system.
These data include attendance measures as well as measures of daily worker productivity for 276 workers in
five plants between March 1, 2010 and November 30, 2011. The typical observation details an individual
worker’s daily record, including clock-in and clock-out times, information on items worked on, productivity
ratings for each item, overall daily productivity output, type of absence (e.g. paid time off day, holiday,
funeral), and demographic variables such as tenure, age, gender, and marital status. The final number of
worker/day observations is 62,995.
We did not have access to LaundryCo’s employee schedules, and therefore inferred a worker’s shift
from her observed clock-in and clock-out times and the list of actual shift times used at the company. To
identify shift start-times for each worker, we manually compared each worker’s frequency distribution of
clock-in times and the list of actual shift times. We then assigned each worker the shift times that most closely
corresponded to observed clock-in times. This resulted in assigning between one and five shift start-times to
every worker each year.13 To check the accuracy of this procedure, we compared the date of the first “tardy”
observed in the identified shift time to the actual date of the first “tardy,” which the manager of Plant 1
recorded for purposes of the award. While our manual coding was highly accurate for normal weekday shifts,
this manual coding was less accurate on days when the worker arranged to come in late, switched shifts with
other workers, or worked extra hours such as on a weekend or by covering for another worker’s shift. To
minimize these problems, we restricted our analysis to weekdays, since there are far more ad-hoc schedule
12 Qualified employees were recognized only by announcing their names to facilitate the award drawing. 13 While workers would usually have a set shift time that corresponded to most observed clock-in times, many workers varied their start time depending on seasonal demand, plant need, or shifting job responsibilities. For instance, a worker may have a shift time starting at 9:00am for a few months and then shift to 8:00am for the rest of the year, occasionally coming in at 7:30am during periods of high demand.

shifts on weekends. We also dropped observations where an employee worked less than 7.5 hours of an 8.5
hour shift, and when our calculations indicate a worker was more than an hour early or late.14 This affected
less than 1% of total weekday observations.
We use five main dependent variables in this paper. The first four (tardy, minutes late, absent, and daily
efficiency), represent performance metrics that the plant manager hoped to improve through the attendance
award program. Tardy is a dummy variable indicating that a given worker showed up more than five minutes
late on a given day, and is the metric for disqualification in the award program. Minutes late is a continuous
measure of the minutes and seconds late an employee showed up to work, and captures the extra time gained
or lost in the program. Minutes late can take a negative value if the employee clocked in early. Absent is a
dummy variable indicating that the worker was absent from work for reasons within the employee’s control,
such as for sickness, vacation, or paid time off. This excludes absences from holidays, workers compensation
days, suspensions, family medical leave, and funerals. Daily worker efficiency is the worker’s productivity
efficiency number for the day.15 Figure 3 shows that a typical employee will have an efficiency number
around 110-120, with high performers consistently performing above 130 and low-performers at less than
100. The last dependent variable, single absence, is a dummy variable indicating the employee was absent that
day but was not absent the previous or following workday. We will use this dependent variable to examine
potential gaming behavior, since it may indicate workers calling in sick days to avoid disqualification on days
in which they are behind schedule.
We use a difference-in-differences (DiD) design to assess the impact of the introduction of the
attendance award on the attendance, punctuality, and productivity of Plant 1’s workers. The DiD design treats
LaundryCo’s other four plants as a quasi-control group. The DiD strategy “differences out” fixed differences
between Plant 1 and the control group plants, and essentially uses post-treatment changes at control group
plants as a counterfactual for what would have happened at Plant 1 had it not enacted the policy. The DiD
approach is the most widely used statistical methodology in the social sciences to examine the impact of
policy changes (Gertler et al. 2011).
Although DiD strategies do not require that treatment and control groups be the same, in our case
the treatment and control plants are very similar on most dimensions. All five plants work on essentially the
same range of tasks, use the same production technology, and share common floor layouts. Also, two of the
control group plants are geographically proximate to Plant 1 (32 and 34 miles, respectively), and therefore
help control for local shocks such as bad weather that might affect tardiness. All five plants had the same
14 Additionally, we reran our analysis dropping those employees that were more than either thirty or forty-five minutes late. The results for both of these analyses were very similar in significance and magnitude, although the results on the single absence variable became insignificant. 15 To minimize the impact of single productivity observations that were outliers, we winsorized daily worker efficiency to two standard deviations from the mean. Based on our discussion with multiple plant managers about the normal range of worker productivity, any such observation was very likely an error.

attendance policies and enforcement procedures. Similarly, DiD studies do not require random assignment of
treatment, but in our case the treatment is quite exogenous, given that the manager of Plant 1 introduced the
award without discussing the idea with the other plant managers or LaundryCo’s senior management.
The biggest difference between Plant 1 and the control group plants is that Plant 1 is the only plant
that is unionized. This fact leads to some clear differences between the treatment and control groups, as seen
in Table 1, which summarizes the data for the two groups at the worker-day level. Although fairly similar in
age, employees at Plant 1 have much higher tenure and also significantly higher wages. There are also
significantly more males at Plant 1. Table 1 also shows that employees at Plant 1 had similar levels of
tardiness and attendance as control plant employees. Table 2 presents employee-level statistics. Although
differences between the treatment and control plants here appear larger, they are biased by their equal
weighting of employees with heterogeneous job tenures.
4.2 Empirical Specification
We use a standard DiD specification to estimate the impact of the award on the dependent variables
in the study:
Yit = αi + β1*TREAT_GRPi + β2*POSTTREATt + β3*TREAT_GRPi*POSTTREATt + ϒt + εit
where Yit is the dependent variable, TREAT_GRP is a dummy variable equal to 1 if the worker is in the
treatment group and zero otherwise, POSTTREAT is a dummy variable equal to 1 for dates after the
attendance program went into effect and zero otherwise, and TREAT_GRP*POSTTREAT is the interaction
of the two previous variables. The coefficient on this interaction (β3) estimates the treatment effect; to
conserve space we simply label this variable as “Treatment” in the results tables. Our specification takes
advantage of the panel nature of the data by introducing a full set of fixed effects. Specifically, we use worker
fixed effects (αi) to account for unobserved worker heterogeneity and time fixed effects (ϒt) for time trends
across months, days in the month, and days of the week. In specifications with worker fixed effects the
variable TREAT_GRP is absorbed, and in specifications with time fixed effects the variable POSTTREAT is
absorbed.
All the regressions reported in the paper were estimated using Ordinary Least Squares (OLS). Three
of the five dependent variables are binary, but logit or probit models perform poorly when predicting rare
events such as the ones in this study (King and Zeng 2001). In contrast, OLS specifications result in unbiased
coefficient estimates (Stewart 2009), but incorrect standard errors. However, DiD models typically
underestimate standard errors regardless of the specification (Bertrand et al. 2004), so we bootstrap standard
errors for all regressions in the study. Therefore, OLS is appropriate for coefficient estimation for all five of
the study’s dependent variables. In contrast to other approaches such as the rare events logistic model, OLS is
also convenient in terms of time required to bootstrap, and in ease of coefficient interpretation.
5. Results
5.1 Basic Treatment Effects
Table 3 shows the regression results of the basic treatment effect for the four dependent variables
that represent performance in the study. The models include fixed effects for employees, months, day of the
week, and day of the month, and show substantial improvement on two of the four performance metrics.
The award caused a 1.6 percentage point reduction in the level of tardiness at Plant 1, meaning tardies were
reduced by nearly 40% from the baseline of 4%. In addition, the average worker clocked in nearly an entire
minute earlier, which is also an effect size of nearly 50%. We do not, however observe a statistically
significant treatment effect on absences or production efficiency, suggesting that the impact of the award
program was limited to tardiness.
DiD models are known to result in false positives due to serial correlation issues (Bertrand et al.
2004). Random assignment of treatment groups and dates can lead to the estimation of significant effects
some 45% of the time. While bootstrapping standard errors helps alleviate this problem, it is important to use
placebo testing to demonstrate that the identified treatment effects were not spuriously generated. We ran
two types of placebo tests: one in which we randomly assigned employees to the treatment group but kept the
actual treatment date, and one in which we randomly assigned both the treatment employees and the
treatment date. We used 50 placebos for each type. We would expect the placebo tests to result in statistically
significant treatment effects at the 5% level only 5% of the time, and we would also expect the average
treatment effect to be close to zero.
The average results of the placebo tests are shown in Table 4. For both types of placebos, the mean
coefficient is both close to zero and significantly smaller than the corresponding coefficient from Table 3.
Also, across the placebos the results are significant at close to the expected rate. We present the point
estimate and 95% confidence intervals for each placebo regression of minutes late in Figure 6, which show that
our point estimate has the smallest standard errors of any of the individual placebos.16 Overall, the placebo
test results suggest that the treatment effects shown in Table 3 were actually a result of the treatment.
5.2 Evidence on Employee Gaming
To examine potential gaming behavior by employees, we first examine whether employees were more
likely to have single absences during the attendance award program. While we observed no effect on overall
absences, column 1 of Table 5 shows that employees were over half a percentage point more likely to have a
single absence (as opposed to one covering multiple days) after the introduction of the award, which
16 Placebo regressions for our other models produced similar results.
represents an over 50% increase in the likelihood of having a single absence. This result, in combination with
the results on tardies and minutes late, suggest an interesting story: workers show up earlier and are less likely
to be tardy, but are also much more likely to have a single absence. The award may cause an increase in single
absences by motivating employees who are running late to call in sick and stay eligible for the award.
Alternatively, workers who would have been late and therefore become disqualified for the award may simply
stay at home since they lost their chance for the award.
We also examine employee behavior conditional on their eligibility for the monthly award on a given
day. To do this, we introduce two dummy variables for each employee-day, indicating whether the employee
was still eligible for the award (“pre-fail”) or had a tardy or absence which disqualified her that month
(“post-fail”). This essentially breaks the treatment dummy into two groups. The results of this analysis are
shown in columns 2-6 of Table 5. Perhaps unsurprisingly, all of the effect of the award occurs due to the
behavior of employees who are still eligible for it. Although Wald tests cannot definitely show that the pre-
and post- coefficients are statistically different, the larger magnitude and statistical significance of the pre-fail
coefficients is consistent with employees gaming the award system. These results, combined with those for
single absences, suggest that employees strategically respond to the award program, changing their behavior
only when such actions improve their likelihood of winning the award. The award therefore did not appear to
habituate punctuality.
5.3 Heterogeneous Treatment Effects
We next investigate how different types of workers respond to the introduction of the award. The
award was focused on improving the timeliness and attendance of employees who sometimes clocked in late
or had unexcused absences; however, the award could have spillover effects on other employee types. We
therefore focus on differential response to the award among two employee dimensions: pre-treatment
attendance behavior, and pre-treatment efficiency.17 There is only a small correlation between efficiency and
punctuality; the correlation coefficient between efficiency and minutes late is -0.03, suggesting more efficient
employees come to work slightly earlier.
There are two common statistical methods by which to compare heterogeneous treatment effects:
the use of interaction effects and the use of sub-sample analysis. If implemented properly, the two methods
are in fact equivalent (Fink et al. 2012). However, both methods are more often implemented improperly,
resulting in false positives (Fink et al. 2012). Because the treatment effect in DiD models is already an
interaction term, using another interaction term to model heterogeneous response would be effectively
introducing a triple interaction into the model, which makes the raw regression output difficult to correctly
interpret (but unfortunately easy to incorrectly interpret). We will therefore use sub-sample analysis in the
17 We also investigated the impact of employee gender, age, and tenure level, and found few differences across employee groups.
paper.
5.3.1 Treatment Effects on Tardiness by Level of Pre-Award Tardiness: We first examine the
behavior of employees who were never tardy in the 12 months before the award was introduced (“no tardy”
sample), those who were tardy less than 1.5% of the time (“low tardy”), and those who were tardy greater
than 1.5% of the time (“high tardy”).18 These results are shown in Tables 6a and 6b. The high tardy group is
the only group statistically less likely to show up tardy due to the award, but they do not change with regard
to how many minutes they show up early. In contrast, the “low tardy” group does not decrease its rate of
tardiness, but comes to work nearly a minute and a half earlier due to the award. Both of these groups are
more likely to take single absences. Perhaps most interestingly, the only effect on the no tardy group is a large
increase in the likelihood of being absent, meaning the award appears to be causing this group to take more
planned absences. Overall, this analysis again suggests a very strategic response to the award by each of these
groups. Highly tardy employees appear adept at reducing tardy rates while not consistently coming earlier to
work; low tardy employees appear to push to come a bit earlier, possibly because they are even more averse
to the risk of being tardy; and no tardy employees appear to be spurred to plan ahead with regard to absences.
Tables 7a and 7b examine workers who are almost always early for their shifts, workers who tend to
“punch in” just as their shift starts, and workers who are on average at least one minute late to clock in.19
Here the most striking result is that workers who are habitually early are three percentage points more likely
to be tardy after the award introduction. The coefficient on the minutes late variable also suggests they stop
arriving to work as early as they did, although this coefficient is not close to significant. Workers who were
punching in early and in effect “working for free” for a few minutes appear to have reacted to the award in a
dysfunctional way, perhaps because they resented the introduction of a formal reward for something they had
been doing on a daily basis already.
5.3.2.: Treatment Effects on Production Efficiency: We finally examine heterogeneous treatment
effects on efficiency. We look at two sub-samples: the “No/Low/High Tardy” sub-samples examined earlier,
and also sub-samples composed of low efficiency employees (<110), average efficiency employees (110-130),
and high efficiency employees (130+). The results of this analysis are shown in Table 8. In both cases, the
“best” employees react to the award with significantly lower productivity; their average daily productivity
drops by 8-9 points, or around 6%. Since high efficiency employees regularly surpassed the 140 threshold for
the final pay bump, the benefits of any excess efficiency was captured by the company, not the worker. The
award seems to have “crowded out” the desire of high efficiency employees to continue to work hard. That
18 This classification cuts the “has tardies” employee group in half. 19 This classification effectively places about 10% of the sample’s employees in the early group, 15% in the late group, and 75% in the on-time group.

is, employees who previously produced extra output that only benefitted the company, not themselves,,
reacted to the award by reducing their productivity.
While we cannot observe the mechanism driving this demotivation, this result is consistent with the
crowding out arguments presented earlier. It could be either due to perceived unfairness or decreased image
motivation, although we are unable to separate these potential mechanisms in our data. While we only have
three months of productivity data, it appears that in general the attendance awards program generated
negative spillovers that decreased productivity. Most seriously, the spillovers affected those employees that
were the best attenders, based on pre-treatment tardiness.
This interpretation is further supported by looking at the effect of disqualification on the three
efficiency sub-samples, shown in Table 9. There is no treatment effect on low efficiency workers before they
are disqualified for an award; however, after disqualification the efficiency of these workers decreases by over
12 points, or nearly 15%. However, for high efficiency workers, productivity decreases by approximately the
same amount both before and after disqualification. These results are consistent with the hypothesis that low
efficiency workers react in strategic or “rational” ways to the program, while high efficiency workers seem to
believe the program itself is unfair.
6. Discussion
This study demonstrates that an award program that appears to be effective may also induce
unintended consequences that severely reduce the net value of the program. At face value, the award used in
the study was effective in that it reduced the average rate of tardiness among employees. However, the award
also led to a host of potential spillover effects that the plant manager readily admits were not considered
when designing the program. The largest spillover in this study was the significant productivity decrease by
the plant’s most productive and punctual employees, which appears to be directly caused by the award. This
finding is remarkable because it suggests that awards for one type of behavior have the potential to “crowd
out” positive behavior in a completely different realm. It also suggests that Neckermann et al’s (2012)
observation of spillovers from awards on one dimension to behavior on another can be negative as well as
positive. Our results complement their paper by suggesting that even simple awards programs can have much
broader and complex implications for employee behavior.
Overall our results suggest a negative and significant impact from the award program on net plant
productivity. To measure the overall impact to the firm, we used our regression coefficients from Tables 6a,
6b, and 8 to roughly calculate productivity and financial implications.20 These calculations, which assume
20 This is a high-level calculation computed using the weighted impact of the awards program on the three attendance groups specified earlier (notardy, lowtardy and hightardy). We first calculated the impact of the program on efficiency, minutes late to work, and single absences for a single “model” employee in each group, then multiplied this effect by the number of workers in each group before summing the totals.

workers work eight hours a day and 22 days a month, find the awards program reduced Plant 1’s productivity
by 1.4%, or nearly half an additional full-time worker. The increased punctuality by low tardy workers only
increased overall plant productivity by 0.1%. However, the increase in single absences reduced productivity
by 0.5%. Therefore, even in its direct impact on productivity through attendance, the award decreased
productivity. However, the largest impact of productivity came from reduced productivity from workers with
the best pre-award attendance, which reduced the plant’s overall productivity by 1%.
A conservative estimate of the financial impact, which includes wage costs plus 37% additional
benefits for additional labor hours, suggests at least a $1,458 monthly cost from the program.21 We note that
this estimate is extremely conservative, given that it ignores training costs, overhead, and other variable costs
associated with hiring additional workers. These results highlight the impact such a program can have on the
overall performance of the firm and suggest caution when designing and implementing such programs.
Our results stand in contrast to the emerging conventional wisdom that awards and other forms of
on-the-job recognition provide a “free” way to motivate employees. The award used in our setting appeared
to act much less like a subtle “nudge” than like a traditional incentive program to which employees
strategically responded. Behavioral economists and social psychologists have long been interested in small
interventions that can change behavior, often in ways unperceived by the actor, but our results suggest that a
more nuanced view is needed that considers unintended consequences and the possibility of strategic
response. An award in an employment setting is, after all, a formal program designed by a manager, and not
simply a small difference in framing. Scholars have long known that any formal program carries both benefits
and costs, and this study serves as a reminder of this important lesson.
Like many studies of this type, our study has a number of limitations. First, the assignment of
workers to treatment and control groups was not random, and there existed differences between the two
groups, such as the non-union status of the four control plants. This fixed difference, and any other
pre-existing differences between the groups, is theoretically “differenced out” by the DiD methodology.
However, the DiD methodology does assume common time trends across groups. We carried out interviews
with managers at treatment and control plants, and apart from a health screening offered to employees of the
control plants in April, 2011, managers reported no changes in policies or management approaches that
changed around the time of the introduction of the award. Alternative models that estimate monthly
treatment effects, represented in Figure 7 (for minutes late), show the treatment effect to be largest and
statistically significant in March, 2011, the month the award program was implemented (and a month before
the health screening intervention). This suggests that the health intervention, or any other unobserved change
that wasn’t exactly correlated with treatment, was unlikely to explain our results. However, as with any DiD
study, we cannot definitively rule out the possibility of unobserved shocks correlated with treatment that
21 This number is calculated based on average annual costs from wages ($25,057), retirement matching ($1,101), health insurance ($8,269), payroll taxes ($1,416), and the awards themselves ($675).

affected only one group. Similarly, although one concern is that our split sample results on productivity
reflect mean reversion, the sharp drop in productivity exactly in the month the award was introduced,
combined with the lack of improvement by the low productivity group, make this explanation unlikely.
The mechanism leading to the strategic gaming of the award system is clear. However, we cannot
definitively prove the mechanism by which the attendance award negatively affected productivity of some
workers. The explanation that the award “crowded out” the intrinsic motivation of workers is theoretically
appealing, especially since these workers were working hard far past the point where it increased their
compensation. However, this interpretation is only speculative, since we do not know the factor(s) that
caused highly productive workers to continue to work hard even when it did not increase their compensation.
There are a number of explanations for this uncompensated productivity outside of intrinsic motivation. For
example, peer or manager pressure may have led to increased effort even when that effort was
uncompensated, and the award may have caused workers to be less responsive to these mechanisms. Our
results do show, however, that the motivational mechanism responsible for the uncompensated productivity
was reduced by the award for a subset of employees.
As is common in research of this type, our study follows a single company’s experience. While
tardiness and absenteeism are large problems for many businesses, it is unclear whether the effect of the
award found in this study would translate across organizations and industries. This problem is of particular
concern given that Plant 1 was unionized, which surely affected employee response. It is plausible that the
effect sizes found in this setting are lower than they would be in non-union settings, since non-union
employees are arguably more concerned about the increased job security an award might bring. On the other
hand, it is also plausible that the relative lack of concern for job security in our unionized environment may
make the employees of Plant 1 more concerned about the status benefits accruing from the award.
Finally, our results consider an award program that randomly awards a single employee, chosen from
all who qualify, rather than to a fixed number or percentage of employees. Many awards are given to only a
few employees, such as “employee of the month” or “Circle of Excellence,” which recognizes the top 10% of
employees and is common in the sales function (Larkin, 2010). As with monetary incentives, there are a large
number of ways in which award programs might vary, and the costs and benefits of these programs likely
vary across award type. We therefore suggest caution in applying the study’s results to all types of awards, but
we also believe that scholars and practitioners should take seriously the strong possibility of spillovers and
other unintended consequences in any award system.
Theoretical implications
Scholars of incentives in economics have only recently started to consider the psychological effects
of incentive programs. On the other hand, social psychologists have traditionally been focused on the
response of individual employees to different incentive programs, rather than questions of firm-level effects

or optimal incentive design (Nickerson and Zenger 2008; Larkin et al. 2012). This study provides further
evidence that scholars need to incorporate the strengths of both approaches: the holistic, cost-benefit lens of
economics, and the realistic model of human behavior from social psychology incorporating biases and
emotions.
Although the study does not directly show “crowding out” (Deci 1975; Deci and Ryan 1985), it does
suggest that employees who previously behaved in ways that did not give them any extra monetary benefit –
namely, showing up early for their shift and continuing to work hard when there was no monetary benefit to
do so – cut back on this behavior due to the introduction of the reward. The notion of “crowding out” is
usually applied to monetary rewards (e.g. Gneezy and Rustichini 2000b), with recent work suggesting that
non-monetary rewards do not reduce prosocial blood donations (Goette and Stutzer 2008; Lacetera et al.
2012). In contrast, our results suggest that “crowding out” may also apply to extrinsic but non-monetary
rewards such as corporate awards. In addition, “crowding out” is usually focused on reduction in motivation
for actions that are compensated. Our results suggest that compensating one action can lead to “crowding
out” in a completely different realm. Existing research further suggests that the long-term costs from
demotivation, particularly following program termination, may be even greater than what our time range of
data can show (Gneezy and Rustichini 2000a; Meier 2007).
Overall, the results of this study suggest that in the long-run, non-monetary but extrinsic rewards
such as corporate awards act more like monetary rewards than they do intrinsic motivators such as love for
the job or empowerment through autonomy. Much of the existing literature seems to contrast monetary
compensation with extrinsic but non-monetary rewards, drawing on the arguments from the literature on
intrinsic motivation. Our results suggest the opposite hypothesis requires investigation – that corporate
awards are closer to a monetary reward than a purely intrinsic motivator.
Our results also suggest that award programs with a low likelihood of winning may be ineffective
because employees learn relatively quickly that effort is unlikely to result in status, recognition, or rewards.
This is consistent with a growing literature on how tournaments with more competition can produce less
effort and productivity (Che and Gayle 2003; Fullerton and McAfee 1999; Boudreau et al. 2011) as well as
sabotage (Carpenter et al. 2010). Our results are also consistent with recent models on the importance of
rewarding non-winners as well as winners (Minor 2012). Demanding perfection from employees may remove
all motivation for employees whose probability of winning can discretely drop to zero with a single mistake.
References
Adams, J.S. 1963. Toward an understanding of inequity. Journal of Abnormal and Social Psychology 67(1) 422-436.
Akerlof, G.A. 1980. A theory of social custom, of which unemployment may be on consequence. Quarterly Journal of Economics 94(4) 749-775.
Akerlof, G.A., R.E. Kranton. 2005. Identity and the economics of organizations. The Journal of Economic Perspectives 19(1) 9–32.
Akerlof, G.A., J.L. Yellen. 1988. Fairness and unemployment. The American Economic Review 78(2) 44-49.
Akerlof, G.A., J.L Yellen. 1990. The fair wage-effort hypothesis and unemployment. The Quarterly Journal of Economics 105(2) 255-283.
Ambrose, M., M.A. Seabright, M. Schminke. 2002. Sabotage in the workplace: The role of organizational injustice. Organizational Behavior and Human Decision Processes 89(1) 947–965.
Andreoni, J., B. Bernheim. 2009. Social image and the 50-50 norm: A theoretical and experimental analaysis of audience effects. Econometrica 77(5) 1607-1636.
Andreoni, J., R. Petrie. 2004. Public goods experiments without confidentiality: A glimpse into fund-raising. Journal of Public Economics 88(7-8) 1605-1623.
Ariely, D., A. Bracha, S. Meier. 2009. Doing good or doing well? Image motivation and monetary incentives in behaving prosocially. American Economic Review 99(1) 544-555.
Bandiera, O., I. Barankay, I. Rasul. 2010. Social incentives in the workplace. The Review of Economic Studies 77(2) 417-458.
Barankay, I. 2012. Rank incentives: Evidence from a randomized workplace experiment. Working paper, Wharton School, Pennsylvania.
Benabou R., J. Tirole. 2006. Incentives and prosocial behavior. American Economic Review 96(5) 1652-1678.
Bertrand M., E. Duflo, S. Mullainathan. 2004. How much should we trust differences-in-differences estimates? The Quarterly Journal of Economics 119(1) 249-275.
Besley, T., M. Ghatak. 2008. Status incentives. The American Economic Review 98(2) 206–211.
Boudreau, K.J., N. Lacetera, K.R. Lakhani. 2011. Incentives and problem uncertainty in innovation contests: An empirical analysis. Management Science 57(5) 843–863.
Blanes i Vidal, J., M. Nossol. 2011. Tournaments without prizes: Evidence from personnel records. Management Science 57(10) 1721–1736.
Boyle, D. 1996. Divining the secrets of a successful employee recognition system. Security Management 40(7) 21–24.
Camden, M.C., V.A. Price, T.D. Ludwig. 2011. Reducing absenteeism and rescheduling among grocery store employees with point-contingent rewards. Journal of Organizational Behavior Management 31(2) 140-149.
Cameron, J., W.D. Pierce. 2002. Rewards and Intrinsic Motivation: Resolving the Controversy. Bergin & Garvey.
Card, D., A. Mas, E. Moretti, E. Saez. 2012. Inequality at work: The effect of peer salaries on job satisfaction. American Economics Review 102(6) 2981-3003.
Carpenter, J., P. Matthews, J. Schirm. 2010. Tournaments and office politics: Evidence from a real effort experiment. American Economic Review 100(1) 504-517.
Che, Y-K., I. Gale. 2003. Optimal design of research contests. The American Economic Review 93(3) 646.

Cooper, C.L., B. Dyck, N. Frohlich. 1992. Improving the effectiveness of gainsharing: The role of fairness and participation. Administrative Science Quarterly 37(3) 471-490.
Dana, J., D. Cain, R. Dawes. 2006. What you don’t know won’t hurt you: Costly (but quiet) exit in dictator games. Organizational Behavior and Human Decision Processes 100(2) 193-201.
Davidson, L. 1999. The power of personal recognition. Workforce 78(7) 44–49.
De Boer, E.M., A.B. Bakker. Unfairness at work as a predictor of absenteeism. Journal of Organizational Behavior 23(2) 181-197.
Deci, E.L. 1975. Intrinsic Motivation. Plenum Press, New York, NY.
Deci, E.L., R.M. Ryan. 1985. Intrinsic Motivation and Self-Determination in Human Behavior. Plenum Press, New York, NY.
DeLonzor, D. 2005. Running late. HRMagazine 50(11) 109–112.
Edelman, B.G., I. Larkin. 2013. Social comparisons and deception across workplace hierarchies: Field and experimental evidence. Unpublished working paper.
Ederer, F., E. Fehr. 2009. Deception and incentives: How dishonesty undermines effort provision. Unpublished working paper. http://www.anderson.ucla.edu/faculty/florian.ederer/dishonesty.pdf
Ellingsen, T., M. Johannesson. 2008. Pride and prejudice: The human side of incentive theory. American Economic Review 98(3) 990-1008.
Fehr E., L. Goette, C. Zehnder. 2009. A behavioral account of the labor market: The role of fairness concerns. Annual Review of Economics 1(1) 355-384.
Festinger, L. 1954. A Theory of Social Comparison Processes. Human Relations 7(1) 117-140.
Fink, G., M. McConnell, S. Vollmer. 2012. Testing for heterogenous treatment effects in experimental data: False discovery risks and correction procedures. Available at: http://www3.wiwi.uni-hannover.de/Forschung/Diskussionspapiere/dp-477.pdf [Accessed February 7,2013].
Frey, B., F. Olberholzer-Gee. 1997. The cost of price incentives: An empirical analysis of motivation crowding-out. American Economic Review 87(4) 746-755.
Frey, B., S. Meier. 2004. Social comparison and pro-social behavior: Testing conditional cooperation in a field experiment. American Economic Review 94(1) 1717-22.
Fullerton, R.L., R.P. McAfee. 1999. Auctioning entry into tournaments. The Journal of Political Economy 107(3) 573–605.
Garcia, S.M., A. Tor, R. Gonzalez. 2006. Ranks and rivals: A theory of competition. Personality and Social Psychology Bulletin 32(1) 970-982.
Garr, S. 2012. The State of Employee Recognition in 2012. Research Report, Bersin and Associates, Oakland, CA.
Gertler, P.J., S. Martinez, P. Permand, L.B. Rawlings, C.M.J. Vermeersch. 2011. Impact Evaluation in Practice. The World Bank, Washington DC.
Gino, F., L. Pierce. 2009. Dishonesty in the name of equity. Psychological Science 20(9) 1153–1160.
Gneezy, U., A. Rustichini. 2000a. A fine is a price. Journal of Legal Studies 29(1) 1-18.
Gneezy, U., A. Rustichini. 2000b. Pay enough or don’t pay at all. Quarterly Journal of Economics 115(3) 791-810.
Gneezy, U., S. Meier, P. Rey-Biel. 2011. When and why incentives (don’t) work to modify behavior. Journal of Economic Perspectives 25(4) 191-210.
Goette, L., A. Stutzer. 2008. Blood donations and incentives: Evidence from a field experiment. IZA
Working paper No. 3580. Available at: http://ssrn.com.libproxy.wustl.edu/abstract=1158977 or http://dx.doi.org.libproxy.wustl.edu/10.1111/j.0042-7092.2007.00700.x [accessed February 11, 2013].
Greenberg, J. 1988. Equity and workplace status: A field experiment. Journal of Applied Psychology 73(4) 606-613.
Hars, A., S. Ou. 2001. Working for free? Motivations of participating in open source projects. Proceedings of the 34th Annual Hawaii International Conference on System Sciences. pp. 9.
Huberman, B.A., C.H. Loch, A. ÖNçüler. 2004. Status as a valued resource. Social Psychology Quarterly 67(1) 103–114.
Ichino, A., G. Maggi. 2000. Work environment and individual background: Explaining regional shirking differentials in a large Italian firm. The Quarterly Journal of Economics 115(3) 1057–1090.
Ichino, A., R.T. Riphahn. 2005. The effect of employment protection on worker effort: Absenteeism during and after probation. Journal of the European Economic Association 3(1) 120–143.
Kerr, S. 1975. On the folly of rewarding A, while hoping for B. The Academy of Management Journal 18(4) 769-783.
King, G., L. Zeng. 2001. Logistic regression in rare events data. Political Analysis 9(1) 137-163.
Knight, D., C. Durham, E. Locke. 2001. The relationship of team goals, incentives and efficacy to strategic risk, tactical implementation and performance. Academy of Management Journal 44(2) 326-338.
Kosfeld, M., S. Neckermann. 2011. Getting more work for nothing? Symbolic awards and worker performance. American Economic Journal: Microeconomics 3(3) 86–99.
Kuhnen, C.M., A. Tymula. 2010. Feedback, self-esteem, and performance in organizations. Management Science 58(1) 94-113.
Lacetera, N., M. Macis. 2010. Social concerns and prosocial behavior: Field evidence from a nonlinear incentive scheme. Journal of Economic Behavior & Organization 76(2) 225-237.
Lacetera, N., M. Macis, R. Slonim. 2012. Will there be blood? Incentives and displacement effects in pro-social behavior. American Economic Journal: Economic Policy 4(1) 186-223.
Larkin, I. 2010. Paying $30,000 for a gold star: An empirical investigation into the value of peer recognition to software salespeople. Working paper, Harvard Business School, Cambridge.
Larkin, I. 2013. The cost of high powered incentives: Employee gaming in enterprise software sales.
Larkin, I, L. Pierce, F. Gino. 2012. The psychological costs of pay-for-performance: Implications for the strategic compensation of employees. Strategic Management Journal 33(10) 1194–1214.
Malmendier, U., G.A. Tate. 2009. Superstar CEOs. Quarterly Journal of Economics 124(4): 1593-1638.
Markham, S.E., K.D. Scott, G.H. McKee. 2002. Recognizing good attendance: A longitudinal, quasi-experimental field study. Personnel Psychology 55(3) 639-660.
Mas, A., E. Moretti. 2009. Peers at work. The American Economic Review 99(1) 112–145.
Meier, S. 2007. Do subsidies increase charitable giving in the long run? Matching donations in a field experiment. Journal of the European Economic Association 5(6): 1203-1222.
Minor, D.B. 2012. Increasing revenue through rewarding the best less (or not at all). Available at: http://www.kellogg.northwestern.edu/faculty/minor/Papers/Increasing%20Effort%20(with%20Figures).pdf [Accessed September 21, 2012].
Moldovanu, B., A. Sela, X. Shi. 2007. Contests for status. Journal of Political Economy 115(2) 338-363.
Navarro, C., C. Bass. 2006. The cost of employee absenteeism. Compensation and Benefits Review 38(6) 26–30.
Neckermann, S., R. Cueni, B. Frey. 2012. Awards at Work. ZEW Discussion Paper No. 12-004.
Nickerson, J.A., T.R. Zenger. 2008. Envy, comparison costs, and the economic theory of the firm. Strategic Management Journal 29(13) 1429-1449.
O'Reilly, C.A., J. Chatman. 1986. Organizational commitment and psychological attachment: The effects of compliance, identification, and internalization on prosocial behavior. Journal of Applied Psychology 71(3) 492-499
Oyer, P. 1998. Fiscal year ends and nonlinear incentive contracts: The effect on business seasonality. Quarterly Journal of Economics 113(1) 149-185.
Pauly, M.V., S. Nicholson, J. Xu, D. Polsky, P.M. Danzon, J.F. Murray, M.L. Berger. 2002. Health Economics 11(3) 221-231.
Pedalino, E., V.U. Gamboa. 1974. Behavior-modification and absenteeism - Intervention in one industrial setting. Journal of Applied Psychology 59(6) 694-698.
Scott, D., S. Markham. 1982. Absenteeism control methods: A survey of practices and results. The Personnel Administrator 27(6) 73-84.
Skarlicki, D.P., R. Folger. 1997. Retaliation in the workplace: The roles of distributive, procedural, and interactional justice. Journal of Applied Psychology 82(3) 434-443
Stajkovic, A.D., F. Luthans. 1997. A meta-analysis of the effects of organizational behavior modification on task performance, 1975-95. Academy of Management Journal 40(5) 1122–1149.
Stewart, J. 2009. Tobit or not Tobit? IZA Discussion Paper No. 4588. Available at: http://papers.ssrn.com/sol3/papers.cfm?abstract_id=1515135 [Accessed October 30, 2012].
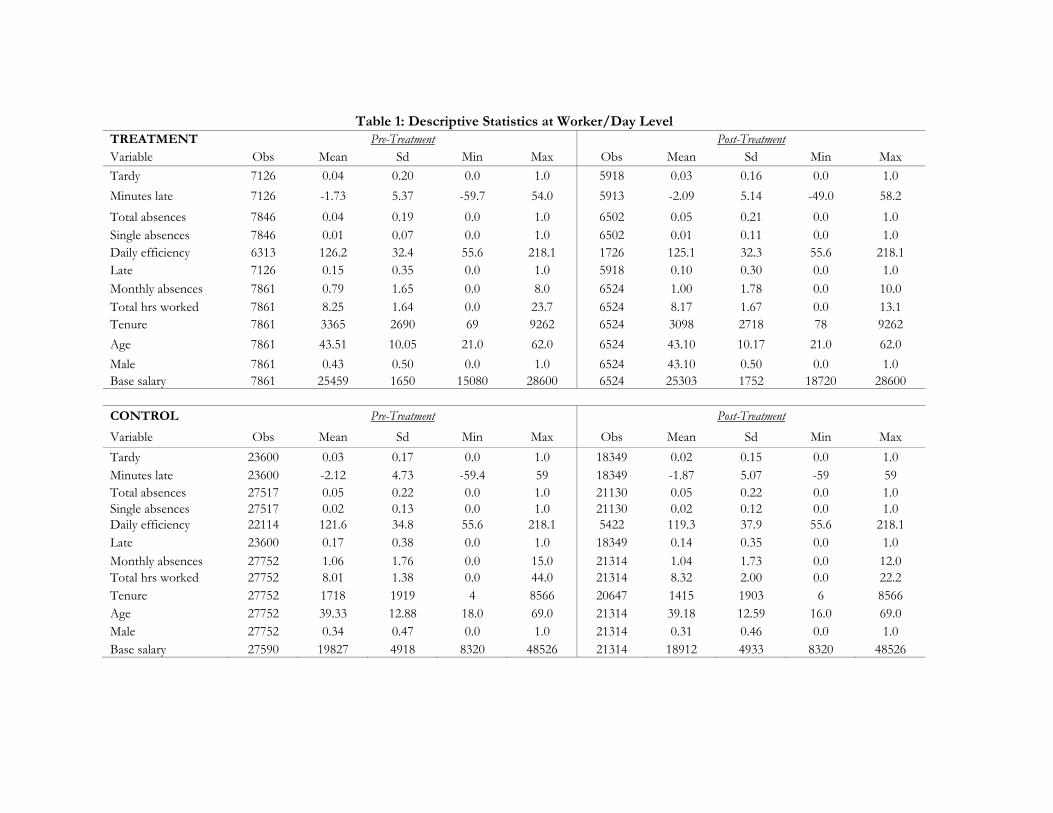
Table 1: Descriptive Statistics at Worker/Day Level
TREATMENT Pre-Treatment Post-Treatment Variable Obs Mean Sd Min Max Obs Mean Sd Min Max Tardy 7126 0.04 0.20 0.0 1.0 5918 0.03 0.16 0.0 1.0 Minutes late 7126 -1.73 5.37 -59.7 54.0 5913 -2.09 5.14 -49.0 58.2
Total absences 7846 0.04 0.19 0.0 1.0 6502 0.05 0.21 0.0 1.0 Single absences 7846 0.01 0.07 0.0 1.0 6502 0.01 0.11 0.0 1.0Daily efficiency 6313 126.2 32.4 55.6 218.1 1726 125.1 32.3 55.6 218.1 Late 7126 0.15 0.35 0.0 1.0 5918 0.10 0.30 0.0 1.0Monthly absences 7861 0.79 1.65 0.0 8.0 6524 1.00 1.78 0.0 10.0 Total hrs worked 7861 8.25 1.64 0.0 23.7 6524 8.17 1.67 0.0 13.1Tenure 7861 3365 2690 69 9262 6524 3098 2718 78 9262 Age 7861 43.51 10.05 21.0 62.0 6524 43.10 10.17 21.0 62.0 Male 7861 0.43 0.50 0.0 1.0 6524 43.10 0.50 0.0 1.0 Base salary 7861 25459 1650 15080 28600 6524 25303 1752 18720 28600 CONTROL Pre-Treatment Post-Treatment
Variable Obs Mean Sd Min Max Obs Mean Sd Min Max Tardy 23600 0.03 0.17 0.0 1.0 18349 0.02 0.15 0.0 1.0 Minutes late 23600 -2.12 4.73 -59.4 59 18349 -1.87 5.07 -59 59 Total absences 27517 0.05 0.22 0.0 1.0 21130 0.05 0.22 0.0 1.0 Single absences 27517 0.02 0.13 0.0 1.0 21130 0.02 0.12 0.0 1.0Daily efficiency 22114 121.6 34.8 55.6 218.1 5422 119.3 37.9 55.6 218.1Late 23600 0.17 0.38 0.0 1.0 18349 0.14 0.35 0.0 1.0 Monthly absences 27752 1.06 1.76 0.0 15.0 21314 1.04 1.73 0.0 12.0 Total hrs worked 27752 8.01 1.38 0.0 44.0 21314 8.32 2.00 0.0 22.2Tenure 27752 1718 1919 4 8566 20647 1415 1903 6 8566 Age 27752 39.33 12.88 18.0 69.0 21314 39.18 12.59 16.0 69.0Male 27752 0.34 0.47 0.0 1.0 21314 0.31 0.46 0.0 1.0 Base salary 27590 19827 4918 8320 48526 21314 18912 4933 8320 48526

Table 2: Descriptive Statistics at the Worker/Month Level
TREATMENT Pre-Treatment Post-Treatment Variable Obs Mean Sd Min Max Obs Mean Sd Min Max
# tardies per month 33 1.22 1.51 0.0 5.3 34 0.77 1.04 0.0 3.8 # minutes late per month 33 -1.66 1.99 -8.8 1.0 34 -2.11 2.07 -7.1 1.2 # of times late per month 33 3.71 3.77 0.0 13.7 34 2.65 3.42 0.0 13.1
# of absences per month 33 0.73 0.53 0.0 1.8 34 1.00 0.54 0.1 1.9 Average efficiency 32 122.8 22.4 89.2 167.9 33 123.1 25.3 59.5 174.3 CONTROL Pre-Treatment Post-Treatment Variable Obs Mean Sd Min Max Obs Mean Sd Min Max
# tardies per month 191 0.46 0.73 0.0 5.5 164 0.43 0.62 0.0 4.0 # minutes late per month 191 -1.84 2.06 -12.4 5.4 164 -1.68 2.14 -10.9 8.3 # of times late per month 191 2.71 3.32 0.0 17.2 164 2.34 2.61 0.0 15.3
# of absences per month 191 0.90 0.81 0.0 5.0 164 0.90 0.82 0.0 5.7 Average efficiency 178 112.0 30.6 55.6 217.5 134 113.7 32.4 57.6 218.1
Table 3: Basic Treatment Effect (1) (2) (3) (4)
Dependent Variable: Tardy
Minutes Late Absent Efficiency
Treatment -0.016*** -0.806** 0.007 -2.731 (0.005) (0.322) (0.006) (2.535)
Constant 0.018*** -2.075*** 0.048*** 119.528*** (0.006) (0.182) (0.009) (1.414)
Time Controls Y Y Y Y Worker FE Y Y Y Y R2 0.004 0.005 0.004 0.007 # of employees 273 273 273 273
Observations 54,993 54,988 62,995 35,575
Note: Bootstrapped standard errors in parentheses. Significance levels: * p<0.10, ** p<0.05, *** p<0.01. The variable “Treatment” is the interaction of the treatment group and post-treatment dummies.

Table 4: Placebo Tests
Variable Random Treatment Group (50)Random Treatment Group and
Date (50)
Mean
Coefficient p < 0.1 p <0.05 Mean
Coefficient p < 0.1 p <0.05Tardy -0.0006 6% 4% -0.0003 14% 6% Minutes late -0.1182 2% 2% -0.0969 12% 4% Single absence 0.0015 6% 4% 0.0025 12% 8% Note: Standard errors in parentheses are clustered at the employee level. Significance * p<0.10, ** p<0.05, *** p<0.01.
Table 5: Evidence of Gaming (1) (2) (3) (4) (5) (6)
Dependent Variable: Single
Absence Tardy Minutes
Late Absence Single
Absence Efficiency Treatment 0.006***
(0.002) Pre-fail treatment -0.019*** -0.900*** 0.007 0.006*** -3.243
(0.006) (0.336) (0.007) (0.002) (2.556) Post-fail treatment -0.004 -0.428 0.005 0.006 -0.17
(0.012) (0.373) (0.014) (0.004) (3.501) Constant 0.022*** 0.019*** -2.063*** 0.048*** 0.022*** 119.557***
(0.004) (0.005) (0.212) (0.009) (0.004) (2.136) Time controls Y Y Y Y Y Y Worker FE Y Y Y Y Y Y R2 0.003 0.004 0.005 0.004 0.003 0.007 # of employees 273 273 273 277 277 248 Observations 62,995 54,993 54,988 62,995 62,995 35,575 Note: Bootstrapped standard errors in parentheses based on 400 repetitions. Significance * p<0.10, ** p<0.05, *** p<0.01. The variable “Treatment” is the interaction of the treatment group and post-treatment dummies.

Table 6a: Treatment Effect by Pre-Award Level of Tardiness (1) (2) (3) (4) (5) (6)
Dependent Variable: Tardy Tardy Tardy
Minutes Late
Minutes Late
Minutes Late
Sample: No Tardy Low TardyHigh Tardy No Tardy Low Tardy
High Tardy
Treatment 0.001 -0.006 -0.020* -1.482 -1.364*** 0.342 (0.004) (0.004) (0.010) (1.325) (0.397) (0.442)
Constant -0.002 0.011** 0.042*** -3.607*** -2.243*** -1.203*** (0.003) (0.005) (0.014) (0.361) (0.249) (0.311)
Time controls Y Y Y Y Y Y Worker FE Y Y Y Y Y Y R2 0.009 0.005 0.009 0.048 0.011 0.011 # of employees 72 74 75 72 74 75 Observations 9,401 22,832 18,736 9,401 22,832 18,731
Note: Standard errors presented in parentheses are bootstrapped with 400 repetitions. Significance levels: * p<0.10, ** p<0.05, *** p<0.01.
Table 6b: Treatment Effect by Pre-Award Level of Tardiness (1) (2) (3) (4) (5) (6)
Dependent Variable: Absence Absence Absence
Single Absence
Single Absence
Single Absence
Sample: No Tardy Low TardyHigh Tardy No Tardy Low Tardy
High Tardy
Treatment 0.030*** -0.001 0.01 0.009 0.006** 0.006* (0.011) (0.010) (0.010) (0.006) (0.003) (0.003)
Constant 0.045** 0.062*** 0.041*** 0.021** 0.028*** 0.019*** (0.018) (0.015) (0.013) (0.008) (0.007) (0.007)
Time controls Y Y Y Y Y Y Worker FE Y Y Y Y Y Y
R2 0.012 0.005 0.006 0.006 0.004 0.005 # of employees 75 74 75 75 74 75
Observations 11,031 25,847 21,539 11,031 25,847 21,539
Note: Standard errors presented in parentheses are bootstrapped with 400 repetitions. Significance levels: * p<0.10, ** p<0.05, *** p<0.01.

Table 7a: Treatment Effect by Pre-Award Arrival Time (1) (2) (3) (4) (5) (6)
Dependent Variable: Tardy Tardy Tardy
Minutes Late
Minutes Late
Minutes Late
Sample: Early On Time Late Early On Time Late Treatment 0.030** -0.019*** -0.032 1.293 -0.959*** 1.458***
(0.013) (0.006) (0.025) (2.226) (0.285) (0.429) Constant 0.011 0.014*** 0.05 -3.679*** -2.268*** 0.781
(0.014) (0.005) (0.047) (0.493) (0.198) (0.561) Time controls Y Y Y Y Y Y Worker FE Y Y Y Y Y Y R-squared 0.015 0.004 0.026 0.019 0.007 0.021 # of employees 26 206 41 26 206 41 Observations 4,922 44,395 5,676 4,922 44,391 5,675
Note: Standard errors presented in parentheses are bootstrapped with 400 repetitions. Significance levels: * p<0.10, ** p<0.05, *** p<0.01.
Table 7b: Treatment Effect by Pre-Award Arrival Time (1) (2) (3) (4) (5) (6)
Dependent Variable: Absence Absence Absence
Single Absence
Single Absence
Single Absence
Sample: Early On Time Late Early On Time Late Treatment 0.043** 0.002 0.002 0.002 0.008*** -0.000
(0.019) (0.006) (0.029) (0.008) (0.002) (0.006) Constant 0.018 0.054*** 0.029 0.005 0.027*** -0.003
(0.012) (0.010) (0.036) (0.013) (0.005) (0.011) Time controls Y Y Y Y Y Y Worker FE Y Y Y Y Y Y R-squared 0.021 0.004 0.017 0.016 0.003 0.008 # of employees 26 206 45 26 206 45 Observations 5,708 50,771 6,516 5,708 50,771 6,516
Note: Standard errors presented in parentheses are bootstrapped with 400 repetitions. Significance levels: * p<0.10, ** p<0.05, *** p<0.01.

Table 8: Treatment Effects on Efficiency by Employee Type (1) (2) (3) (4) (5) (6)
Dependent Variable: Efficiency Efficiency Efficiency Efficiency Efficiency Efficiency
Sample: High
Efficiency Average
Efficiency Low
Efficiency Notardy Lowtardy Hightardy Treatment -9.313** 0.833 -5.791 -7.870** -2.951 -0.758
(4.255) (3.799) (4.435) (3.493) (4.090) (4.401) Constant 150.793*** 120.079*** 96.052*** 117.038*** 118.742*** 122.736***
(3.803) (1.635) (2.604) (2.176) (2.265) (2.212) Time controls Y Y Y Y Y Y Worker FE Y Y Y Y Y Y R2 0.027 0.008 0.031 0.034 0.013 0.014 # of employees 42 102 103 70 70 73 Observations 7,113 19,441 8,978 6,202 15,478 13,182
Note: Standard errors presented in parentheses are bootstrapped with 400 repetitions. Significance levels: * p<0.10, ** p<0.05, *** p<0.01.
Table 9: Treatment Effects on Efficiency by Employee Type and Eligibility
(1) (2) (3) Dependent Variable: Efficiency Efficiency Efficiency
Sample: High
Efficiency Average
Efficiency Low
Efficiency Pre-fail treatment -9.017** -0.142 -5.438
(4.404) (4.112) (4.579) Post-fail treatment -11.366*** 4.113 -12.629***
(3.558) (4.740) (3.979) Constant 150.774*** 120.134*** 96.039***
(3.804) (1.647) (2.604) Time controls Y Y Y Worker FE Y Y Y
R2 0.027 0.008 0.032 # of employees 42 102 103
Observations 7,113 19,441 8,978
Note: Standard errors presented in parentheses are bootstrapped with 400 repetitions. Significance levels: * p<0.10, ** p<0.05, *** p<0.01.
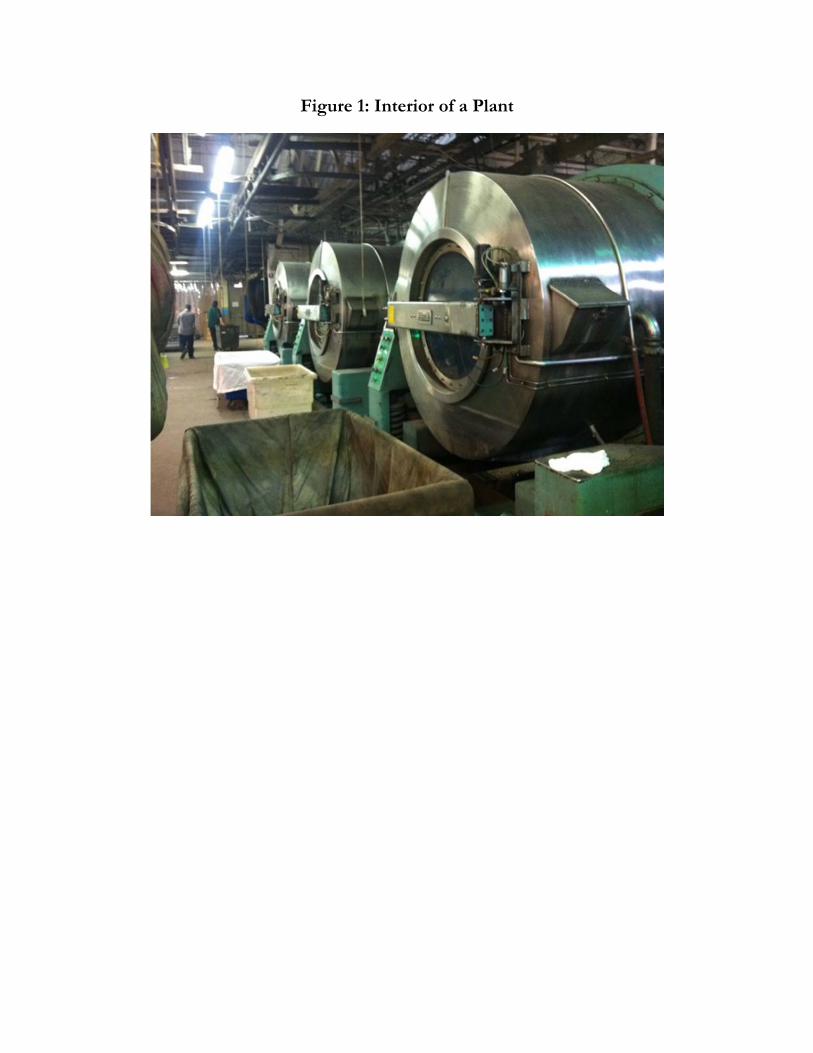
Figure 1: Interior of a Plant

Figure 2: Plant Process Flow Chart

Figure 3: Histogram of Daily Efficiency for All Workers
Figure 4: Award-Eligible Workers by Month
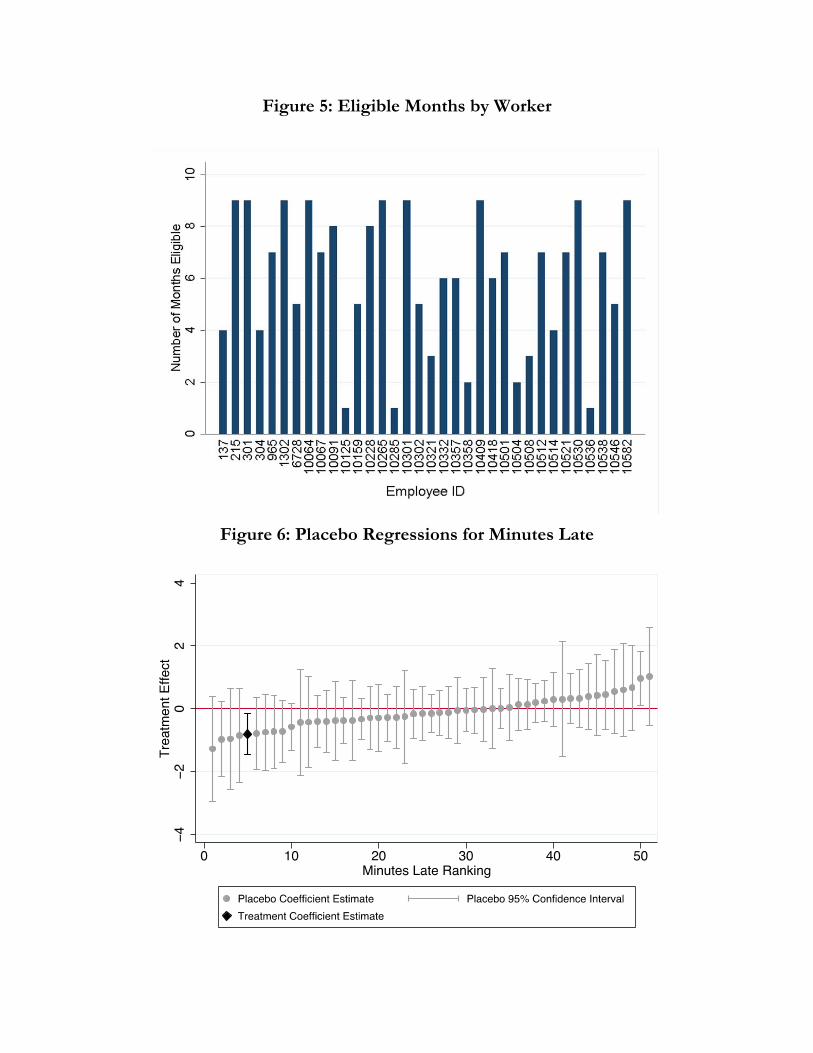
Figure 5: Eligible Months by Worker
Figure 6: Placebo Regressions for Minutes Late

Figure 7: Monthly Effect on Minutes Late