The Digital Divide Survey Trinidad and Tobago, 2013 Divide Survey2013... · implementation phases...
146
The Digital Divide Survey Trinidad and Tobago, 2013
Transcript of The Digital Divide Survey Trinidad and Tobago, 2013 Divide Survey2013... · implementation phases...
The Digital Divide Survey Trinidad and Tobago, 2013

The Digital Divide Survey Trinidad and Tobago, 2013
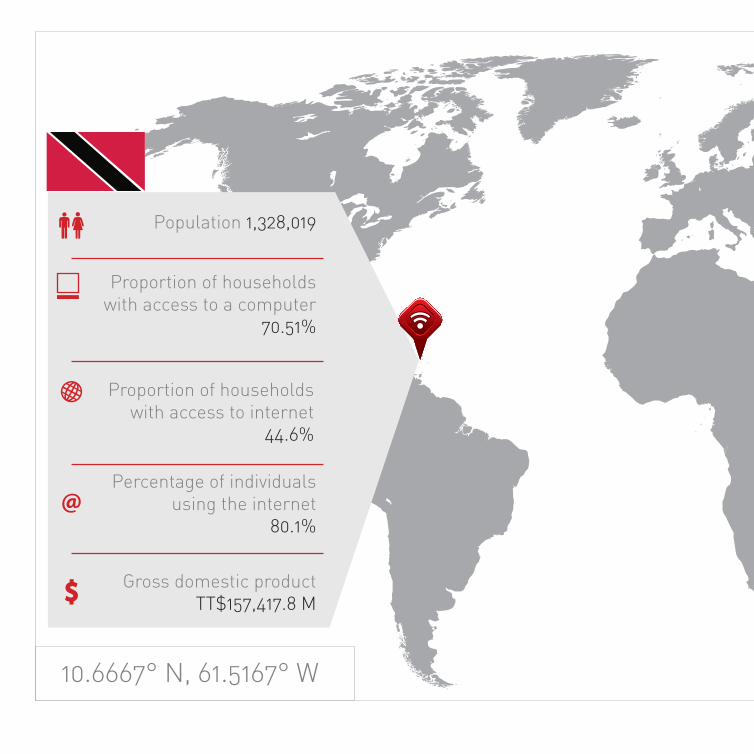
10.6667° N, 61.5167° W
Population 1,328,019
Proportion of households with access to a computer
70.51%
Proportion of households with access to internet
44.6%
Percentage of individuals using the internet
80.1%
Gross domestic productTT$157,417.8 M
The Digital Divide Survey is related to the economic development of a country through technological means, and looks at persons with access to technology, the utilization of such modes of technology, and the ease of access to such.
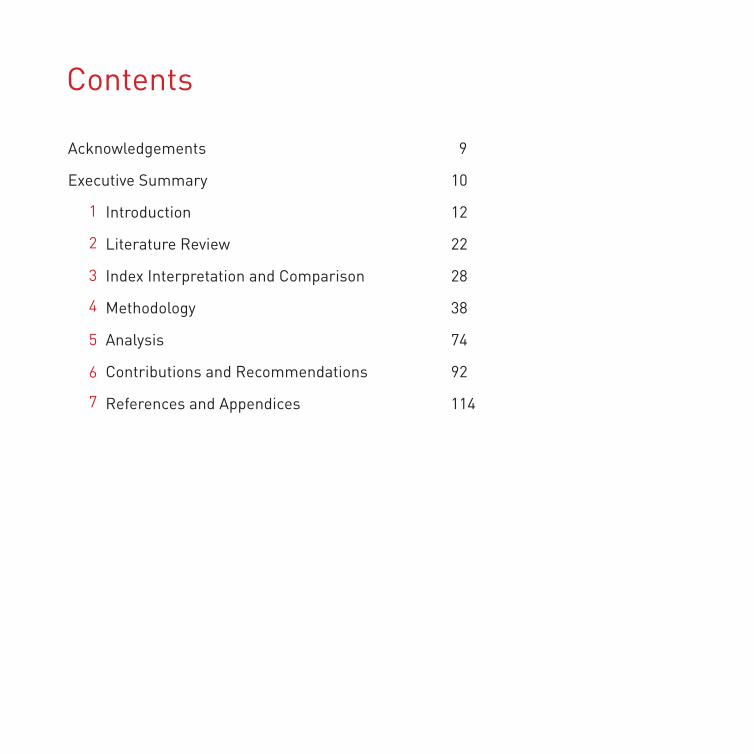
Contents
Acknowledgements 9
Executive Summary 10
Introduction 12
Literature Review 22
Index Interpretation and Comparison 28
Methodology 38
Analysis 74
Contributions and Recommendations 92
References and Appendices 114
1
2
3
4
6
7
5
8
Foreword
I am pleased to present the second national Digital Divide Survey conducted by the Telecommunications Authority of Trinidad and Tobago (TATT). This report details the statistical and analytical results stemming from implementation of the survey which was designed to meet several objectives:
• to pinpoint the underserved communities within Trinidad and Tobago
• to provide benchmarking figures on the ICT (Information and Communication Technology) scale for Trinidad and Tobago’s comparison with other international countries
• to identify the telecommunications needs of persons with disabilities, and
• to assess the ability of those persons to afford assistive technologies (equipment and services).
In the conclusion of the report, recommendations are proposed for consideration that may assist in bridging the digital divide and contribute towards continued ICT development in Trinidad and Tobago.
8 9
What is the Digital Divide?
The “Digital Divide” is generally referred to as the gap that exists between those persons and communities that have access to ICTs and those that do not. In part, the solution for bridging the digital divide is to enable universal access and service, that is, making available basic telecommunications services at an affordable price for all in society.
A significant requirement of the Authority’s mandate speaks to “promoting universal access to telecommunications services for all persons in Trinidad and Tobago, to the extent that is reasonably practicable to provide such access”1. In accordance with this mandate, the Authority has drafted a Universal Service Framework and accompanying Regulations which outline targets as well as the administrative system to define and execute particular initiatives to provide telecommunications services to a widest possible population. The determination of these targets and initiatives, which will change over time, will be influenced by the results of this Digital Divide survey.
Also contained within the Universal Service Framework and Regulations are Universal Service Obligations where service providers are requested to provide basic telecommunications services to selected communities and specific population groups, which are to be identified by the Authority. However, a mechanism is required to identify the communities and population groups that can be labeled as ‘underserved’ in accessing or affording basic telecommunication services. The results of the digital divide survey are intended to provide this information.
Digital Divide Surveys
In August 2007, the Authority conducted its first Digital Divide Survey the results of which were similarly used for the identification of underserved communities within Trinidad and Tobago. However this survey was conducted on the cusp of the launch of one of our now major broadband Internet service providers in the country. The result of that launch was the explosion of broadband uptake in Trinidad and Tobago as market competition led to greater availability and affordability of broadband services. Within that year, we saw broadband penetration increase by an astounding 138%, a trend which has continued in upward movement thus far. As anticipated and seen in the 2013 survey results, the rapid increase in broadband penetration has significantly and positively impacted the indicators used for measuring the digital divide showing that Trinidad and Tobago has progressed in ICT development when compared to 2007.
1 Extracted from the Objects of the Telecommunications Act Chap 47:31 of Trinidad and Tobago.
10
We believe that the survey results would be useful input data for a cross-section of both private and public sector ICT projects in Trinidad and Tobago, as well as a key measurement tool to track the country’s ICT growth.
The Authority wishes to extend its sincere appreciation to all those persons who actively participated in the survey and to the service providers who assisted in providing the platform for conducting our very first mobile-based survey.
Without their support this report would not be possible.
Cris SeecheranChief Executive OfficerTelecommunications Authority of Trinidad and Tobago
10 11
Acknowledgements
The Telecommunication Authority of Trinidad and Tobago (TATT) expresses profound gratitude and deep regards to both mobile network operators, Digicel and TSTT for facilitating the Digital Divide Survey through their respective networks, and facilitating compensation for participants through top-ups upon survey completion.
We also thank students from The University of the West Indies (UWI) Department of Social Sciences who helped as enumerators to improve response rates in certain regions, and additional marketing strategies.
The Central Statistical Office of Trinidad and Tobago, who provided vital data for this study through the 2011 Population and Housing Census Report.
TATT is also very grateful to Dr. Kim I. Mallalieu, Senior Lecturer & Principal Investigator, Caribbean ICT Research Programme (Trinidad and Tobago) Department of Electrical and Computer Engineering, The University of the West Indies (St. Augustine) who provided (gratis) advice in the preparatory and implementation phases of the Digital Divide Survey of Trinidad and Tobago, 2013.
We thank Dr. Patrick Hosein, Senior Lecturer in Computer Science at the University of The West Indies for his contribution and knowledge in the field of wireless technologies.
TATT would also thank its agent, mSurvey who, among other things, coordinated the inputs of the stakeholders to conduct the Digital Divide Survey 2013 in Trinidad and Tobago.
12
Executive Summary
The Digital Divide Survey is related to the economic development of a country through technological means, and looks at persons with access to technology, the utilization of such modes of technology, and the ease of access to such. Assessing the Digital Divide for Trinidad and Tobago entails a multi-faceted approach that consists of variables defined and developed by the International Telecommunication Union (ITU) and implemented locally by the regulatory body which oversees the development of the telecommunications and broadcasting sectors, the Telecommunications Authority of Trinidad and Tobago (TATT).
This report highlights the dynamics of technology and access in Trinidad and Tobago, and discusses the challenges of calculating the Digital Divide with the current metrics for individual communities. The Digital Divide Survey was a comprehensive study to collect data for the calculation and measurement of the digital divide across Trinidad and Tobago. For this, three internationally recognized tools are used, i.e., the Digital Access Index (DAI), Digital Opportunity Index (DOI) and the ICT Development Index (IDI).
A two stage stratified sampling design of the two islands based on the populations of the respective constituting municipalities (14 regions in Trinidad and 7 regions in Tobago) used to obtain the necessary primary data. The design is based on the 2011 National Demographics and Housing Census Report issued by the Central Statistical Office under the Ministry of Planning and Sustainable Development.
12 13
The three indices are calculated for the 21 municipalities and comparisons made. The indices for the entire country are also calculated. The most recent Digital Divide Survey was carried out in 2007 and it measured the DAI, DOI and an alternative DOI (DOI_ALT) devised to cater for the disproportional weight arising from the low mobile Internet subscription at the time the research was conducted. However, access to certain modes of technology has changed. At the time of conducting the research presented in this report, there were more mobile Internet subscribers, a factor which contributes to proportionally weighted indicators.
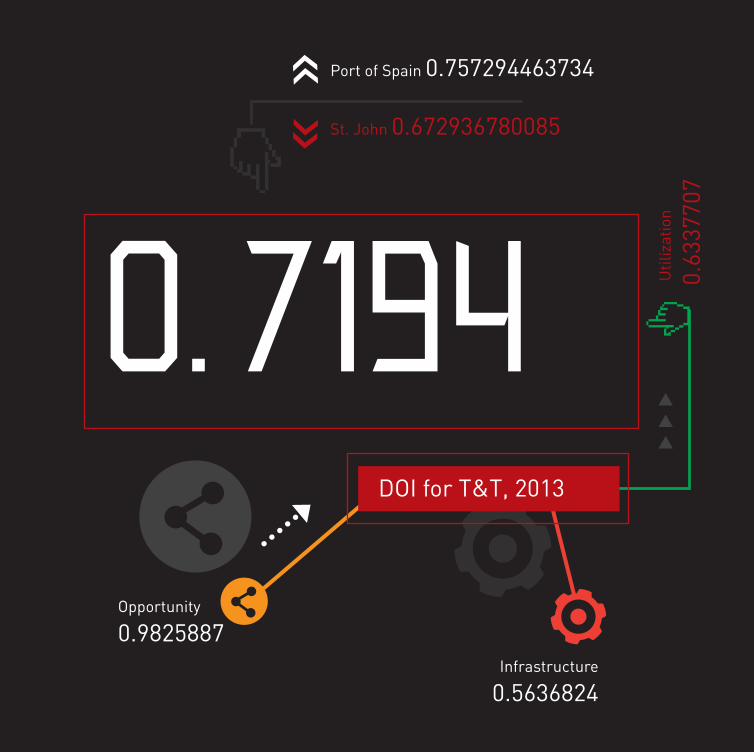
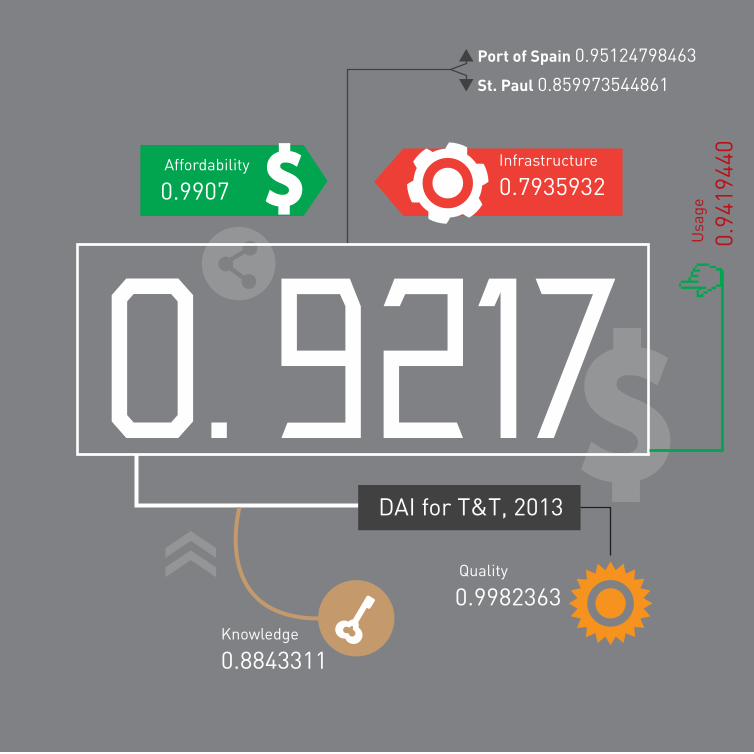
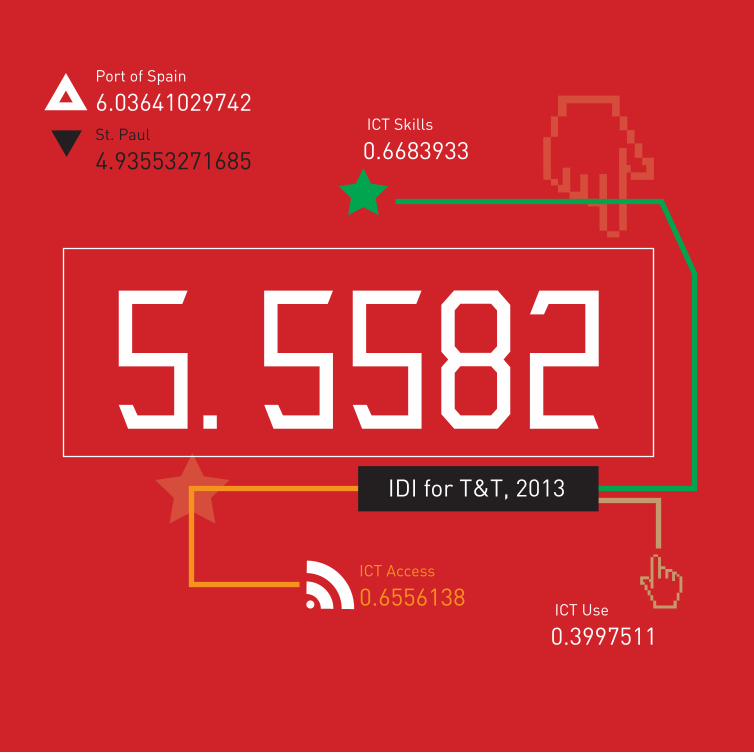
The index values obtained for the country are: DOI – 0.7194, DAI – 0.9217 and IDI – 5.5582.
Regionally, the City of Port of Spain has the highest DOI, IDI and DAI while St. Paul has both the lowest IDI and DAI. Regions in Tobago trail those in Trinidad overall.
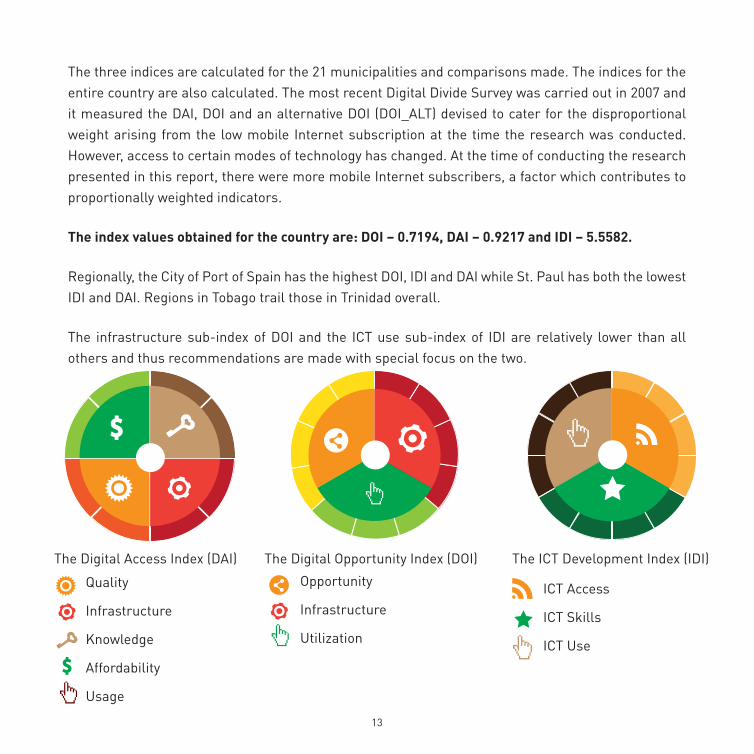
The infrastructure sub-index of DOI and the ICT use sub-index of IDI are relatively lower than all others and thus recommendations are made with special focus on the two.
The Digital Opportunity Index (DOI)
Opportunity
Infrastructure
Utilization
The ICT Development Index (IDI)
ICT Access
ICT Skills
ICT Use
The Digital Access Index (DAI)
Quality
Infrastructure
Knowledge
Affordability
Usage

14

15
Introduction
01
16
Objectives of the study
The main objectives of this study are:
1. To measure the digital divide in Trinidad and Tobago on a national (macro) level using the ICT Development Index (IDI), Digital Access Index (DAI) and Digital Opportunity Index (DOI).
2. To measure the Digital Divide on a micro (community) level using the ICT Development Index (IDI), Digital Access Index (DAI) and Digital Opportunity Index (DOI) to identify underserved communities.
The specific objectives are to:
• Collect statistically valid, representative and unbiased data to be used in calculation of the indicators and the resulting respective indices.
• Determine the underserved regions/municipalities and communities within Trinidad and Tobago.
• Establish the extent of the difference in basic telecommunication services accessible to individuals as well as households in the different regions.
• Benchmark Trinidad and Tobago on the ICT scale with other international countries. The survey will provide granular insight into how Trinidad and Tobago is doing in improving access to ICTs. The report will provide insight into how ICTs are being used effectively and efficiently in the context of a progressive island.
• Draw conclusions and make recommendations based on the calculated digital divide indices.
• Identify the telecommunication needs of persons who are differently-abled
• Assess the ability by members of the differently-abled community to afford assistive
technologies (equipment and services)
Introduction
16 17
Project deliverables
The deliverables of this study are (but not limited to):
1. A report containing the raw data collected from the responses to the surveys;
2. The overall DAI, DOI and IDI measurements for Trinidad and Tobago and the DAI, DOI and IDI measurements for the predefined geographical areas;
3. The identification of notable contributors to Trinidad and Tobago’s Digital Divide
4. Recommendations for decreasing the digital divide.
18
Background on Trinidad and Tobago
The small twin-island Republic of Trinidad and Tobago, at the southernmost country in the Caribbean archipelago is atypical compared to the other Caribbean islands. Today, the population stands at 1.3 million persons of various ethnic origins. Adult literacy rate is 99%, with undergraduate and post-graduate tertiary education is subsidized by the government through the Government Assistance for Tuition Expenses Program (GATE).
Trinidad comprises of 14 municipalities – 2 cities, 3 boroughs, and 9 regional corporations – while Tobago comprises of seven parishes. The capital city of Port of Spain continues to be the most densely populated area in the country, while the Tunapuna/Piarco region is the most populous. Sangre Grande is the largest region in terms of area, but is second only to the Mayaro/Rio Claro region in terms of lowest population density. In Tobago, population density is highest in St. Andrew and St. Patrick. In Trinidad, much of the on-land heavy industrial activity is concentrated along the western coast in Point Lisas which falls in the Couva/Tabaquite/Talparo region, in the Borough of Point Fortin, in Pointe-a-Pierre in the City of San Fernando, and in La Brea which falls in the Siparia region. All of these are coastal settlements in the Gulf of Paria. The Borough of Chaguanas is the fastest growing region in the country and boasts of a very vibrant and burgeoning commercial sector. The majority of the population of Trinidad and Tobago lives along what is known as the “East-West Corridor” which stretches from Port of Spain in the west to the Borough of Arima in the East. It is estimated that 14% of the population live in urban settings.
The Specific Case of TrinidadAs in many parts of the world, the quality of infrastructure in Trinidad and Tobago is inconsistent across the country’s landscape. The inconsistency also applies to the ICT infrastructure which is readily
18 19
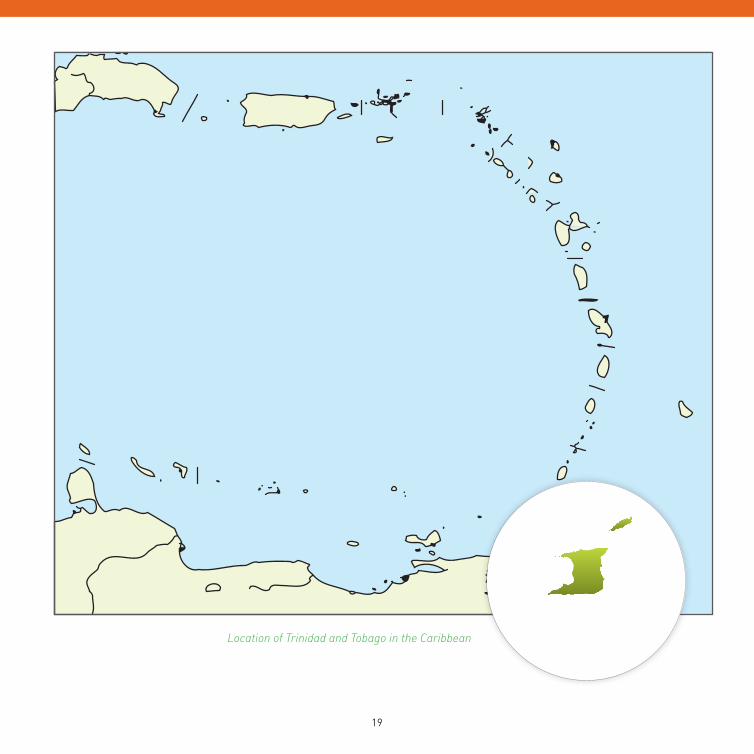
Location of Trinidad and Tobago in the Caribbean
20
available in more developed urban areas, while it is less developed in rural areas. Although T&T boasts a 140% mobile phone penetration rate, the figure does not speak to the level of mobile literacy (the ability to perform a variety of tasks on a mobile phone using a variety of mobile applications) among the general population, and is not indicative of the overall proclivity of different ICT technologies. Furthermore, ICT adoption and use varies widely by sub-sectors of the population, such as those who are socially isolated, elderly, and differently-abled.
Universal Services and the Differently-abledOne of TATT’s mandates is to promote universal access to telecommunications services, and as such, seeks to measure the Digital Divide amongst the whole population. After an assessment of the resource deficient communities, TATT chose to leverage its rich accumulated knowledge and deep personal relationship with the differently-abled population of Trinidad and Tobago to focus their initial interventions on providing for their specific needs.
TATT’s organizational commitment to the needs of persons with disabilities began in May 2008 when it hosted a public symposium that commemorated the World Information Society Day themed ‘Connecting the Disabled’. The majority of the symposium participants were members of the differently-abled community of Trinidad and Tobago and as a result, TATT received feedback on specific telecommunications issues adversely affecting them, including the affordability, availability and usability of both mainstream and assistive technologies. (Since 2008, TATT has been constantly liaising with the relevant differently-abled social development agencies and has put mechanisms in place to facilitate the access of affordable basic telecommunication services by members of the differently-abled community.)
2 “Are We Developed?” 2013. Trinidad Express Newspaper. Accessed September 4. http://www.trinidadexpress.com/ commentaries/Are_we_developed_-133214738.html.3 Bahamas has the highest GDP per capita in the region at USD23,485.
20 21
Municipality/Parish Land Area(Sq km)
Density(Per Sq km)
2011
Density(Per Sq km)
2000
Population2011
Population2000
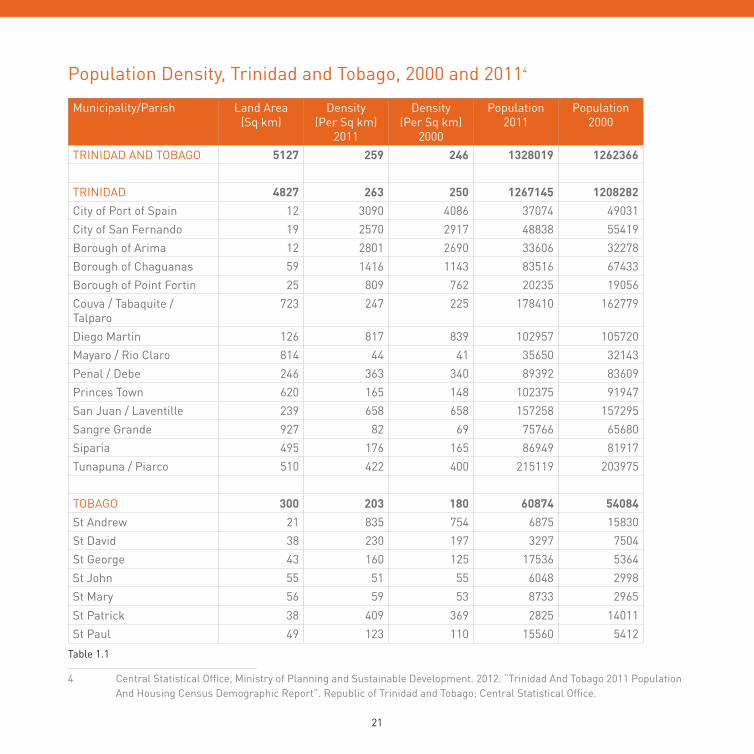
TRINIDAD AND TOBAGO 5127 259 246 1328019 1262366
TRINIDAD 4827 263 250 1267145 1208282City of Port of Spain 12 3090 4086 37074 49031City of San Fernando 19 2570 2917 48838 55419Borough of Arima 12 2801 2690 33606 32278Borough of Chaguanas 59 1416 1143 83516 67433Borough of Point Fortin 25 809 762 20235 19056Couva / Tabaquite / Talparo
723 247 225 178410 162779
Diego Martin 126 817 839 102957 105720Mayaro / Rio Claro 814 44 41 35650 32143Penal / Debe 246 363 340 89392 83609Princes Town 620 165 148 102375 91947San Juan / Laventille 239 658 658 157258 157295Sangre Grande 927 82 69 75766 65680Siparia 495 176 165 86949 81917Tunapuna / Piarco 510 422 400 215119 203975
TOBAGO 300 203 180 60874 54084St Andrew 21 835 754 6875 15830St David 38 230 197 3297 7504St George 43 160 125 17536 5364St John 55 51 55 6048 2998St Mary 56 59 53 8733 2965St Patrick 38 409 369 2825 14011St Paul 49 123 110 15560 5412
Population Density, Trinidad and Tobago, 2000 and 20114
Table 1.1
4 Central Statistical Office, Ministry of Planning and Sustainable Development. 2012. “Trinidad And Tobago 2011 Population And Housing Census Demographic Report”. Republic of Trinidad and Tobago: Central Statistical Office.
22
5 http://www.ttconnect.gov.tt/gortt/portal/ttconnect/CitizenDetail?WCM_GLOBAL_CONTEXT=/gortt/wcm/connect/ GorTT%20Web%20Content/ttconnect/Citizen/topic/governmentandpolitics/documents+and+policies/ telecommunications+regulation
Measuring Trinidad’s Digital Divide from 2007-2012TATT’s last active population survey to measure the Digital Divide was in 2007. The difference between the 2007 approach and that of the 2013, is that mSurvey has applied an innovative survey technology and methodology to coincide with the growth of mobile phones within the intervening 6 years. The 2007 survey relied exclusively on paper-based data collection. The enumerators traveled to the most remote parts of Trinidad and Tobago to conduct door-to-door surveys. The researchers used the 2000 National Census to identify and locate people. However, because there was a time lag between the actual collection of that census data and the time it was accessed for the purpose of the 2007 Digital Divide Survey, the enumerators frequently encountered situations in which residents no longer resided at the recorded address. The lack of current data made it difficult to plan in advance which households would be targeted to ensure a representative survey sample.
The very nature of the paper-based survey meant that TATT could not follow the data collection process in real-time. The lack of real-time monitoring deprived TATT of the ability to gauge whether the survey proceeded according to plan, and of the ability to alter the survey in process to adapt to the shifting composition of the participant base.
22 23
Report organization
The following is the presentation format for the rest of this report:
• Chapter 2 focuses on reviewing previously done studies on digital divide and the findings, as well as other relative material that highlights the advantages of using the mobile platforms and other technology in conjunction with other conventional data collection methods.
• Chapter 3 compares and offers a detailed interpretation of the three indices, i.e. DOI and DAI and IDI.
• Chapter 4 outlines and discusses the methodology used to collect, analyze, and calculate the indices throughout Trinidad and Tobago. It highlights the data used and the different sources. The subsequent data processing applied to obtain the indicators and the indices is also discussed in this chapter. This includes the use of the mSurvey technology and the outstanding comparative advantages (and challenges) over other methods used in the past to obtain the primary data and calculate the indices.
• Chapter 5 discusses the analysis of the indices along with the results from the differently-abled survey.
• Chapter 6 discusses the challenges faced in the course of the study.
• Chapter 7 offers an outline of the contribution to closing the digital divide through comparative studies and analysis. This chapter also gives advice on the definitions used to calculate the digital divide, and future analysis for improving the metrics of defining the digital divide. The results and analysis of persons with disabilities survey are also offered in Chapter 7.

24
25
Literature Review
02

26
The preceding Digital Divide Survey carried out in 2007 by Sir Arthur Lewis Institute of Social and Economic Studies (SALISES), University of the West Indies for TATT obtained the DOI, DAI as well as the alternate DOI. The digital divide study of 2007 focused on the indices of some 585 distinct communities in the country as well as the overall country indices. The Digital opportunity index was 0.6315. This is a high value and proved that accessibility and affordability of ICT services in Trinidad and Tobago was not an issue. Recommendations that immediate steps be taken to improve ICT infrastructure with particular emphasis on encouraging Internet access were made. It was also recommended that provision of affordable broadband Internet through fixed line and, especially, mobile phones be prioritized. The DAI value calculated was 0.6668.
Measuring the World Information Reports (2009, 2010, 2011, 2012) by ITU provide sufficient guidance on IDI calculation. The reports also give the indices for all countries over the years. The indices provides the parameters upon which comparisons between Trinidad and Tobago and other developed countries can be made in order to gauge the relative rate of development.
The World Telecommunication Indicators Database maintained by the ITU provides universal publications, reports and indicators on key areas such as mobile subscriptions over the
years, in addition to providing guidelines on index calculation procedures.
26 27
The World Summit on the Information Society report (2006), prepared by an ITU led team, introduced the DOI. It describes DOI as composite index that measures “digital opportunity” or the possibility for the citizens of a particular country to benefit from access to information that is “universal, ubiquitous, equitable and affordable”. The DOI involves new and innovative technologies such as mobile Internet and broadband. It can thus be used to assess the growth and take-up of new ICTs. Hence, it will remain relevant for some time to come, unlike more traditional connectivity indicators (e.g. fixed lines), which may become less relevant for developing countries through the expansion of mobile telephony networks, advanced wireless connectivity and own technology “leapfrogging”. Guidelines on calculating the index are also given.
The Korea Agency For Digital Opportunity And Promotion (2004) outlines the measurement of digital divide and the current issues in relation to the indices. Digital divide is defined in two ways:
1. The Organization for Economic Co-operation and Development (OECD defines the digital divide as the gap between individuals, households, businesses and geographic areas at different socioeconomic levels with regard both to their opportunities to access ICTs and to their use of the Internet for a wide variety of activities;
2. The Academic definition of the term digital divide refers to the disparity in accessing to the technologies and resources of the information and communication.
The World Bank (2013) on its website articulately defines terms such as adult literacy, GNI per capita, and School enrollment for all levels (Pre-Primary, primary, Secondary and tertiary) as gross and net percentage. It also provides sufficient school enrollment data for all these levels.
The Central Statistical Office under the Ministry of Planning and Sustainable Development (2011) conducted the census in the republic of Trinidad and Tobago. The Digital Divide Survey team obtained well-structured demographic data of the two islands based on the different regions. The data was useful in designing the Digital Divide Survey as well as index calculation.
28
Economist Bertha Umelia Rodríguez Jara of the National Institute of Statistics and Informatics, Peru (2006) presented a report on the DOI of Peru at the Digital Opportunity Forum. A fundamental aspect of the report was the recommendations on how DOI could be improved in future studies for more comprehensive policy analysis. One of the future directions suggested was that DOI could be used to measure economic progress. The DOI could be used to show how a country (or regions within a country) is progressing because of the production of ICTs and the benefits of this economic activity in generating incomes for the economy as a whole. The study could not, however, apply and analyze DOI by gender due to lack of sufficient and updated data on the same.

28 29
...people are more likely to disclose sensitive information via text messages than in voice interviews.— Michigan University (2012)

30
31
Index Interpretation and Comparison
03
32
DOI
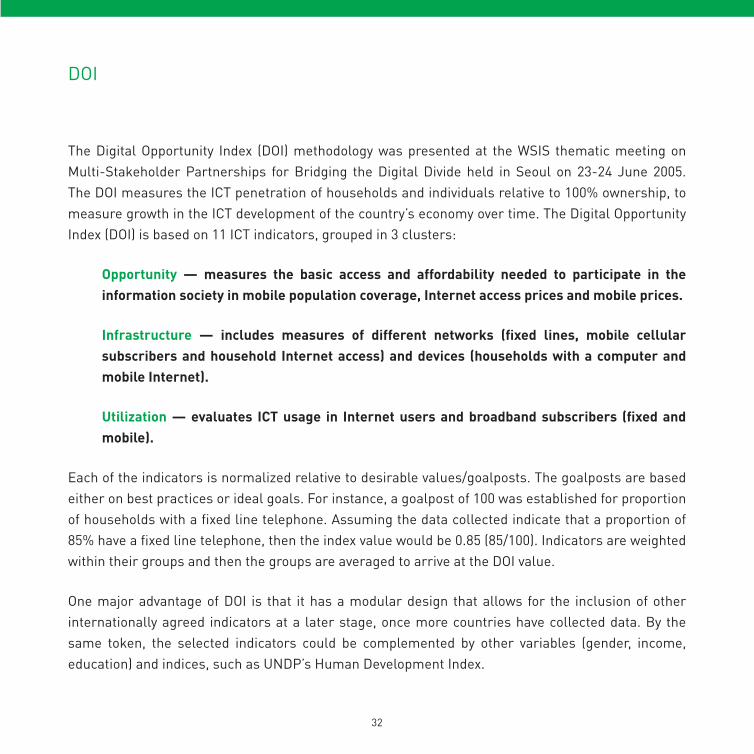
The Digital Opportunity Index (DOI) methodology was presented at the WSIS thematic meeting on Multi-Stakeholder Partnerships for Bridging the Digital Divide held in Seoul on 23-24 June 2005. The DOI measures the ICT penetration of households and individuals relative to 100% ownership, to measure growth in the ICT development of the country’s economy over time. The Digital Opportunity Index (DOI) is based on 11 ICT indicators, grouped in 3 clusters:
Opportunity — measures the basic access and affordability needed to participate in the information society in mobile population coverage, Internet access prices and mobile prices.
Infrastructure — includes measures of different networks (fixed lines, mobile cellular subscribers and household Internet access) and devices (households with a computer and mobile Internet).
Utilization — evaluates ICT usage in Internet users and broadband subscribers (fixed and mobile).
Each of the indicators is normalized relative to desirable values/goalposts. The goalposts are based either on best practices or ideal goals. For instance, a goalpost of 100 was established for proportion of households with a fixed line telephone. Assuming the data collected indicate that a proportion of 85% have a fixed line telephone, then the index value would be 0.85 (85/100). Indicators are weighted within their groups and then the groups are averaged to arrive at the DOI value.
One major advantage of DOI is that it has a modular design that allows for the inclusion of other internationally agreed indicators at a later stage, once more countries have collected data. By the same token, the selected indicators could be complemented by other variables (gender, income, education) and indices, such as UNDP’s Human Development Index.
32 33
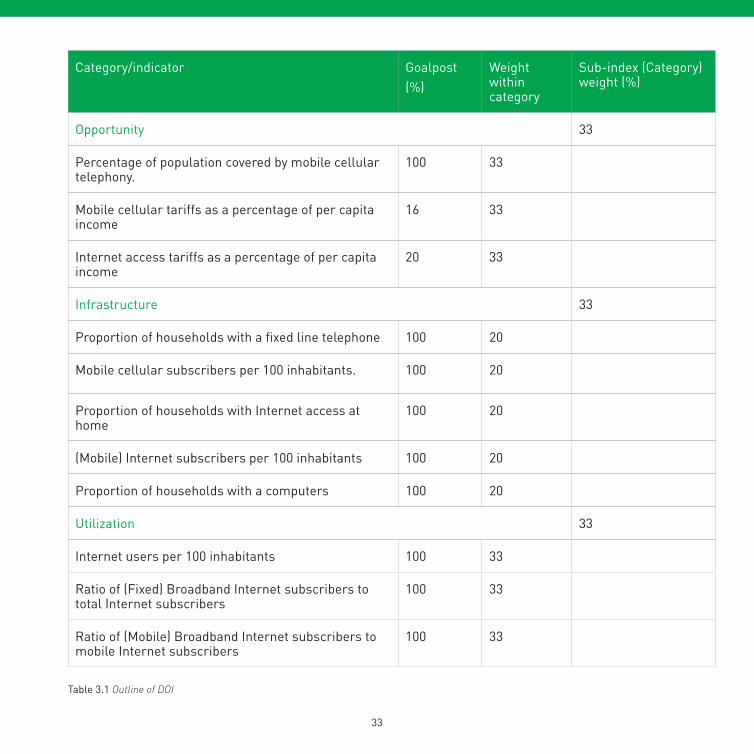
Category/indicator Goalpost (%)
Weight within category
Sub-index (Category) weight (%)
Opportunity 33
Percentage of population covered by mobile cellular telephony.
100 33
Mobile cellular tariffs as a percentage of per capita income
16 33
Internet access tariffs as a percentage of per capita income
20 33
Infrastructure 33
Proportion of households with a fixed line telephone 100 20
Mobile cellular subscribers per 100 inhabitants. 100 20
Proportion of households with Internet access at home
100 20
(Mobile) Internet subscribers per 100 inhabitants 100 20
Proportion of households with a computers 100 20
Utilization 33
Internet users per 100 inhabitants 100 33
Ratio of (Fixed) Broadband Internet subscribers to total Internet subscribers
100 33
Ratio of (Mobile) Broadband Internet subscribers tomobile Internet subscribers
100 33
Table 3.1 Outline of DOI
34
DAI
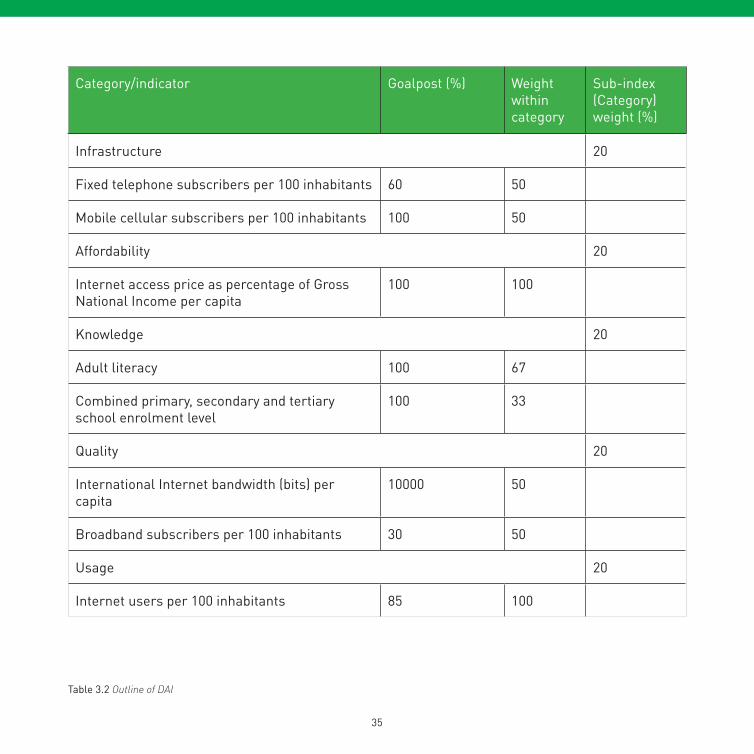
The Digital Access Index reflects the ability of a country’s population to take advantage of Internet communication technologies. This index follows the same methodology as the DOI. It groups 8 indicators into five categories (Infrastructure, Affordability, Knowledge, Quality and Usage).
34 35
Category/indicator Goalpost (%) Weight within category
Sub-index (Category) weight (%)
Infrastructure 20
Fixed telephone subscribers per 100 inhabitants 60 50
Mobile cellular subscribers per 100 inhabitants 100 50
Affordability 20
Internet access price as percentage of Gross National Income per capita
100 100
Knowledge 20
Adult literacy 100 67
Combined primary, secondary and tertiary school enrolment level
100 33
Quality 20
International Internet bandwidth (bits) per capita
10000 50
Broadband subscribers per 100 inhabitants 30 50
Usage 20
Internet users per 100 inhabitants 85 100
Table 3.2 Outline of DAI
36
IDI
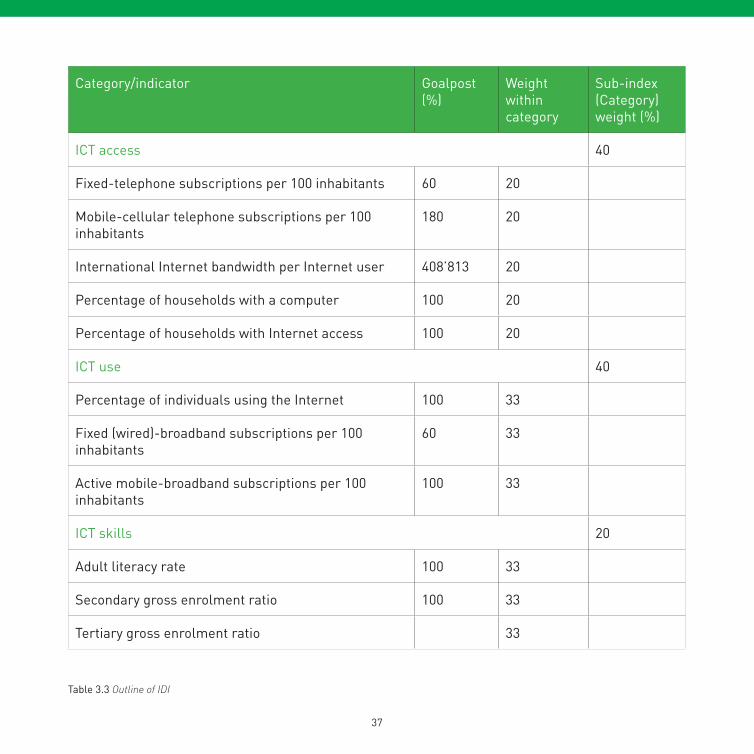
The ICT Development Index (IDI) is a tool used to benchmark and track the progress the different regions in a country are making towards becoming an information society. This is then translated to the country as whole and comparisons done with other countries, both at the same level of development and otherwise. The IDI is a composite index made up of 11 indicators covering ICT access, use and skills.
It is measured on a scale of 0 to 10, where a value of 10 indicates high ICT development and a value of zero indicates least ICT development. Each variable is converted to a variable indicator with a value between zero and one by dividing it by the reference value or “goalpost”. Similar to DOI and DAI, IDI is a weighted average of the category indices, which are obtained from the variable indices with reference to the goalpost/ideal value. Normalization of the data is necessary before any aggregation can be made in order to ensure that the data set uses the same unit of measurement.
For the indicators selected for the construction of the IDI, it is important to transform the values to the same unit of measurement, since some of them are expressed as a percentage of the population or of households, whereby the maximum value is 100, while other indicators (although also expressed as a percentage) can have values exceeding 100, such as mobile-cellular subscriptions or international Internet bandwidth. For IDI, the distance to the goalpost is used as the normalization criterion.
36 37
Category/indicator Goalpost (%)
Weight within category
Sub-index (Category) weight (%)
ICT access 40
Fixed-telephone subscriptions per 100 inhabitants 60 20
Mobile-cellular telephone subscriptions per 100 inhabitants
180 20
International Internet bandwidth per Internet user 408’813 20
Percentage of households with a computer 100 20
Percentage of households with Internet access 100 20
ICT use 40
Percentage of individuals using the Internet 100 33
Fixed (wired)-broadband subscriptions per 100 inhabitants
60 33
Active mobile-broadband subscriptions per 100 inhabitants
100 33
ICT skills 20
Adult literacy rate 100 33
Secondary gross enrolment ratio 100 33
Tertiary gross enrolment ratio 33
Table 3.3 Outline of IDI
38
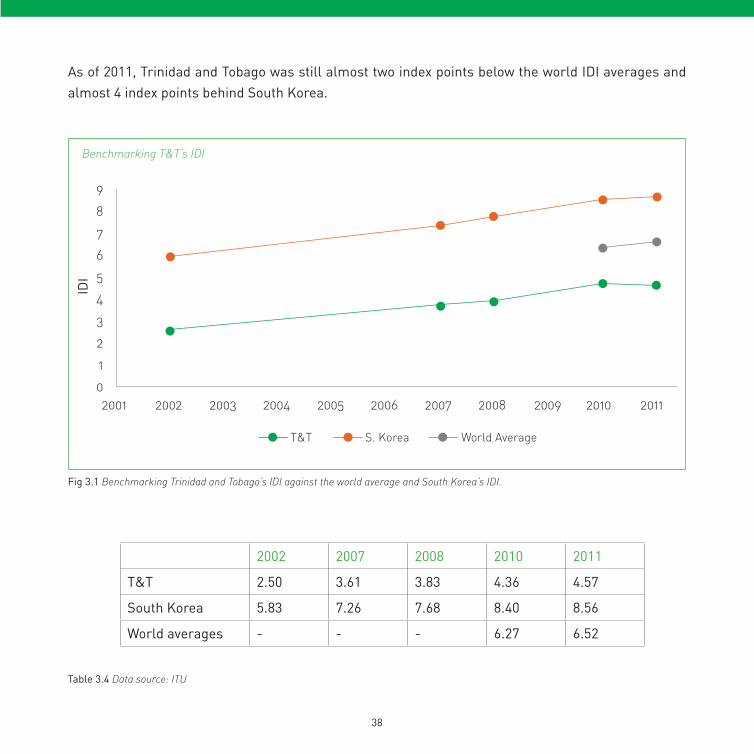
Benchmarking T&T’s IDI
2002 2007 2008 2010 2011
T&T 2.50 3.61 3.83 4.36 4.57
South Korea 5.83 7.26 7.68 8.40 8.56
World averages - - - 6.27 6.52
9
8
7
6
5
4
3
2
1
02001
IDI
2002 2003
T&T S. Korea World Average
2004 2005 2006 2007 2008 2009 2010 2011
Fig 3.1 Benchmarking Trinidad and Tobago’s IDI against the world average and South Korea’s IDI.
Table 3.4 Data source: ITU
As of 2011, Trinidad and Tobago was still almost two index points below the world IDI averages and almost 4 index points behind South Korea.
38 39
However, there has been a marked steady increasing trend in the IDI index over the years which is partly attributed to the increased mobile phone penetration which now stands at 140%.
40

40 41
Methodology
04
42
The data and the data sources
The Digital Divide Survey of 2013 investigates the digital divide as regional indices within Trinidad and Tobago, rather than overall country figures, as exhibited in 2007.
The research conducted took a novel approach to the collection of national data and calculation of the digital divide in Trinidad and Tobago. Data was collected using a SMS mobile phone platform provided by mSurvey. This is an improvement due to the substantial increase in response rates, swifter data processing as well as real-time index calculations.
These data are subsequently used to calculate the indicators of the three indices. The indicators are grouped into vectors, around which the indices are built.
The Digital Access Index (DAI). The DAI is built around eight indicators grouped into four fundamental vectors that reflect a country’s ability to access ICTs: infrastructure, affordability, knowledge and quality and actual usage of ICTs.
The Digital Opportunity Index (DOI). The DOI is based on eleven ICT indicators, grouped into three vectors: opportunity, infrastructure and utilization.
The ICT Development Index (IDI). The IDI contains twelve ICT indicators, grouped into three vectors: ICT access, use and skills.
In addition to the Digital Divide Survey, TATT developed a supplemental survey to the DDS with a focus to collect data on the differently-abled in the surveyed households.
Indicators and indices were constructed using both secondary and primary data. The research team accessed a number of local and international sources for secondary data.
42 43
Secondary data sourcesCentral Statistical Office of Trinidad and Tobago (Ministry of Planning and Sustainable Development)The 2011 Demographic and Housing Census report provide a basis upon which the sample would be selected and allocated proportionally, based on the populations of the different regions (municipalities) as well as the gender and age of target respondents.
International Telecommunication Union, through WSIS Thematic Meeting reportsData on Internet access tariffs and population coverage (defined as the percentage of the total number of households in Trinidad and Tobago covered by the relevant network or service.
World BankData on school enrollments for primary and secondary as well as the literacy rate used in the computation of IDI and DAI was extracted from World Bank Indicator Database. The necessary data on GNI per capita were also sourced from World Bank.
The Telecommunications Authority of Trinidad and Tobago (TATT)The necessary data on Fixed Voice Subscriptions, Mobile Voice Subscriptions, Number of Internet Subscribers, Fixed Narrowband Internet Subscriptions/ Fixed Broadband Internet Subscriptions, Number of Mobile Voice subscriptions with Mobile Internet access, Prepaid/postpaid Mobile Internet Access were provided by TATT. The data were useful to calculate most of the indicators including the weighted coverage by mobile serviced providers by market share and location.
44
Who was surveyed?
Who is yourNetwork Provider ?
Are you Head of the Household?
TSTT
Digicel
Arim
a
Chag
uana
s
Couv
a/Tab
aquit
e/Talp
aro
Dieg
o Mart
in
Maya
ro/R
io Cla
ro
Pena
l/Deb
e
Point
Forti
n
Port
of Sp
ain
Princ
es To
wn
San F
ernan
do
San J
uan/
Lave
ntille
Sang
re Gr
ande
Sipari
a
Tuna
puna
/Piar
co
St. An
drew
St. D
avid
St. G
eorg
e
St. Jo
hn
St. M
ary
St. Pa
trick
St. Pa
ul
0
250
500
750
1000
1250
1500
NO YES
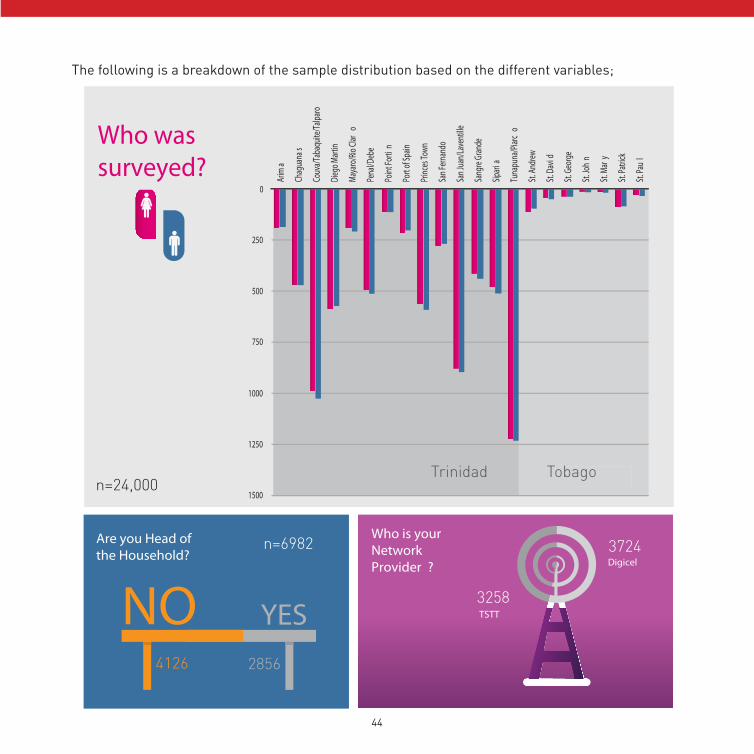
The following is a breakdown of the sample distribution based on the different variables;
4126
TobagoTrinidad
3258
3724
2856
n=6982
n=24,000
44 45
Primary dataThe primary data were obtained from the household and individual survey carried out on the mSurvey platform. A two stage stratified sampling design was used. The municipalities of the two islands (14 in Trinidad, 7 in Tobago) were used as the primary sampling units. The secondary sampling units were then assigned proportional to the population of the regions as reported in the 2011 National Demographic and Housing Census carried out by the Central Statistical Office of Trinidad and Tobago. Regional populations, gender, head of household (or otherwise), as well as the population densities were variables considered in sample allocation, with the latter determining rural and urban regions. The mobile network provider was also a variable due to the means of data collection through mSurvey. 24,000 persons accessed the survey out of which 11,000 participants actually completed the survey.
For index calculation, a sample of 6,982 respondents was used. This was as a result of low a response rate in Tunapuna region. In order to maintain sample distribution which was representative of the entire population (according to the National Census), the entire sample population had to be normalized through weighting to align with the sample size obtained in the Tunapuna/Piarco region. The final sample size of 6,982 respondents guaranteed a 95% confidence level with a marginal error of +/-1.17%.The confidence level is attributed to the large sample size obtained at a relatively low cost; consequently allowing a low variance to be also attained. As a result of the survey being admissible to any person who satisfied the demographic selection criterion by their own initiative, there are no callbacks involved. The lack of callback significantly reduces the cost. A relatively strong balance between maximizing data quality and controlling measurement error while minimizing respondent burden and eliminating respondent cost is achieved.
Delayed compensation reduced the diffusion/dissemination rate of the survey through personal networks. Experience has taught mSurvey that surveys are much more pervasive throughout personal networks, and in general,if participants receive their compensation immediately upon completion of the survey, there is an exponential increase in the dissemination rate.
6 Moving average and first difference are some of the tools used in time series analysis to get a perspective of underlying trend and seasonality, if any, and predict thereon.
46
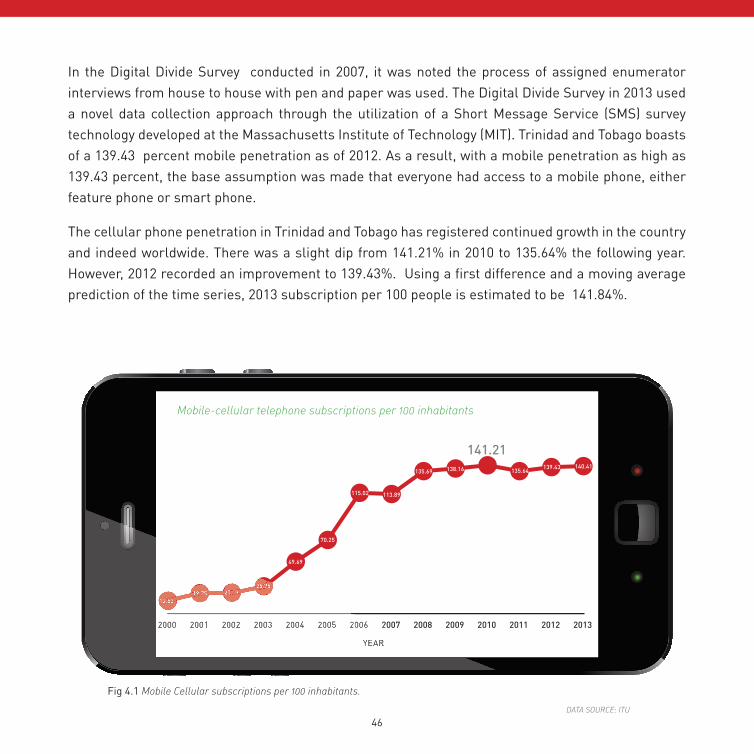
In the Digital Divide Survey conducted in 2007, it was noted the process of assigned enumerator interviews from house to house with pen and paper was used. The Digital Divide Survey in 2013 used a novel data collection approach through the utilization of a Short Message Service (SMS) survey technology developed at the Massachusetts Institute of Technology (MIT). Trinidad and Tobago boasts of a 139.43 percent mobile penetration as of 2012. As a result, with a mobile penetration as high as 139.43 percent, the base assumption was made that everyone had access to a mobile phone, either feature phone or smart phone.
The cellular phone penetration in Trinidad and Tobago has registered continued growth in the country and indeed worldwide. There was a slight dip from 141.21% in 2010 to 135.64% the following year. However, 2012 recorded an improvement to 139.43%. Using a first difference and a moving average prediction of the time series, 2013 subscription per 100 people is estimated to be 141.84%.
Mobile-cellular telephone subscriptions per 100 inhabitants
DATA SOURCE: ITU
Fig 4.1 Mobile Cellular subscriptions per 100 inhabitants.
46 47
It therefore follows that the use of an SMS-based mobile technology to deploy surveys to the masses has become more convenient and feasible since a wider variety of respondents can be reached. In addition, the use of an SMS-based mobile survey adopts the general philosophy of the study to shrink the digital divide in Trinidad and Tobago with the utilization of technology. A novel approach called mSurvey was applied for conducting the Digital Divide Survey.
mSurvey’s technology is one built on the premise of end-user opt-in to participate. mSurvey did not spam or at any time send out unsolicited messages to the survey respondents. All persons had an equal probability of being sampled by opting into the survey. Entry into the survey is not based on the mechanics of the tool but on voluntary action by willing participants. The voluntary participation eliminates any possibility of selection bias. Also, potential non-response bias is eliminated since no particular respondents are identified and targeted before-hand. TATT with the help of The mSurvey Team developed a three-prong sensitization campaign prior to survey deployment such that the prospective respondents text a set “joincode”7 to opt into the survey. TATT deployed a nationwide radio, television, and newspaper marketing campaign. The mSurvey platform was integrated with custom in-built real-time filters and analysis features that ensured the responses conformed to the sample design with regard to the demographic variables such as age, gender, head of household or not head of household, as well as the geographical regions defined by the Central Statistical Office. With these real-time filters in place, when the limit for respondents from a particular region was reached, the filters ensured that no one else from that region would be considered valid in the subsequent computations to maximize data and limit cost. Upon successful completion (with all the variables registered), a message was sent to inform the participant that they had reached the end of the survey, and that TT$10 would be credited to they account. In the event a participant was ejected from the survey,their data were not used in the calculation of indices even though the data would have been valid for finding correlations outside of the Digital Divide Survey. To increase the response rate, all those that completed the survey were compensated with TT $10. Enumerators were included in the final stage of the survey to improve the deficits in certain regions. This was due to the low uptake in certain regions due to absence of real-time incentives which is native to mSurvey’s technology.7 Joincode™ is a trademark feature used by mSurvey. A participant uses a joincode to participate in a specific survey. Joincodes are analogous to survey links sent via email used online surveys to identify the survey.
48
Considerations for using mobile surveysThe preliminary results of a research study carried out by Fred Conrad and Michael Schober at the University of Michigan (2012) suggest that people are more likely to disclose sensitive information via text messages than in voice interviews. The study also found that people are less likely to give convenience and easy answers just to be good enough and finish the survey.
Using a mobile SMS-based technology has both advantages and ongoing methodology improvements. An advantage was the ease of access to anyone with a mobile phone. SMS is a standard form of communication across most mobile networks, making the technology accessible to work on any mobile phone regardless of brand, type, and the sophisticated nature of the mobile phone. A significant advantage of using a mobile SMS-driven platform for data collection and calculation of digital divide indices, is repeatability for monitoring results and trends after an initial assessment is developed. The same framework can be used with logic specified for different regions due to the elastic nature of the filters, which can be modified accordingly to suit other pre-determined survey conditions.
The ability to modify and specify logic for distinct regions allows for the easy, convenient and cost-effective deployment of follow-up surveys to evaluate the impact of measures put in place to attenuate the divide. Follow up surveys can be carried out at regular intervals after the Digital Divide Survey and can be designed to cover specific regions based on the indices or other relevant factors. TATT is now in direct contact with the individual whom they wish to shrink the digital divide. The access to that individual becomes more significant to tracking the technological utilization, access, improvements made in the individual’s life over time.
mSurvey also provided TATT with a real-time monitoring user interface, where the responses could be assessed at any time.
48 49
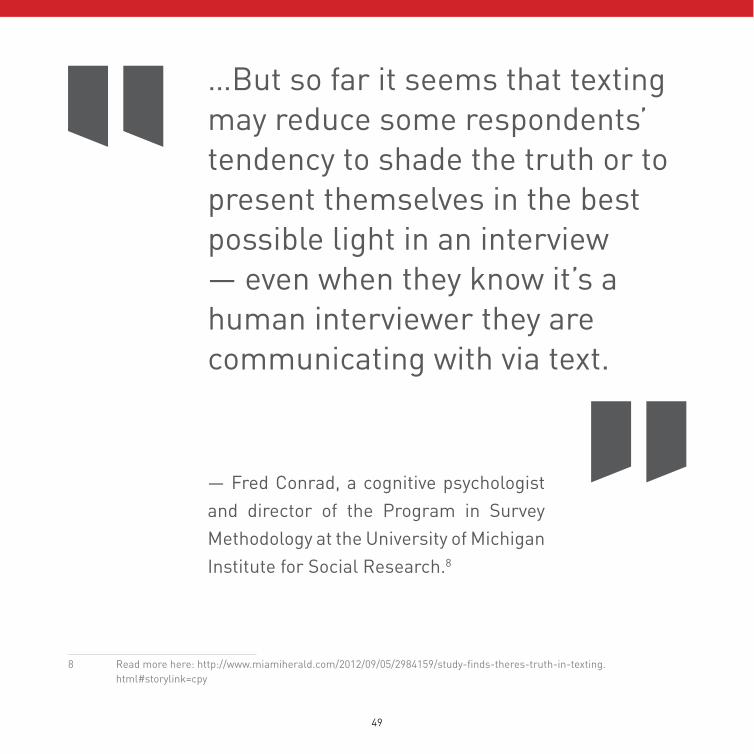
…But so far it seems that texting may reduce some respondents’ tendency to shade the truth or to present themselves in the best possible light in an interview — even when they know it’s a human interviewer they are communicating with via text.
— Fred Conrad, a cognitive psychologist and director of the Program in Survey Methodology at the University of Michigan Institute for Social Research.8
8 Read more here: http://www.miamiherald.com/2012/09/05/2984159/study-finds-theres-truth-in-texting. html#storylink=cpy
50
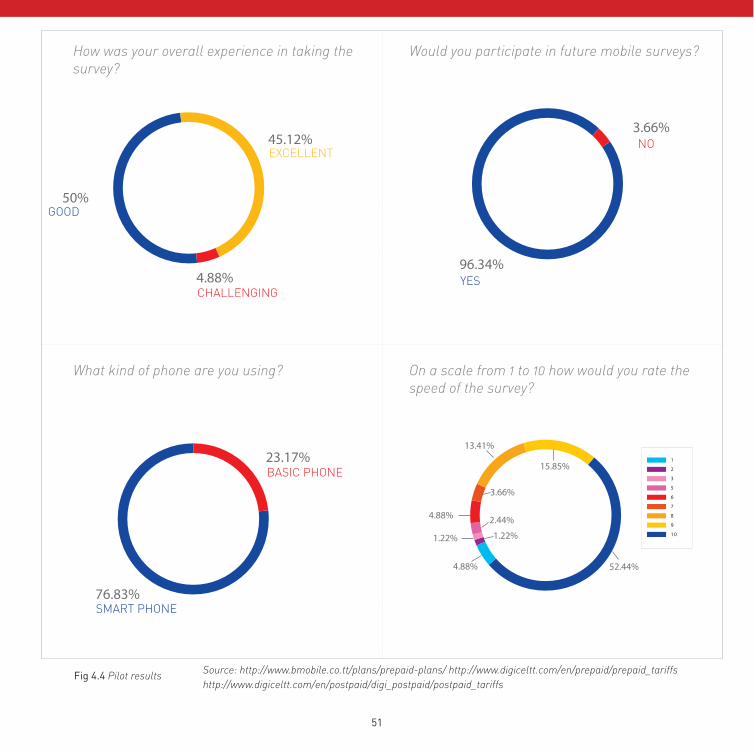
The Digital Divide Survey PilotA Digital Divide Survey pilot was carried out prior to the full nationwide survey to test and affirm the methodology in the cultural context of Trinidad and Tobago, the clarity of the questions, the ease of completing the survey, the clarity of the data to be analyzed in real-time, and the viral uptake of the mobile survey. Two (2) participants were initially informed to participate in the survey by texting the word ‘pilot’ to 4771 to participate in the survey. The 2 participants were also informed to tell friends and colleagues. From the initial 2 participants, in approximately two and a half hours, 82 participants completed the survey with all the required data. The pilot took place on Digicel’s network and accessible free of charge to Digicel’s customers. Prepaid customers received a TT $10 top-up reward at the end.
In addition to the general assessment of the survey features, the pilot survey sought to get feedback on the user experience from participants participating in the mobile survey. Most of the participants (over 90%) confirmed that the method was clear, fast and they liked the methodology. Over 90% of the participants indicated they would gladly participate in future surveys using the mobile SMS technology. Most participants expressed that their overall experience was either good or excellent. These findings, (the size of the sample not withstanding), provided sufficient assurance about the survey reception.
The pilot also gave mSurvey and TATT the necessary data to make small modifications to the survey, increasing the confidence going into the full survey launch.
50 51
Fig 4.4 Pilot results
How was your overall experience in taking the survey?
What kind of phone are you using?
Would you participate in future mobile surveys?
On a scale from 1 to 10 how would you rate the speed of the survey?
4.88%
45.12%
50%GOOD
SMART PHONE
YES
EXCELLENT
CHALLENGING
BASIC PHONE
NO3.66%
96.34%
23.17%
76.83%
1
2
3
5
6
7
8
9
10
4.88%
4.88%
3.66%
13.41%
15.85%
52.44%
1.22%1.22%
2.44%
Source: http://www.bmobile.co.tt/plans/prepaid-plans/ http://www.digiceltt.com/en/prepaid/prepaid_tariffshttp://www.digiceltt.com/en/postpaid/digi_postpaid/postpaid_tariffs
52
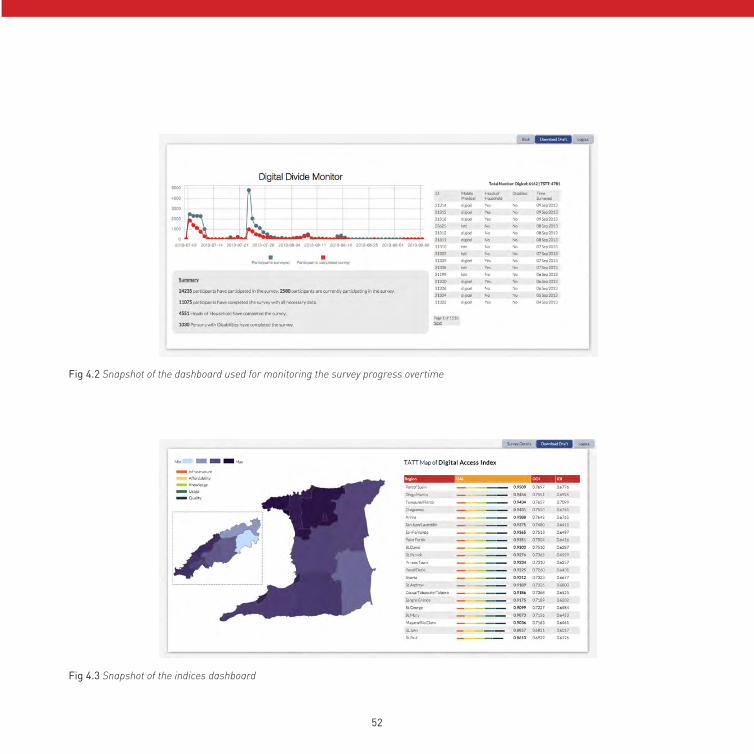
Fig 4.2 Snapshot of the dashboard used for monitoring the survey progress overtime
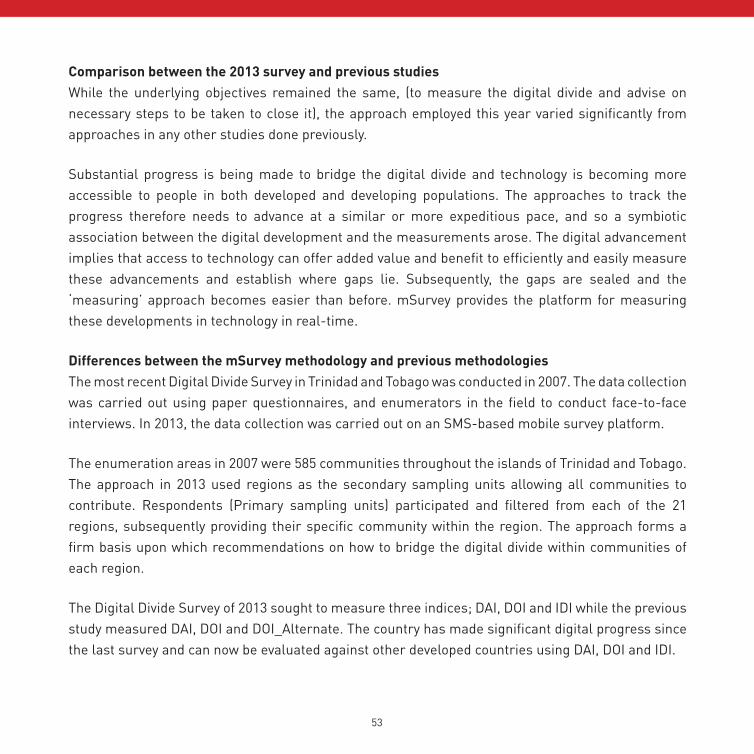
Fig 4.3 Snapshot of the indices dashboard
52 53
Comparison between the 2013 survey and previous studiesWhile the underlying objectives remained the same, (to measure the digital divide and advise on necessary steps to be taken to close it), the approach employed this year varied significantly from approaches in any other studies done previously.
Substantial progress is being made to bridge the digital divide and technology is becoming more accessible to people in both developed and developing populations. The approaches to track the progress therefore needs to advance at a similar or more expeditious pace, and so a symbiotic association between the digital development and the measurements arose. The digital advancement implies that access to technology can offer added value and benefit to efficiently and easily measure these advancements and establish where gaps lie. Subsequently, the gaps are sealed and the ‘measuring’ approach becomes easier than before. mSurvey provides the platform for measuring these developments in technology in real-time.
Differences between the mSurvey methodology and previous methodologiesThe most recent Digital Divide Survey in Trinidad and Tobago was conducted in 2007. The data collection was carried out using paper questionnaires, and enumerators in the field to conduct face-to-face interviews. In 2013, the data collection was carried out on an SMS-based mobile survey platform.
The enumeration areas in 2007 were 585 communities throughout the islands of Trinidad and Tobago. The approach in 2013 used regions as the secondary sampling units allowing all communities to contribute. Respondents (Primary sampling units) participated and filtered from each of the 21 regions, subsequently providing their specific community within the region. The approach forms a firm basis upon which recommendations on how to bridge the digital divide within communities of each region.
The Digital Divide Survey of 2013 sought to measure three indices; DAI, DOI and IDI while the previous study measured DAI, DOI and DOI_Alternate. The country has made significant digital progress since the last survey and can now be evaluated against other developed countries using DAI, DOI and IDI.
54
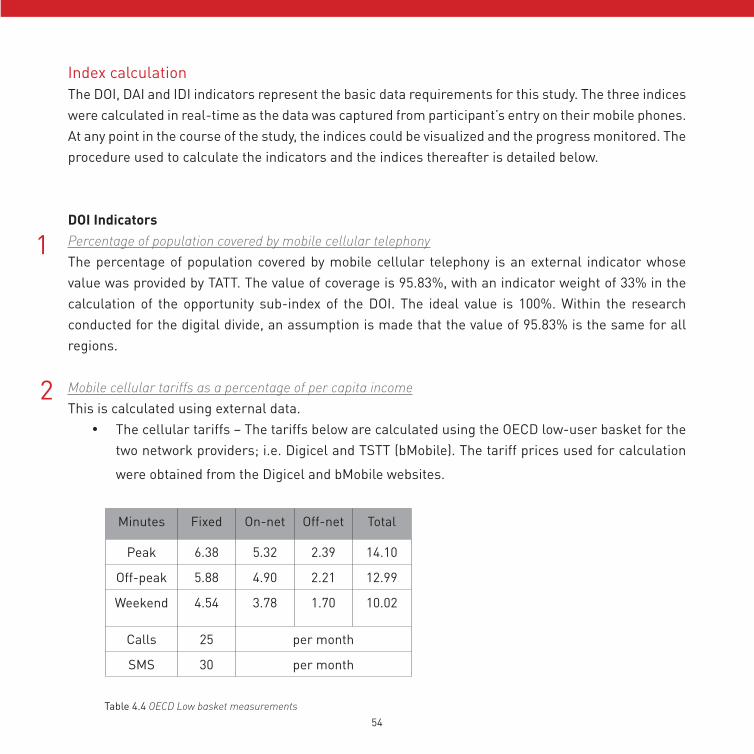
Index calculationThe DOI, DAI and IDI indicators represent the basic data requirements for this study. The three indices were calculated in real-time as the data was captured from participant’s entry on their mobile phones. At any point in the course of the study, the indices could be visualized and the progress monitored. The procedure used to calculate the indicators and the indices thereafter is detailed below.
DOI IndicatorsPercentage of population covered by mobile cellular telephonyThe percentage of population covered by mobile cellular telephony is an external indicator whose value was provided by TATT. The value of coverage is 95.83%, with an indicator weight of 33% in the calculation of the opportunity sub-index of the DOI. The ideal value is 100%. Within the research conducted for the digital divide, an assumption is made that the value of 95.83% is the same for all regions.
Mobile cellular tariffs as a percentage of per capita incomeThis is calculated using external data.
• The cellular tariffs – The tariffs below are calculated using the OECD low-user basket for the two network providers; i.e. Digicel and TSTT (bMobile). The tariff prices used for calculation
were obtained from the Digicel and bMobile websites.
Minutes Fixed On-net Off-net Total
Peak 6.38 5.32 2.39 14.10
Off-peak 5.88 4.90 2.21 12.99
Weekend 4.54 3.78 1.70 10.02
Calls 25 per month
SMS 30 per month
1
2
Table 4.4 OECD Low basket measurements
54 55
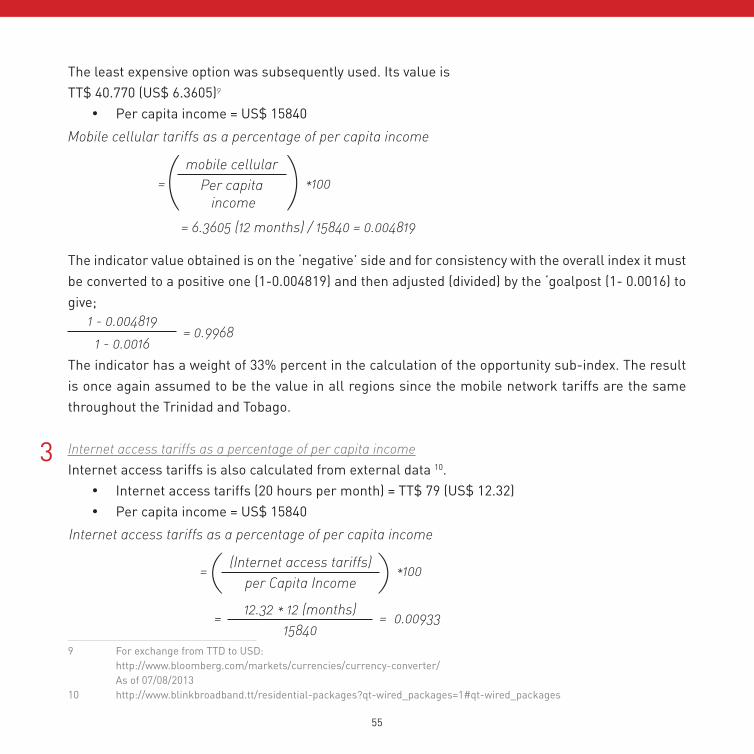
The least expensive option was subsequently used. Its value isTT$ 40.770 (US$ 6.3605)9
• Per capita income = US$ 15840
The indicator value obtained is on the ‘negative’ side and for consistency with the overall index it must be converted to a positive one (1-0.004819) and then adjusted (divided) by the ‘goalpost (1- 0.0016) to give;
The indicator has a weight of 33% percent in the calculation of the opportunity sub-index. The result is once again assumed to be the value in all regions since the mobile network tariffs are the same throughout the Trinidad and Tobago.
Internet access tariffs as a percentage of per capita incomeInternet access tariffs is also calculated from external data 10.
• Internet access tariffs (20 hours per month) = TT$ 79 (US$ 12.32)• Per capita income = US$ 15840
1 - 0.004819
1 - 0.0016= 0.9968
9 For exchange from TTD to USD: http://www.bloomberg.com/markets/currencies/currency-converter/ As of 07/08/201310 http://www.blinkbroadband.tt/residential-packages?qt-wired_packages=1#qt-wired_packages
3
*100=mobile cellular
Per capita income
Mobile cellular tariffs as a percentage of per capita income
= 6.3605 (12 months) / 15840 = 0.004819
per Capita Income
15840
*100
0.00933
=
= =
(Internet access tariffs)
12.32 * 12 (months)
Internet access tariffs as a percentage of per capita income
56
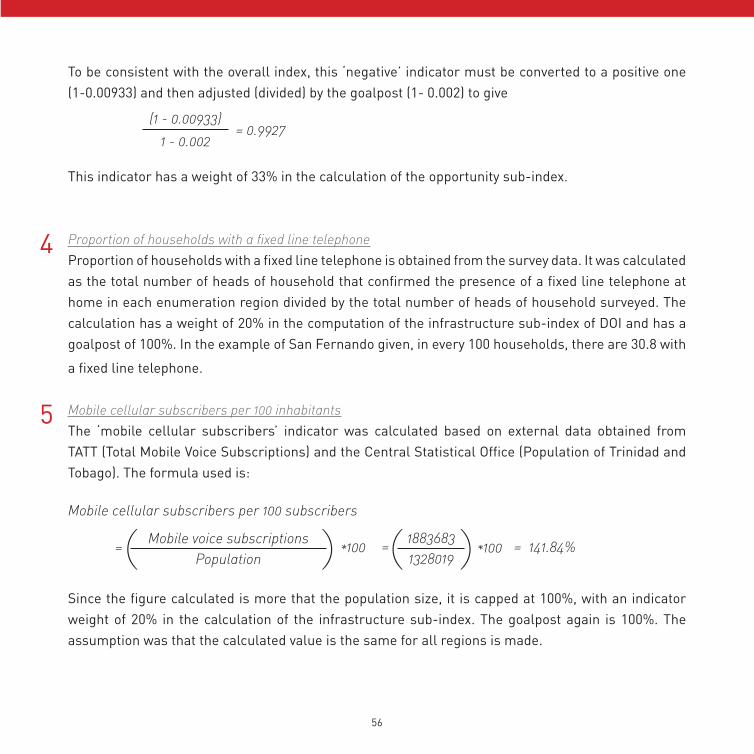
To be consistent with the overall index, this ‘negative’ indicator must be converted to a positive one (1-0.00933) and then adjusted (divided) by the goalpost (1- 0.002) to give
This indicator has a weight of 33% in the calculation of the opportunity sub-index.
Proportion of households with a fixed line telephoneProportion of households with a fixed line telephone is obtained from the survey data. It was calculated as the total number of heads of household that confirmed the presence of a fixed line telephone at home in each enumeration region divided by the total number of heads of household surveyed. The calculation has a weight of 20% in the computation of the infrastructure sub-index of DOI and has a goalpost of 100%. In the example of San Fernando given, in every 100 households, there are 30.8 with
a fixed line telephone.
Mobile cellular subscribers per 100 inhabitantsThe ‘mobile cellular subscribers’ indicator was calculated based on external data obtained from TATT (Total Mobile Voice Subscriptions) and the Central Statistical Office (Population of Trinidad and Tobago). The formula used is:
Since the figure calculated is more that the population size, it is capped at 100%, with an indicator weight of 20% in the calculation of the infrastructure sub-index. The goalpost again is 100%. The assumption was that the calculated value is the same for all regions is made.
(1 - 0.00933)
1 - 0.002= 0.9927
4
5
Population 1328019*100 *100 141.84%= = =Mobile voice subscriptions 1883683
Mobile cellular subscribers per 100 subscribers
56 57
Proportion of households with Internet access at homeThe proportion of households with Internet access at home was obtained from the survey data. The value is represented by the number of heads of household who confirmed the presence of Internet access at home in each region divided by the entire household sample size from the surveyed region. The same criterion is used to calculate for the entire country. The calculation also has a weight of 20% in the computation of the infrastructure sub-index of DOI and the set goalpost is 100%. In San Fernando, out of every 100 homes, 45.54 have Internet access.
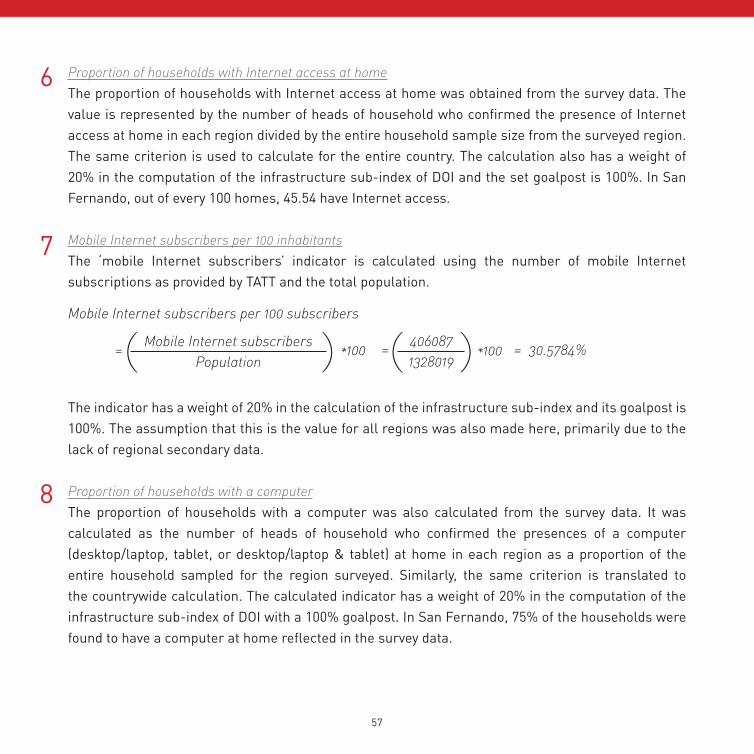
Mobile Internet subscribers per 100 inhabitantsThe ‘mobile Internet subscribers’ indicator is calculated using the number of mobile Internet subscriptions as provided by TATT and the total population.
The indicator has a weight of 20% in the calculation of the infrastructure sub-index and its goalpost is 100%. The assumption that this is the value for all regions was also made here, primarily due to the lack of regional secondary data.
Proportion of households with a computerThe proportion of households with a computer was also calculated from the survey data. It was calculated as the number of heads of household who confirmed the presences of a computer (desktop/laptop, tablet, or desktop/laptop & tablet) at home in each region as a proportion of the entire household sampled for the region surveyed. Similarly, the same criterion is translated to the countrywide calculation. The calculated indicator has a weight of 20% in the computation of the infrastructure sub-index of DOI with a 100% goalpost. In San Fernando, 75% of the households were found to have a computer at home reflected in the survey data.
6
7
8
Population 1328019*100 *100 30.5784%= = =Mobile Internet subscribers 406087
Mobile Internet subscribers per 100 subscribers
58
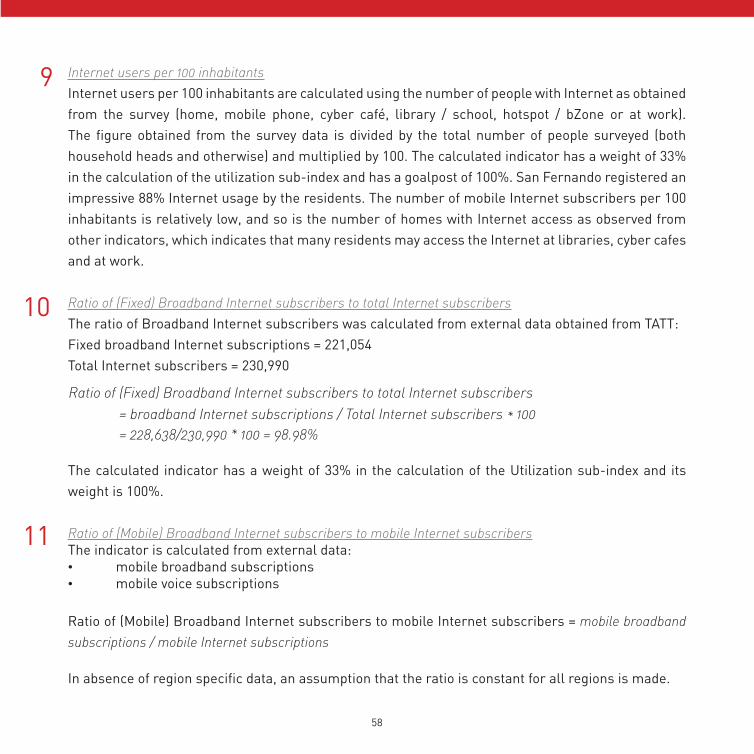
Internet users per 100 inhabitantsInternet users per 100 inhabitants are calculated using the number of people with Internet as obtained from the survey (home, mobile phone, cyber café, library / school, hotspot / bZone or at work). The figure obtained from the survey data is divided by the total number of people surveyed (both household heads and otherwise) and multiplied by 100. The calculated indicator has a weight of 33% in the calculation of the utilization sub-index and has a goalpost of 100%. San Fernando registered an impressive 88% Internet usage by the residents. The number of mobile Internet subscribers per 100 inhabitants is relatively low, and so is the number of homes with Internet access as observed from other indicators, which indicates that many residents may access the Internet at libraries, cyber cafes and at work.
Ratio of (Fixed) Broadband Internet subscribers to total Internet subscribersThe ratio of Broadband Internet subscribers was calculated from external data obtained from TATT:Fixed broadband Internet subscriptions = 221,054Total Internet subscribers = 230,990
The calculated indicator has a weight of 33% in the calculation of the Utilization sub-index and its weight is 100%.
Ratio of (Mobile) Broadband Internet subscribers to mobile Internet subscribersThe indicator is calculated from external data:• mobile broadband subscriptions• mobile voice subscriptions
Ratio of (Mobile) Broadband Internet subscribers to mobile Internet subscribers = mobile broadband subscriptions / mobile Internet subscriptions
In absence of region specific data, an assumption that the ratio is constant for all regions is made.
10
9
11
= broadband Internet subscriptions / Total Internet subscribers * 100= 228,638/230,990 * 100 = 98.98%
Ratio of (Fixed) Broadband Internet subscribers to total Internet subscribers
58 59
0.7194DOI for T&T, 2013
Infrastructure
0.5636824
Opportunity
0.9825887 U
tiliz
atio
n
0.63
3770
7
Port of Spain 0.757294463734 St. John 0.672936780085
60
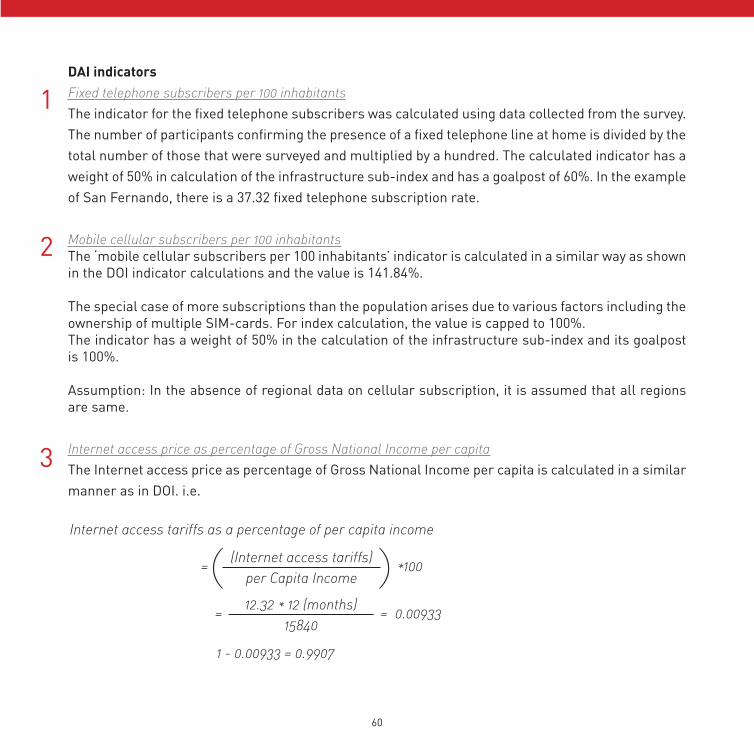
DAI indicatorsFixed telephone subscribers per 100 inhabitantsThe indicator for the fixed telephone subscribers was calculated using data collected from the survey. The number of participants confirming the presence of a fixed telephone line at home is divided by the total number of those that were surveyed and multiplied by a hundred. The calculated indicator has a weight of 50% in calculation of the infrastructure sub-index and has a goalpost of 60%. In the example of San Fernando, there is a 37.32 fixed telephone subscription rate.
Mobile cellular subscribers per 100 inhabitantsThe ‘mobile cellular subscribers per 100 inhabitants’ indicator is calculated in a similar way as shown in the DOI indicator calculations and the value is 141.84%.
The special case of more subscriptions than the population arises due to various factors including the ownership of multiple SIM-cards. For index calculation, the value is capped to 100%.The indicator has a weight of 50% in the calculation of the infrastructure sub-index and its goalpost is 100%.
Assumption: In the absence of regional data on cellular subscription, it is assumed that all regions are same.
Internet access price as percentage of Gross National Income per capitaThe Internet access price as percentage of Gross National Income per capita is calculated in a similar manner as in DOI. i.e.
per Capita Income
15840
*100
0.00933
1 - 0.00933 = 0.9907
=
= =
(Internet access tariffs)
12.32 * 12 (months)
Internet access tariffs as a percentage of per capita income
1
2
3
60 61
4
5
6
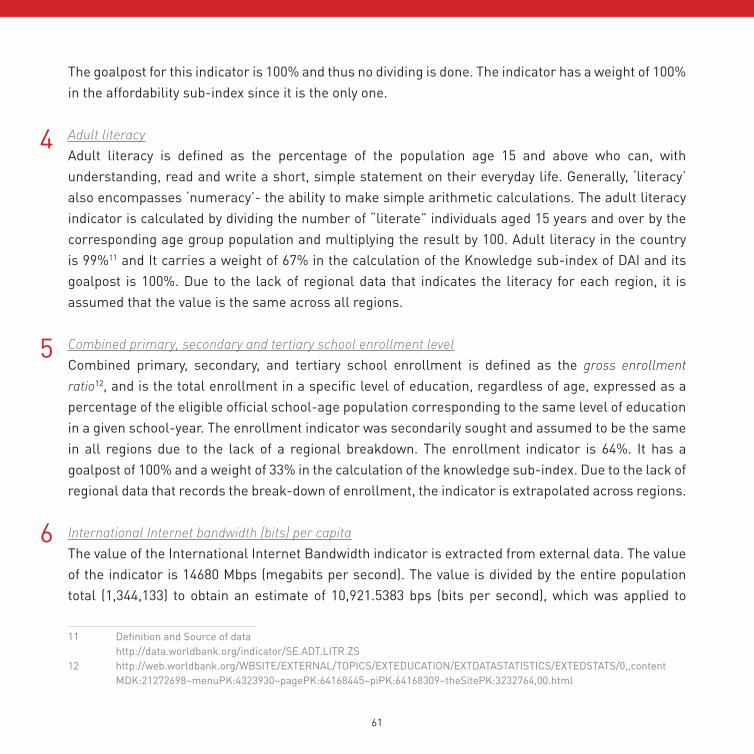
The goalpost for this indicator is 100% and thus no dividing is done. The indicator has a weight of 100% in the affordability sub-index since it is the only one.
Adult literacyAdult literacy is defined as the percentage of the population age 15 and above who can, with understanding, read and write a short, simple statement on their everyday life. Generally, ‘literacy’ also encompasses ‘numeracy’- the ability to make simple arithmetic calculations. The adult literacy indicator is calculated by dividing the number of “literate” individuals aged 15 years and over by the corresponding age group population and multiplying the result by 100. Adult literacy in the country is 99%11 and It carries a weight of 67% in the calculation of the Knowledge sub-index of DAI and its goalpost is 100%. Due to the lack of regional data that indicates the literacy for each region, it is assumed that the value is the same across all regions.
Combined primary, secondary and tertiary school enrollment levelCombined primary, secondary, and tertiary school enrollment is defined as the gross enrollment ratio12, and is the total enrollment in a specific level of education, regardless of age, expressed as a percentage of the eligible official school-age population corresponding to the same level of education in a given school-year. The enrollment indicator was secondarily sought and assumed to be the same in all regions due to the lack of a regional breakdown. The enrollment indicator is 64%. It has a goalpost of 100% and a weight of 33% in the calculation of the knowledge sub-index. Due to the lack of regional data that records the break-down of enrollment, the indicator is extrapolated across regions.
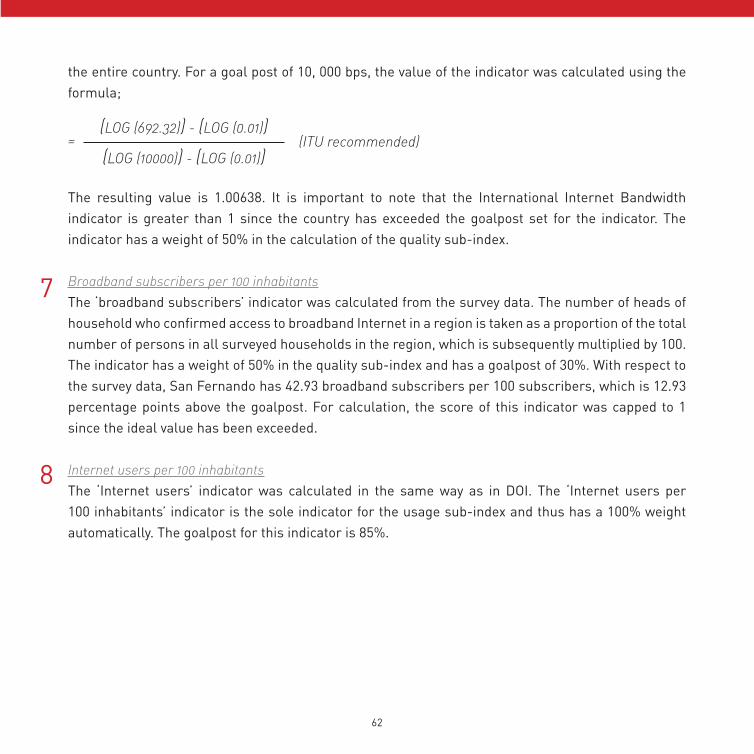
International Internet bandwidth (bits) per capitaThe value of the International Internet Bandwidth indicator is extracted from external data. The value of the indicator is 14680 Mbps (megabits per second). The value is divided by the entire population total (1,344,133) to obtain an estimate of 10,921.5383 bps (bits per second), which was applied to
11 Definition and Source of data http://data.worldbank.org/indicator/SE.ADT.LITR.ZS12 http://web.worldbank.org/WBSITE/EXTERNAL/TOPICS/EXTEDUCATION/EXTDATASTATISTICS/EXTEDSTATS/0,,content MDK:21272698~menuPK:4323930~pagePK:64168445~piPK:64168309~theSitePK:3232764,00.html
62
the entire country. For a goal post of 10, 000 bps, the value of the indicator was calculated using the formula;
The resulting value is 1.00638. It is important to note that the International Internet Bandwidth indicator is greater than 1 since the country has exceeded the goalpost set for the indicator. The indicator has a weight of 50% in the calculation of the quality sub-index.
Broadband subscribers per 100 inhabitantsThe ‘broadband subscribers’ indicator was calculated from the survey data. The number of heads of household who confirmed access to broadband Internet in a region is taken as a proportion of the total number of persons in all surveyed households in the region, which is subsequently multiplied by 100. The indicator has a weight of 50% in the quality sub-index and has a goalpost of 30%. With respect to the survey data, San Fernando has 42.93 broadband subscribers per 100 subscribers, which is 12.93 percentage points above the goalpost. For calculation, the score of this indicator was capped to 1 since the ideal value has been exceeded.
Internet users per 100 inhabitants The ‘Internet users’ indicator was calculated in the same way as in DOI. The ‘Internet users per 100 inhabitants’ indicator is the sole indicator for the usage sub-index and thus has a 100% weight automatically. The goalpost for this indicator is 85%.
7
8
(ITU recommended)=(LOG (692.32)) - (LOG (0.01))
(LOG (10000)) - (LOG (0.01))
62 63
0.9217DAI for T&T, 2013
Infrastructure
0.7935932
Knowledge
0.8843311
Affordability
0.9907
Port of Spain 0.95124798463
St. Paul 0.859973544861
Quality
0.9982363
Usa
ge
0.94
1944
0
64
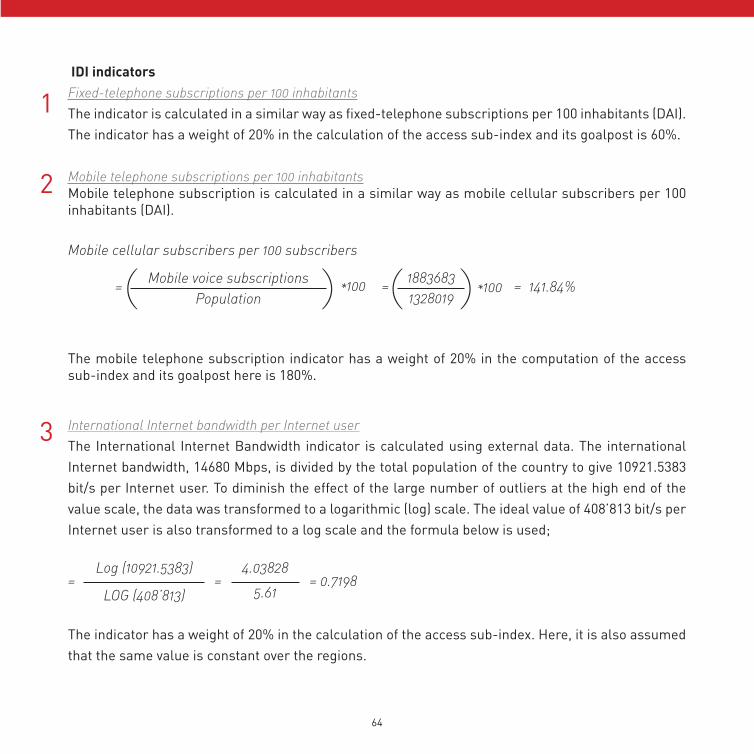
IDI indicatorsFixed-telephone subscriptions per 100 inhabitantsThe indicator is calculated in a similar way as fixed-telephone subscriptions per 100 inhabitants (DAI). The indicator has a weight of 20% in the calculation of the access sub-index and its goalpost is 60%.
Mobile telephone subscriptions per 100 inhabitantsMobile telephone subscription is calculated in a similar way as mobile cellular subscribers per 100 inhabitants (DAI).
The mobile telephone subscription indicator has a weight of 20% in the computation of the access sub-index and its goalpost here is 180%.
International Internet bandwidth per Internet userThe International Internet Bandwidth indicator is calculated using external data. The international Internet bandwidth, 14680 Mbps, is divided by the total population of the country to give 10921.5383 bit/s per Internet user. To diminish the effect of the large number of outliers at the high end of the value scale, the data was transformed to a logarithmic (log) scale. The ideal value of 408’813 bit/s per Internet user is also transformed to a log scale and the formula below is used;
The indicator has a weight of 20% in the calculation of the access sub-index. Here, it is also assumed that the same value is constant over the regions.
= = = 0.7198Log (10921.5383) 4.03828
LOG (408’813) 5.61
Population 1328019*100 *100 141.84%= = =Mobile voice subscriptions 1883683
Mobile cellular subscribers per 100 subscribers
1
2
3
64 65
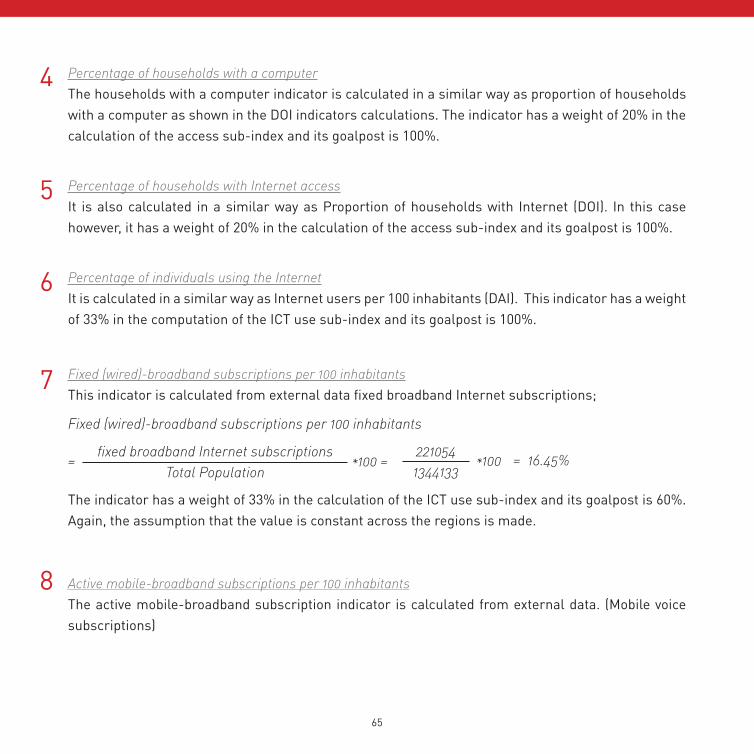
Percentage of households with a computerThe households with a computer indicator is calculated in a similar way as proportion of households with a computer as shown in the DOI indicators calculations. The indicator has a weight of 20% in the calculation of the access sub-index and its goalpost is 100%.
Percentage of households with Internet accessIt is also calculated in a similar way as Proportion of households with Internet (DOI). In this case however, it has a weight of 20% in the calculation of the access sub-index and its goalpost is 100%.
Percentage of individuals using the InternetIt is calculated in a similar way as Internet users per 100 inhabitants (DAI). This indicator has a weight of 33% in the computation of the ICT use sub-index and its goalpost is 100%.
Fixed (wired)-broadband subscriptions per 100 inhabitantsThis indicator is calculated from external data fixed broadband Internet subscriptions;
The indicator has a weight of 33% in the calculation of the ICT use sub-index and its goalpost is 60%. Again, the assumption that the value is constant across the regions is made.
Active mobile-broadband subscriptions per 100 inhabitantsThe active mobile-broadband subscription indicator is calculated from external data. (Mobile voice subscriptions)
*100 =Total Population 1344133 *100 16.45%= =fixed broadband Internet subscriptions 221054
Fixed (wired)-broadband subscriptions per 100 inhabitants
5
4
6
7
8
66
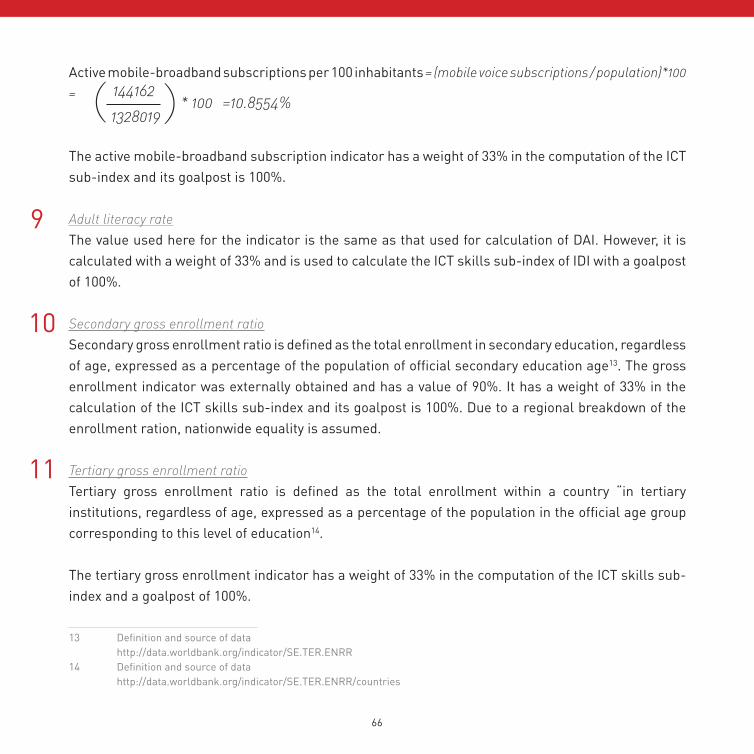
Active mobile-broadband subscriptions per 100 inhabitants = (mobile voice subscriptions / population)*100 =
The active mobile-broadband subscription indicator has a weight of 33% in the computation of the ICT sub-index and its goalpost is 100%.
Adult literacy rateThe value used here for the indicator is the same as that used for calculation of DAI. However, it is calculated with a weight of 33% and is used to calculate the ICT skills sub-index of IDI with a goalpost of 100%.
Secondary gross enrollment ratioSecondary gross enrollment ratio is defined as the total enrollment in secondary education, regardless of age, expressed as a percentage of the population of official secondary education age13. The gross enrollment indicator was externally obtained and has a value of 90%. It has a weight of 33% in the calculation of the ICT skills sub-index and its goalpost is 100%. Due to a regional breakdown of the enrollment ration, nationwide equality is assumed.
Tertiary gross enrollment ratioTertiary gross enrollment ratio is defined as the total enrollment within a country “in tertiary institutions, regardless of age, expressed as a percentage of the population in the official age group corresponding to this level of education14.
The tertiary gross enrollment indicator has a weight of 33% in the computation of the ICT skills sub-index and a goalpost of 100%.
13 Definition and source of data http://data.worldbank.org/indicator/SE.TER.ENRR14 Definition and source of data http://data.worldbank.org/indicator/SE.TER.ENRR/countries
10
11
9
144162* 100 =10.8554%
1328019
66 67
Adult literacy is defined as the percentage of the population age 15 and above who can, with understanding, read and write a short, simple statement on their everyday life.
68
5.5582IDI for T&T, 2013
ICT Access
0.6556138
ICT Skills
0.6683933
ICT Use
0.3997511
Port of Spain
6.03641029742 St. Paul
4.93553271685
68 69
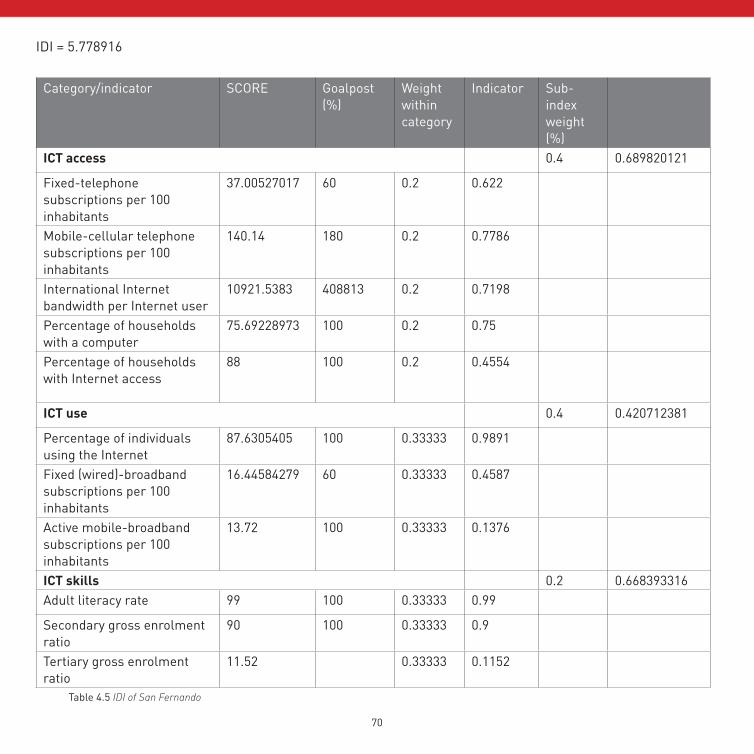
San Fernando: applying data to the indices
As an example of calculating the indices, the region of San Fernando was used to document the values the indicators dictated by the data collected in that region of Trinidad and Tobago. Subsequently, the region of San Fernando was also used as a specific case study for the differently-abled survey.
According to the 2011 Population and Housing Census Demographic Report, San Fernando has an area of 18.64 Square kilometers, with a population of 48,838 and a population density of 2570. There are 15,110 occupied private households in this municipality and the median age is 34.8 years15.
The sampling design in the mobile survey allocated a sample of 552 respondents from the San Fernando region. The response rate for the region was relatively high and was among the first regions to attain the required sample size.
According to the census report, San Fernando has a complete representation of all ethnic groups i.e. Africans, Caucasians, Chinese, East Indians, Indigenous, Mixed - African/ East, Indians, Mixed (Others), Portuguese, and Syrian/ Lebanese. All religions are also well represented.
15 http://www.cso.gov.tt/census
70
IDI = 5.778916
Category/indicator SCORE Goalpost (%)
Weight within category
Indicator Sub-index weight (%)
ICT access 0.4 0.689820121
Fixed-telephone subscriptions per 100 inhabitants
37.00527017 60 0.2 0.622
Mobile-cellular telephone subscriptions per 100 inhabitants
140.14 180 0.2 0.7786
International Internet bandwidth per Internet user
10921.5383 408813 0.2 0.7198
Percentage of households with a computer
75.69228973 100 0.2 0.75
Percentage of households with Internet access
88 100 0.2 0.4554
ICT use 0.4 0.420712381
Percentage of individuals using the Internet
87.6305405 100 0.33333 0.9891
Fixed (wired)-broadband subscriptions per 100 inhabitants
16.44584279 60 0.33333 0.4587
Active mobile-broadband subscriptions per 100 inhabitants
13.72 100 0.33333 0.1376
ICT skills 0.2 0.668393316Adult literacy rate 99 100 0.33333 0.99
Secondary gross enrolment ratio
90 100 0.33333 0.9
Tertiary gross enrolment ratio
11.52 0.33333 0.1152
Table 4.5 IDI of San Fernando
70 71
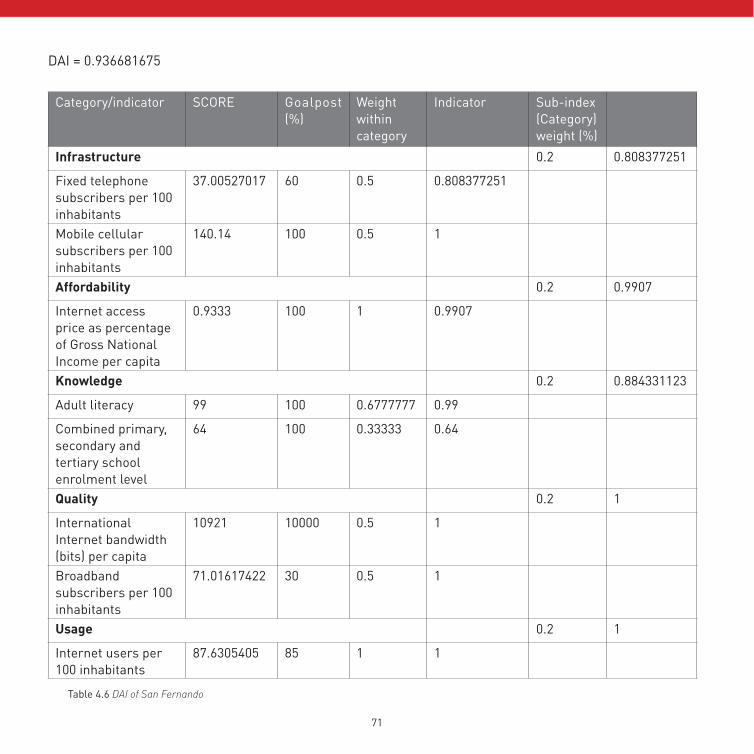
DAI = 0.936681675
Category/indicator SCORE Goalpost (%)
Weight within category
Indicator Sub-index (Category) weight (%)
Infrastructure 0.2 0.808377251
Fixed telephone subscribers per 100 inhabitants
37.00527017 60 0.5 0.808377251
Mobile cellular subscribers per 100 inhabitants
140.14 100 0.5 1
Affordability 0.2 0.9907
Internet access price as percentage of Gross National Income per capita
0.9333 100 1 0.9907
Knowledge 0.2 0.884331123
Adult literacy 99 100 0.6777777 0.99
Combined primary, secondary and tertiary school enrolment level
64 100 0.33333 0.64
Quality 0.2 1
International Internet bandwidth (bits) per capita
10921 10000 0.5 1
Broadband subscribers per 100 inhabitants
71.01617422 30 0.5 1
Usage 0.2 1
Internet users per 100 inhabitants
87.6305405 85 1 1
Table 4.6 DAI of San Fernando
72
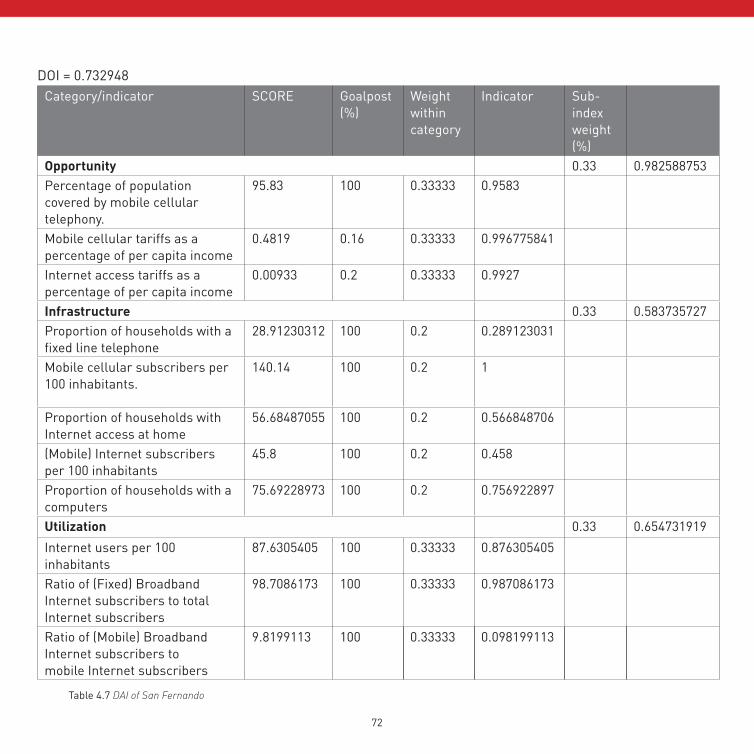
DOI = 0.732948Category/indicator SCORE Goalpost
(%)Weight within category
Indicator Sub-index weight (%)
Opportunity 0.33 0.982588753Percentage of population covered by mobile cellular telephony.
95.83 100 0.33333 0.9583
Mobile cellular tariffs as a percentage of per capita income
0.4819 0.16 0.33333 0.996775841
Internet access tariffs as a percentage of per capita income
0.00933 0.2 0.33333 0.9927
Infrastructure 0.33 0.583735727Proportion of households with a fixed line telephone
28.91230312 100 0.2 0.289123031
Mobile cellular subscribers per 100 inhabitants.
140.14 100 0.2 1
Proportion of households with Internet access at home
56.68487055 100 0.2 0.566848706
(Mobile) Internet subscribers per 100 inhabitants
45.8 100 0.2 0.458
Proportion of households with a computers
75.69228973 100 0.2 0.756922897
Utilization 0.33 0.654731919Internet users per 100 inhabitants
87.6305405 100 0.33333 0.876305405
Ratio of (Fixed) Broadband Internet subscribers to total Internet subscribers
98.7086173 100 0.33333 0.987086173
Ratio of (Mobile) Broadband Internet subscribers tomobile Internet subscribers
9.8199113 100 0.33333 0.098199113
Table 4.7 DAI of San Fernando
72 73
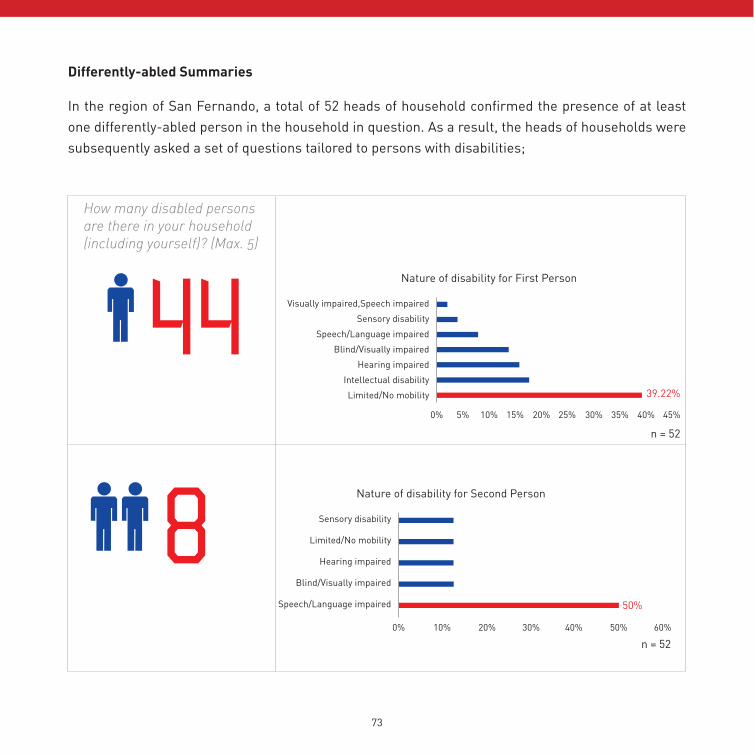
How many disabled persons are there in your household (including yourself)? (Max. 5)
8
44
Differently-abled Summaries
In the region of San Fernando, a total of 52 heads of household confirmed the presence of at least one differently-abled person in the household in question. As a result, the heads of households were subsequently asked a set of questions tailored to persons with disabilities;
Nature of disability for First Person
Visually impaired,Speech impaired
Sensory disability
Speech/Language impaired
Blind/Visually impaired
Hearing impaired
Intellectual disability
Limited/No mobility
0% 5% 10% 15% 20% 25% 30% 35% 40% 45%
n = 52
Nature of disability for Second Person
Sensory disability
Limited/No mobility
Hearing impaired
Blind/Visually impaired
Speech/Language impaired
0% 10% 20% 30% 40% 50% 60%
n = 52
50%
39.22%
74
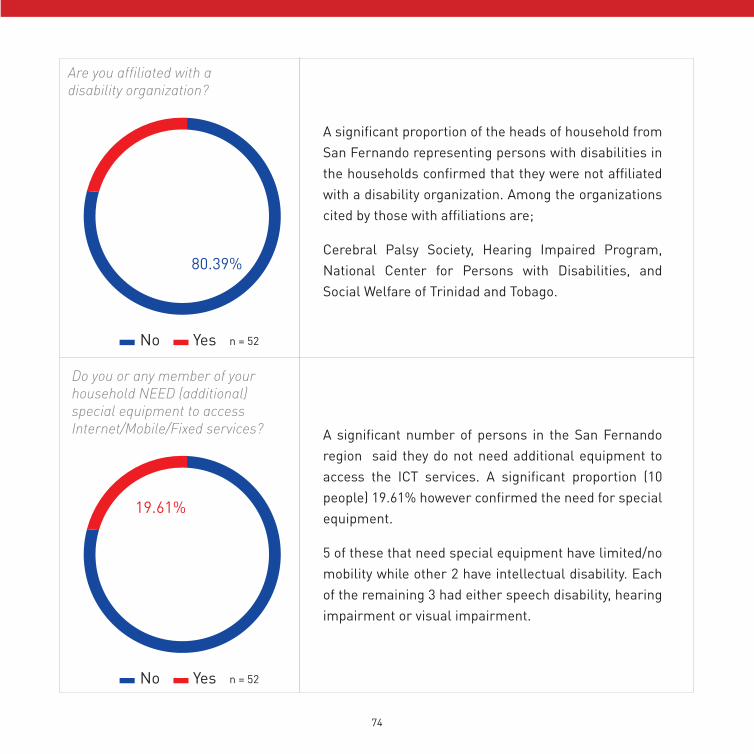
Are you affiliated with a disability organization?
Do you or any member of your household NEED (additional) special equipment to access Internet/Mobile/Fixed services?
A significant proportion of the heads of household from San Fernando representing persons with disabilities in the households confirmed that they were not affiliated with a disability organization. Among the organizations cited by those with affiliations are;
Cerebral Palsy Society, Hearing Impaired Program, National Center for Persons with Disabilities, and Social Welfare of Trinidad and Tobago.
A significant number of persons in the San Fernando region said they do not need additional equipment to access the ICT services. A significant proportion (10 people) 19.61% however confirmed the need for special equipment.
5 of these that need special equipment have limited/no mobility while other 2 have intellectual disability. Each of the remaining 3 had either speech disability, hearing impairment or visual impairment.
No
No
Yes
Yes
n = 52
n = 52
80.39%
19.61%
74 75
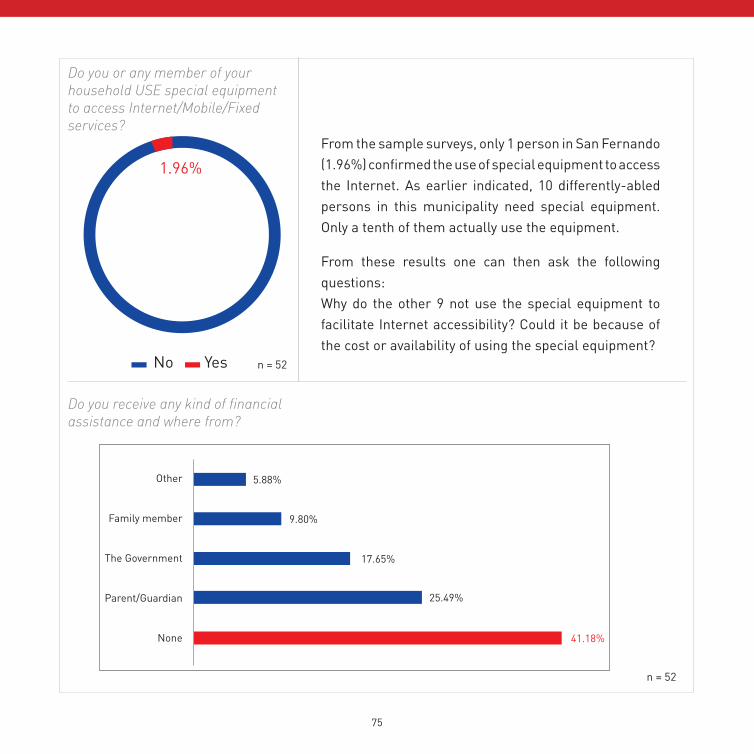
Do you or any member of your household USE special equipment to access Internet/Mobile/Fixed services?
Do you receive any kind of financial assistance and where from?
From the sample surveys, only 1 person in San Fernando (1.96%) confirmed the use of special equipment to access the Internet. As earlier indicated, 10 differently-abled persons in this municipality need special equipment. Only a tenth of them actually use the equipment.
From these results one can then ask the following questions:Why do the other 9 not use the special equipment to facilitate Internet accessibility? Could it be because of the cost or availability of using the special equipment?
n = 52
No Yes n = 52
1.96%
Other
Family member
The Government
Parent/Guardian
None
5.88%
9.80%
25.49%
17.65%
41.18%
76
76 77
Analysis
05
78
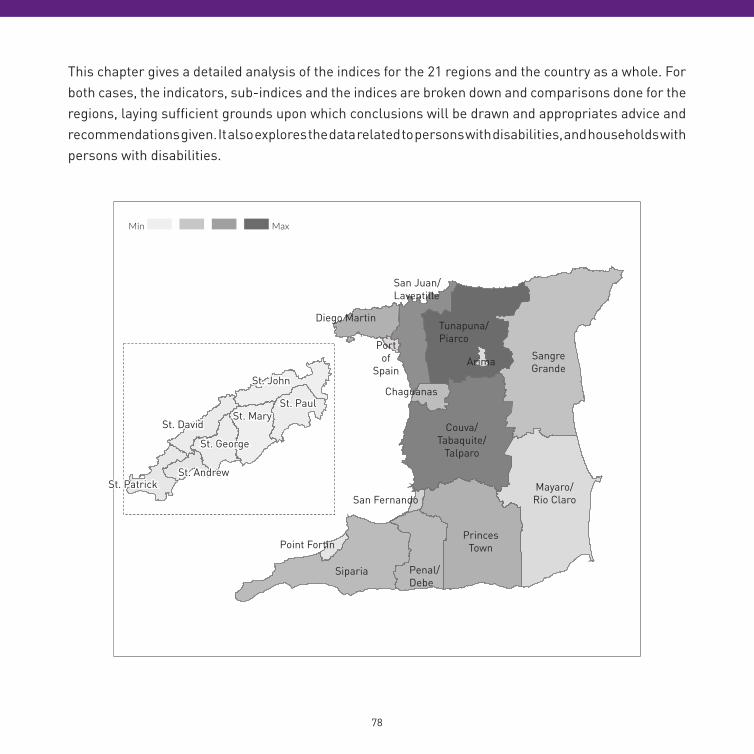
This chapter gives a detailed analysis of the indices for the 21 regions and the country as a whole. For both cases, the indicators, sub-indices and the indices are broken down and comparisons done for the regions, laying sufficient grounds upon which conclusions will be drawn and appropriates advice and recommendations given. It also explores the data related to persons with disabilities, and households with persons with disabilities.
11/25/13 TATT
msurvey.co.ke/tatt/ 1/1
Survey Details Download Draft Logout
TATT Map of PopulationMin Max
DAI DOI IDI
Arima 0.9438 0.7477 5.938
Chaguanas 0.9465 0.7380 5.812
Couva/Tabaquite/Talparo 0.9189 0.7204 5.526
Diego Martin 0.9466 0.7385 5.814
Mayaro/Rio Claro 0.9091 0.7053 5.354
Penal/Debe 0.9229 0.7094 5.479
Point Fortin 0.9313 0.7308 5.603
Port of Spain 0.9512 0.7571 6.019
Princes Town 0.9226 0.7141 5.492
San Fernando 0.9367 0.7327 5.761
San Juan/Laventille 0.9385 0.7361 5.771
Sangre Grande 0.9188 0.7044 5.384
Siparia 0.9231 0.7194 5.518
St. Andrew 0.9140 0.7143 5.394
St. David 0.9160 0.7258 5.526
St. George 0.9102 0.7015 5.309
St. John 0.8920 0.6727 4.967
St. Mary 0.8884 0.6998 5.295
St. Patrick 0.9225 0.7127 5.543
St. Paul 0.8600 0.6751 4.918
Tunapuna/Piarco 0.9438 0.7468 5.928
Region
San Juan/Laventille
Arima
Tunapuna/PiarcoPort
of Spain
Diego Martin
Chaguanas
Couva/Tabaquite/
Talparo
San Fernando
Point Fortin
Siparia Penal/Debe
Princes Town
Mayaro/Rio Claro
Sangre Grande
St. PatrickSt. Andrew
St. David
St. John
St. PaulSt. Mary
St. George
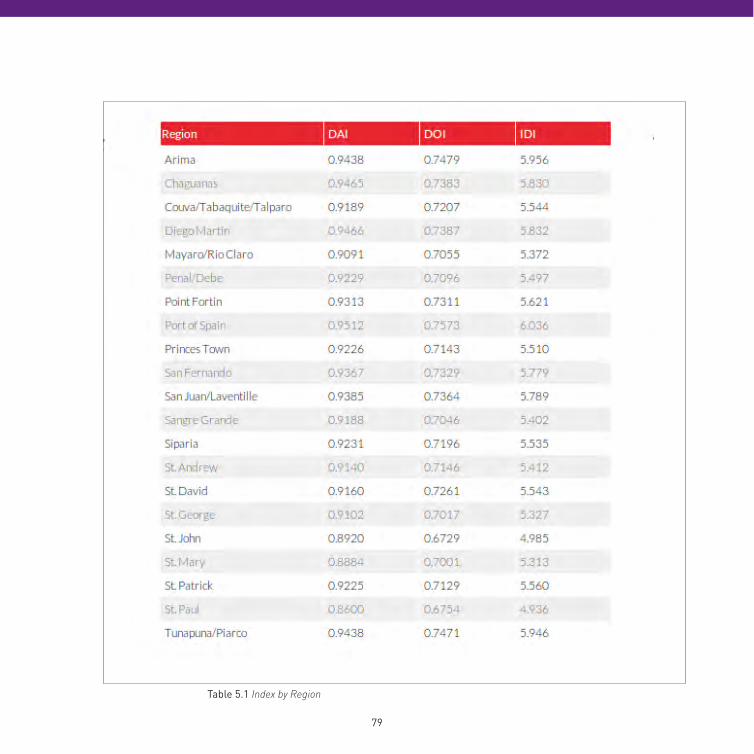
78 79
Table 5.1 Index by Region
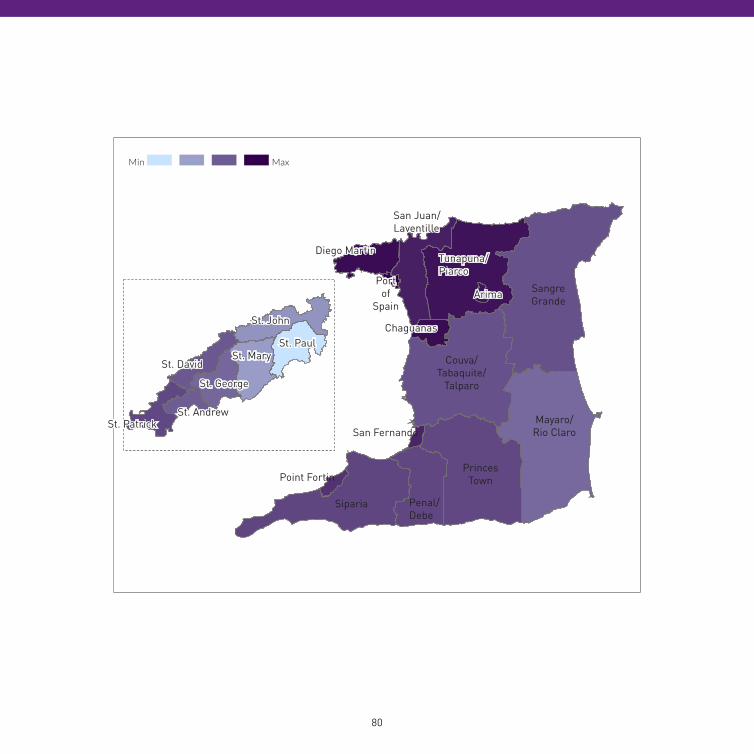
80
11/25/13 TATT
msurvey.co.ke/tatt/ 1/1
Survey Details Download Draft Logout
TATT Map of Digital Access IndexMin Max
Infrastructure
Affordability
Knowledge
Usage
Quality
DAI DOI IDI
Port of Spain 0.9512 0.7571 6.019
Diego Martin 0.9466 0.7385 5.814
Chaguanas 0.9465 0.7380 5.812
Tunapuna/Piarco 0.9438 0.7468 5.928
Arima 0.9438 0.7477 5.938
San Juan/Laventille 0.9385 0.7361 5.771
San Fernando 0.9367 0.7327 5.761
Point Fortin 0.9313 0.7308 5.603
Siparia 0.9231 0.7194 5.518
Penal/Debe 0.9229 0.7094 5.479
Princes Town 0.9226 0.7141 5.492
St. Patrick 0.9225 0.7127 5.543
Couva/Tabaquite/Talparo 0.9189 0.7204 5.526
Sangre Grande 0.9188 0.7044 5.384
St. David 0.9160 0.7258 5.526
St. Andrew 0.9140 0.7143 5.394
St. George 0.9102 0.7015 5.309
Mayaro/Rio Claro 0.9091 0.7053 5.354
St. John 0.8920 0.6727 4.967
St. Mary 0.8884 0.6998 5.295
St. Paul 0.8600 0.6751 4.918
Region
San Juan/Laventille
Arima
Tunapuna/Piarco
Port of
Spain
Diego Martin
Chaguanas
Couva/Tabaquite/
Talparo
San Fernando
Point Fortin
Siparia Penal/Debe
Princes Town
Mayaro/Rio Claro
Sangre Grande
St. PatrickSt. Andrew
St. David
St. John
St. PaulSt. Mary
St. George
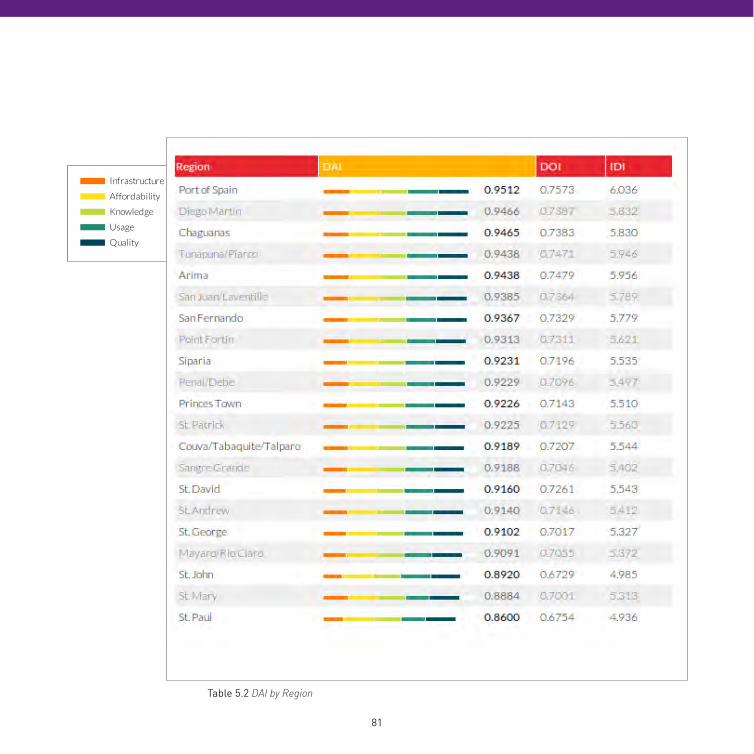
80 81
11/25/13 TATT
msurvey.co.ke/tatt/ 1/1
Survey Details Download Draft Logout
TATT Map of Digital Access IndexMin Max
Infrastructure
Affordability
Knowledge
Usage
Quality
DAI DOI IDI
Port of Spain 0.9512 0.7571 6.019
Diego Martin 0.9466 0.7385 5.814
Chaguanas 0.9465 0.7380 5.812
Tunapuna/Piarco 0.9438 0.7468 5.928
Arima 0.9438 0.7477 5.938
San Juan/Laventille 0.9385 0.7361 5.771
San Fernando 0.9367 0.7327 5.761
Point Fortin 0.9313 0.7308 5.603
Siparia 0.9231 0.7194 5.518
Penal/Debe 0.9229 0.7094 5.479
Princes Town 0.9226 0.7141 5.492
St. Patrick 0.9225 0.7127 5.543
Couva/Tabaquite/Talparo 0.9189 0.7204 5.526
Sangre Grande 0.9188 0.7044 5.384
St. David 0.9160 0.7258 5.526
St. Andrew 0.9140 0.7143 5.394
St. George 0.9102 0.7015 5.309
Mayaro/Rio Claro 0.9091 0.7053 5.354
St. John 0.8920 0.6727 4.967
St. Mary 0.8884 0.6998 5.295
St. Paul 0.8600 0.6751 4.918
Region
Table 5.2 DAI by Region
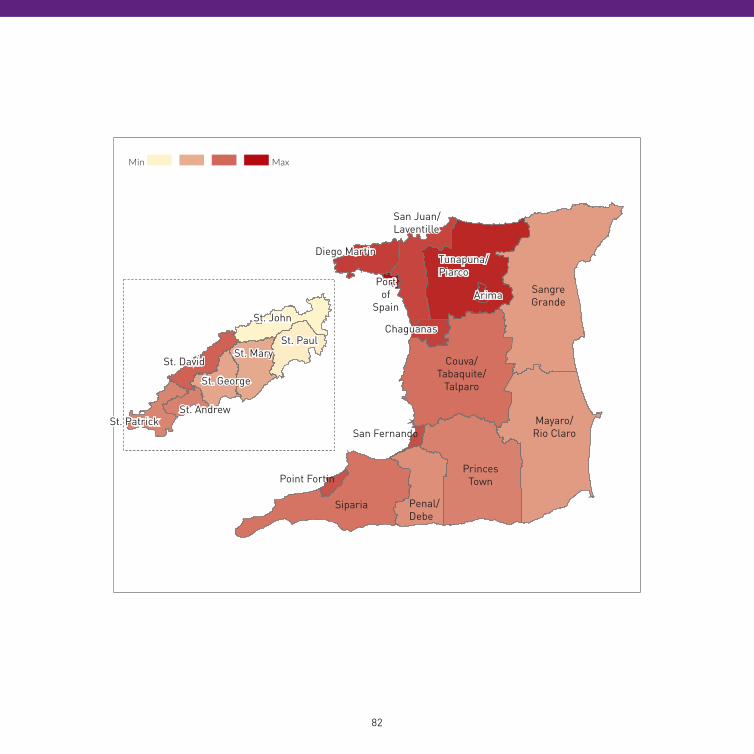
82
11/25/13 TATT
msurvey.co.ke/tatt/ 1/1
Survey Details Download Draft Logout
TATT Map of Digital Opportunity IndexMin Max
Opportunity
Infrastructure
Utilization
DAI DOI IDI
Port of Spain 0.9512 0.7571 6.019
Arima 0.9438 0.7477 5.938
Tunapuna/Piarco 0.9438 0.7468 5.928
Diego Martin 0.9466 0.7385 5.814
Chaguanas 0.9465 0.7380 5.812
San Juan/Laventille 0.9385 0.7361 5.771
San Fernando 0.9367 0.7327 5.761
Point Fortin 0.9313 0.7308 5.603
St. David 0.9160 0.7258 5.526
Couva/Tabaquite/Talparo 0.9189 0.7204 5.526
Siparia 0.9231 0.7194 5.518
St. Andrew 0.9140 0.7143 5.394
Princes Town 0.9226 0.7141 5.492
St. Patrick 0.9225 0.7127 5.543
Penal/Debe 0.9229 0.7094 5.479
Mayaro/Rio Claro 0.9091 0.7053 5.354
Sangre Grande 0.9188 0.7044 5.384
St. George 0.9102 0.7015 5.309
St. Mary 0.8884 0.6998 5.295
St. Paul 0.8600 0.6751 4.918
St. John 0.8920 0.6727 4.967
Region
San Juan/Laventille
Arima
Tunapuna/Piarco
Port of
Spain
Diego Martin
Chaguanas
Couva/Tabaquite/
Talparo
San FernandoSt. Patrick
St. Andrew
St. David
St. John
St. PaulSt. Mary
St. George
Siparia Penal/Debe
Princes Town
Mayaro/Rio Claro
Sangre Grande
Point Fortin
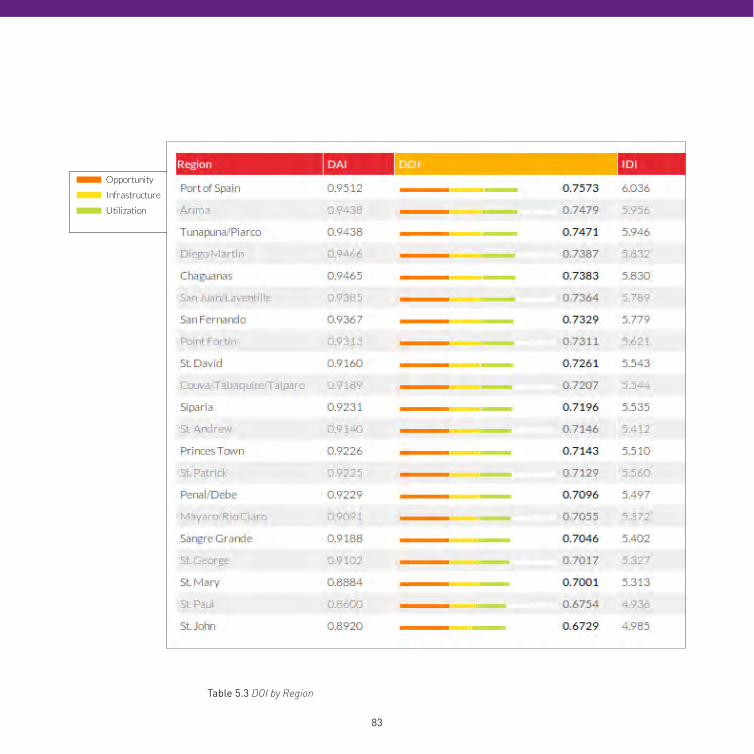
82 83
11/25/13 TATT
msurvey.co.ke/tatt/ 1/1
Survey Details Download Draft Logout
TATT Map of Digital Opportunity IndexMin Max
Opportunity
Infrastructure
Utilization
DAI DOI IDI
Port of Spain 0.9512 0.7571 6.019
Arima 0.9438 0.7477 5.938
Tunapuna/Piarco 0.9438 0.7468 5.928
Diego Martin 0.9466 0.7385 5.814
Chaguanas 0.9465 0.7380 5.812
San Juan/Laventille 0.9385 0.7361 5.771
San Fernando 0.9367 0.7327 5.761
Point Fortin 0.9313 0.7308 5.603
St. David 0.9160 0.7258 5.526
Couva/Tabaquite/Talparo 0.9189 0.7204 5.526
Siparia 0.9231 0.7194 5.518
St. Andrew 0.9140 0.7143 5.394
Princes Town 0.9226 0.7141 5.492
St. Patrick 0.9225 0.7127 5.543
Penal/Debe 0.9229 0.7094 5.479
Mayaro/Rio Claro 0.9091 0.7053 5.354
Sangre Grande 0.9188 0.7044 5.384
St. George 0.9102 0.7015 5.309
St. Mary 0.8884 0.6998 5.295
St. Paul 0.8600 0.6751 4.918
St. John 0.8920 0.6727 4.967
Region
Table 5.3 DOI by Region
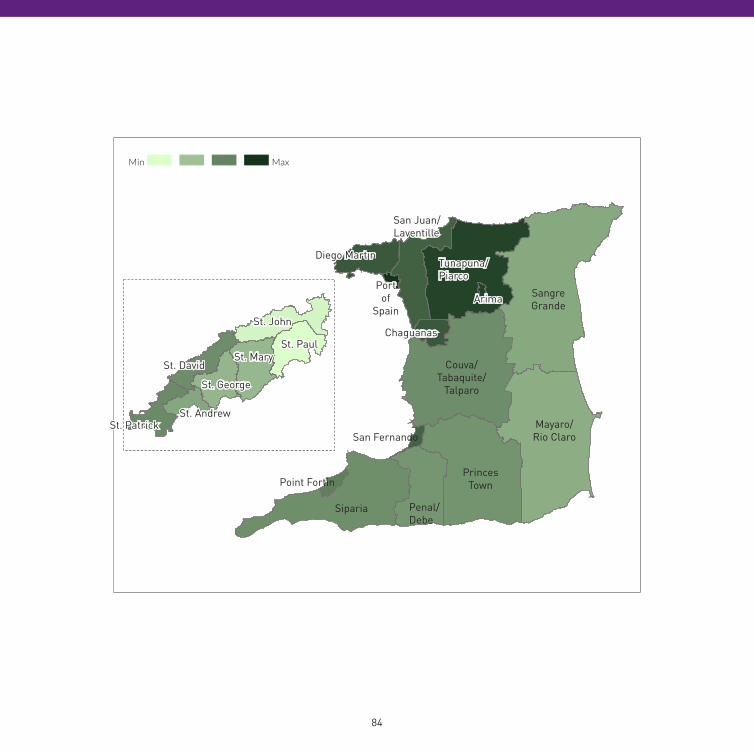
84
11/25/13 TATT
msurvey.co.ke/tatt/ 1/1
Survey Details Download Draft Logout
TATT Map of ICT Development IndexMin Max
IctUse
IctAccess
IctSkills
DAI DOI IDI
Port of Spain 0.9512 0.7571 6.019
Arima 0.9438 0.7477 5.938
Tunapuna/Piarco 0.9438 0.7468 5.928
Diego Martin 0.9466 0.7385 5.814
Chaguanas 0.9465 0.7380 5.812
San Juan/Laventille 0.9385 0.7361 5.771
San Fernando 0.9367 0.7327 5.761
Point Fortin 0.9313 0.7308 5.603
St. Patrick 0.9225 0.7127 5.543
Couva/Tabaquite/Talparo 0.9189 0.7204 5.526
St. David 0.9160 0.7258 5.526
Siparia 0.9231 0.7194 5.518
Princes Town 0.9226 0.7141 5.492
Penal/Debe 0.9229 0.7094 5.479
St. Andrew 0.9140 0.7143 5.394
Sangre Grande 0.9188 0.7044 5.384
Mayaro/Rio Claro 0.9091 0.7053 5.354
St. George 0.9102 0.7015 5.309
St. Mary 0.8884 0.6998 5.295
St. John 0.8920 0.6727 4.967
St. Paul 0.8600 0.6751 4.918
Region
San Juan/Laventille
Arima
Tunapuna/Piarco
Port of
Spain
Diego Martin
Chaguanas
Couva/Tabaquite/
Talparo
San FernandoSt. Patrick
St. Andrew
St. David
St. John
St. PaulSt. Mary
St. George
Siparia Penal/Debe
Princes Town
Mayaro/Rio Claro
Sangre Grande
Point Fortin
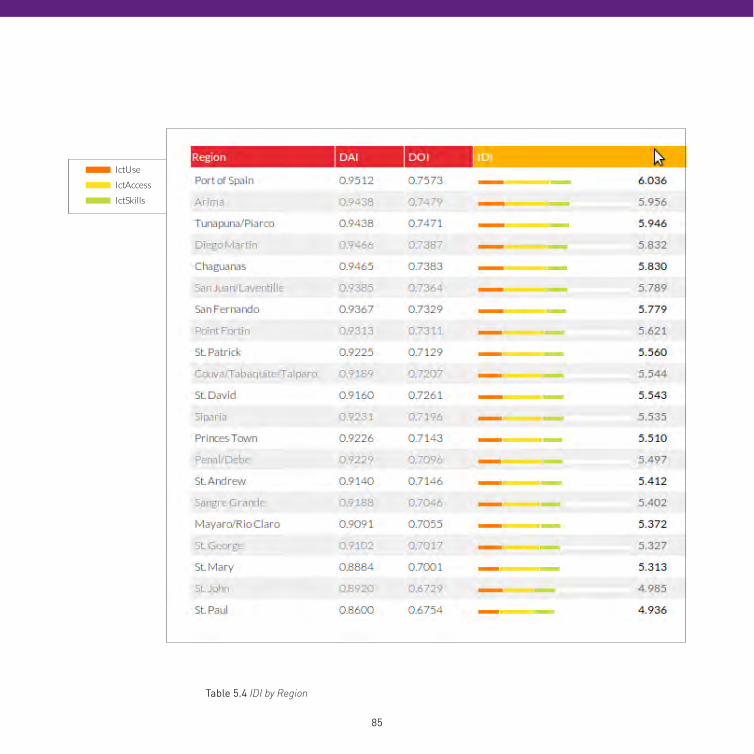
84 85
11/25/13 TATT
msurvey.co.ke/tatt/ 1/1
Survey Details Download Draft Logout
TATT Map of ICT Development IndexMin Max
IctUse
IctAccess
IctSkills
DAI DOI IDI
Port of Spain 0.9512 0.7571 6.019
Arima 0.9438 0.7477 5.938
Tunapuna/Piarco 0.9438 0.7468 5.928
Diego Martin 0.9466 0.7385 5.814
Chaguanas 0.9465 0.7380 5.812
San Juan/Laventille 0.9385 0.7361 5.771
San Fernando 0.9367 0.7327 5.761
Point Fortin 0.9313 0.7308 5.603
St. Patrick 0.9225 0.7127 5.543
Couva/Tabaquite/Talparo 0.9189 0.7204 5.526
St. David 0.9160 0.7258 5.526
Siparia 0.9231 0.7194 5.518
Princes Town 0.9226 0.7141 5.492
Penal/Debe 0.9229 0.7094 5.479
St. Andrew 0.9140 0.7143 5.394
Sangre Grande 0.9188 0.7044 5.384
Mayaro/Rio Claro 0.9091 0.7053 5.354
St. George 0.9102 0.7015 5.309
St. Mary 0.8884 0.6998 5.295
St. John 0.8920 0.6727 4.967
St. Paul 0.8600 0.6751 4.918
Region
Table 5.4 IDI by Region
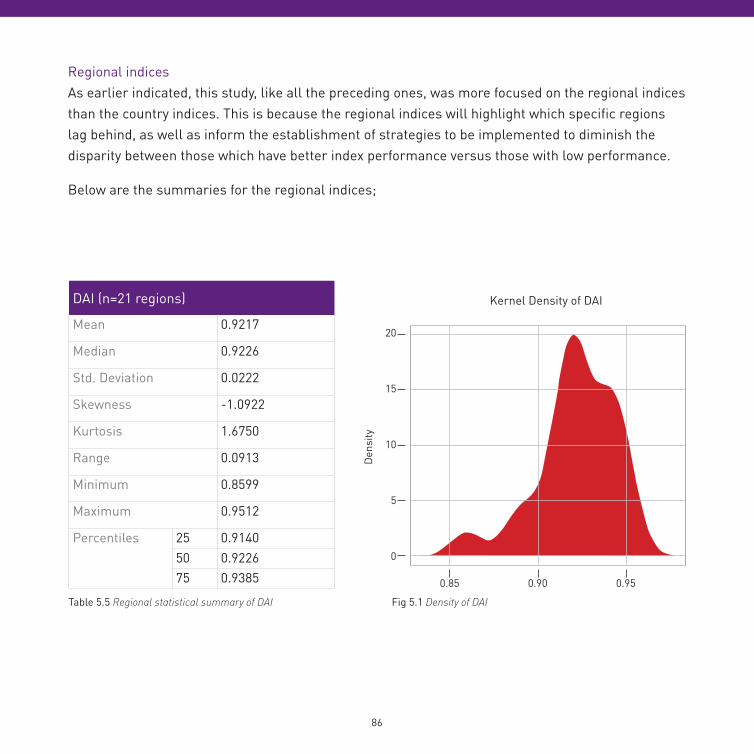
86
Regional indicesAs earlier indicated, this study, like all the preceding ones, was more focused on the regional indices than the country indices. This is because the regional indices will highlight which specific regions lag behind, as well as inform the establishment of strategies to be implemented to diminish the disparity between those which have better index performance versus those with low performance.
Below are the summaries for the regional indices;
DAI (n=21 regions)
Mean 0.9217
Median 0.9226
Std. Deviation 0.0222
Skewness -1.0922
Kurtosis 1.6750
Range 0.0913
Minimum 0.8599
Maximum 0.9512
Percentiles 25 0.914050 0.922675 0.9385 0.85 0.90 0.95
20
15
10
5
0
Kernel Density of DAI
Den
sity
Table 5.5 Regional statistical summary of DAI Fig 5.1 Density of DAI
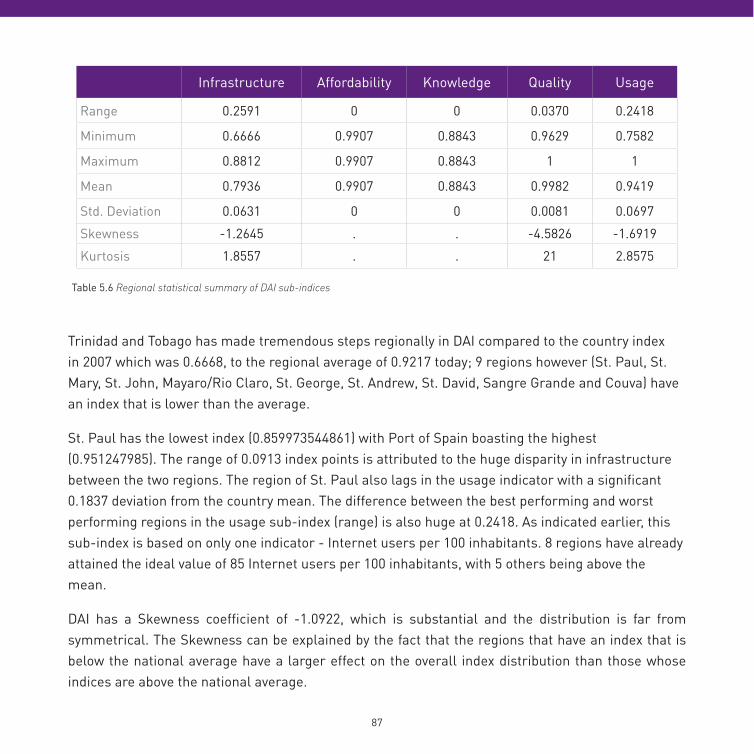
86 87
Infrastructure Affordability Knowledge Quality Usage
Range 0.2591 0 0 0.0370 0.2418
Minimum 0.6666 0.9907 0.8843 0.9629 0.7582
Maximum 0.8812 0.9907 0.8843 1 1
Mean 0.7936 0.9907 0.8843 0.9982 0.9419
Std. Deviation 0.0631 0 0 0.0081 0.0697
Skewness -1.2645 . . -4.5826 -1.6919
Kurtosis 1.8557 . . 21 2.8575
Trinidad and Tobago has made tremendous steps regionally in DAI compared to the country index in 2007 which was 0.6668, to the regional average of 0.9217 today; 9 regions however (St. Paul, St. Mary, St. John, Mayaro/Rio Claro, St. George, St. Andrew, St. David, Sangre Grande and Couva) have an index that is lower than the average.
St. Paul has the lowest index (0.859973544861) with Port of Spain boasting the highest (0.951247985). The range of 0.0913 index points is attributed to the huge disparity in infrastructure between the two regions. The region of St. Paul also lags in the usage indicator with a significant 0.1837 deviation from the country mean. The difference between the best performing and worst performing regions in the usage sub-index (range) is also huge at 0.2418. As indicated earlier, this sub-index is based on only one indicator - Internet users per 100 inhabitants. 8 regions have already attained the ideal value of 85 Internet users per 100 inhabitants, with 5 others being above the mean.
DAI has a Skewness coefficient of -1.0922, which is substantial and the distribution is far from symmetrical. The Skewness can be explained by the fact that the regions that have an index that is below the national average have a larger effect on the overall index distribution than those whose indices are above the national average.
Table 5.6 Regional statistical summary of DAI sub-indices
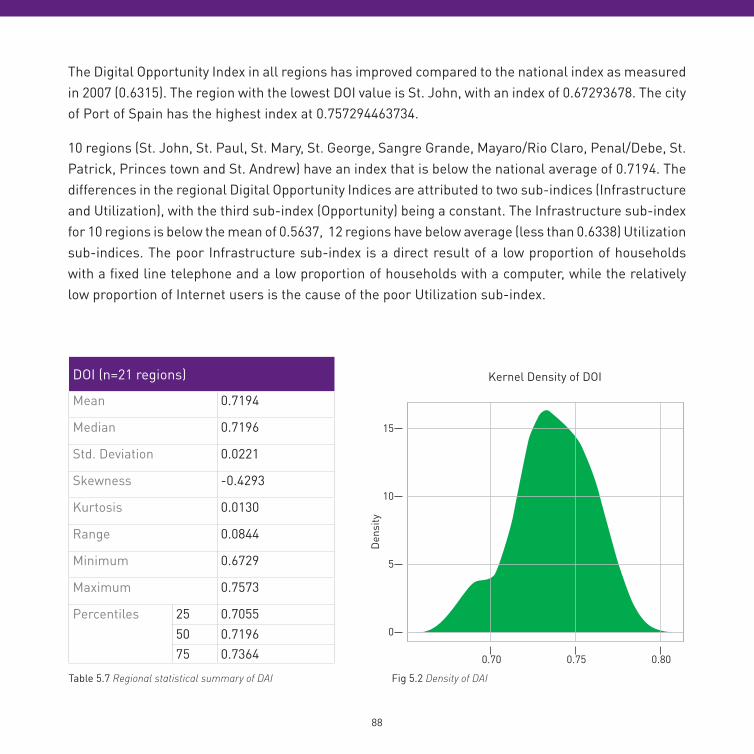
88
The Digital Opportunity Index in all regions has improved compared to the national index as measured in 2007 (0.6315). The region with the lowest DOI value is St. John, with an index of 0.67293678. The city of Port of Spain has the highest index at 0.757294463734.
10 regions (St. John, St. Paul, St. Mary, St. George, Sangre Grande, Mayaro/Rio Claro, Penal/Debe, St. Patrick, Princes town and St. Andrew) have an index that is below the national average of 0.7194. The differences in the regional Digital Opportunity Indices are attributed to two sub-indices (Infrastructure and Utilization), with the third sub-index (Opportunity) being a constant. The Infrastructure sub-index for 10 regions is below the mean of 0.5637, 12 regions have below average (less than 0.6338) Utilization sub-indices. The poor Infrastructure sub-index is a direct result of a low proportion of households with a fixed line telephone and a low proportion of households with a computer, while the relatively low proportion of Internet users is the cause of the poor Utilization sub-index.
DOI (n=21 regions)
Mean 0.7194
Median 0.7196
Std. Deviation 0.0221
Skewness -0.4293
Kurtosis 0.0130
Range 0.0844
Minimum 0.6729
Maximum 0.7573
Percentiles 25 0.705550 0.719675 0.7364 0.70 0.75 0.80
15
10
5
0
Kernel Density of DOID
ensi
ty
Table 5.7 Regional statistical summary of DAI Fig 5.2 Density of DAI
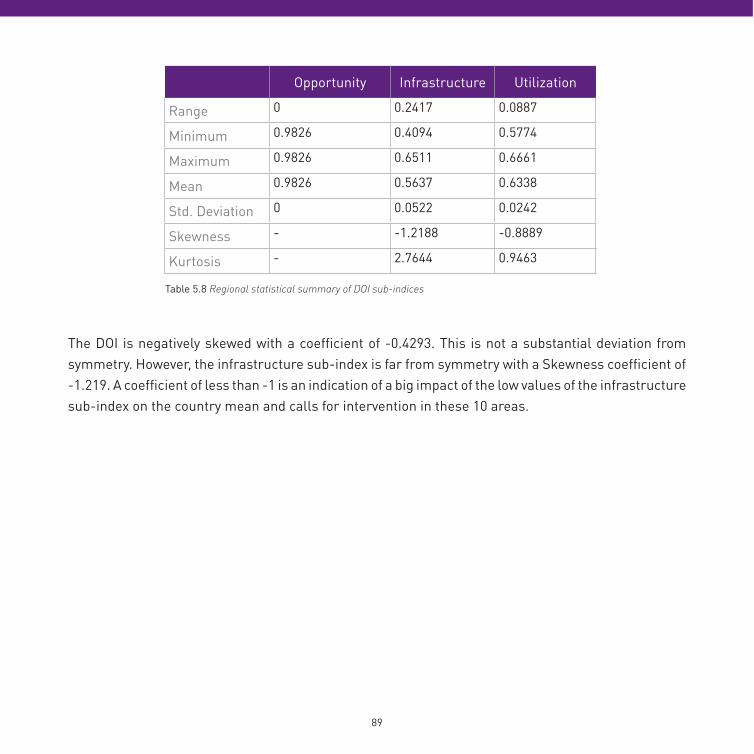
88 89
Opportunity Infrastructure Utilization
Range 0 0.2417 0.0887
Minimum 0.9826 0.4094 0.5774
Maximum 0.9826 0.6511 0.6661
Mean 0.9826 0.5637 0.6338
Std. Deviation 0 0.0522 0.0242
Skewness - -1.2188 -0.8889
Kurtosis - 2.7644 0.9463
The DOI is negatively skewed with a coefficient of -0.4293. This is not a substantial deviation from symmetry. However, the infrastructure sub-index is far from symmetry with a Skewness coefficient of -1.219. A coefficient of less than -1 is an indication of a big impact of the low values of the infrastructure sub-index on the country mean and calls for intervention in these 10 areas.
Table 5.8 Regional statistical summary of DOI sub-indices
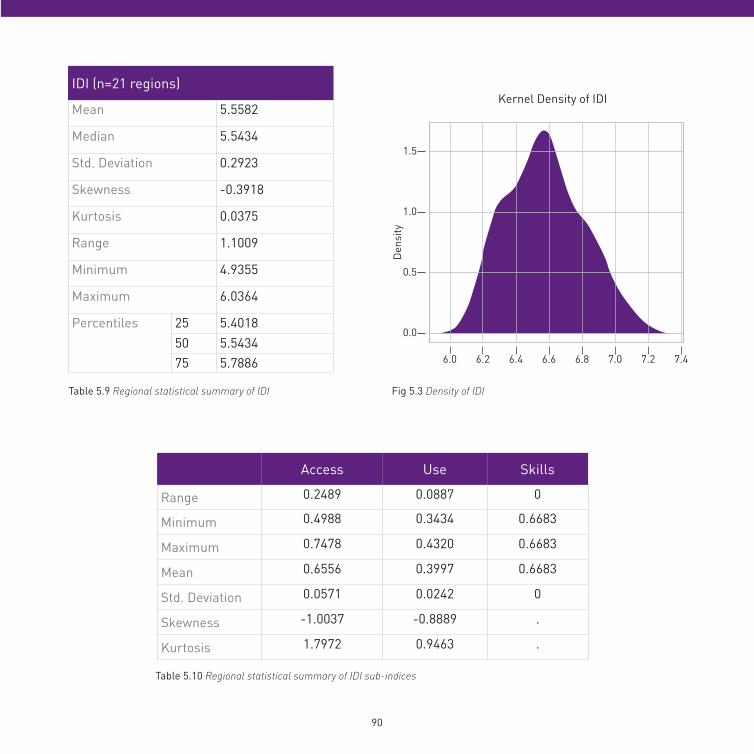
90
IDI (n=21 regions)
Mean 5.5582
Median 5.5434
Std. Deviation 0.2923
Skewness -0.3918
Kurtosis 0.0375
Range 1.1009
Minimum 4.9355
Maximum 6.0364
Percentiles 25 5.4018 50 5.5434 75 5.7886
Access Use Skills
Range 0.2489 0.0887 0
Minimum 0.4988 0.3434 0.6683
Maximum 0.7478 0.4320 0.6683
Mean 0.6556 0.3997 0.6683
Std. Deviation 0.0571 0.0242 0
Skewness -1.0037 -0.8889 .
Kurtosis 1.7972 0.9463 .
1.5
1.0
0.5
0.0
Kernel Density of IDI
Den
sity
6.0 6.2 6.4 6.6 6.8 7.0 7.2 7.4
Table 5.9 Regional statistical summary of IDI Fig 5.3 Density of IDI
Table 5.10 Regional statistical summary of IDI sub-indices
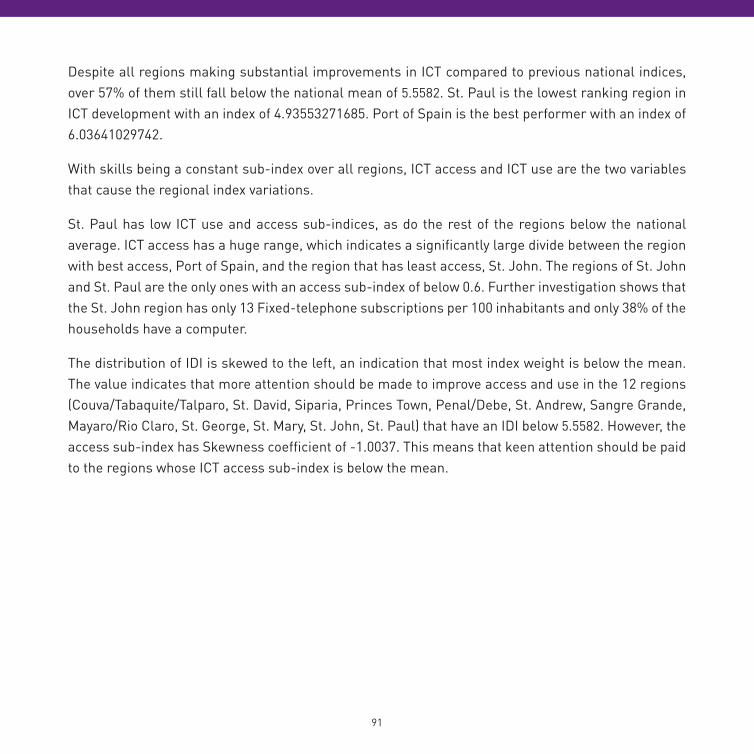
90 91
Despite all regions making substantial improvements in ICT compared to previous national indices, over 57% of them still fall below the national mean of 5.5582. St. Paul is the lowest ranking region in ICT development with an index of 4.93553271685. Port of Spain is the best performer with an index of 6.03641029742.
With skills being a constant sub-index over all regions, ICT access and ICT use are the two variables that cause the regional index variations.
St. Paul has low ICT use and access sub-indices, as do the rest of the regions below the national average. ICT access has a huge range, which indicates a significantly large divide between the region with best access, Port of Spain, and the region that has least access, St. John. The regions of St. John and St. Paul are the only ones with an access sub-index of below 0.6. Further investigation shows that the St. John region has only 13 Fixed-telephone subscriptions per 100 inhabitants and only 38% of the households have a computer.
The distribution of IDI is skewed to the left, an indication that most index weight is below the mean. The value indicates that more attention should be made to improve access and use in the 12 regions (Couva/Tabaquite/Talparo, St. David, Siparia, Princes Town, Penal/Debe, St. Andrew, Sangre Grande, Mayaro/Rio Claro, St. George, St. Mary, St. John, St. Paul) that have an IDI below 5.5582. However, the access sub-index has Skewness coefficient of -1.0037. This means that keen attention should be paid to the regions whose ICT access sub-index is below the mean.
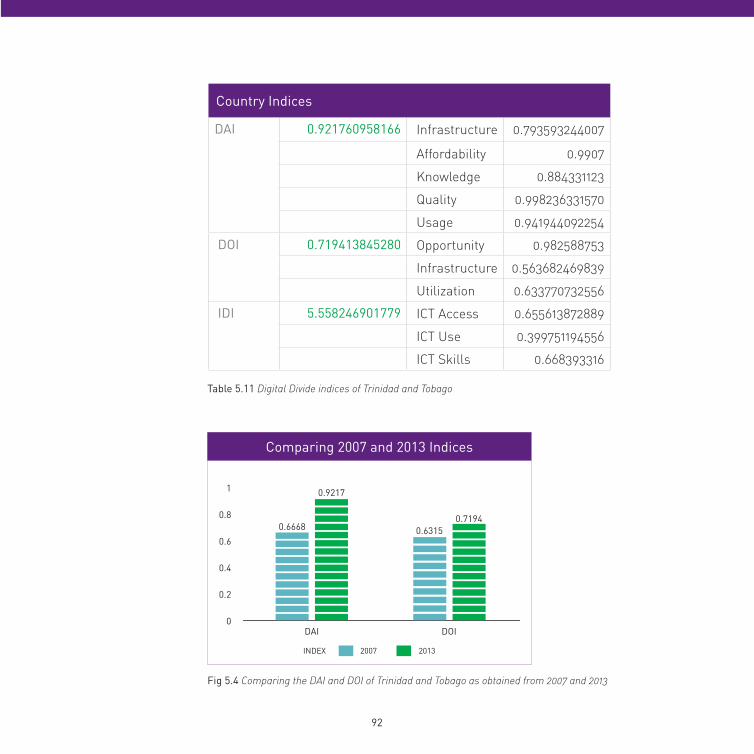
92
Country Indices
DAI
0.921760958166 Infrastructure 0.793593244007
Affordability 0.9907
Knowledge 0.884331123
Quality 0.998236331570
Usage 0.941944092254
DOI
0.719413845280 Opportunity 0.982588753
Infrastructure 0.563682469839
Utilization 0.633770732556
IDI
5.558246901779 ICT Access 0.655613872889
ICT Use 0.399751194556
ICT Skills 0.668393316
INDEX 2007 2013
DOIDAI
0.6315
0.9217
0.66680.7194
Comparing 2007 and 2013 Indices
1
0.8
0.6
0.4
0.2
0
Table 5.11 Digital Divide indices of Trinidad and Tobago
Fig 5.4 Comparing the DAI and DOI of Trinidad and Tobago as obtained from 2007 and 2013
92 93
Trinidad and Tobago has made significant progress since when the last Digital Divide Survey was carried out in 2007.
DAI has marked an improvement of 38.22% since 2007.
DOI has marked an improvement of 13.91%. Opportunity is quite high but Infrastructure and Utilization are lagging behind in spite of the improvements realized over time. Two of the indicators for Infrastructure in gauging the level of digital opportunity remain low, the improvements notwithstanding. The proportion of households with a fixed line telephone is a long way of the ideal value of 100% while the number of mobile Internet subscriptions remains low too.
2013 is the first year that IDI is being measured for Trinidad and Tobago, and the value obtained for this index is 5.5582.
94
Differently-abled Data
A total of 1197 respondents confirmed that they, or someone who lives in their household, were differently-abled. However, the total number of persons with disabilities cited is 1329 because some households have more than one person with disabilities. All communities were aggregated to show a distribution of income, access to technologies, and the types of disability in the different locations.
Overall, the most prevalent disability is “limited/no mobility” with a total of 416 (31%) persons affected with this challenge, while 214 (16%) persons were identified as being “blind/visually impaired”, and 197 (15%) persons being “deaf/hearing impaired”. Of the 85 (6%) of persons who were cited as having multiple disabilities, 20 (24%) of these had “limited/no mobility + sensory disability”, 11 (13%) were “hearing impaired and speech and language impaired”, and 7 (8%) were “blind/visually impaired and deaf/hearing impaired”.
The data shows that 276 persons with disabilities live in households where there is more than one person with disability. Of the households with multiple persons with disabilities, “blind/visually impaired” is the most commonly cited disability, followed by “limited/no mobility”, then “speech/language disability”.
A total of 51 communities were identified as having households with persons with disabilities. The data revealed that in Trinidad, the San Juan/Laventille region has the highest incidence of persons with disabilities with 200 persons with disabilities distributed across 164 households, of which 55 (27%) were identified as being in need of special equipment to access ICT services. Out of these 55 households, 44 (80%) have a monthly income of less than $5,000, 6 (3%) range between $5000 - $10,000, 1 (0.5%) between $10,000 - $15,000, 2 (1%) between $15,000 - $20,000, 1 (0.5%) between $20,000 - $25,000, and 1 (0.5%) above $30,000. Of the 55 households identified as being in need of special equipment, 25% (14) were already using special equipment. Chaguanas and Couva/Tabaquite/Talparo had the second and third highest number of persons with disabilities with 134 persons distributed across 106 households, and 110 persons across 96 households respectively.
94 95
In Tobago, St. Patrick, St. Andrew and St. David have the first, second and third respective highest number of persons with disabilities, with 26, 25, and 20 persons each. As is the case in Trinidad, in Tobago the majority of these households with persons with disabilities have a monthly income of less than $10,000.
The data show the regions and communities where the differently-abled can be found and interventions can be developed. However, more accurate data was captured at the regional level due to absence of community-level data that was not entered correctly by the respondents. The community question was open-ended, and respondents entered information that could not be correlated with the region entered.
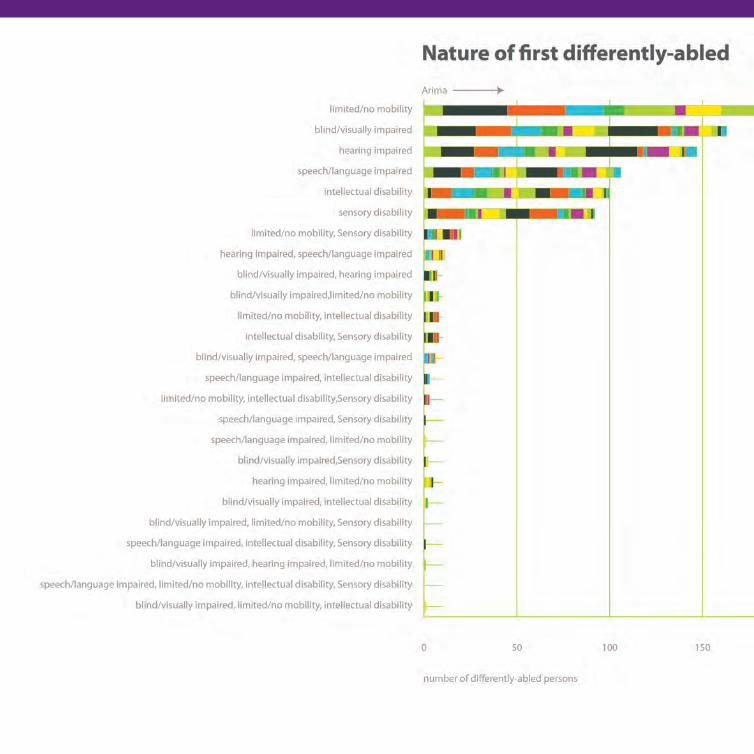
96
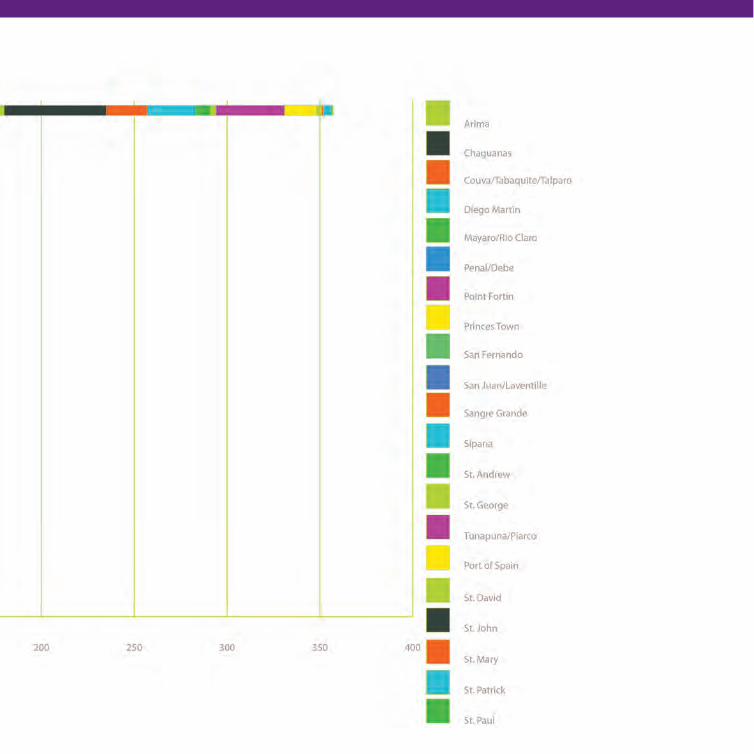
96 97
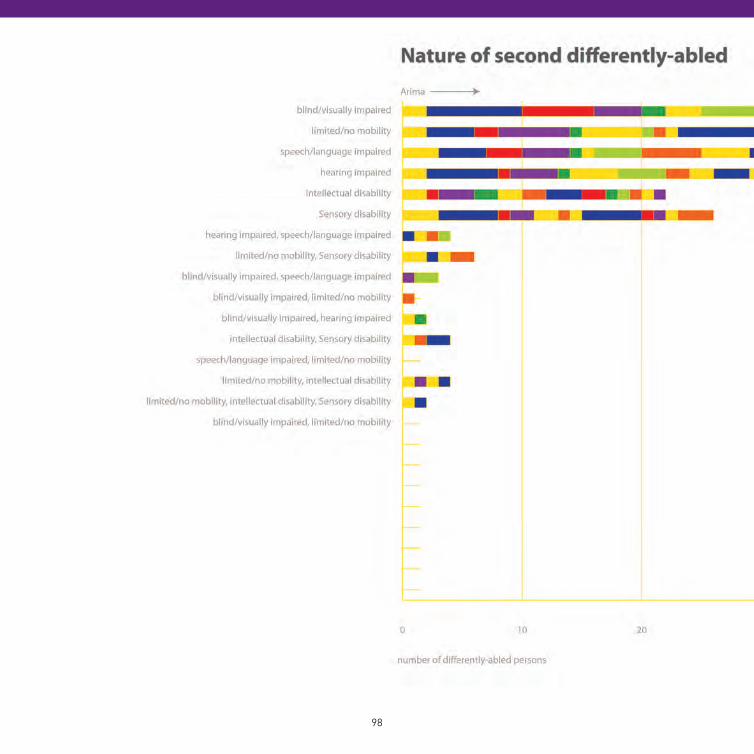
98
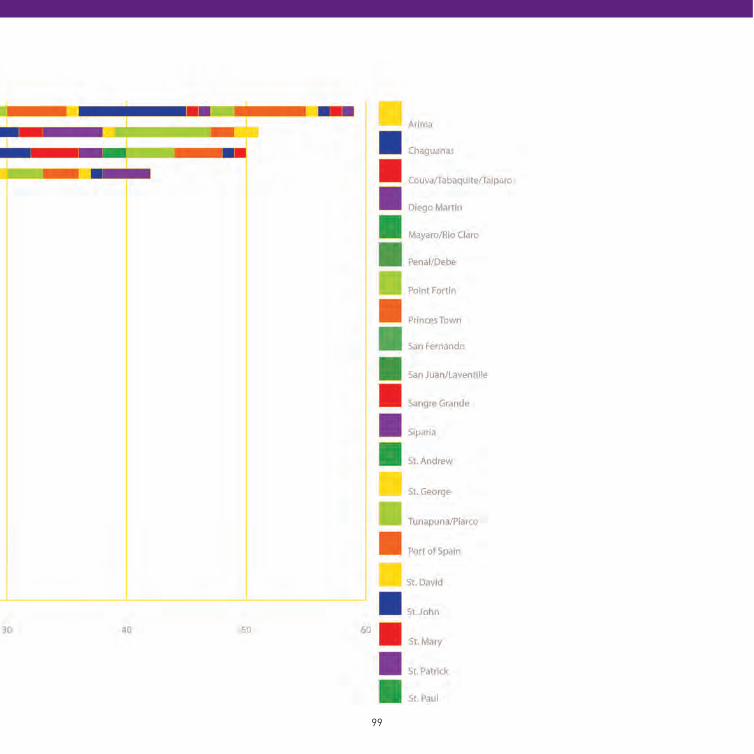
98 99
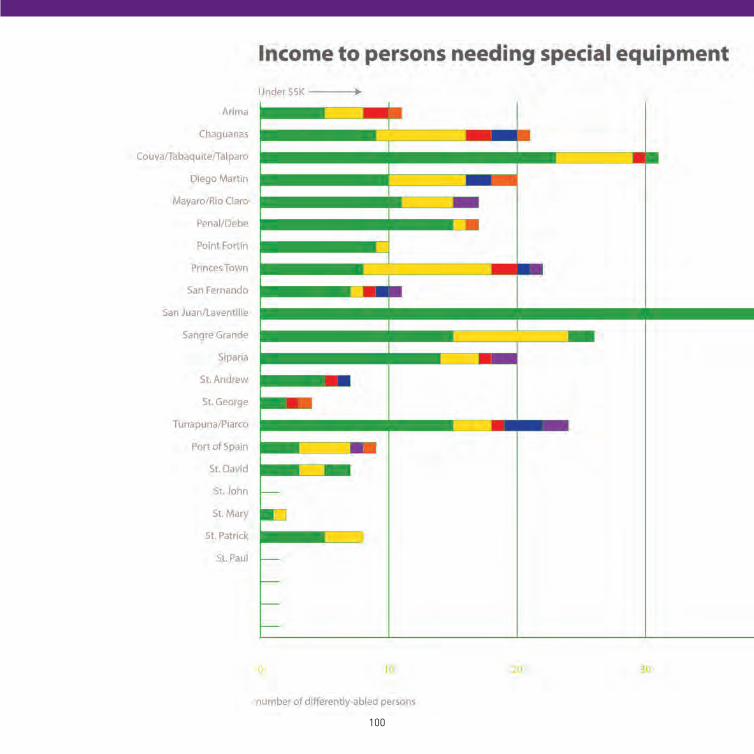
100
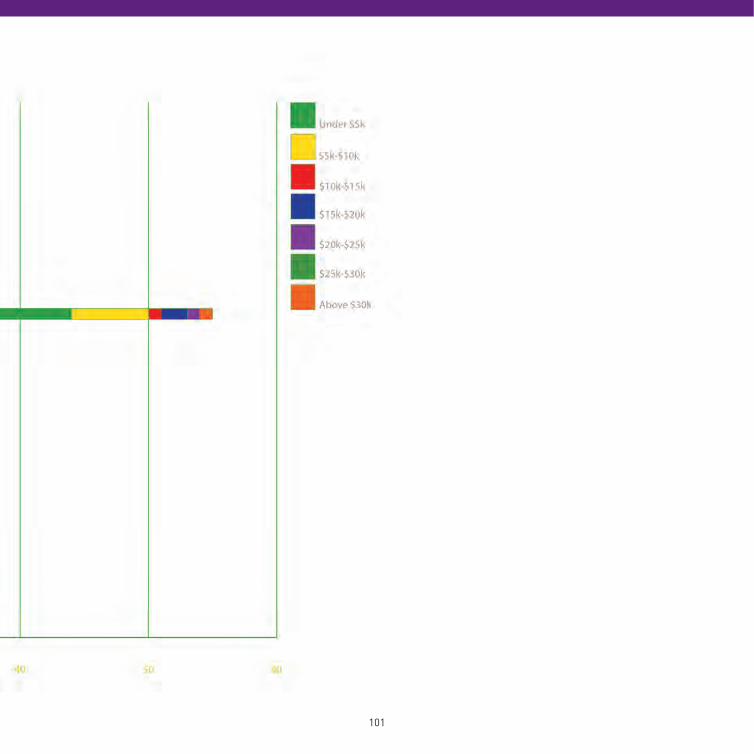
100 101
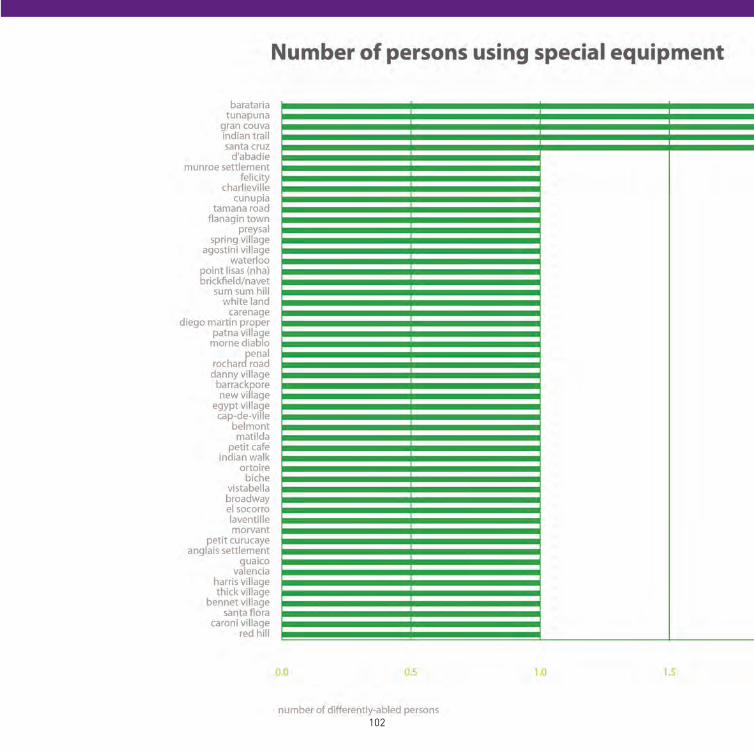
102
102 103
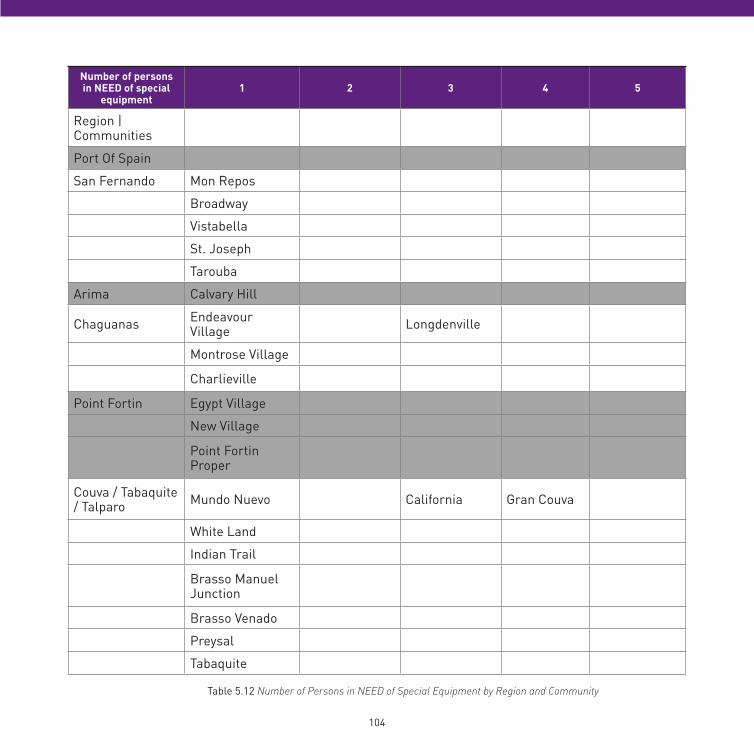
104
Number of persons in NEED of special
equipment1 2 3 4 5
Region | Communities
Port Of Spain
San Fernando Mon Repos
Broadway
Vistabella
St. Joseph
Tarouba
Arima Calvary Hill
Chaguanas Endeavour Village Longdenville
Montrose Village
Charlieville
Point Fortin Egypt Village
New Village
Point Fortin Proper
Couva / Tabaquite / Talparo Mundo Nuevo California Gran Couva
White Land
Indian Trail
Brasso Manuel Junction
Brasso Venado
Preysal
Tabaquite
Table 5.12 Number of Persons in NEED of Special Equipment by Region and Community
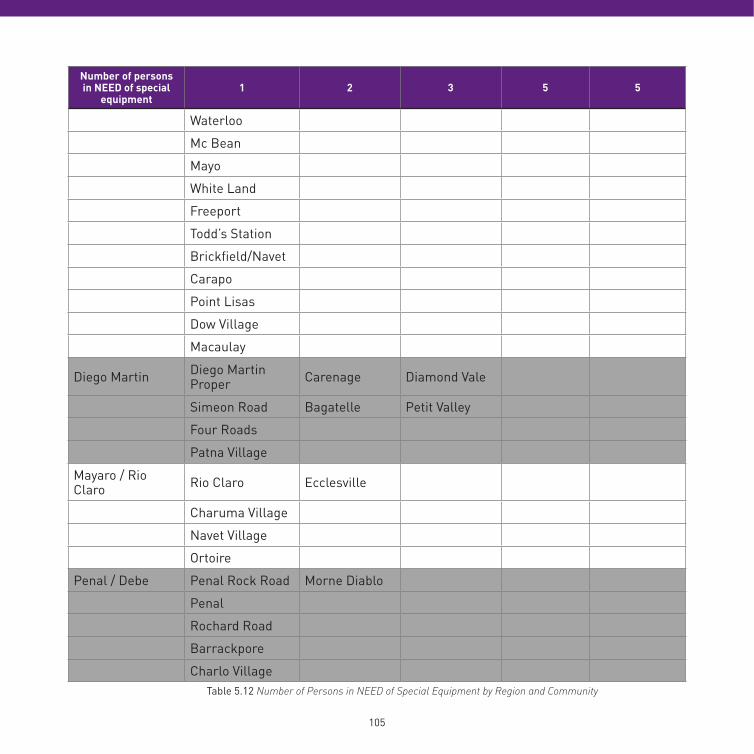
104 105
Number of persons in NEED of special
equipment1 2 3 5 5
Waterloo
Mc Bean
Mayo
White Land
Freeport
Todd’s Station
Brickfield/Navet
Carapo
Point Lisas
Dow Village
Macaulay
Diego Martin Diego Martin Proper Carenage Diamond Vale
Simeon Road Bagatelle Petit Valley
Four Roads
Patna Village
Mayaro / Rio Claro Rio Claro Ecclesville
Charuma Village
Navet Village
Ortoire
Penal / Debe Penal Rock Road Morne Diablo
Penal
Rochard Road
Barrackpore
Charlo VillageTable 5.12 Number of Persons in NEED of Special Equipment by Region and Community
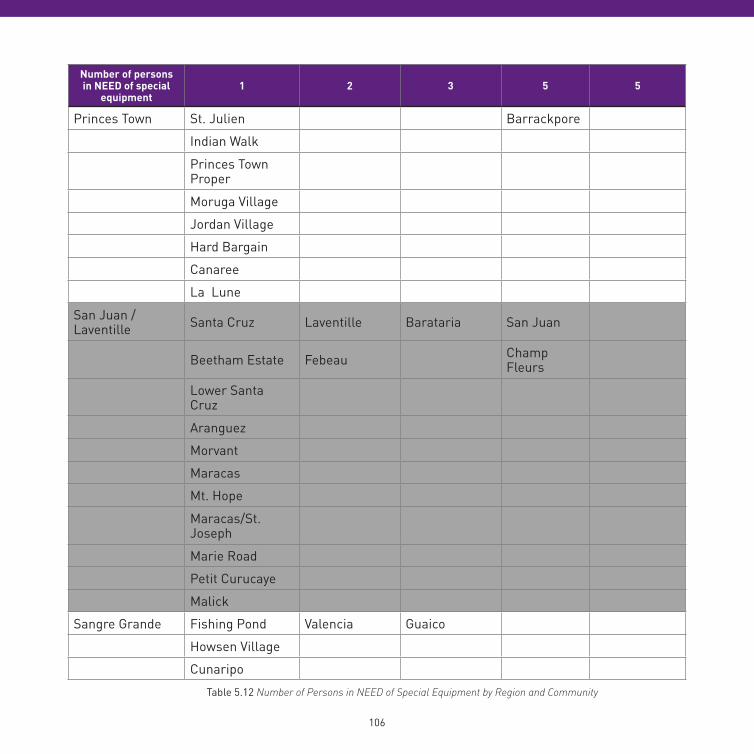
106
Number of persons in NEED of special
equipment1 2 3 5 5
Princes Town St. Julien Barrackpore
Indian Walk
Princes Town Proper
Moruga Village
Jordan Village
Hard Bargain
Canaree
La Lune
San Juan / Laventille Santa Cruz Laventille Barataria San Juan
Beetham Estate Febeau Champ Fleurs
Lower Santa Cruz
Aranguez
Morvant
Maracas
Mt. Hope
Maracas/St. Joseph
Marie Road
Petit Curucaye
Malick
Sangre Grande Fishing Pond Valencia Guaico
Howsen Village
Cunaripo
Table 5.12 Number of Persons in NEED of Special Equipment by Region and Community
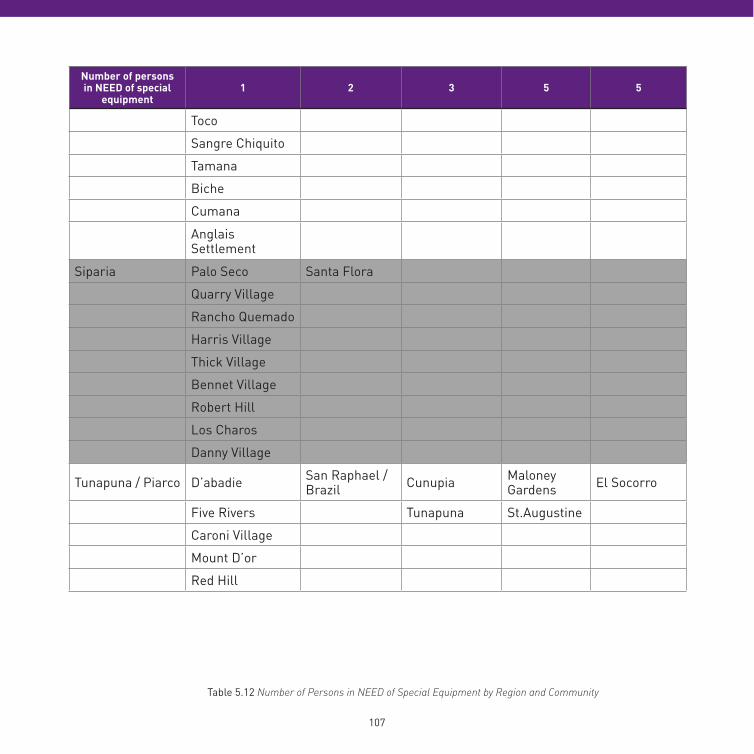
106 107
Number of persons in NEED of special
equipment1 2 3 5 5
Toco
Sangre Chiquito
Tamana
Biche
Cumana
Anglais Settlement
Siparia Palo Seco Santa Flora
Quarry Village
Rancho Quemado
Harris Village
Thick Village
Bennet Village
Robert Hill
Los Charos
Danny Village
Tunapuna / Piarco D’abadie San Raphael /Brazil Cunupia Maloney
Gardens El Socorro
Five Rivers Tunapuna St.Augustine
Caroni Village
Mount D’or
Red Hill
Table 5.12 Number of Persons in NEED of Special Equipment by Region and Community
108
108 109
Contributions and Recommendations
06
110
Based on the regional indices, it is clear that Tobago lags behind Trinidad. The regions of St. Mary, St. John and St. Paul lag in digital access due to poor infrastructure which is attributed to a low number of fixed telephone subscribers per 100 inhabitants.
Three regions (Penal/Debe, St. John and St. Mary) have a usage sub-index that is below 0.9, unlike all other regions. Usage has only one indicator, Internet users per 100 inhabitants. A low sub-index value for usage thus means that the number of Internet users in these regions is relatively low compared to the ideal value of 85%.
South Korea, noted to be the leading country in bridging the digital divide, has put in place different measures to avail Internet accessibility and increase usage through Korea Agency For Digital Opportunity & Promotion (KADO)16.
‘…. nearly 80% of the general public (South Korea) uses the Internet regularly’
In an effort to reach people in remote areas, KADO partners with local governments and civic associations. Additionally, KADO holds classes on computer/Internet use in private homes. Along with Internet infrastructural improvements, an approach like this could be investigated to be implemented in Trinidad and Tobago thereby increasing usage and immensely bridging the divide.
Regions such as St. Paul and St. John trail the rest of the country in Digital Opportunity due to poor infrastructure. The non-constant indicators of this sub-index are the number of Internet users per 100 inhabitants, proportion of households with a fixed line telephone and the proportion of households with a computer. Much as the regions of St. Paul and St. John have better infrastructure than the country average as of 2007 (0.39)17, the disparity between them and the best performing region in this sub-index is quite high. The city of Port of Spain has a DOI of 0.7748 and this is partly due to good infrastructure, whose index is 0.6816. Interventions should be put in place to implement infrastructure in all regions to a comparable standard of Port of Spain.
16 http://www.forbes.com/2009/04/02/Internet-broadband-korea-technology-korea-09-broadband.html17 https://tatt.org.tt/Portals/0/documents/Universal%20Service%20Framework%20June%202012.pdf
110 111
Data extracted from the Digital Divide Survey indicate the presence of an association between income levels and the presence of a computer in the household. Measures should be put in place to avail low cost computers to households in these poor infrastructure areas as well as encourage Internet use by increasing mobile and fixed accessibility.
The regions of St. John, St. Paul, and St. George in Tobago as well as Sangre Grande in Trinidad occupy the lower quartile in ICT Development Index. The three Tobago regions rank poorly in IDI due to low ICT access while Sangre Grande has a low ICT usage sub-index. It is worth noting that regions in Trinidad have higher ICT access sub-indices than those in Tobago, but they lag relatively behind in terms of use. Sangre Grande, Siparia and Diego Martin have the lowest ICT usage sub-indices.
Indicators included in the ICT access sub-index provide an indication of the available ICT infrastructure and individuals’ access to basic ICTs. A low index therefore signifies deficient availability of ICT infrastructure and limited access at individual level in a region.
Based on the current metrics and definitions of the digital divide by the International Telecommunications Union, interventions should be drawn up to increase the availability fixed telephone lines, computers and Internet to the areas that have low access with special priority and intensity in Tobago. Increasing access to fixed telephone lines may not be feasible. However, access should be considered in terms of mobile phones and the kinds of services offered that can take the place of fixed telephone lines.
Broadband Internet should also be made available and affordable to all areas to encourage subscriptions and more efficient Internet use. Campaigns to encourage Internet use in regions such as Siparia, Diego Martin, Sangre Grande, Mayaro/Rio Claro and Chaguanas should be developed and executed in addition to improving the existing infrastructure. However, although there is access to these technologies, there must be an incentive for individuals to utilize the technologies as part of daily lifestyle. Access is a good measure, however, utilization is a definitive factor of bridging the digital divide for individuals throughout Trinidad and Tobago. As seen in the Korea example, training and other programs can be established to increase utilization once access is defined.
112
Discussions
This study was using an unprecedented methodology, a huge technological shift from the conventional pen-and-paper field interviews. Some challenges were therefore encountered;
• Despite the high mobile phone subscription in Trinidad and Tobago, not everyone is familiar with mobile phone surveys. Inadequate comprehension of the interaction procedure posed problems to some, leading to cases on lack of survey completion. The incomplete surveys called for a follow- up procedure using enumerators which also offered ethnographic research into the utilization of mobile technology. Those who had mobile phones did not always know, or were not familiar with, how to use the technology.
• mSurvey depends highly on transmission of user experience information from one participant to another. A huge facilitator of this is the compensation/incentives issued in the form of airtime upon survey completion in real-time. The absence of real-time compensation at some points in the course of the survey meant that the participants did not spread the information about the survey as efficiently as anticipated, leading to low response rates in some areas.
112 113
Advice and recommendations
Trinidad and Tobago shows an impressive calculation of the indices determined by the metrics provided by the International Telecommunications Union.
Significant focus was given to the definition of “access” while undertaking the Digital Divide Survey in Trinidad and Tobago. Access is somewhat defined in the indices as inclusion and acts as a determinant in shrinking the digital divide. Greater consideration should be given to further develop the analysis of access from one which defines a person who has physical access to technology, to a definition that focuses access to services that improve utilization, efficiencies and overall production. Consideration should be given to the metrics that define access to include utilization criteria. Suggestions would be to develop follow-up questions focused on monitoring how persons with access utilize the technology to gauge what kinds of services would allow them to use such technology more frequently and gain more familiarity.
Looking at a comparative analysis of Trinidad and Tobago and other countries such as Ghana, Estonia, and Kenya, these countries have taken a shift to use technology access as leverage for introducing additional services to the public, beyond the physical device. The additional services however are not the sole responsibility of the government or regulatory bodies, but can be introduced as a technology challenge for young, eager entrepreneurs to develop solutions for the population of Trinidad and Tobago to utilize.
The definition of education literacy does not have a one-to-one mapping with one’s ability to utilize a given technology, and should therefore be reconsidered as a metric for technology literacy. As seen with the indices, enrollment does not adequately capture technology utilization by an individual, also taking into account the high mobile phone penetration. Other metrics that offer a clearer indication about technology literacy such as the ownership of an email account, the frequency of use of email, the access to tools such as Google18 to search for information, the ability to attach media (images, video, music) to electronic messages, the utilization of VoIP such as Skype19 can all be used as questions to quantify someone’s technology literacy.18 Google is an Internet search engine used to search multiple records of information and cloud computing. 19 Skype is a Voice over Internet Protocol (VoIP) which allows persons to communicate through voice and video using a computer, tablet, or other internet devices connected to the internet to make calls and share content using the internet.
114
Shrinking the Digital Divide | Kenya
In 2006, a mobile phone tool called M-PESA was developed to assist Kenyans with the transfer of funds to other Kenyans using a simple mobile phone. M-PESA has turned the 70% of the unbanked population into banked Kenyans. M-PESA is not at all an aesthetically crafted smartphone application, but the core mechanics of the technology is accessed using simple USSD (Unstructured Supplementary Service Data) for transactions and SMS (Short Message Service) for alerts. M-PESA is application agnostic and works on any kind of mobile phone. Introducing a technology such as M-PESA was an incentive for Kenyans to use, with a mobile phone penetration of 70%, M-PESA’s transactions
surpasses over 50 million per month. Kenyans are incentivized to use this service as a mode of payment, loans, and remittances from region to region, with transactions sometimes as low as 100 Kenyan Shillings (equivalent to $1.14). With the introduction of a service such as M-PESA there has been increased production, improved transparency, improved efficiencies, and overall shrinkage of the digital divide in Kenya. M-PESA has become a part of the fabric of daily transactions and a way of doing business with the mobile phone. Although Kenya still has considerable time to continue shrinking the digital divide, services like M-PESA are becoming attractive for entrepreneurs and business to increase the use of the technology as part of lifestyle, which creates additional solutions targeted at shrinking the digital divide.
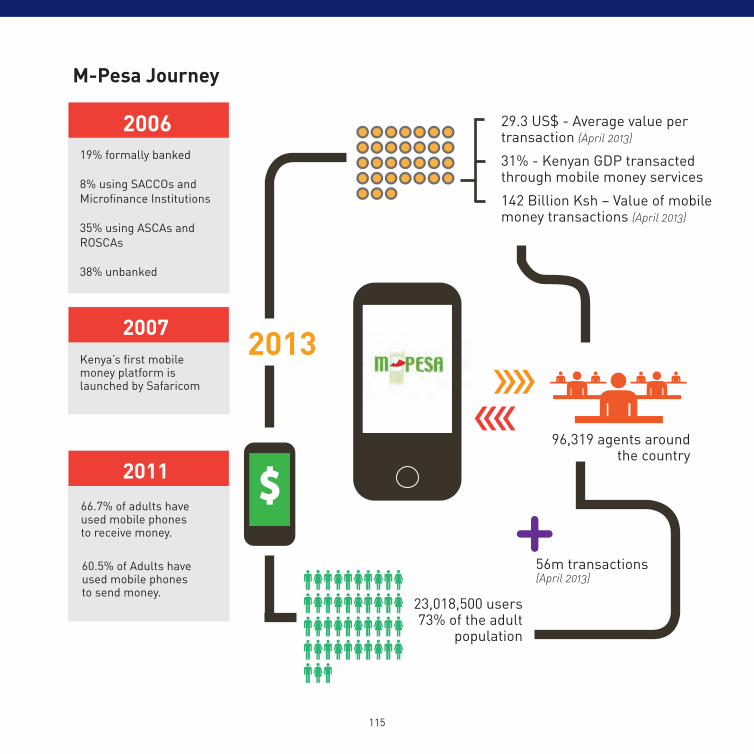
114 115
29.3 US$ - Average value per transaction (April 2013)
31% - Kenyan GDP transacted through mobile money services
142 Billion Ksh – Value of mobile money transactions (April 2013)
23,018,500 users73% of the adult
population
96,319 agents around the country
56m transactions (April 2013)
60.5% of Adults have used mobile phones to send money.
M-Pesa Journey
19% formally banked
8% using SACCOs and Microfinance Institutions
35% using ASCAs and ROSCAs
38% unbanked
2007
2011
2013Kenya’s first mobile money platform is launched by Safaricom
66.7% of adults have used mobile phones to receive money.
116
Shrinking the Digital Divide | Ghana
Various Ministerial Departments and Agencies in Ghana are developing means to incorporate technology into their processes within government and beyond. Some of these services include online/digital access for services such as the Passport Office, Driver and Vehicle Licensing Division (DVLA), Food and Drugs Authority (FDA), Ghana Tourist Authority (GTA), Criminal Investigations Department (CID) of the Ghana Police Service, Births and Deaths Registry, Accra Metropolitan Assembly, National Identification Authority (NIA), National Communications Authority (NCA) and the Minerals Commission. In addition, Ghana is currently pushing an aggressive agenda for e-commerce solutions with the use of hi-speed Internet access.
Shrinking the Digital Divide | Estonia
Estonia has placed themselves as a technology leader, with a population of 1.3 million. Estonia’s story is a bit different than that of Kenya and Ghana, but relates in the way of utilization to become a leader of not only technology production such as Skype, but technology utilization within the government sectors. Estonia has pushed to use e-services in many transactions, including paying for parking using a mobile phone and nationwide Internet voting in 200520. In addition, there was about 86% of Estonian tax-payers who declared their income taxes using the Internet 21.
20 CALTECH/MIT VOTING TECHNOLOGY PROJECT A multi-disciplinary, collaborative project of the California Institute of Technology – Pasadena, California 91125 and the Massachusetts Institute of Technology – Cambridge, Massachusetts 021392121 Internet Voting in Estonia, Estonian National Electoral Committee (http://www.vvk.ee/public/dok/Internet_Voting_in_ Estonia.pdf - Accessed in 2013)
116 117
Shrinking the Digital Divide | Chicago and Minneapolis (USA)
The digital excellence initiative in Chicago, USA, has been addressing the issues of access to not just the Internet, but also to the rich and valuable data and dialogues that can be found online. Only 39% of the Chicago residents have access to broadband Internet. Majority of those without access are low-income families, minorities, people with disabilities and
seniors of the city’s population. This means that majority of the city residents are unable to gain access to crucial information and resources. One key project of the initiative was the creation and launch of neighborhood web portals accessible through public kiosks across each of the three communities. Local institutions can post their events on the portals, employers can post job openings and individuals can have dialogue and share media through comments.
In the state of Minneapolis, a program called the Digital Divide Initiative (DDI) which came out of a 1997 IBM initiative called Teaming for Technology, has a mission to provide technological skills to participants to help them ‘succeed in an increasingly digital world’. The initiative has a focus to put computers with appropriate software into people’s homes and the ultimate goal of the initiative is to foster technological literacy within underserved populations. Their programs include The Computer Exchange Program (CompEx) to distribute refurbished computers to individuals and families through the Computer Take Home Workshop. Participants can take a computer home with them to continue their tech education once they have learnt new computer and software skills.
Shrinking the Digital Divide | Barbados
In 2011 Barbados Entrepreneurship Foundation (BEF) offered a free WI-FI aimed to offer access to many irrespective of the socioeconomic background. The target was to offer access points throughout the island. The open WI-FI initiative gained a 60% uptake. The initiative proved to be very successful and Barbados was recently ranked 29th from 35th on the
IDI scale by the ITU. However, it is noted that Barbados' population is 1/4 of the size of Trinidad and Tobago; however such initiatives prove to have successful results.
118
Shrinking the Digital Divide | Trinidad and Tobago
Through ethnography with enumerators on the ground and some insights from the replies of some users who participated in the Digital Divide Survey in Trinidad and Tobago, we deduce that some persons had difficulty with some features of the technology, which implies the limited familiarity with mobile phone features beyond voice communication. We conclude that more ways of interaction with mobile phones would increase the familiarity and improve utilization of technology beyond traditional voice, and will continue to shrink the digital divide. Mobile phones can be optimized for more than voice and should be considered to make “communicators” into “users”.
We believe Trinidad and Tobago is in a very strong position to change the technology landscape as a global leader. With a mobile phone penetration of 140%, we see this as significant leverage to offer additional services to increase efficiencies, production, and utilization in the market. As observed in Estonia, with ubiquitous access to the Internet, Trinidad and Tobago can offer Internet solutions through mobile phones as a result of the high mobile phone penetration. However, solutions to provide access and utilization can be challenging without design and creative means outside limited, conventional processes. By supporting an entrepreneurship culture and incentivizing technology enthusiasts, there is a possibility for entrepreneurs to develop solutions as businesses to solve some of the connectivity and access problems in Trinidad and Tobago. Some potential services can include renewing a passport online, signing up for new services from a mobile phone, integrating carnival activities with mobile devices. In each country, we note that there are specific cultural contexts that require in-depth analysis regarding which technologies can and cannot be developed and can and cannot be transferred from country to country. The analysis of the kinds of technologies to improve utilization was not a part of the Digital Divide Survey. We deem with local resources, there are many opportunities to increase utilization of technology in Trinidad and Tobago to continue shrinking the Digital Divide and becoming a technology leader.
118 119
We see there are opportunities to offer solutions that seamlessly become a part of the lifestyle on Trinidadians and Tobagonians. Two of such technologies that come to mind are Triniberry22, which gives Trinidadians access to movie show times on demand on their mobile phones, and mFisheries23
which offer fisher folk the ability to buy and sell fish using their mobile phones including other valuable features such as capturing crime, and emergency services (SOS). The examples given show that there is an inherit incentive for the users who access these services that find them quite useful and will continue to use them, and exemplifies the thought process necessary to include all Trinidadians and Tobagonians. These services do not require a physical line (which can be cost prohibitive for the providers) to connect to the Internet, but a solution that makes the user want to access the Internet (service) from a mobile device. The University of the West Indies has conducted research on wireless technologies, which can be a fruitful resource to the possibility of broader wireless access points and applications throughout Trinidad and Tobago, such as Long Term Evolution (LTE) technologies for high-speed wireless data developed for mobile phones 24, 25.
The data developed in the Digital Divide Survey allows TATT to be in a position to observe communities and regions that can significantly benefit from technological intervention. Such areas can be sorted and an approach can be developed to apply interventions, but need to be staged, monitored, and designed using an iterative approach. Once interventions are developed at a small manageable scale and tested for general utilization, TATT will be in a position to do quick and valued assessment using the methodology defined in this report, seeing what works and what does not before scaling to other regions.
22 Triniberry is a mobile application developed in Trinidad and Tobago used to access information of movie show times using a GPRS enabled smartphone23 mFisheries is a project developed at the University of the West Indies, St. Augustine that runs on an Android, GPRS enabled smartphone for fisher folk24 System and method for enhanced parallel receiving interworking in a wireless communications system by S. Xing, P. Hosein, Y. Kwon and J. Hu issued on April 10, 2012 (Patent # 8,190,165)25 Hosein, P., (2010) Coordinated Radio Resource Management for the LTE Downlink: The Two-Sector Case. IEEE ICC 2010
120
The data collected for the Digital Divide Survey 2013 are limited to the IDI, DAI, and DOI indicators that offer insight to the areas that are in need of intervention. The data do not provide conclusive insight to develop a comprehensive plan on the kinds of infrastructural decisions that would directly affect the Digital Divide throughout the country. Additional research and focus are needed to closely assess and monitor selected communities. The data however offer insight into regions and communities for developing, testing, and evaluating controlled, and limited interventions. We note that infrastructure does not appear to be an inhibiting factor in closing the Digital Divide in Trinidad and Tobago. With a mobile phone penetration of 140% used as the driving variable for the IDI, DAI, and DOI calculations, Trinidadians and Tobagonians are “connected”. A shift in focus should be considered to determine the kinds of interventions needed, and thus making an investment in tools and services that allow individuals to become familiar with the mobile technology is advised. The data do not offer insight on what kinds of tools are needed. As an ethnographic observation throughout the Digital Divide Survey 2013, there appears to be a lack of familiarity with the mobile phone to process tasks outside voice calls and simple SMS communication, which may allow increased utilization and eventually productivity. Consideration should be given to develop incentives around necessary tools for end-users to interact with the technology and to gain more familiarity.
Interventions such as Internet access via tethering using 3G/4G networks and wireless research done at The Department of Computing at UWI should all be considered in the Digital Divide access plan.
120 121
Execution plan
The objective of the execution plan is to develop a long-term strategy to shrinking the Digital Divide in communities, regions and eventually throughout Trinidad and Tobago. The goal is to assess what works in communities, subsequently regional areas, before scaling across the country. It is important to conduct a more conclusive study that offers greater insights to ICT skills of the Digital Divide Indices, rather than exclusively external variables, which may not always correlate with the individuals being asked.
Communities with greater than 30 survey respondents for the Digital Divide Survey were aggregated and selected as valid in the following assessment and execution plan. Other variables of partitioning can be used, but the number 30 was used as it created a good marker for the communities in which data were collected.
The data collected from the baseline Digital Divide Survey of the communities was and can be used as a baseline analysis to shrinking the Digital Divide in Trinidad and Tobago. The data offer a catalyst for The Telecommunication Authority of Trinidad and Tobago to develop informed interventions over time. TATT is advised to develop an entry strategy into a few communities. We selected Santa Cruz and California communities as example communities. Santa Cruz and California both show high Internet utilization rates and access to technologies such as computers and mobile phones. However, both communities also display lower access to the Internet at home despite having access to computers and mobile phones. Further analysis is carried out below.
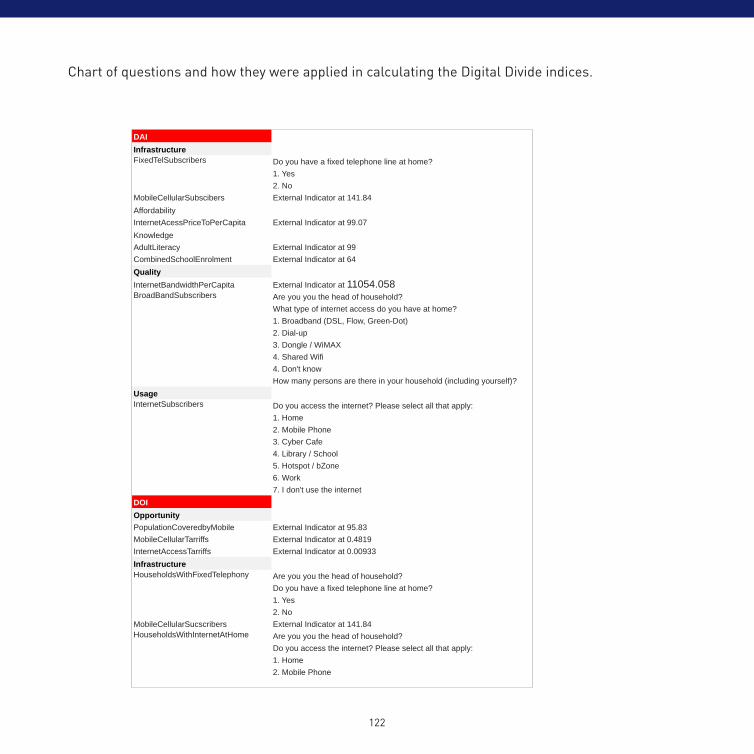
122
Chart of questions and how they were applied in calculating the Digital Divide indices.
DAIInfrastructure
Do you have a fixed telephone line at home?1. Yes2. No
MobileCellularSubscibers External Indicator at 141.84AffordabilityInternetAcessPriceToPerCapita External Indicator at 99.07KnowledgeAdultLiteracy External Indicator at 99CombinedSchoolEnrolment External Indicator at 64QualityInternetBandwidthPerCapita External Indicator at 11054.058
Are you you the head of household?What type of internet access do you have at home?1. Broadband (DSL, Flow, Green-Dot)2. Dial-up3. Dongle / WiMAX4. Shared Wifi4. Don't knowHow many persons are there in your household (including yourself)?
UsageDo you access the internet? Please select all that apply:1. Home2. Mobile Phone3. Cyber Cafe 4. Library / School5. Hotspot / bZone6. Work7. I don't use the internet
DOIOpportunityPopulationCoveredbyMobile External Indicator at 95.83MobileCellularTarriffs External Indicator at 0.4819InternetAccessTarriffs External Indicator at 0.00933Infrastructure
Are you you the head of household?Do you have a fixed telephone line at home?1. Yes2. No
MobileCellularSucscribers External Indicator at 141.84Are you you the head of household?Do you access the internet? Please select all that apply:1. Home2. Mobile Phone3. Cyber Cafe 4. Library / School5. Hotspot / bZone6. Work7. I don't use the internet
MobileInternetSubscribers External Indicator at 30.5784 Are you you the head of household?Which of the following devices do you have at home?1. Desktop/Laptop2. Tablet3. Desktop/Laptop & Tablet4. None of the above
UtilizationInternetUsers 100FixedBroadbandSubToTotalSub External Indicator at 98.7086173MobileBroadbandSubToTotalSub External Indicator at 9.8199113IDIIctAccessFixedTelSubscribers 33.33333333MobileCellularSubscribers External Indicator at 141.84InternetBandwidth External Indicator at 11054.058
Are you you the head of household?Which of the following devices do you have at home?1. Desktop/Laptop2. Tablet3. Desktop/Laptop & Tablet4. None of the aboveAre you you the head of household?Do you access the internet? Please select all that apply:1. Home2. Mobile Phone3. Cyber Cafe 4. Library / School5. Hotspot / bZone6. Work7. I don't use the internet
IctUseDo you access the internet? Please select all that apply:1. Home2. Mobile Phone3. Cyber Cafe 4. Library / School5. Hotspot / bZone6. Work7. I don't use the internet
FixedBroadbandSubscriptions External Indicator at 16.445842785ActiveMobileBroadbandSubscriptions External Indicator at 10.855IctSkillsAdultLiteracy External Indicator at 99SecondaryGrossEnrolment External Indicator at 90TertiaryGrossEnrolment External Indicator at 11.52
HouseholdsWithComputers
HouseholdsWithInternetAccess
IndividualsUsingInternet
FixedTelSubscribers
BroadBandSubscribers
InternetSubscribers
HouseholdsWithFixedTelephony
HouseholdsWithInternetAtHome
HouseholdsWithComputers
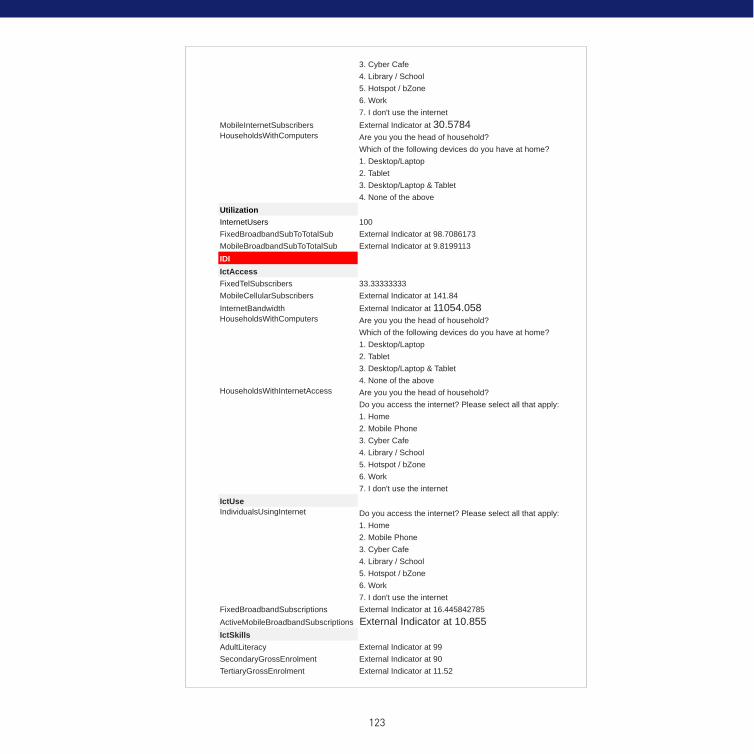
122 123
DAIInfrastructure
Do you have a fixed telephone line at home?1. Yes2. No
MobileCellularSubscibers External Indicator at 141.84AffordabilityInternetAcessPriceToPerCapita External Indicator at 99.07KnowledgeAdultLiteracy External Indicator at 99CombinedSchoolEnrolment External Indicator at 64QualityInternetBandwidthPerCapita External Indicator at 11054.058
Are you you the head of household?What type of internet access do you have at home?1. Broadband (DSL, Flow, Green-Dot)2. Dial-up3. Dongle / WiMAX4. Shared Wifi4. Don't knowHow many persons are there in your household (including yourself)?
UsageDo you access the internet? Please select all that apply:1. Home2. Mobile Phone3. Cyber Cafe 4. Library / School5. Hotspot / bZone6. Work7. I don't use the internet
DOIOpportunityPopulationCoveredbyMobile External Indicator at 95.83MobileCellularTarriffs External Indicator at 0.4819InternetAccessTarriffs External Indicator at 0.00933Infrastructure
Are you you the head of household?Do you have a fixed telephone line at home?1. Yes2. No
MobileCellularSucscribers External Indicator at 141.84Are you you the head of household?Do you access the internet? Please select all that apply:1. Home2. Mobile Phone3. Cyber Cafe 4. Library / School5. Hotspot / bZone6. Work7. I don't use the internet
MobileInternetSubscribers External Indicator at 30.5784 Are you you the head of household?Which of the following devices do you have at home?1. Desktop/Laptop2. Tablet3. Desktop/Laptop & Tablet4. None of the above
UtilizationInternetUsers 100FixedBroadbandSubToTotalSub External Indicator at 98.7086173MobileBroadbandSubToTotalSub External Indicator at 9.8199113IDIIctAccessFixedTelSubscribers 33.33333333MobileCellularSubscribers External Indicator at 141.84InternetBandwidth External Indicator at 11054.058
Are you you the head of household?Which of the following devices do you have at home?1. Desktop/Laptop2. Tablet3. Desktop/Laptop & Tablet4. None of the aboveAre you you the head of household?Do you access the internet? Please select all that apply:1. Home2. Mobile Phone3. Cyber Cafe 4. Library / School5. Hotspot / bZone6. Work7. I don't use the internet
IctUseDo you access the internet? Please select all that apply:1. Home2. Mobile Phone3. Cyber Cafe 4. Library / School5. Hotspot / bZone6. Work7. I don't use the internet
FixedBroadbandSubscriptions External Indicator at 16.445842785ActiveMobileBroadbandSubscriptions External Indicator at 10.855IctSkillsAdultLiteracy External Indicator at 99SecondaryGrossEnrolment External Indicator at 90TertiaryGrossEnrolment External Indicator at 11.52
HouseholdsWithComputers
HouseholdsWithInternetAccess
IndividualsUsingInternet
FixedTelSubscribers
BroadBandSubscribers
InternetSubscribers
HouseholdsWithFixedTelephony
HouseholdsWithInternetAtHome
HouseholdsWithComputers
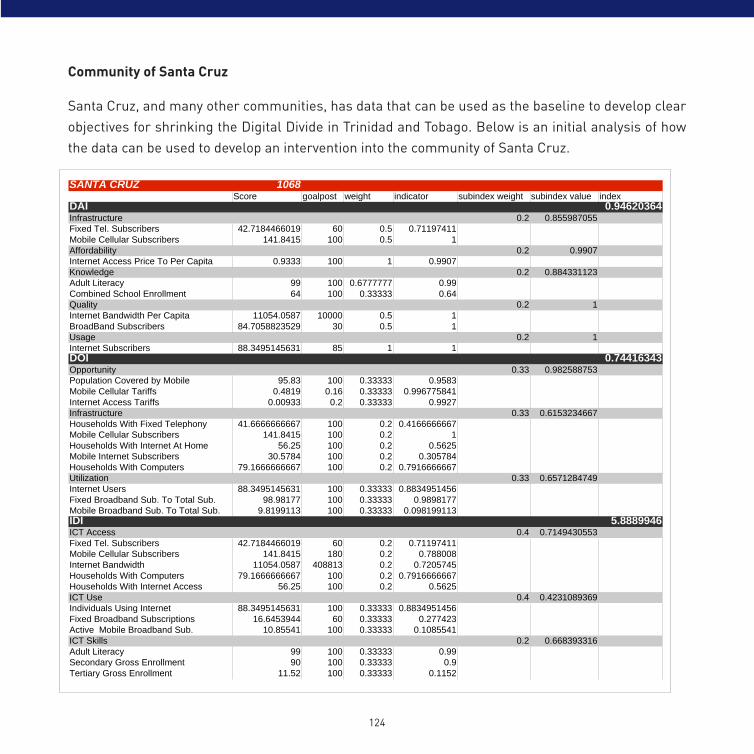
124
Community of Santa Cruz
Santa Cruz, and many other communities, has data that can be used as the baseline to develop clear objectives for shrinking the Digital Divide in Trinidad and Tobago. Below is an initial analysis of how the data can be used to develop an intervention into the community of Santa Cruz.Indices per Communities
SANTA CRUZ 1068Score goalpost weight indicator subindex weight subindex value index
DAI 0.94620364
Infrastructure 0.2 0.855987055
Fixed Tel. Subscribers 42.7184466019 60 0.5 0.71197411
Mobile Cellular Subscribers 141.8415 100 0.5 1
Affordability 0.2 0.9907
Internet Access Price To Per Capita 0.9333 100 1 0.9907
Knowledge 0.2 0.884331123
Adult Literacy 99 100 0.6777777 0.99
Combined School Enrollment 64 100 0.33333 0.64
Quality 0.2 1
Internet Bandwidth Per Capita 11054.0587 10000 0.5 1
BroadBand Subscribers 84.7058823529 30 0.5 1
Usage 0.2 1
Internet Subscribers 88.3495145631 85 1 1DOI 0.74416343
Opportunity 0.33 0.982588753
Population Covered by Mobile 95.83 100 0.33333 0.9583
Mobile Cellular Tariffs 0.4819 0.16 0.33333 0.996775841
Internet Access Tariffs 0.00933 0.2 0.33333 0.9927
Infrastructure 0.33 0.6153234667
Households With Fixed Telephony 41.6666666667 100 0.2 0.4166666667
Mobile Cellular Subscribers 141.8415 100 0.2 1
Households With Internet At Home 56.25 100 0.2 0.5625
Mobile Internet Subscribers 30.5784 100 0.2 0.305784
Households With Computers 79.1666666667 100 0.2 0.7916666667
Utilization 0.33 0.6571284749
Internet Users 88.3495145631 100 0.33333 0.8834951456
Fixed Broadband Sub. To Total Sub. 98.98177 100 0.33333 0.9898177
Mobile Broadband Sub. To Total Sub. 9.8199113 100 0.33333 0.098199113
IDI 5.8889946
ICT Access 0.4 0.7149430553
Fixed Tel. Subscribers 42.7184466019 60 0.2 0.71197411
Mobile Cellular Subscribers 141.8415 180 0.2 0.788008
Internet Bandwidth 11054.0587 408813 0.2 0.7205745
Households With Computers 79.1666666667 100 0.2 0.7916666667
Households With Internet Access 56.25 100 0.2 0.5625
ICT Use 0.4 0.4231089369
Individuals Using Internet 88.3495145631 100 0.33333 0.8834951456
Fixed Broadband Subscriptions 16.6453944 60 0.33333 0.277423
Active Mobile Broadband Sub. 10.85541 100 0.33333 0.1085541
ICT Skills 0.2 0.668393316
Adult Literacy 99 100 0.33333 0.99
Secondary Gross Enrollment 90 100 0.33333 0.9
Tertiary Gross Enrollment 11.52 100 0.33333 0.1152
124 125
Although the data is a deduction and initial insight, we conclude that further research is needed to directly assess the appropriate insights that would answer clear and grounded objectives to develop a cohesive action plan.
The data provided by the survey respondents display some key indicators that offer insight to steps that can be taken by TATT and other stakeholders.
In the community of Santa Cruz, 79% of the residents surveyed said that they had access to a computer, while 88% said they are Internet users. 45% said that they have mobile Internet access and 56% said they have Internet access at home. It is therefore necessary to deduce that there is a certain level of access in the community of Santa Cruz and cannot be solely an issue of infrastructure. There are many additional determinants that can offer insight to the low usage of Internet at home, which should be considered as well. Some of these factors can include price, familiarity with the technology, incentive to engage with the Internet, profession, and possibly age; all which can be discovered through targeted research.
126
Community of California
We observe a similar trend in the community of California. 59% of the households surveyed said they have a computer at home, while 33% said they access the Internet at home. Interestingly, 72% of those surveyed are Internet users. 72% are Internet users and 33% access the Internet at home, which means there is an inhibiting factor that reduces the access at home.
As with Santa Cruz, there can be multiple inhibiting factors such as cost, professions, or other factors that need to be assessed. Developing questions that can successfully answer these factors can be gathered from a more focused study of the community of California. After such study is conducted, TATT will be able to extrapolate the Digital Divide Survey data and the new data to develop a comprehensive intervention.
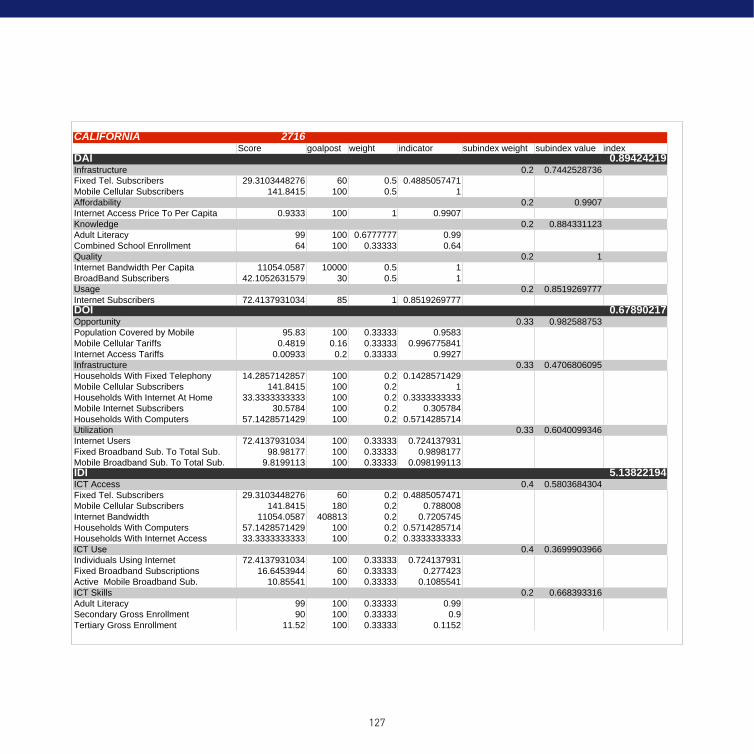
126 127
Indices per Communities
CALIFORNIA 2716Score goalpost weight indicator subindex weight subindex value index
DAI 0.89424219
Infrastructure 0.2 0.7442528736
Fixed Tel. Subscribers 29.3103448276 60 0.5 0.4885057471
Mobile Cellular Subscribers 141.8415 100 0.5 1
0.2 0.9907
Internet Access Price To Per Capita 0.9333 100 1 0.9907
Knowledge 0.2 0.884331123
Adult Literacy 99 100 0.6777777 0.99
Combined School Enrollment 64 100 0.33333 0.64
Quality 0.2 1
Internet Bandwidth Per Capita 11054.0587 10000 0.5 1
42.1052631579 30 0.5 1
Usage 0.2 0.8519269777
Internet Subscribers 72.4137931034 85 1 0.8519269777DOI 0.67890217
Opportunity 0.33 0.982588753
Population Covered by Mobile 95.83 100 0.33333 0.9583
Mobile Cellular Tariffs 0.4819 0.16 0.33333 0.996775841
Internet Access Tariffs 0.00933 0.2 0.33333 0.9927
Infrastructure 0.33 0.4706806095
Households With Fixed Telephony 14.2857142857 100 0.2 0.1428571429
Mobile Cellular Subscribers 141.8415 100 0.2 1
Households With Internet At Home 33.3333333333 100 0.2 0.3333333333
Mobile Internet Subscribers 30.5784 100 0.2 0.305784
Households With Computers 57.1428571429 100 0.2 0.5714285714
Utilization 0.33 0.6040099346
Internet Users 72.4137931034 100 0.33333 0.724137931
Fixed Broadband Sub. To Total Sub. 98.98177 100 0.33333 0.9898177
Mobile Broadband Sub. To Total Sub. 9.8199113 100 0.33333 0.098199113
IDI 5.13822194
ICT Access 0.4 0.5803684304
Fixed Tel. Subscribers 29.3103448276 60 0.2 0.4885057471
Mobile Cellular Subscribers 141.8415 180 0.2 0.788008
Internet Bandwidth 11054.0587 408813 0.2 0.7205745
Households With Computers 57.1428571429 100 0.2 0.5714285714
Households With Internet Access 33.3333333333 100 0.2 0.3333333333
ICT Use 0.4 0.3699903966
Individuals Using Internet 72.4137931034 100 0.33333 0.724137931
Fixed Broadband Subscriptions 16.6453944 60 0.33333 0.277423
Active Mobile Broadband Sub. 10.85541 100 0.33333 0.1085541
ICT Skills 0.2 0.668393316
Adult Literacy 99 100 0.33333 0.99
Secondary Gross Enrollment 90 100 0.33333 0.9
Tertiary Gross Enrollment 11.52 100 0.33333 0.1152
Affordability
BroadBand Subscribers
128
The data show the regions and communities where the differently-abled can be found and interventions can be developed. However, more accurate data was captured at the regional level due to absence of community-level data that was not entered correctly by the respondents. The community question was open-ended, and respondents entered information that could not be correlated with the region entered.
The Telecommunication Authority of Trinidad and Tobago (TATT) is advised to focus on the communities where data exists to develop a clear metric of what kinds of equipment are needed. Although the data collected in the Digital Divide Survey offer insight as granular as the communities, it is advised that further analysis and data need to be collected in these locations. As with the general digital divide, TATT is advised to choose 2 communities as a collective control group to develop interventions that would impact the differently-abled. The community of Logdenville in Chaguanas can serve as a good benchmark for TATT where the respondents who use special equipment say that they spend an average of $425 on special equipment. TATT is advised to conduct a follow-up assessment on the kinds of equipment that work for those who currently have access and use these data as metrics to guide in the decision of special equipment for those without.
TATT is also advised to develop a comparative matrix structured on location, income level, nature of disability, and price paid on special equipment. Persons/households that have indicated that they already have special equipment should be surveyed to rank the quality, cost, and efficacy of the equipment currently being used by those in need. In turn, these data can be used as a guide for assessing and recommending equipment to those in need and currently without. TATT can also use this metric to sensitize the persons-with-disabilities community, as well as their caretakers and affiliates, about the currently preferred and available brands of these equipment, and partner with the differently-abled organizations to hold workshops around products that can offer support to those who request special equipment. TATT can therefore position itself to support the development of a
128 129
market for those preferred and high-recommended brands, and petition for improved access to these products/equipment by those who need them.
TATT has a substantial amount of data collected for the Digital Divide Survey. It is advised that TATT analyze the data through more pointed dating mining approaches for additional insights that would help develop manageable goals and outcomes. It is advised that TATT use the data to develop further insights on the differently-abled and the overall country to guide the proper investment throughout the country that would help in shrinking the digital divide.
130
Immediate steps to shrinking the Digital Divide, Trinidad and Tobago.
December 2013
Using the regions and communities outlined in the Digital Divide Survey 2013, TATT has relevant data to select 2 communities to develop controlled interventions with the objective of shrinking the Digital Divide in Trinidad and Tobago. The communities should be selected and measured using other metrics outside the Digital Divide Indices that are relevant to the data from the Digital Divide Survey, but offer conclusive and grounded direction. The metrics should be developed to glean further insight to the core deficiencies present that are not captured in the Digital Divide Survey 2013. The metrics should inform TATT of tangible goals to pursue and would answer questions of access and infrastructure, defining if there is a correlation within the communities selected. Detailed research is needed about the kinds of infrastructure or interventions that would improve the communities. The interventions developed by TATT should be initiatives that are scalable and can be implemented within a 3-month window, and measured over a period of 6 – 9 months.
January 2014
From the data collected in the Digital Divide Survey, TATT will need to improvise and launch 2 initiatives in each community respectively and measure the interventions over a period of time no greater than 6 months. The monitoring and evaluation process will be used to observe the initial uptake and determine the trajectory of the uptake for scaling. Such interventions should be manageable and constructed with sufficient variables that can be measured. A measuring and evaluation initiative is relevant and will need to be decided by TATT (i.e. bi-weekly, monthly, or quarterly). Having 2 initiatives will offer TATT context and a platform to contrast between the two measures based on predetermined variables.
June 2014
Both interventions should be evaluated for sustainability and long-term objectives of closing the Digital Divide. They should be assessed based financial efficiency, digital impact, and the intervention which is scalable; considering regional context. The scaling agenda will need to follow the data from
130 131
the Digital Divide Survey 2013 and examine where the deficiencies lie and scale along the deficiencies. The data from the Digital Divide Survey 2013 will be used to guide the decision comparing the indicators throughout the country that are comparatively equal to the communities used as the control set for the initial intervention.
October 2014
The Digital Divide Survey is a great tool to get the overall success rate of the country and can be repeated to assess the overall improvements and deficiencies. Planning for the Digital Divide Survey 2015 is necessary to see how the overall country has improved based on the major interventions developed by TATT and those developed by external stakeholders. Considering that the Digital Divide Survey 2013 was conducted by mobile phone, TATT is in a position to get macro data on each individual who was surveyed in 2013 and can be surveyed in 2015. Each person can be surveyed through the database TATT has now put together, making the assessment time shorter, less costly, and more direct. TATT can develop a comprehensive understanding of the Digital Divide looking directly at the individual and household levels and comparing the data from 2013 and 2015.
Some of the insights TATT can discover by traversing the data and additional research data are the following:
Which websites and what web services are users accessing via the Internet?
How can infrequent users be converted into more active and engaged users outside access on their mobile phones?
What are the drivers for users wanting to access their Internet or broadband services?
How can users be incentivized to increase the use of technologies in their communities?
What are the inhibiting cost factors to accessing ICT services, and how can they be addressed with stakeholders?

132
132 133
References and Appendices
07
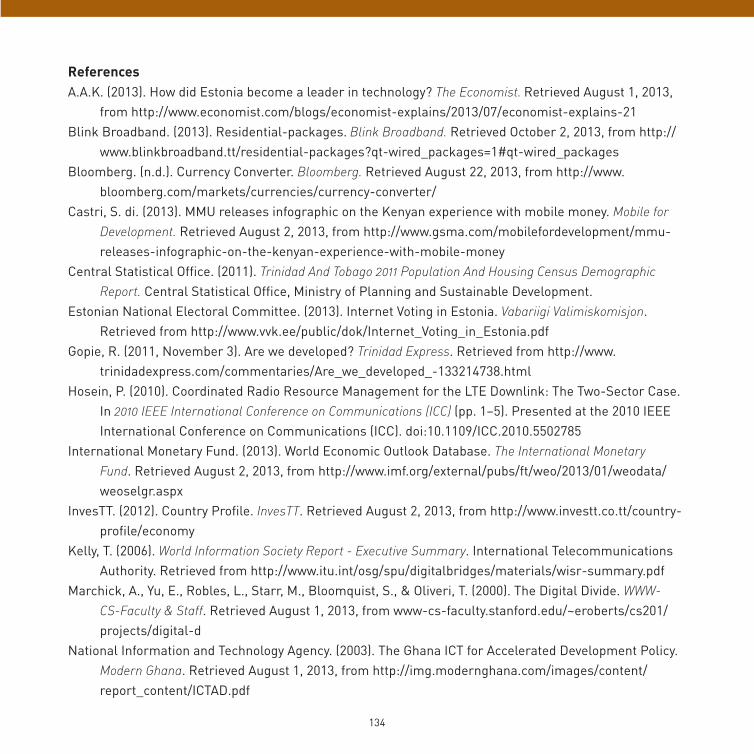
134
ReferencesA.A.K. (2013). How did Estonia become a leader in technology? The Economist. Retrieved August 1, 2013,
from http://www.economist.com/blogs/economist-explains/2013/07/economist-explains-21Blink Broadband. (2013). Residential-packages. Blink Broadband. Retrieved October 2, 2013, from http://
www.blinkbroadband.tt/residential-packages?qt-wired_packages=1#qt-wired_packagesBloomberg. (n.d.). Currency Converter. Bloomberg. Retrieved August 22, 2013, from http://www.
bloomberg.com/markets/currencies/currency-converter/Castri, S. di. (2013). MMU releases infographic on the Kenyan experience with mobile money. Mobile for
Development. Retrieved August 2, 2013, from http://www.gsma.com/mobilefordevelopment/mmu-releases-infographic-on-the-kenyan-experience-with-mobile-money
Central Statistical Office. (2011). Trinidad And Tobago 2011 Population And Housing Census Demographic Report. Central Statistical Office, Ministry of Planning and Sustainable Development.
Estonian National Electoral Committee. (2013). Internet Voting in Estonia. Vabariigi Valimiskomisjon. Retrieved from http://www.vvk.ee/public/dok/Internet_Voting_in_Estonia.pdf
Gopie, R. (2011, November 3). Are we developed? Trinidad Express. Retrieved from http://www.trinidadexpress.com/commentaries/Are_we_developed_-133214738.html
Hosein, P. (2010). Coordinated Radio Resource Management for the LTE Downlink: The Two-Sector Case. In 2010 IEEE International Conference on Communications (ICC) (pp. 1–5). Presented at the 2010 IEEE International Conference on Communications (ICC). doi:10.1109/ICC.2010.5502785
International Monetary Fund. (2013). World Economic Outlook Database. The International Monetary Fund. Retrieved August 2, 2013, from http://www.imf.org/external/pubs/ft/weo/2013/01/weodata/weoselgr.aspx
InvesTT. (2012). Country Profile. InvesTT. Retrieved August 2, 2013, from http://www.investt.co.tt/country-profile/economy
Kelly, T. (2006). World Information Society Report - Executive Summary. International Telecommunications Authority. Retrieved from http://www.itu.int/osg/spu/digitalbridges/materials/wisr-summary.pdf
Marchick, A., Yu, E., Robles, L., Starr, M., Bloomquist, S., & Oliveri, T. (2000). The Digital Divide. WWW-CS-Faculty & Staff. Retrieved August 1, 2013, from www-cs-faculty.stanford.edu/~eroberts/cs201/projects/digital-d
National Information and Technology Agency. (2003). The Ghana ICT for Accelerated Development Policy. Modern Ghana. Retrieved August 1, 2013, from http://img.modernghana.com/images/content/report_content/ICTAD.pdf
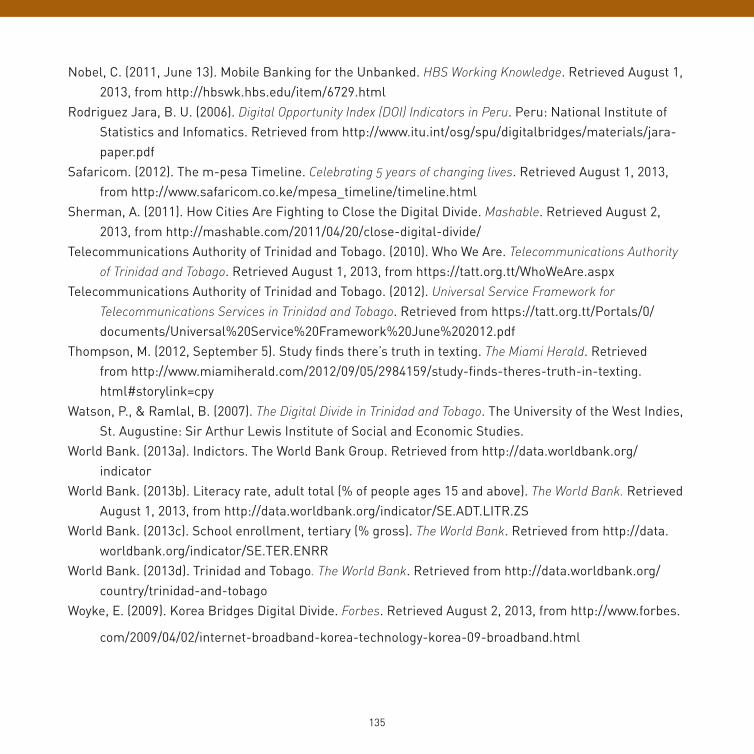
134 135
Nobel, C. (2011, June 13). Mobile Banking for the Unbanked. HBS Working Knowledge. Retrieved August 1, 2013, from http://hbswk.hbs.edu/item/6729.html
Rodriguez Jara, B. U. (2006). Digital Opportunity Index (DOI) Indicators in Peru. Peru: National Institute of Statistics and Infomatics. Retrieved from http://www.itu.int/osg/spu/digitalbridges/materials/jara-paper.pdf
Safaricom. (2012). The m-pesa Timeline. Celebrating 5 years of changing lives. Retrieved August 1, 2013, from http://www.safaricom.co.ke/mpesa_timeline/timeline.html
Sherman, A. (2011). How Cities Are Fighting to Close the Digital Divide. Mashable. Retrieved August 2, 2013, from http://mashable.com/2011/04/20/close-digital-divide/
Telecommunications Authority of Trinidad and Tobago. (2010). Who We Are. Telecommunications Authority of Trinidad and Tobago. Retrieved August 1, 2013, from https://tatt.org.tt/WhoWeAre.aspx
Telecommunications Authority of Trinidad and Tobago. (2012). Universal Service Framework for Telecommunications Services in Trinidad and Tobago. Retrieved from https://tatt.org.tt/Portals/0/documents/Universal%20Service%20Framework%20June%202012.pdf
Thompson, M. (2012, September 5). Study finds there’s truth in texting. The Miami Herald. Retrieved from http://www.miamiherald.com/2012/09/05/2984159/study-finds-theres-truth-in-texting.html#storylink=cpy
Watson, P., & Ramlal, B. (2007). The Digital Divide in Trinidad and Tobago. The University of the West Indies, St. Augustine: Sir Arthur Lewis Institute of Social and Economic Studies.
World Bank. (2013a). Indictors. The World Bank Group. Retrieved from http://data.worldbank.org/indicator
World Bank. (2013b). Literacy rate, adult total (% of people ages 15 and above). The World Bank. Retrieved August 1, 2013, from http://data.worldbank.org/indicator/SE.ADT.LITR.ZS
World Bank. (2013c). School enrollment, tertiary (% gross). The World Bank. Retrieved from http://data.worldbank.org/indicator/SE.TER.ENRR
World Bank. (2013d). Trinidad and Tobago. The World Bank. Retrieved from http://data.worldbank.org/country/trinidad-and-tobago
Woyke, E. (2009). Korea Bridges Digital Divide. Forbes. Retrieved August 2, 2013, from http://www.forbes.
com/2009/04/02/internet-broadband-korea-technology-korea-09-broadband.html
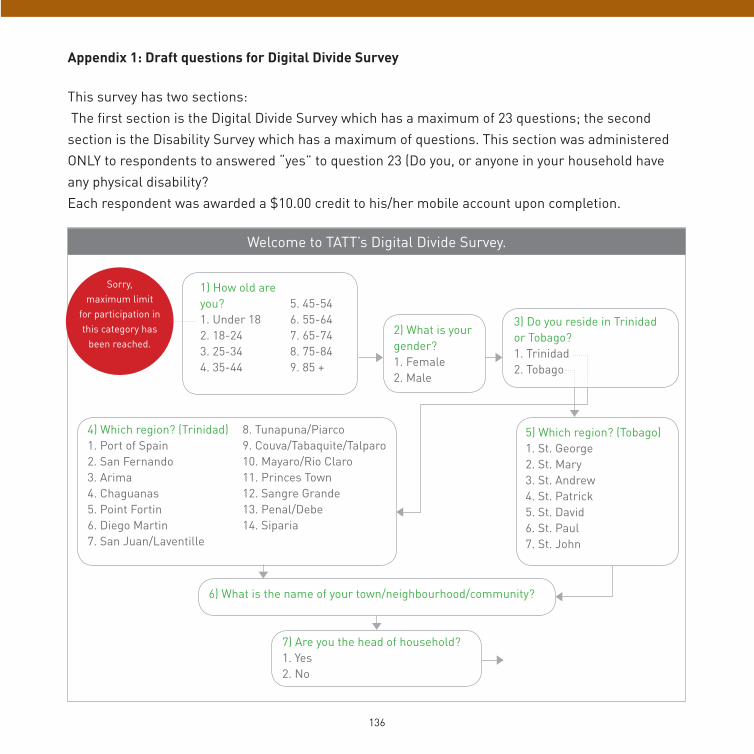
136
Appendix 1: Draft questions for Digital Divide Survey
This survey has two sections: The first section is the Digital Divide Survey which has a maximum of 23 questions; the second section is the Disability Survey which has a maximum of questions. This section was administered ONLY to respondents to answered “yes” to question 23 (Do you, or anyone in your household have any physical disability?Each respondent was awarded a $10.00 credit to his/her mobile account upon completion.
Welcome to TATT’s Digital Divide Survey.
1) How old are you?1. Under 182. 18-243. 25-344. 35-44
5. 45-546. 55-647. 65-748. 75-849. 85 +
4) Which region? (Trinidad)1. Port of Spain2. San Fernando3. Arima4. Chaguanas5. Point Fortin6. Diego Martin7. San Juan/Laventille
8. Tunapuna/Piarco9. Couva/Tabaquite/Talparo10. Mayaro/Rio Claro11. Princes Town12. Sangre Grande13. Penal/Debe14. Siparia
2) What is your gender?1. Female2. Male
3) Do you reside in Trinidad or Tobago?1. Trinidad 2. Tobago
5) Which region? (Tobago)1. St. George2. St. Mary3. St. Andrew4. St. Patrick5. St. David6. St. Paul7. St. John
6) What is the name of your town/neighbourhood/community?
7) Are you the head of household?1. Yes2. No
Sorry, maximum limit
for participation in this category has
been reached.
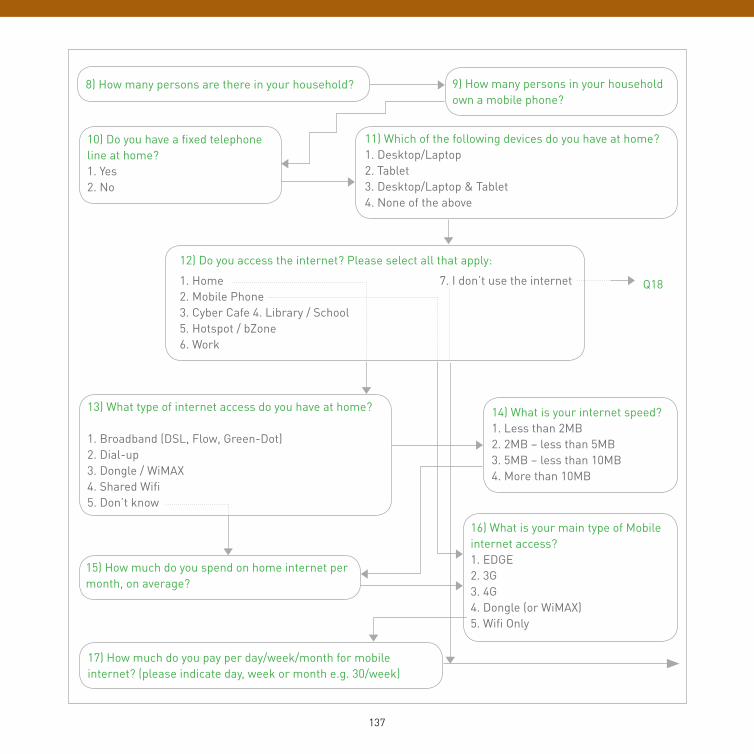
136 137
10) Do you have a fixed telephone line at home?1. Yes2. No
11) Which of the following devices do you have at home?1. Desktop/Laptop2. Tablet 3. Desktop/Laptop & Tablet4. None of the above
Q18
8) How many persons are there in your household? 9) How many persons in your household own a mobile phone?
14) What is your internet speed?1. Less than 2MB2. 2MB – less than 5MB3. 5MB – less than 10MB4. More than 10MB
15) How much do you spend on home internet per month, on average?
13) What type of internet access do you have at home?
1. Broadband (DSL, Flow, Green-Dot)2. Dial-up3. Dongle / WiMAX4. Shared Wifi5. Don’t know
16) What is your main type of Mobile internet access?1. EDGE2. 3G3. 4G4. Dongle (or WiMAX)5. Wifi Only
17) How much do you pay per day/week/month for mobile internet? (please indicate day, week or month e.g. 30/week)
1. Home2. Mobile Phone 3. Cyber Cafe 4. Library / School5. Hotspot / bZone6. Work
7. I don’t use the internet
12) Do you access the internet? Please select all that apply:
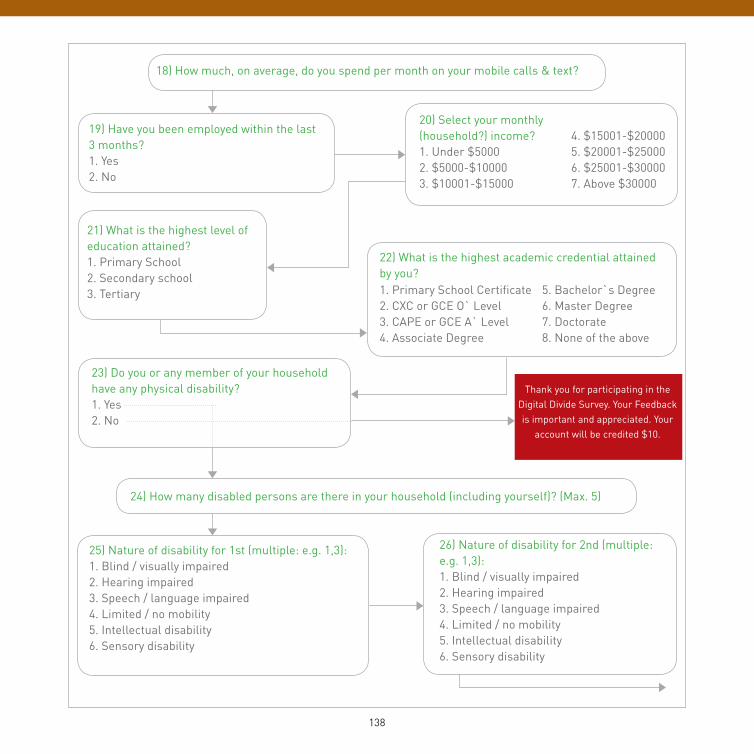
138
18) How much, on average, do you spend per month on your mobile calls & text?
24) How many disabled persons are there in your household (including yourself)? (Max. 5)
25) Nature of disability for 1st (multiple: e.g. 1,3):1. Blind / visually impaired2. Hearing impaired3. Speech / language impaired4. Limited / no mobility5. Intellectual disability6. Sensory disability
26) Nature of disability for 2nd (multiple: e.g. 1,3):1. Blind / visually impaired2. Hearing impaired3. Speech / language impaired4. Limited / no mobility5. Intellectual disability6. Sensory disability
19) Have you been employed within the last 3 months?1. Yes2. No
21) What is the highest level of education attained?1. Primary School2. Secondary school3. Tertiary
23) Do you or any member of your household have any physical disability?1. Yes2. No
20) Select your monthly (household?) income?1. Under $50002. $5000-$100003. $10001-$15000
4. $15001-$200005. $20001-$250006. $25001-$300007. Above $30000
1. Primary School Certificate2. CXC or GCE O` Level3. CAPE or GCE A` Level4. Associate Degree
5. Bachelor`s Degree6. Master Degree7. Doctorate8. None of the above
22) What is the highest academic credential attained by you?
Thank you for participating in the Digital Divide Survey. Your Feedback is important and appreciated. Your
account will be credited $10.
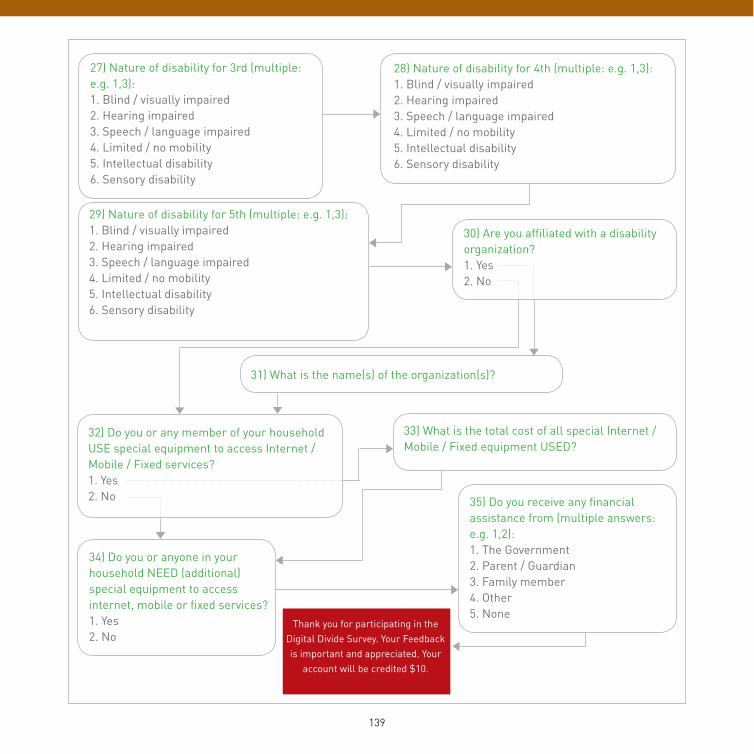
138 139
27) Nature of disability for 3rd (multiple: e.g. 1,3):1. Blind / visually impaired2. Hearing impaired3. Speech / language impaired4. Limited / no mobility5. Intellectual disability6. Sensory disability
28) Nature of disability for 4th (multiple: e.g. 1,3):1. Blind / visually impaired2. Hearing impaired3. Speech / language impaired4. Limited / no mobility5. Intellectual disability6. Sensory disability
30) Are you affiliated with a disability organization?1. Yes2. No
31) What is the name(s) of the organization(s)?
33) What is the total cost of all special Internet / Mobile / Fixed equipment USED?
29) Nature of disability for 5th (multiple: e.g. 1,3):1. Blind / visually impaired2. Hearing impaired3. Speech / language impaired4. Limited / no mobility5. Intellectual disability6. Sensory disability
32) Do you or any member of your household USE special equipment to access Internet / Mobile / Fixed services?1. Yes2. No
34) Do you or anyone in your household NEED (additional) special equipment to access internet, mobile or fixed services?1. Yes2. No
35) Do you receive any financial assistance from (multiple answers: e.g. 1,2):1. The Government2. Parent / Guardian3. Family member4. Other5. None
Thank you for participating in the Digital Divide Survey. Your Feedback is important and appreciated. Your
account will be credited $10.
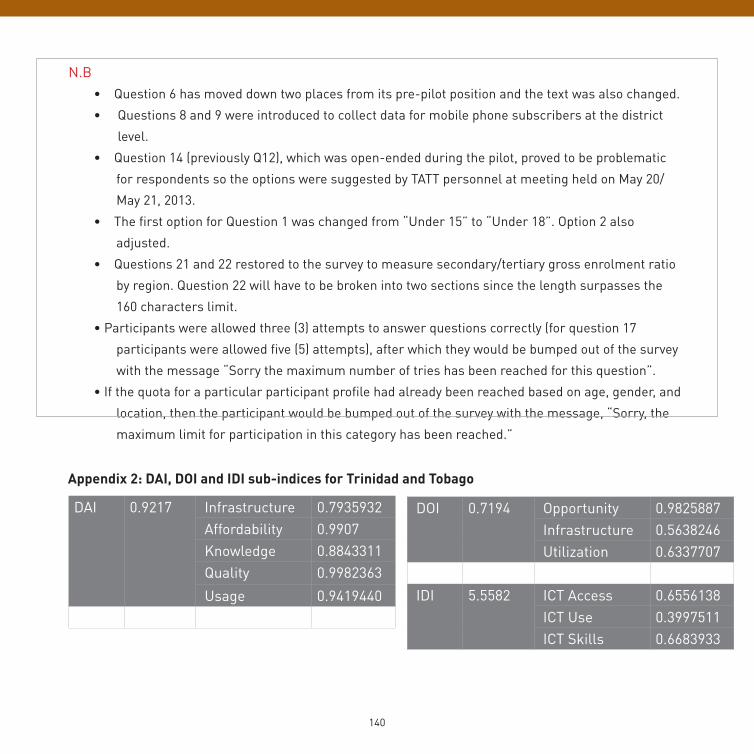
140
DAI
0.9217
Infrastructure 0.7935932 Affordability 0.9907 Knowledge 0.8843311 Quality 0.9982363 Usage 0.9419440
Appendix 2: DAI, DOI and IDI sub-indices for Trinidad and Tobago
N.B•Question6hasmoveddowntwoplacesfromitspre-pilotpositionandthetextwasalsochanged.
• Questions 8 and 9 were introduced to collect data for mobile phone subscribers at the district
level.
•Question14(previouslyQ12),whichwasopen-endedduringthepilot,provedtobeproblematic
for respondents so the options were suggested by TATT personnel at meeting held on May 20/
May 21, 2013.
•ThefirstoptionforQuestion1waschangedfrom“Under15”to“Under18”.Option2also
adjusted.
•Questions21and22restoredtothesurveytomeasuresecondary/tertiarygrossenrolmentratio
by region. Question 22 will have to be broken into two sections since the length surpasses the
160 characters limit.
•Participantswereallowedthree(3)attemptstoanswerquestionscorrectly(forquestion17
participants were allowed five (5) attempts), after which they would be bumped out of the survey
with the message “Sorry the maximum number of tries has been reached for this question”.
•Ifthequotaforaparticularparticipantprofilehadalreadybeenreachedbasedonage,gender,and
location, then the participant would be bumped out of the survey with the message, “Sorry, the
maximum limit for participation in this category has been reached.”
DOI
0.7194
Opportunity 0.9825887 Infrastructure 0.5638246 Utilization 0.6337707
IDI
5.5582
ICT Access 0.6556138 ICT Use 0.3997511 ICT Skills 0.6683933
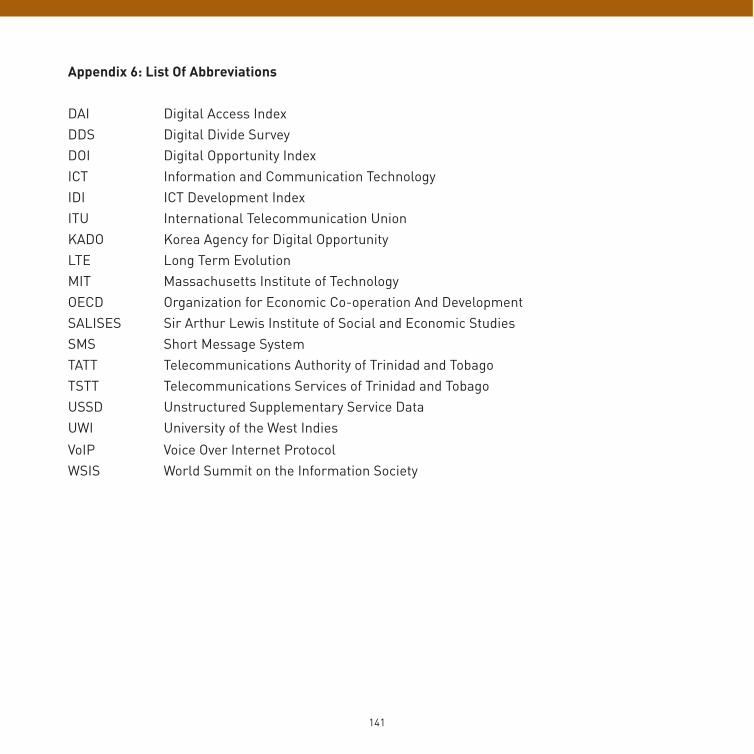
140 141
Appendix 6: List Of Abbreviations
DAI Digital Access IndexDDS Digital Divide SurveyDOI Digital Opportunity IndexICT Information and Communication TechnologyIDI ICT Development IndexITU International Telecommunication UnionKADO Korea Agency for Digital OpportunityLTE Long Term EvolutionMIT Massachusetts Institute of TechnologyOECD Organization for Economic Co-operation And DevelopmentSALISES Sir Arthur Lewis Institute of Social and Economic StudiesSMS Short Message SystemTATT Telecommunications Authority of Trinidad and TobagoTSTT Telecommunications Services of Trinidad and TobagoUSSD Unstructured Supplementary Service DataUWI University of the West IndiesVoIP Voice Over Internet ProtocolWSIS World Summit on the Information Society
142
Benefits of mobile surveys
• The data processing is real-time and reduces extra time in manual data entry and cleaning.• The branching ability the technology offers (equal of skip logic patterns in standard
questionnaires) simply ensures that the respondents are directed to the appropriate questions using the logical and axiomatic mechanisms put in place.
• The technology provides the options of either open-ended, multiple-choice responses, or all that applies. The open-ended questions have a maximum of 160 characters to get succinct feedback from the participant as needed in the Digital Divide Survey. Other conditions for response viability like integer only or alphabets are integrated to ensure systematic data.
• Surveys can be rearranged and edited spontaneously in the event of question ambiguity or any other reason only observed once the survey is active as observed in the Digital Divide Survey.
• The presence of an integrated compensation/incentive mechanism as a token of appreciation to the participant for their time once the respondent has completed the survey. Incentives work well as a feature used to facilitate the spread of information about the survey in large-scale surveys.
• Assessment and evaluation – the possibility to follow-up on past data responses expeditiously.
• The survey allows for comprehension of the demographic patterns of the country in real-time. These include ethnicity, age and even income levels.
• Environmentally sustainable - the paperless, cloud-based technology reduces the carbon footprint of executing surveys. The cloud-based technology also makes the data accessible from virtually anywhere.
• The platform allows real-time visualization tools used to understand Trinidad and Tobago based on different demographic factors and measures to put in place in an expeditious timeframe.
142 143
There are some areas that need to be considered when conducting surveys in general, which are carried over to mSurvey’s mobile survey technology from other well-known survey methodologies: • Some respondents did not complete the survey. The DDS was a particularly long survey ranging
between 23 to 25 unique questions, and depending on the number of questions presented (dependent on their responses to previous questions) to the participant some respondents experienced “survey fatigue” and failed to complete the entire survey.
• Not all prospective respondents were familiar and comfortable with texting on their mobile phones, and so may have automatically been deterred from participating.
Indices per Community
FOR MORE INFORMATION
http://msurvey.co.ke
Mobile Surveys Inc.226 W 78th Street, Suite 5ENew York, NY 10024, USA
Building 3, Fernandes Industrial Estate,Eastern Main Road, Laventille, Trinidad
#707 Muchai Drive, Nairobi, Kenya
About mSurvey
Mobile Survey Inc. (mSurvey) is a data and insights company specializing in real-time data collection and insights in emerging markets. With a focus on helping companies and organizations make better decisions, mSurvey positions itself to advise organizations on market-based decisions with real-time and pertinent data.
mSurvey works with leaders that span public and private sector, to collect some of the most vulnerable and necessary data to make decisions, using a proprietary software built to collect and aggregate data over mobile phones.
With a global team, mSurvey offers experience that spans the Caribbean, Africa and USA. mSurvey is able to gain insights into culturally sensitive areas to develop metrics that can be used to guide, track, and assess decisions over time.
mSurvey offers holistic and granular insights into micro-economies beyond traditional research methodologies.
© 2013 Telecommunications Authority of Trinidad and Tobago#5, Eighth Avenue Extension, off Twelfth Street, Barataria
Republic of Trinidad & TobagoTelephones: (868)675-8288, (868)221-8288, (868)222-8288
Fax: (868)674-1055 Email: [email protected]