
The diffusion of innovative technologies among elementary ...
182
Eastern Michigan University DigitalCommons@EMU Master's eses and Doctoral Dissertations Master's eses, and Doctoral Dissertations, and Graduate Capstone Projects 12-15-2008 e diffusion of innovative technologies among elementary and middle School teachers: Examining the relationship between access to social capital and level of technology adoption John Patrick Bayerl Follow this and additional works at: hp://commons.emich.edu/theses Part of the Education Commons is Open Access Dissertation is brought to you for free and open access by the Master's eses, and Doctoral Dissertations, and Graduate Capstone Projects at DigitalCommons@EMU. It has been accepted for inclusion in Master's eses and Doctoral Dissertations by an authorized administrator of DigitalCommons@EMU. For more information, please contact [email protected]. Recommended Citation Bayerl, John Patrick, "e diffusion of innovative technologies among elementary and middle School teachers: Examining the relationship between access to social capital and level of technology adoption" (2008). Master's eses and Doctoral Dissertations. 133. hp://commons.emich.edu/theses/133
Transcript of The diffusion of innovative technologies among elementary ...

Eastern Michigan UniversityDigitalCommons@EMU
Master's Theses and Doctoral Dissertations Master's Theses, and Doctoral Dissertations, andGraduate Capstone Projects
12-15-2008
The diffusion of innovative technologies amongelementary and middle School teachers: Examiningthe relationship between access to social capital andlevel of technology adoptionJohn Patrick Bayerl
Follow this and additional works at: http://commons.emich.edu/theses
Part of the Education Commons
This Open Access Dissertation is brought to you for free and open access by the Master's Theses, and Doctoral Dissertations, and Graduate CapstoneProjects at DigitalCommons@EMU. It has been accepted for inclusion in Master's Theses and Doctoral Dissertations by an authorized administrator ofDigitalCommons@EMU. For more information, please contact [email protected].
Recommended CitationBayerl, John Patrick, "The diffusion of innovative technologies among elementary and middle School teachers: Examining therelationship between access to social capital and level of technology adoption" (2008). Master's Theses and Doctoral Dissertations. 133.http://commons.emich.edu/theses/133

THE DIFFUSION OF INNOVATIVE TECHNOLOGIES AMONG ELEMENTARY AND MIDDLE SCHOOL TEACHERS: EXAMINING THE RELATIONSHIP BETWEEN ACCESS TO SOCIAL CAPITAL AND LEVEL OF TECHNOLOGY ADOPTION.
by
John Patrick Bayerl
Dissertation
Submitted to the College of Technology
Eastern Michigan University
in partial fulfillment of the requirements for the degree of
DOCTOR OF PHILOSOPHY
Dissertation Committee:
Dr. John C. Dugger, PhD, Chair
Dr. Sema Kalaian, PhD
Dr. Erik Lokensgard, PhD
Dr. Yichun Xie, PhD
December 15, 2008
Ypsilanti, Michigan

ii
Dedication
A work of this magnitude requires an immense investment of time, energy, and
attention. This dissertation is dedicated to those who sacrificed so much to allow me to
complete it, but most especially to my loving family, Amy and Brooke, who now get to
spend the time with me that they so richly deserve.

iii
Acknowledgments
This project would not have been possible without the help and support of many
people. I am indebted to all of them and wish to formally acknowledge their contributions at
this time.
My parents, Dr. John A. Bayerl and Gwendolyn Bayerl, taught me the importance of
education. Their love and support have inspired and guided my pursuit of higher education.
Many teachers through the years conspired to teach me to write. My high school
English teacher, Stanley Bidlack, taught me to love to write. I am forever grateful for his
gift, as they made the countless rewrites of this document not only bearable, but also fun.
Thanks are due to the Monday Night Gripers—Sean, Brian, Russ, Don, Joe, and Tom.
Your friendship, insight, and support were invaluable in facing the many obstacles I
overcame. The bonds formed in our doctoral cohort were the most valuable asset I found in
the entire program.
Dr. Polly Buchanan helped me navigate the growing pains of a new program. Her
rock solid demeanor and sage advice saw me through many difficult times.
I am deeply indebted to my doctoral committee. Without the efforts of Dr. Sema
Kalaian, I would not have been able to undertake the complex statistical analysis required by
this project. Dr. Erik Lokensgard is a man of few words. However, his advice is always
insightful, timely, and thought-provoking. I have known Dr. Yichun Xie for many years.
His continued support and encouragement is greatly appreciated.
I am forever indebted to Dr. John C. Dugger, my dissertation advisor. He believed in
me when no one else would. He saw the smallest hint of something worthwhile in my initial
proposal and helped me develop my thinking into a meaningful investigation. This project,

iv
quite literally, would never have gotten off the ground without him. I will always value the
continuing advice, support, and friendship he provided.
The contributions of my own social network can not be overlooked. The teachers,
administrators, engineers, and secretaries I work with every day are among the hardest
working, most dedicated professionals I have ever met.
My wife Amy and daughter Brooke sacrificed countless hours and most of their
vacations over the last three years as I formulated my proposal, conducted my research, and
wrote this document. Through it all, they remained positive and provided limitless
unconditional encouragement. I really couldn’t have done it without them.

v
Abstract
The purpose of this study was to examine the relationship between public school
elementary and middle school teachers’ access to social capital (the independent variable)
and their level of adoption of innovative technologies (the dependent variable). The study
was founded on both diffusion of innovations and social network theory.
Study participants were teachers from three schools, sharing two buildings in a single
school district. The initial phase of the research involved informal interviews with key
policy makers from each school, conducted for the purpose of identifying innovative
technologies present at each study site. An existing survey instrument was modified and
customized for each site to measure the study variables. Data were collected during a single
sampling date at each site. A census of all teachers was attempted, and data were collected
from 82% of possible respondents at the three schools.
The results of this phase of the study revealed that multiple innovative technologies
were present at each site. Variation existed in both the level of adoption of innovative
technologies as well as the teachers’ access to social capital at each site. These results were
consistent across subgroups based on gender, teaching assignment (academic or elective),
and grade level (elementary or middle school). A strong, positive correlation was found
between the study variables at all study sites and included nearly all the innovative
technologies. An investigation of respondents’ age, teaching experience and years assigned
to the study site revealed no significant impacts on the dependent variable.
Based on these findings, it was concluded that teachers’ access to social capital was
the primary factor impacting the level of adoption of innovative technologies at each site.

vi
Recommendations were presented including recognizing that innovative technologies exist
within schools and that the necessary knowledge, help, and support teachers require in
learning to use innovative technologies may be present within the existing social network
present in schools.

vii
Table of Contents
Page Dedication ................................................................................................................................. ii
Acknowledgments.................................................................................................................... iii
Abstract ......................................................................................................................................v
List of Figures ............................................................................................................................x
List of Tables ........................................................................................................................... xi
Chapter 1: Introduction and Background...................................................................................1
Statement of the Problem...................................................................................................... 4
Justification and Significance ............................................................................................... 5
Objective of the Research ..................................................................................................... 6
Research Questions............................................................................................................... 6
Research Methodology Overview. ....................................................................................... 8
Scope of the Study .............................................................................................................. 11
Terminology........................................................................................................................ 14
Chapter 2: Review of the Literature.........................................................................................19
Science, Technology, and Society ...................................................................................... 19
The Need for Technical Literacy ........................................................................................ 21
Historical Perspective on Technology and Education ........................................................ 22
Adoption of Technologies in Schools................................................................................. 23
Theoretical Foundations I: Diffusion of Innovations Theory............................................. 27
Diffusion of Innovations in Education................................................................................ 29
Theoretical Foundations II: Social Capital and Social Network Theory........................... 34
Social Networks and Diffusion of Innovations in Education ............................................. 35

viii
Chapter 3: Methodology ..........................................................................................................41
Research Methodology ....................................................................................................... 41
Definition of Variables ....................................................................................................... 42
Study Population, Participants, and Sampling Plan............................................................ 51
Human Subjects .................................................................................................................. 55
Instrument Development..................................................................................................... 56
Instrument Finalization and Approval ................................................................................ 62
Data Collection Procedure .................................................................................................. 62
Data Analysis...................................................................................................................... 63
Summary............................................................................................................................. 67
Chapter 4: Findings, Analysis, and Discussion .......................................................................68
Research Question 1 ........................................................................................................... 68
Research Question 2 ........................................................................................................... 71
Research Question 3 ........................................................................................................... 80
Research Question 4 ........................................................................................................... 90
Research Question 5 ........................................................................................................... 93
Research Question 6 ........................................................................................................... 94
Research Question 7 ........................................................................................................... 98
Research Question 8 ......................................................................................................... 102
Discussion......................................................................................................................... 103
Chapter 5: Summary, Conclusions, and Recommendations..................................................106
Summary........................................................................................................................... 106
Conclusions....................................................................................................................... 109

ix
Recommendations............................................................................................................. 111
Suggestions for Further Study .......................................................................................... 114
Author’s Comments.......................................................................................................... 118
Closing Remarks............................................................................................................... 120
References Cited ....................................................................................................................122
Appendices.............................................................................................................................128
Appendix A: Research Procedure Schematic ........................................................................129
Appendix B: Details of Innovative Technology Identification Meetings..............................130
Appendix C: Expert Panel Used for Validity and Reliability Analysis.................................132
Appendix D: Sample Survey Instrument ...............................................................................133
Appendix E: Protection and Use of Human Subjects in Research Certification ...................141
Appendix F: Eastern Michigan University Request for Human Subjects Approval .............142
Appendix G: UHSRC Approval of Initial Proposal ..............................................................149
Appendix H: UHSRC Approval of Revised Proposal ...........................................................150
Appendix I: Informed Consent Agreement............................................................................151
Appendix J: District Permission to Conduct Research ..........................................................153
Appendix K: Data Collection Cover Letter ...........................................................................155
Appendix L: Follow-Up E-Mail to Participants who missed the Data Collection Meeting..156
Appendix M: Final Follow-Up E-Mail to Missing Participants ............................................157
Appendix N: Statistical Charts...............................................................................................158

x
List of Figures
Page
Figure 1. Simplified version of Rodgers' (1995) model of diffusion of innovations. ............. 2
Figure 2. Diffusion of innovations in education (Zhao et al., 2002, p 6). ............................... 3
Figure 3. Research methods outline. ....................................................................................... 8
Figure 4. Overview of instrument development process....................................................... 10
Figure 5. Initial model of the research problem. ................................................................... 26
Figure 6. Model showing efforts are not effective. ............................................................... 27
Figure 7. Innovation-decision process (Rodgers, 1995, p. 163)............................................ 28
Figure 8. Rodgers’ (1995) model used to illustrate implementation process........................ 29
Figure 9. Model of innovation implementation in schools. (Zhao, et al., 2002). ................. 30
Figure 10. Model of innovative technology adoption (Rodgers, 1995; Zhao et al., 2002). ... 31
Figure 11. Characteristics of teachers as the primary factor in implementation. ................... 33
Figure 12: Social capital and expertise as significant variables. ............................................ 37
Figure 13. Simple model of technology adoption: Access to social capital and expertise. .. 39
Figure 14. Simplified innovation adoption model: Focus on the individual teacher. ............ 40
Figure 15. Representative example of a histogram for adoption data.................................... 74
Figure 16. Representative example of a histogram for access to social capital data.............. 83
Figure 17. Representative example of scatter plot: Adoption and access to social capital. .. 95
Figure 18. Rodgers (1985) innovator categories. .................................................................. 96
Figure 19. Representative histogram of possible confounding variables and adoption. ....... 99

xi
List of Tables
Page
Table 1 Factors Influencing the Adoption of Technologies in Schools ................................. 30
Table 2 Results of Frank et al. (2004) Regression Model ..................................................... 36
Table 3 Research Variables ................................................................................................... 42
Table 4 Innovator Categories ................................................................................................ 50
Table 5 Study Site Demographic Data................................................................................... 69
Table 6 Instrument Development Meeting Summary............................................................. 70
Table 7 Mean Level of Adoption of Innovative Technologies................................................ 72
Table 8 Distribution of Adoption Data by Innovative Technology........................................ 73
Table 9 Skew and Kurtosis Values for Level of Adoption Data............................................. 75
Table 10 Shapiro-Wilk W test for Normality for Level of Adoption Data. ............................ 76
Table 11 Summary of Innovator Category Data.................................................................... 77
Table 12 Reliability Coefficients for Adoption Data ............................................................. 78
Table 13 Access Social Capital by Teachers ......................................................................... 81
Table 14 Skew and Kurtosis Values for Access to Social Capital Data ................................ 83
Table 15 Shapiro-Wilks W Test for Normality for Access to Social Capital Data ................ 84
Table 16 Summary of Help Received Self-Assessment Data ................................................. 86
Table 17 Summary of Help Given Self-Assessment Data ...................................................... 87
Table 18 Summary of Social Interaction Construct Data...................................................... 88
Table 19 Reliability coefficients for adoption data................................................................ 89
Table 20 Distribution of Grouping Variables at Study Sites ................................................. 91
Table 21 Mann-Whittney U Test of Adoption Means between Groups ................................. 92

xii
Table 22 Mann-Whittney U Test of Social Capital Means between Groups ......................... 93
Table 23 Correlational Analysis: Adoption and Access to Social Capital ............................ 97
Table 24 Distribution of Potentially Confounding Variables.............................................. 100
Table 25 Correlational Analysis: Adoption and Potentially Confounding Variables ......... 101
Table 26 Significant Confounding Variables ( α = .05) ...................................................... 102

Chapter 1: Introduction and Background
Technology and education: both provide the researcher nearly limitless
possibilities for scientific inquiry. Due to the scope represented by these divergent
subject areas, a prudent researcher wishing to study technology and education must strive
to both narrowly focus and clearly define a specific area of interest. One promising area
of inquiry that requires such focus and definition centers on teachers and their use of
innovative technologies in the classroom.
One foundational work on the topic was the book Teachers and Machines: The
Classroom Use of Technology since 1920 by Larry Cuban (1986). This work chronicled
the adoption of several key educational technologies in the 20th century, including film,
radio, television, and classroom computers. Cuban’s findings are often cited as evidence
that such efforts ultimately prove unsuccessful and that classroom technologies are often
underutilized by the American educational system (see Cuban, Kirkpatrick, & Peck,
2001; Frank, Zhao & Borman, 2004; Loveless, 1996; Zhao & Frank, 2003; Zhao, Pugh,
Sheldon, & Byers, 2002). More recently, empirical research studies have provided
support for these findings (Cuban, Kirkpatrick and Peck, 2001; Smerdon, Cronen,
Lanahan, Anderson, Iannotti, and Angeles, 2000; United States Congress, Office of
Technology Assessment (OTA), 1995; Wells & Lewis, 2005).
After acknowledging that this lag in technology adoption exists, current theory
can be examined to provide insight into the problem. In general, problems that deal with
the acquisition, adoption, and spread of technologies within organizations form a body of
knowledge referred to as diffusion of innovations theory. In one seminal work from this
body of knowledge, Rodgers (1995) defined diffusion of innovations as “the process by

2
which an innovation is communicated through certain channels over time among the
members of a social system” (p. 5). He also acknowledged that “getting a new idea
adopted, even when it has obvious advantages, if often very difficult” (p. 1). Rodgers
understood that some systematic process must act in determining whether a particular
innovation is eventually adopted or rejected. His “innovation - decision process” (p. 63)
attempted to model the steps by which an innovation progresses in stages from
introduction to final implementation. A more complete discussion of Rodgers’ model is
included in Chapter 2 of this dissertation. Figure 1 presents a much simplified version of
Rodgers’ model.
Figure 1. Simplified version of Rodgers' (1995) model of diffusion of innovations.
Rodgers not only provided an outline of the diffusion process, but also suggested
that several factors contributed to that process. As such, his model serves as a sound
theoretical foundation for further research on diffusion as it pertains to modern education.
Professor Yong Zhao from Michigan State University, along with his colleagues and co-
authors, has built upon this foundation in an attempt to create a broader understanding of
the diffusion of innovations in education.
Zhao, Pugh, Sheldon, and Byers (2002) set out to “identify factors that facilitate
or hinder teachers' use of innovative technology in their classroom” (p. 484). In
Contributing Factors
Contributing Factors
Contributing Factors
Stages of the Adoption Process Eventual
Adoption of Rejection of Innovation

3
identifying 11 such factors grouped into three categories, they were able to adapt
Rodgers’ model within the context of education. Building on this knowledge, Zhao and
Cziko (2001) drew from the field of sociology and perceptual control theory (PCT) in
order to examine these categories and suggested that characteristics of the individual
teacher may be more significant than other factors in the adoption of innovative
technologies in schools.
With a focus on characteristics of teachers identified as important, Frank, Zhao,
and Borman (2004) set out to empirically model the diffusion process when they
explored the adoption of computer technology in schools. To do so they drew heavily
upon the field of social network analysis (see Grootaert, Narayan, Nyhan-Jones, &
Woolcock, 2004; Van Duijn and Vermunt, 2006). Their analysis involved creating a
comprehensive, complex model to explore the interrelation of factors contributing to the
eventual adoption (or rejection) of these technologies (Figure 2).
Figure 2. Diffusion of innovations in education (Zhao et al., 2002, p 6).

4
Emerging from their model were two significant factors used to predict the
adoption of computers in schools: teacher expertise and access to social capital—both
characteristics of individual teachers as predicted by Zhao and Cziko (2001).
Frank et al. defined social capital as teachers’ “access to expertise through help
and talk” (p.12) and also noted that “social capital is observably manifest when one actor
allocates resources to another through interaction that is not formally mandated” (p. 13).
These authors acknowledged that their model was “somewhat exploratory in
nature” (p. 9) and suggested that further research needed to be conducted in order to both
more deeply examine these factors and identify methods that could be used by change
agents when applying this knowledge towards an eventual solution to the problem.
Arising from these conclusions is an implied need to empirically examine the relationship
between teachers’ access to social capital as it relates to the adoption of innovative
technologies in schools.
Statement of the Problem
Educational technologies represent an enormous investment of scarce resources
(Johnson, 2006). The problem is that, despite being given adequate access to new,
innovative, and emerging educational technologies (U.S. Congress OTA, 1995; Wells &
Lewis, 2006), teachers in the United States are slow to integrate these expensive
innovations into their day-to-day practice (Cuban, 1986; Cuban et al., 2001).
Both diffusion of innovations theory (Rodgers, 1995) and social network theory
(Frank, Zhao and Borman, 2004) have been used to explore the process of technology
adoption in schools in an attempt to examine this problem. These and other studies (see

5
Zhao and Cziko, 2001; Zhao, Pugh, Sheldon, and Byers, 2002) have identified many
potential factors that may impact the rate of adoption of new technologies. As these
factors are studied, the most promising factor appears to be related to teachers’ “access to
social capital.” Therefore this study focused on empirical exploration of the link between
“access to social capital” and adoption of innovative technologies in schools as a
potential means for addressing the observed lag in adoption of those technologies.
Justification and Significance
Much has been written about the need for a technically skilled workforce in the
United States (Cutcliffe, 2000; Kleinman, 2000a; Pearson and Young, 2002; Pool, 1997;
Yager, 2002). In No Child Left Behind, President George W. Bush (2001) wrote, “The
Administration believes schools should use technology as a tool to improve academic
achievement” (p. 22). According to the United States National Center for Education
Statistics (Snyder, Tan and Hoffman, 2005) over 99% of all United States classrooms are
currently equipped with classroom computers and access to the internet. Additionally,
according to the United States Department of Education website (www.ed.gov), the 2008
budget for educational technology is $273.1 billion.
Based on this massive investment, one might assume that all teachers in the
United States would not only have access to current technologies but also use them in
their daily practice. It might be debated whether this investment is appropriate, the
technologies chosen meet specific needs, or even if students benefit from such
investment. However, these and other arguments are predicated on the assumption that
these technologies are actually used by teachers. Unfortunately, as discussed previously,
this is often not the case.

6
Therefore, research that seeks to more fully understand factors that contribute to
the lag in adoption of innovative technologies and that might lead to a solution to the
problem is not only academically relevant but also socially responsible and fiscally
prudent.
Objective of the Research
As evidenced above, technology adoption in schools is a phenomenon influenced
by many complex and inter-related factors (Frank et al., 2004; Rodgers, 1995; Zhao et al.,
2002). This dissertation examined a single one of these factors—teachers’ access to
social capital—and explored whether or not a relationship existed between this factor and
rate of adoption of innovative technologies by teachers in three independent school
settings. Furthermore, this study examined several potential confounding variables and
their effect on that relationship.
Research Questions
Based on the work done with social networks by Frank et al. (2004), one variable
was identified that promised to shed more light on the problem of adoption of innovative
technologies by teachers in schools. These authors purported that it is possible to define
adoption of an innovative technology as “the degree to which teachers report using that
technology” (p. 11). Social capital was also defined as “the degree to which teachers
report access to training, help and support in using those technologies from other
teachers” (pp. 14-15). The potential relationship between social capital and adoption was
the focus of the study.

7
The study examined the level of adoption of innovative technologies and access to
social capital by teachers in two public school settings, as well as explored the effect of
several potential confounding variables by seeking answers to the following questions:
1. What technologies that may be labeled as innovative existed in each study
setting?
2. What was the current level of adoption of these innovative technologies by
teachers in each study setting?
3. What was the level of access to social capital by the teachers in each study
setting?
4. Did various sub-groups of teachers based on gender (male versus female),
assignment (academic versus elective), or grade level (elementary versus
middle school) exhibit different levels of adoption of innovative technologies?
5. Did various sub-groups of teachers based on gender (male versus female),
assignment (academic versus elective), or grade level (elementary versus
middle school) exhibit different levels of access to social capital?
6. Did a relationship exist between teachers’ access to social capital and level of
adoption of innovative technologies in the study setting?
7. Did a relationship exist between several potentially confounding variables
(age, experience, on-site experience) and level adoption of innovative
technology by teachers in the study setting?
8. What was the relationship between level of adoption of innovative
technologies and access to social capital by teachers controlling for any
confounding variables identified in questions 5-7 above?
8
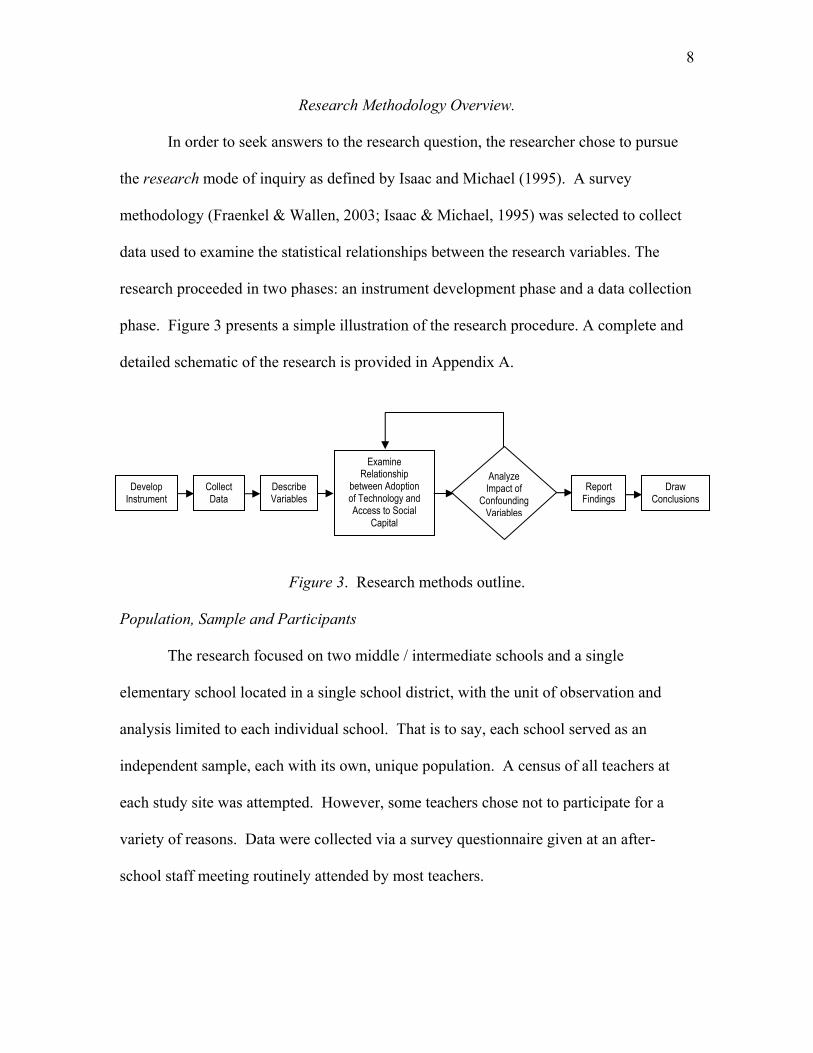
Research Methodology Overview.
In order to seek answers to the research question, the researcher chose to pursue
the research mode of inquiry as defined by Isaac and Michael (1995). A survey
methodology (Fraenkel & Wallen, 2003; Isaac & Michael, 1995) was selected to collect
data used to examine the statistical relationships between the research variables. The
research proceeded in two phases: an instrument development phase and a data collection
phase. Figure 3 presents a simple illustration of the research procedure. A complete and
detailed schematic of the research is provided in Appendix A.
Figure 3. Research methods outline.
Population, Sample and Participants
The research focused on two middle / intermediate schools and a single
elementary school located in a single school district, with the unit of observation and
analysis limited to each individual school. That is to say, each school served as an
independent sample, each with its own, unique population. A census of all teachers at
each study site was attempted. However, some teachers chose not to participate for a
variety of reasons. Data were collected via a survey questionnaire given at an after-
school staff meeting routinely attended by most teachers.
Develop Instrument
Collect Data
Examine Relationship
between Adoption of Technology and Access to Social
Capital
Analyze Impact of
Confounding Variables
Draw Conclusions
Describe Variables
Report Findings

9
Phase 1: Instrument Development and Customization
The need to include innovative technologies unique to each study site made it
impossible to identify an existing survey instrument. Therefore a survey questionnaire
was adapted from an existing instrument (Frank et al., 2002), customized to each study
site and validated as part of the research.
In order to develop these custom instruments, key policy makers (administrators,
lead teachers, media specialists, technicians, etc.) were interviewed at each site in order
to identify several key innovative technologies present in each building. From this pool
of information, specific innovative technologies identified were pared down to three or
four items that served as the innovative technologies studied in each setting. Details of
the interview process are included in Appendix B. A questionnaire was then developed
and evaluated for content validity and readability by a panel of experts familiar with the
research on technology and education and/or research methodologies (Appendix C).
Based on feedback from the panel, the questionnaire was further modified until the
finalized version was submitted to the University Human Subjects Review Committee
(UHSRC) for final approval before commencing with data collection. Figure 4 is an
overview of the instrument development process.

10
Researcher Key Policy Makers Pilot Study Group Expert Panel UHSRC
Figure 4. Overview of instrument development process.
Phase 2: Data Collection and Analysis
Information collected during the instrument development phase of the research
included identifying innovative technologies present at each site (research question #1).
Information collected via the survey questionnaire included data used to assess the level
of adoption of innovative technologies by each teachers as well as their access to social
capital (research questions #2, #3 and #6). Additionally, data were collected to examine
these variables among several subgroups based on gender (male or female) and
curriculum assignment (academic or elective classes; research questions #4 and #5). Last,
data were collected in order to evaluate the potential effect of several possible mediating
or confounding variables on the relationship between level of adoption and access to
social capital (research questions # 7 and #8). These included the teachers’ age,
Site Selection
Collect Supporting
Documentation
Identify Innovative Technologies at Site
Select Three Innovative Technologies for Study
Develop Questionnaire
Review Questionnaire for Content Validity
Modify Questionnaire
Finalize Questionnaire
Final Approval of Questionnaire
Review Questionnaire for
Readability
Repeat As Needed
Review Related Literature

11
experience (total years teaching) and on-site experience (years teaching in the study
setting).
A variety of statistical techniques and methods were used during the research
study. Data were described using measures of central tendency, including mean, median,
and mode. Variation was described using standard deviation. Furthermore, skewness,
kurtosis and Shapiro-Wilks W were calculated to assess the normality of the variables.
Finally, Chronbach’s alpha (α) was calculated to assess the reliability of the custom
instruments in measuring the study variables.
To detect differences between sub-groups, the non-parametric Mann-Whittney U
test was was employed. In order to detect relationships between the study variables,
Spearman’s rho was used to evaluate a correlation coefficient (rs). Last, the researcher
intended to evaluate the effect of mediating variables using partial correlation or multiple
regression techniques. However, since no significant confounding variables were
identified during the study, no such analysis was undertaken.
Scope of the Study
Despite narrowing the focus of the study to level of adoption of innovative
technologies and access to social support in using technology (social capital) by teachers
in schools, the topic remained fairly broad. Therefore, the study was bound by a variety
of factors, some imposed by the researcher for reasons of practicality and feasibility,
others inherent to the study of phenomena in organizations run by complex social,
political, and economic realities.

12
Delimitations
Every school in the study might have adopted different innovative technologies
and might have a different interpretation of what constituted such a technology.
Likewise, the complex social networks in each school might also have demonstrated
significant differences between study sites. Therefore, the unit of analysis for this study
was the teachers in three schools located in a single school district. Because of the
potential differences in settings and innovative technologies, the unit of observation for
the study was the individual teacher. As such, the data collected during the attempted
census of each school represented a unique population, each with its own, unique results.
While these samples could not be combined and the results could not be applied to the
larger population, such a sampling plan did allow for comparison of results across
multiple populations for the purpose of establishing some degree of practical
transferability of results.
Because there could have been any number of technologies present in each
building, which may or may not have been considered innovative, the study examined
only a small selection of technologies accessible to all teachers and identified as
innovative by key policy makers at the school. Detailed descriptions of the methods used
to select these technologies are spelled out in the methodology section.
Because the study is focused on technology adoption by teachers, the study
sampled only certified teachers and not teaching assistants, administrators, support
personnel, substitute teachers, paraprofessionals, tutors, and so on.
In order to examine patterns of technology usage, the study evaluated such usage
during the Fall semester of 2007 with data collection occurring during the beginning of

13
Spring semester 2008. This time frame represented approximately 90 days of instruction.
Data collection occurred during mandatory, bi-weekly staff meetings. The time frame for
data collection was the beginning of the Spring 2008 semester. Based on the school
calendar, this represented a maximum of only three or four opportunities available for the
purpose of data collection during the study.
Since district and building approval was necessary, as well as cooperation of
administration and teachers at each study site, the study was limited to those schools that
both volunteered to participate and were able to meet the scheduling demands required by
the study. Last, due to practical considerations, data collection and analysis methods
were selected based on what could reasonably be completed given the available
resources, time, and participants at the time of the study.
Limitations.
Unfortunately, the diffusion of innovative technologies in schools remains a
complex phenomenon. Therefore, multiple, confounding variables, both identifiable and
hidden, emerged as the study progressed.
Because the study focused on individual teachers in the three schools, the
statistical results were ultimately transferable only to that school and not statistically
generalizable to the broader population of teachers and schools. However, repetition of
the study in three schools was conducted in an attempt to reveal patterns of result and
potentially provide a broader, practical validity to the study.
Since the technologies used in every school district are unique, no pre-existing
instrument could be located that accurately assessed the unique technology usage in that
district, nor the technology expertise or social capital characteristics of each staff.

14
Therefore, an instrument had to be developed and validated as part of the study. Such
efforts may inherently suffer from issues of validity and reliability when compared to
more established but less useful instrumentation.
Since schools have limited numbers of staff members, small sample sizes were to
be expected. This problem was compounded when looking at sub-groups within
teachers, limiting both the potential confounding variables that could be studied, and the
statistical power of the findings.
Due to the use of survey methods and the specifics of the plan for data collection,
data could only be collected at a single school at a time. Also, because the data collection
was conducted at bi-weekly staff meetings, no more than two data collections could be
completed per month. Outside obligations of the study facilities (staff meetings,
professional development, achievement testing) also necessitated a narrowing of potential
days that data collection could be conducted Finally, since the data collection was
focused on the first semester of the 2007-2008 school year, the data collection had to be
completed early in the second semester. Due to these scheduling constraints, only three
sites were able to be evaluated.
Last, since the study was conducted in the school district in which the researcher
was employed as a teacher (although in high school magnet program off-site from the
other high schools), issues of researcher bias may cast doubt on the validity and
interpretation of the results.
Terminology
In order to examine any relationship between levels of adoption of innovative
technologies in education and teachers’ access to social capital, precise definitions of

15
several key terms are necessary. Doing so not only avoids confusion, but also guides the
reader through the methodology used to seek answers to the research questions. Each of
these terms was drawn from the literature on diffusion of innovation in the context of
education. Descriptions of the specific technologies examined in the study are also
included in this section.
Innovation
Rodgers (1995) defined an innovation as “an idea, practice, or object that is
perceived as new by an individual or other unit of adoption” (p. 11). Such ideas,
practices, and objects had to be identified at the study site in concert with policy makers
(principals, media specialists, lead teachers, etc.) in order to select an appropriate
technology or technologies for the study. Since a single technology may be intended for
multiple purposes, many of these technologies were described in terms of their intended
use. For instance, a PDA might be used for taking attendance, but also used by students
for collection of lab data.
Diffusion of innovations
Rodgers (1995) defined diffusion of innovations as “the process by which an
innovation is communicated through certain channels over time among the members of a
social system” (p. 5). Since the study assumed that certain innovative technologies
existed at each study site, diffusion of those innovative technologies was evidenced by
the use of those technologies by teachers, who served as the members of the school social
system. Furthermore, the social network at each study site was used to examine the level
of adoption of innovative technologies through the communication of ideas by members
of the social network.

16
Adoption of technology
Frank et al. (2004) defined adoption of innovative technologies “in terms of the
number of occasions on which teachers used computers for five [educational purposes]”
(p. 11). While these authors used computers as their innovative technology, this same
definition served to assess the level of adoption of the innovative technologies identified
during the instrument development process (discussed below).
Social Capital
Grootaert, Narayan, Nyhan-Jones and Woolcock (2004) defined social capital as
“the resources (such as information, ideas, support) that individuals are able to procure by
virtue of their relationships with other people” (p. 3). Frank et al. (2004) contributed,
“Social capital is observably manifest when one actor allocates resources to another
through interaction that is not formally mandated” (p. 13). They then operationalized this
variable by asking each teacher to name whom they had received help using computers
from, as well as to whom they had provided such assistance. Based upon Frank et al.’s
methodology, access to social capital was measured by determining the number of
occasions on which a participant interacted with other participants in terms of help
received and help given.
Document Camera (ELMO )(Site 1, Technology 1)
These referred to a digital camera attached to the teachers’ computers as
peripheral devices. When coupled with an LCD projector, this technology allowed
teachers to record and project papers, books, and other items onto the screen where they
can easily be viewed by students. These devices are the digital analog to an overhead or
opaque projector. At Site 1, they were available in every classroom.

17
Computer Labs (All Three Sites, Technology 2)
At Site 1, this term referred to both fixed (desktop) and mobile (laptop)
computers, while at Sites 2 and 3, it referred only to the mobile (laptop) computers. In
both cases, the instrument specifically referred to those computers that (a) were intended
for student use (b) were available in class sets (30 computers) and/or (c) were able to be
signed out by teachers to use with their classes.
Digital Cameras and Video Cameras (Site 1, Technology 3)
These referred to portable electronic devices capable of recording still images
(digital cameras) or video (video cameras). In both cases, the media is stored in
electronic form and can be downloaded to a computer to use in presentations, papers, and
student projects. Teachers at Site 1 had access to several of each through the media
center where they were available for use on a shared basis.
LCD Projectors (Site 1, Technology 4)
These referred to electronic devices capable of receiving a digital image from the
teacher’s computer and projecting it to a large screen. At Site 1, they are available in
every room in conjunction with the document cameras. The survey instrument specified
that teachers were to consider uses of the LCD projects not to include use with the
document camera.
Promethean Boards (Site 2 and 3, Technology)
These are digital whiteboards interfaced to a teacher computer. They also include
an integral LCD projector and student interface devices that allow students to “vote” or
“answer test questions.” Software included allows teachers to record and project their
notes, survey and test students, and present interactive demonstrations to teachers.

18
Approximately half of the teachers at Site 2 had one in their room, and the remaining
teachers (as well as those at Site 3) had access to several on a shared basis by checking
them out of the media center.
Dukane DVD/VHS System (Site 2 and 3, Technology 2)
This was an integrated classroom video monitor, cable television, and media
playback system available in all rooms at all study sites. It also includes the district
emergency notification system, although this use was beyond the scope of the study.
These monitors are used to play DVDs and video tapes in the classroom. However, this
requires teachers to give the movie to the media specialist and then access the media
though the monitor in their classroom using a remote control. Teachers may also access
cable television, audio recordings, and closed circuit television broadcasts.

19
Chapter 2: Review of the Literature
E. F. Schumacher (1973) wrote that “No civilization, I am sure, has ever devoted
more energy and resources to organized education, and if we believe nothing else, we
certainly believe that education is, or should be, the key to everything” (p. 84). While it
is impossible for a single person to comprehend the complexity of the educational system
in its entirety, it is possible to work one’s way down from broad generalizations of and
about education to exacting examinations of the selected issues and specific topics
contained within the literature. In such a manner it is possible to carve out a unique and
well defined problem, suitable for further study.
Science, Technology, and Society
Before the nexus of technology and education can be examined, it is necessary to
frame one’s inquiry in the ongoing debate on the role science and technology play in our
culture. The literature from the field of Science, Technology, and Society (STS) is filled
with such discourse on the cultural role of technical literacy.
Cutcliffe (2000) outlined constructivism as one of the core concepts of STS with
the following discussion:
First and foremost STS assumes scientific and technological developments to be
socially constructed phenomena. That is, science and technology, including the
content of the former, are inherently human, and hence value-laden, activities
which are always approached and hence understood through our senses. This
does not deny the ‘constraining’ order of nature, but it does entail a recognition
that our understanding of nature and our development of technology are socially
mediated processes (p. 138).

20
Therefore, the researcher who desires to study some aspect of technology must
also consider the contribution of social factors in framing their inquiry.
Bijker (2001) further observed that “We live in a technological culture—in a
culture that is thoroughly influenced by modern society and technology” (p. 20) as well
as “…all who live in this culture…have an obligation to try to understand the
technological culture” (p. 21). In arguing the constructivist perspective of the debate,
Bijker purported that such understanding was essential in a democratic society dependent
on, and shaped by, the products of science and technology. Without this knowledge, he
argued, citizens are not able to effectively participate in an informed manner when
guiding technology policy.
Kleinman (2000a) added “…the boundary between the technical and non-
technical—the scientific and the social—is not intrinsic or natural, but the outcome of
sociohistorical [sic] processes” (p. 159). In doing so, he suggested that citizens of a
democracy must obtain technical knowledge in order to integrate new technologies into
our culture. In defining technology as “the knowledge and processes use to create and to
operate artifacts,” Pearson and Young (2002, p. 13) hinted at the important role education
must play in producing such a technologically literate populace.
Schumacher (1973) spoke to the intrinsic human desire for education when he
wrote:
When people ask for education they normally mean something more than mere
training, something more than mere knowledge of facts, and something more than
a mere diversion. Maybe they cannot themselves formulate precisely what they

21
are looking for; but I think what they are really looking for is for ideas that would
make the world, and their own lives, intelligible to them (p. 75).
To Schumacher it was this drive to understand the world that gave meaning and
relevance to a person’s existence and therefore provided both the ethical, morale, and
(Schumacher would argue) economic mandate for governing bodies to encourage this
pursuit among their citizenry.
McRobie (1981), a disciple of Schumacher and co-founder of the Intermediate
Technology Group (ITG), labored to put these principles into action, as evidenced by his
belief:
Can we not recognize that there is really no other choice than to create a new
technology and economic system designed to serve not a continuously escalating
spiral of production and consumption, but to serve people by enabling them to
become more productive? (p. 191)
Based upon this philosophical foundation, writers in the STS literature argue that
the ultimate role of education in our society is to produce a citizenry possessing the
requisite knowledge and skills required to fully participate in the increasingly techno-
scientific culture in which we all must live.
The Need for Technical Literacy
Volti (2002) suggested that in our modern, evolving workplace “…many
[persons] will be engaged in work activities that are unknown today” (p. 76). Volti also
observed that, while the manufacturing industry has largely switched to technology-
intensive practices, those same industries have not produced adequate numbers of high-
skilled, high-paying jobs. Pearson and Young (2002) referred to both United States

22
Department of Labor (DOL) and Department of Defense (DOD) studies that point to
shortcomings in technological skills in diverse industries including medical, education,
agriculture, the military, and certain “high-tech” industries. They also pointedly noted
that the U.S. is importing workers in these industries from other countries.
While the need for skilled workers certainly exists, Volti pointed out that the need
for technological literacy extends beyond the workplace. It may also be argued that a
technologically literate populace is an absolute requirement if there is to be democratic
participation in scientific and technology policy. Kleinman (2002b) provided many
examples of such participation ranging from AIDS activism to spreading agricultural
knowledge and even to nuclear facility policy decision making—a belief chronicled in
detail by Pool (1997).
Certainly, participants in the STS debate see the need for a technically savvy
citizenry and the role of our educational system in producing graduates with the
necessary technical skills and knowledge required to participate in our culture. The
question remains open to debate as to whether our schools are accomplishing this goal or
not.
Historical Perspective on Technology and Education
Perhaps the best known treatise on the state of our modern education system was
A Nation at Risk (The National Commission on Excellence in Education, 1983). This
brief and poignant report suggested that the United States education system was failing to
produce graduates with the skills and knowledge necessary to compete in an increasingly
global political and economic system. The report ranked United States students near the

23
bottom among developed nations in terms of the academic achievement of its high school
graduates.
According to DuFour and Eaker (1998), A Nation at Risk helped to launch an era
of massive educational reform in the United States, culminating with the current No Child
Left Behind (NCLB) legislation (see Bush, 2001; United States Congress, 2001). Because
of the increased accountability placed upon schools by NCLB, many school districts have
adopted strategic plans to meet the mandates of reform legislation (Nutt & Backoff,
1992). Many of these plans included provisions for the acquisition of educational
technologies (Lancaster & Lancaster, 2000; Rai, 2004; Shibley, 2001). Kollie (2005)
illustrated several of the potential benefits that these technologies offered, including
“improved education, productivity and efficiency for financial savings” (p. 25).
Adoption of Technologies in Schools
One foundational work on teachers’ use of technology in schools was Teachers
and Machines: The Classroom Use of Technology since 1920 by Larry Cuban (1986).
The work is often cited as evidence that classroom technologies are underutilized in the
American educational system (see Cuban, Kirkpatrick, & Peck, 1001; Frank, Zhao &
Borman, 2004; Loveless, 1996; Zhao & Frank, 2003; Zhao, Pugh, Sheldon, & Byers,
2002). Cuban’s (1986) research method involved:
…completing a review of the academic research and popular literature on the
adoption, use, and influence of classroom media since 1920. This review
included controlled experiments, impressionistic accounts, surveys, interviews,
project reports, ethnographs, and combinations of these approaches. In examining

24
this diverse body of formal and informal research, [Cuban] avoided meta-analysis
of comparable studies and concentrated on making sense of conclusions (p. 115).
While not strictly an empirical study, Cuban (1986) did offer some observations
backed with numerous examples from his historical research. When one examines these
examples, a pattern begins to emerge. He cited one study on the use of film in the high
school classrooms showing “23 percent of teachers reporting ‘Frequent’ use, 33%
‘Occasional’ and 19% ‘Never’” (p. 16.). Referring to the use of radio in the classroom,
the results were no better, with the author citing a survey showing that only “3% of rural
schools, 18% or urban schools, 8% of elementary schools and 5% of secondary schools
used the radio ‘Regularly’” (p. 23). The use of television in the classroom also appears to
have followed this pattern, with Cuban (1986) citing yet another survey showing that
“13% of elementary, 43% or junior-high, and 60% of high-school teachers reported no
use [of television] whatsoever in 1981” (p. 39). While Cuban (1986) does include
examples of successful technology adoption, he nevertheless concluded: “Such
noteworthy praise…only have underscored how rarely teachers have used machines in
their classrooms since the 1920s” (p. 51). While Cuban’s (1986) findings are arguably
based upon his interpretation of disjointed data sometimes taken out of context, recent
quantitative research studies appear to verify his assertions by showing that this lag or
failure in technology adoption does indeed exist.
In another widely cited study of teachers’ use of technology, the United States
Congress, Office of Technology Assessment (OTA; 1995) reported that “despite over a
decade of investment in educational hardware and software, relatively few of the nation’s
2.8 million teachers use technology in their teaching” (p. iii). It should be noted that this

25
study and many of those that followed focus on the use of computers and the internet in
schools when discussing the adoption of technology.
Smerdon, Cronen, Lanahan, Anderson, Iannotti, and Angeles (2000) of the
National Center for Education Statistics analyzed three national databases. These data
sources contained the results of various surveys given to both public and private school
K-12 teachers. The results of their analysis revealed that while most schools (99%)
provided access to technology for teachers and students, less than one-third of teachers
reported feeling well prepared to use technology. Cuban, Kirkpatrick, and Peck (2001)
examined two “high tech” high schools in California. Only four of the 13 teachers
studied had incorporated the teacher and student computers or internet technologies
provided in their building into their teaching practice.
Most recently, Wells and Lewis (2006) of the National Center for Education
Statistics (NCES) drew upon the Fast Response Survey System (FRSS) to examine the
use of the Internet in U.S. Public Schools between 1994 and 2005. According to the
authors, this database represented the most current and up-to-data data set available at the
time of the study. The study used a statistically representative sample of 1205 public
schools to generate statistics for the 85,000 primary and secondary public schools in the
United States. Chief among the study’s conclusions was “by fall 2005, nearly 100
percent of public schools in the United States had access to the Internet” (p. 4).
Unfortunately, this did not translate into 100% usage of these technologies by
teachers. Specifically, the study’s authors found that “83 percent of public schools with
Internet access indicated that their school or school district had offered professional
development to teachers in their school on how to integrate the use of the Internet into the

26
curriculum” (p. 10) and of these schools only “34 percent of the schools that offered
professional development in 2005 had from 1 to 25 percent of their teachers attending
such professional development …16 percent of the schools had 26 to 50 percent of their
teachers, 13 percent of the schools had 51 to 75 percent of their teachers, and 36 percent
of the schools had 76 percent or more of their teachers attending professional
development” (p. 10).
Similarly, Wells and Lewis (2006, p. 10) reported that not all schools with
internet access used them for instructional purposes, listing the reported usage with the
percentage of schools reporting such usage including providing lesson planning (89%),
providing assessment results to teachers (87%), providing digital content to the classroom
(87%), professional development (51%), and distance learning (32%).
Consistent among these studies is the fact that, while teachers have adequate
access to innovative technologies in their classrooms, those same technologies are often
not fully utilized. This supposition served as the problem for this research study. In
order to more clearly illustrate the theoretical foundations and the existing research used
to focus the inquiry into this problem, a series of graphic schematics are presented to
guide the reader. These are not, however, classical research models showing variables
and their interactions. Figure 5 is a basic illustration showing the existing relationship
between teachers’ access to technologies and their implementation of those technologies
Figure 5. Initial model of the research problem.
Adequate Access to Innovative Technologies
Low Levels of Technology Adoption by Teachers
Given Conditions Observed

27
Implicit in this statement is the idea that existing efforts to address the problem
are ineffective, as evidenced by the failure of those efforts to increase the level of usage
of technological innovations. Figure 6 incorporates this idea into the model.
Figure 6. Model showing efforts are not effective.
Theoretical Foundations I: Diffusion of Innovations Theory
To begin to examine this technology adoption problem, one should delve into the
literature on diffusion of innovations, which attempts to explain, among other things, the
process by which technological innovations are adopted by groups, organizations and
other social entities. In perhaps the seminal work on the topic, Rodgers (1995) defined
diffusion of innovations as “the process by which an innovation is communicated through
certain channels over time among the members of a social system” (p. 5). He proposed a
model he called the innovation-decision process, which can be used to explore and
explain the implementation of innovative technologies in the context of organizations
(Figure 7).
Adequate Access to Innovative Technologies
Low Levels of Technology Adoption by Teachers
Existing Efforts to Increase Teacher’s Use of Innovative
Technology
Given Conditions Process Observed Outcome

28
Figure 7. Innovation-decision process (Rodgers, 1995, p. 163).
In this model, Rodgers identified several salient factors that he felt contributed to
the decision process, including characteristics of the decision makers themselves,
characteristics of the innovation and characteristics of the workplace. It is important to
note that each of these is further subdivided into contributory factors, all of which interact
with one another as they influence the eventual adoption of rejection of an innovation.
Figure 8 places Rodgers’ innovation-decision process into the schematic of the problem.
Notice that Rodgers not only provided a model of the process by which technology
adoption decisions are made but also suggests that several factors contribute to that
process.
Knowledge Persuasion Decision Implementation Confirmation
Perceived Characteristics of Innovation 1. Relative advantage 2. Compatibility 3. Complexity 4. Trialability 5. Observability
Characteristics of Decision Making Unit 1. Socioeconomic
characteristics 2. Personality
Variables 3. Communication
behavior
Prior Conditions 1. Previous Practice 2. Felt needs /
problems 3. Innovativeness 4. Norms of social
system
Communication Channels
Knowledge Persuasion Decision Implementation Confirmation
1. Adoption Continued Adoption Later Adoption Discontinuance 2. Rejection Continued Rejection

29
Figure 8. Rodgers’ (1995) model used to illustrate implementation process.
While such a model may be useful in examining technology adoption by any
number of organizations, it is not specific to the context of education. Therefore, further
refinement of the adoption process model is required.
Diffusion of Innovations in Education
Professor Yong Zhao of Michigan State University has drawn heavily from
Rodgers in his examination of technology adoption in the context of public schools.
While Rodgers’ work was primarily theoretical, Zhao’s efforts have begun to empirically
examine diffusion of educational innovations.
Zhao, Pugh, Sheldon, and Byers (2002) set out to “identify factors that facilitate
or hinder teachers' use of innovative technology in their classroom” (p. 484) and
identified eleven salient factors that contributed to the successful integration of a
technological innovation by teachers. These factors were further loosely grouped into
three domains—the innovator (teachers), the innovation (technology) and the context (the
classroom/school; Table 1). Note that these factors are strikingly similar to those
characteristics mentioned by Rodgers.
Prior Conditions
Perceived Characteristics of Innovation
Characteristics of Decision Making
Unit
Adequate Access to Innovative Technologies
Low Levels of Technology Adoption by Teachers
Innovation-Decision Process
(Rodgers, 1995)
Given Conditions Process Observed Outcome

30
Table 1 Factors Influencing the Adoption of Technologies in Schools (adapted from Zhao et al., 2002, p. 490)
Domain Factors
The Innovator (Teachers) Knowledge of technology and its enabling conditions.
Pedagogy-technology compatibility Knowledge of the organizational and social culture of
the school.
The Innovation (Technology) Distance from school culture. Distance from available resources. Distance from innovator’s current practices.
The Context (Classroom/School) Technological infrastructure.
Human infrastructure. Organizational Culture.
From these findings, Zhao et al. (2002) set forth a preliminary model that
illustrated how these factors combine to influence the adoption of technology in schools.
Figure 9 is an illustration of their model.
Figure 9. Model of innovation implementation in schools. (Zhao et al., 2002).
Combining the work of Zhao et al. (2002) and Rodgers (1995) yields a workable
model to explain the technology adoption process in the public education settings. Figure
Innovation
Innovator Context
Successful Adoption of
Technological Innovation in the Classroom

31
10 shows a further development of the schematic showing the adoption of technology
innovations in public education using the innovation-decision process from Rodgers
(1995) as well as factors influencing the technology adoption process from Zhao et al.
(2002).
Figure 10. Model of innovative technology adoption (Rodgers, 1995; Zhao et al., 2002).
Once the factors influencing the innovative technology adoption process had been
identified, Zhao set out to examine the interaction of these factors in an attempt to more
fully understand the process by which they affect the adoption of innovations in a public
school setting. Zhao and Cziko (2001) drew from the field of sociology and perceptual
control theory (PCT) in an attempt to understand why teachers might choose not to adopt
a technology. From this framework the authors suggested that three conditions must be
met in order to ensure the use of technologies by teachers: adopting a new technology
must contribute to maintaining a higher-level goal; it must not interfere with existing
higher-level goals; and the teachers must believe that they possess the necessary skills
and resources needed to adopt the technology. Without meeting these criteria, Zhao and
Context Characteristics
(Zhao et al.) (2002)
Innovation Characteristics
(Zhao et al.) (2002)
Innovator Characteristics
(Zhao et al.) (2002)
Adequate Access to Technology Innovations.
Low Levels of Technology Adoption by Teachers
Innovation-Decision Process
(Rodgers, 1995)
Given Conditions Process Observed Outcome

32
Cziko maintained: “It is unlikely that [the teacher] will use the technology in [his/her]
teaching” (p. 21). This study suggested that characteristics of the individual may be more
important to the adoption process than those of the innovation or the school setting
Such a claim is likewise supported by the work of Schön (1983) and his concept
of the reflective practitioner, in which he contended that teaching, like many other
professions, has become so technical and complex that the only persons capable of truly
understanding the teaching profession and making meaningful changes to the practice of
teaching are the teachers themselves.
However, characteristics of the teachers should not be viewed as the only
significant contributor to implementation of innovations. Zhao et al. (2002) also
cautioned that the environment in which teachers work can not be ignored. According to
Towle (1989), ecology is “the study of relationships between organisms and their
environment” (p. 762).
Zhao and Frank (2003) used an example from the science of ecology—the
invasion of the Great Lakes by zebra mussels—as a metaphor for the implementation of
technology in schools. While the authors cautioned that their work was simply a
metaphor, they concluded that: “The ecological model took us beyond simply identifying
and correlating factors and focused our attention on interactions, activities, processes, and
practices” (p. 833). This certainly supported the supposition that further research must
focus on teachers and their interactions both with each other in the context of the school
as a workplace.
Drawing from Zhao’s work, it is possible to modify the model of innovative
technology adoption in schools to reflect these ideas. Beginning with Rodgers’ model of

33
the innovation-decision process, Zhao concluded that several factors all contribute to the
overall process that determines whether or not a particular innovation is eventually
implemented. Furthermore, Zhao illustrated that characteristics of individual teachers
may be more important that other factors in this process. Figure 11 illustrates such a
hybrid model.
Figure 11. Characteristics of teachers as the primary factor in implementation.
Drawing on these findings, it is now possible to postulate an approach to the
empirical examination of the characteristics of individual teachers in the context of their
workplace and attempt to determine the impact these factors have on the adoption of
innovations in schools. However, to do so, one must first examine the literature
surrounding the concepts of social capital and social network analysis.
Context Characteristics
(Zhao et al.) (2002)
Innovation Characteristics
(Zhao et al.) (2002)
Characteristics of Individual Teachers
(Zhao& Cziko) (2001)
Adequate Access to Technology Innovations.
Low Levels of Technology Adoption by Teachers
Innovation-Decision Process
(Rodgers, 1995)
Primary Factor
Contributing Factor Contributing Factor
Given Conditions Process Observed Outcome

34
Theoretical Foundations II: Social Capital and Social Network Theory
In order to understand social phenomenon, it is necessary to study not only the
individual participants, but also their interactions. Such a method is referred to as social
network analysis. In a brief overview of this interdisciplinary field, Van Duijn and
Vermunt (2006) suggest that:
The large interest in social networks can be understood in view of the important
theoretical and intuitively appealing research questions connected with social
networks and the challenging methodological problems associated with the
collection and analysis of social network data. This fruitful combination of
content and methodology has stimulated lots of research in the past…both aspects
of social network analysis involve theoretical as well as empirical problems,
which makes the challenge even greater and the research more rewarding (p. 2).
According to the authors, social network analysis seeks to describe, visualize, and
model the interactions (ties) between participants (nodes). These connections lead to the
development of complex statistical models aimed at empirically quantifying the variables
involved in the research questions.
One variable useful in applying social network analysis to technology
implementation in schools is social capital as described by Grootaert, Narayan, Nyhan-
Jones, and Woolcock (2004). These authors describe two definitions of social capital, the
first being more applicable to the question at hand:
[Social capital]…refers to the resources (such as information, ideas, support) that
individuals are able to procure by virtue of their relationships with other people.
These resources (‘capital’) are ‘social’ in that they are only accessible in and

35
through these relationships, unlike physical (tools, technology) or human
(education, skills) capital, for example, which are essentially the property of
individuals. The structure of a given network—who interacts with whom, how
frequently, and on what terms—thus has a major bearing on the flow of resources
through that network (p. 3).
Armed with these definitions of social capital and social network analysis, it is
possible to further develop the model of technology implementation in schools to account
for the effects of teacher social interaction in the context of the workplace.
Social Networks and Diffusion of Innovations in Education
Frank, Zhao, and Borman (2004) explored the implementation of computer
technology in schools. Their focus was on schools as social organizations, building upon
Rodgers’ theories of diffusion of innovation to include the effect of social pressure on
influencing individuals’ decisions about technology implementation. They examined
social capital as the amount of influence one teacher has on another’s use of technology,
which manifested itself as opportunities to access help from or communicate directly with
other teachers in order to problem solve, as well as peer pressure to use innovative
technologies.
The researchers set out to examine the effect of social capital compared to other,
traditional diffusion of innovation factors (see Rodgers, 1995). On his website
(http://www.msu.edu/ ~kenfrank/index.htm), Dr. Frank provided the instruments and
protocols that he used to quantitatively assess the level of technology implementation in a
school setting, as well as gather data on the impact of social capital and a variety of more
traditional contributing factors that may influence that implementation. It is important to

36
note that Dr. Frank’s purpose was to examine the use of classroom technology by
teachers using a gestalt approach. By examining all contributory factors in detail, he was
attempting to model the entirety of the phenomenon as a sum of its pieces.
Using social network theory to guide the general linear model (ANOVA and
regression), Frank et al. (2004) were able to further evaluate these factors and examine
how they interact as predictors of technology implementation by teachers. A brief
summary of their regression model is presented in Table 2.
Table 2
Results of Frank et al. (2004) Regression Model
Frank et al. (2004) reported that their regression model had a high degree of
explanatory power (R2 = .42). Furthermore, using a longitudinal measurement of these
factors (comparing these results to a preliminary study conducted the year before), the
researchers examined the changes in R2 values between social capital variables (ΔR2 =
.10) and traditional diffusion variables (ΔR2 = .08). From these results, the researchers
Independent Variable Standardized Coefficient
Statistical Significance
Own Expertise .32 p≤.001
Access to expertise through help and talk (social capital) .21 p≤.01
Perceived adequacy of physical resources (traditional diffusion) .19 p≤.01
Perceived potential of computers for teachers’ use (traditional diffusion)
.18 p≤.05
Perceived social pressure to use computers (social capital) .16 p≤.05
Class size (job conditions) -.12 p≤.05
Perceived changes in emphasis on standardized tests (job stress) -.16 p≤.05

37
concluded that, while moderate, these factors “need not have dominating effects to be an
important force for the implementation of innovations” (p. 162).
Reflecting on the work of Zhao and Cziko (2001), in which characteristics of the
teacher are the primary factors influencing the adoption of technology, it is possible to
postulate a more complete model of technology adoption in education. In this model,
personal expertise and social capital factors (themselves characteristics of the individual
teacher) provide the primary force driving the innovation adoption process. Such a
model is presented in Figure 12.
Figure 12: Social capital and expertise as significant variables.
Beginning with the simple thesis that Rodgers’ (1995) innovation-decision
process serves to bridge the gap between technology acquisition and technology
adoption, researchers have begun to expand Rodgers’ model through the empirical
examination of factors that may influence that process. By singling out characteristics of
Given Conditions Process Observed Outcome
Context Characteristics
(Zhao et al.) (2002)
Innovation Characteristics
(Zhao et al.) (2002)
Characteristics of Individual Teachers
(Zhao& Cziko) (2001)
Adequate Access to Technology Innovations.
Low Levels of Technology Adoption by Teachers
Innovation-Decision Process
(Rodgers, 1995)
Primary Factor
Contributing Factor Contributing Factor
Social Capital & Expertise (Frank et al. 2002)

38
individual teachers (Zhao & Cziko, 2001) as the primary factor, it is possible to begin to
look at significant variables with which to study that process. Frank, et al. (2004)
provided two such potential variables in determining that teacher’s expertise as well as
access to training, help, and support from each other (social capital) are statistically
significant contributors to the adoption of technology in education.
In their discussion, Frank et al. (2004) hinted at the potential of this new
understanding when they stated, “One direct implication of our findings is that change
agents may be able to draw on social capital to facilitate the implementation of
innovations” (p. 162). In other words, social capital may represent not only a factor
influencing technology implementation but also a tool that may be used to ameliorate the
lag in adoption of technologies in schools.
Rodgers (1995) defined change agents as “an individual who influences clients’
innovation-decisions in a direction deemed desirable by a change agency” (p. 27).
According to the model above, such change agents would function by accessing the
expertise and social capital possessed by individual teachers, and leveraging this capital
towards increasing the level of technology adoption. While they would acknowledge that
many other contributing factors exist, such change agents would focus on social capital
factors directly in order to set policy and achieve their goals. This simplified model
assumes that the variables “social capital” and “teacher expertise” directly affect the
innovation-decision process and influence the outcome in a positive manner. Such a
model is presented in Figure 13.

39
Figure 13. Simple model of technology adoption: Access to social capital and expertise.
From these models, one can see the progression of ideas beginning with diffusion
of innovation in general, to applying those theories to education settings, to modeling the
interaction of factors influencing technology adoption process and finally to identifying
significant factors that may be used by change agents to enact improvements in
technology adoption by schools.
Significant research and theory exists on the diffusion of technological
innovations (Rodgers, 1995). Further, these theories have been applied in the context of
education (Zhao & Cziko, 2001; Zhao & Frank 2003; Zhao et al. 2002) and empirical
examination of variables influencing this process has been conducted (Frank et al., 2004).
Frank et al. (2004) hinted at the need for further research when they suggested “the study
could also be extended by delving deeper into each school as a case” (p. 164).
Additionally, if change agents are to use this knowledge to influence the adoption of
innovations in such a school, a quantitative examination of the direct relationship
between social capital and technology adoption should be undertaken.
Rather than focusing on an organization, such a study would focus on the
individual teacher. Since “social capital leverages expertise already in a system” (Frank
et al., 2002, p. 162), it is possible to postulate that increasing social capital results in
increasing the expertise of teachers. This very simple model of technology adoption,
where access to social capital by itself serves as a surrogate for the entire innovation-
Given Conditions Process Observed Outcome
Adequate Access to Technology Innovations.
Low Levels of Technology Adoption by Teachers
Change Agents Access Social Capital and Expertise to Leverage Implementation.

40
decision process and thereby predicts the level of technology adoption by the individual
teacher, is shown in Figure 14. Finally, the problem of lack of diffusion of innovation in
education can be narrowed to examination of a single variable (social capital) and its
effect on level of technology adoption, forming the basis for an empirical research study
of the problem.
Figure 14. Simplified innovation adoption model: Focus on the individual teacher.
Should such a model prove valid, it will be of great value to change agents tasked
with improving the technology adoption within a school. Because social capital is
intrinsic to such organizations, employing it to achieve such a goal may be both more
economically prudent and functionally feasible than efforts utilizing more traditional
methods such as providing outside training, changing perceptions of the innovation, or
altering prior conditions of the workplace.
Technology Innovations Provided to Teachers
Higher Levels of Technology Adoption Reported By Teachers
Access to Social Capital by
Individual Teachers
Given Conditions Study Variable Observed Outcome

41
Chapter 3: Methodology
In order to collect data on and analyze the relationship between teachers’ adoption
of innovative technologies and access to social capital, a correlational methodology using
a survey instrument for data collection was selected as the most appropriate for the study.
This chapter describes the details of the selected methodology.
Research Methodology
At its core, this study sought to describe the extent to which variation in access to
social capital by teachers at each site corresponded to variations in level of technology
adoption by those same teachers. According to Isaac and Michael (1995, p. 53), this type
of question is ideally suited to exploration through correlational statistical methods
because it (a) used complex variables that did not lend themselves to controlled
experimental methods, (b) allowed for the examination of several variables
simultaneously in situ, and (c) sought to quantify the degree of the relationship instead of
just detecting its presence. Therefore a correlational methodology was constructed
(Fraenkel & Wallen, 2003; Isaac & Michael, 1995).
The research study gathered data using survey methodologies (Buckingham &
Saunders, 2004; Fraenkel & Wallen 2003; Isaac & Michael, 1995). To do so, the
research was conducted in two phases. The first phase was used to customize an
appropriate survey instrument for each study site, while the second involved the
collection of data at three schools housed in two buildings. The following is a detailed
description of the procedures used during the study. A schematic detailing the research
process is included in Appendix A.

42
Definition of Variables
To understand the complex interactions between teachers involved in assessing
both the level of adoption of innovative technologies and teachers’ access to social
capital, as well as examine some potentially mediating factors, it was necessary to utilize
several variables to collect data. In particular, access to social capital was represented by
a statistical construct of several intermediate variables. Table 3 presents the variables
used in the study.
Table 3
Research Variables
Type
Variable
Dependent Variable
Level of Adoption
Independent Variable
Access to Social Capital
Grouping Variables (Discrete / Binomial)
Gender Assignment Grade Level
Possible Confounding Variables (Continuous)
Age Experience On-Site Experience
Comparison Variables (Used to examine reliability)
Innovator Category Social Interaction
Level of Adoption
Since the problem addressed by this research involves adoption of innovative
technologies by teachers, the level of adoption measured at the study sites served as the
dependent variable in the analysis. This decision is consistent with the methodology

43
employed by Frank et al. (2004). Additional support was obtained from Hurlburt (2003),
who offered, “The dependent variable is the outcome variable that is of primary interest
in the study” (p. 240).
In the Frank et al. (2004) study, the researchers gathered data on adoption of
innovative technologies by creating a 5-point scale coded to represent the number of days
each teacher spent using computers (daily = 180, weekly = 40, monthly =9, yearly =1 and
never =0). For this study, a similar methodology was adopted by asking teachers “on
how many occasions did you use [technology] during the fall semester?” The decision
to use a continuous scale rather than the categorical scale used by Frank et al. was based
on a desire to differentiate finer variations in usage patterns as well as allow a broader
selection of appropriate statistical analysis techniques (see Hurlburt, 2003; Myers and
Well, 2003). This decision was based on feedback from participants in the instrument
development and face validity verification phase of the study.
The following calculations were performed to assess the level of innovative
technology adoption at each study site. First, the researcher coded each teacher’s level of
adoption of each individual technology (x) present in the study setting from their
response to appropriate questions on the survey instrument.
Adoptionx = days technology (x) used
Second, the overall level of adoption of innovative technology by a single teacher
using all technologies in the study (n) was evaluated by using the sum of the level of
adoption of each innovative technology:
∑=
=n
inTeacher AdoptionAdoption
1

44
Access to Social Capital
The researcher collected data and constructed this variable to examine the
contribution that access to social capital makes on the level of adoption of innovative
technologies by teachers. According to Myers and Well (2003), in an observational or
correlational study, “The researcher does not assign subjects to treatment conditions, but
instead obtains scores from subjects who just happen to be exposed to different treatment
conditions” (p. 3). Therefore, the observation of teachers’ access to social capital served
as the independent variable in the study.
Many factors influence access to social capital, including each teacher’s own
expertise, who a teacher receives help from, the expertise of that peer, and how often that
peer helps others. Each of these can be represented by a variable, with access to social
capital representing a construct of those variables. To collect data for these variables, a
rather complex question was used on the survey instrument. Refer to Section 4 of the
sample survey in Appendix D. Data from these questions were used to define the
following variables for each teacher and for each technology in the study setting:
Expertise. Based on the model used by Frank et al. 2004, level of adoption (the
self-reported number of occasions a teacher used a particular innovative technology
during the study period) was used directly as a measure of each teacher’s expertise.
Help received. To assess this variable, the researcher asked participants to name
the colleagues who lent them assistance in learning to use each innovative technology,
and to indicate on how many occasions this interaction occurred. The researcher also
asked them to rate the value of this interaction for possible further use.

45
Help given. In Section 5 of the survey instrument, the researcher asked
participants to list the persons to whom they had personally provided help and support in
the context of teaching them to use each innovative technology. They were also asked to
indicate on how many occasions such interaction occurred during the Fall 2007 semester.
Access to help through social capital. Adapting the statistical methodology
employed by Frank et al. (2004, pp. 13-15), a measure of social capital was constructed
as follows. First, a measure of the amount of help a teacher receives had to be
determined. Since the level of adoption of each innovative technology for all teachers
surveyed, as well as the identity of all peers providing assistance to the teacher and the
number of days of such assistance was known, a teacher’s access to help (AH) could be
determined by simply summing the number of days the teacher received help using the
following formula for calculating a teacher’s access to help (H) from their (m) peers (i')
relevant to a specific innovative technology:
∑−
≠=
′=1
'1
)(m
iii
iHAH
However, since help from experienced peers may be of more value than help from
novice technology users, Frank et al. (2004) suggested the following formula may more
accurately represent that access to help:
∑−
≠=
′=1
'1
' ))((m
iii
ii AdoptionHAH

46
This calculation included both the number of occasions the teacher sought help
adjusted for the expertise (represented by level of adoption of the innovative technology
being examined) of the assisting teacher who provided that assistance.
Once this value had been calculated for each teacher, the measure of access to
help was improved by factoring in not only the amount of help, and the level of expertise
of the person providing the assistance, but also the amount of help that each assisting
person gave to other teachers. Frank et al. (2004) suggested that “our reasoning is that
those who were frequently listed by others as providing help must be reasonably good at
doing so” (p. 13). Therefore, a teacher’s access to help in using a specific innovative
technology was modeled as:
)())(( '
1
'1
' i
m
iii
ii GiveHelpAdoptionHAH ∑−
≠=
′=
Finally, access to social capital (SC) for any given teacher (i) was therefore
determined simply by summing the access to help that teacher receives for each of the (n)
innovative technologies examined in the study:
SC=∑=
n
i 1AHn
Grouping Variables
In order to more fully investigate the relationship between level of adoption of
innovative technologies and access to social capital by teachers, these variables were
examined across several sub-groups. The purpose of this analysis was simply to see if

47
patterns of adoption or access to social capital were consistent between these groups.
Due to the small population size, discrete, binomial variables were selected in an attempt
to yield sufficient cell size in sub-groups to provide meaningful analysis. For grouping
variables, dummy variables (see Myers and Well, 2003, pp. 615-621) were introduced to
include these nominal or categorical data in analysis techniques requiring continuous
data.
Gender. The possibility that significant differences in adoption of innovative
technologies or access to social capital existed between males and females was examined
by assigning participants a score of “0” for “male” or “1” for female based on their
responses on the survey instrument.
Curriculum area assignment. Differences between teachers who teach academic
subjects (math, science, language arts and social studies) and elective area teachers
(foreign language, physical education, vocational, etc.) were also examined. The survey
asked middle school teachers to report the number of hours they taught in each area (out
of a 4- or 5-hour work day). Participants were assigned to the academic or elective group
based on the area in which they spent the majority of their time. Elementary school
teachers were asked if they taught a grade level (3rd grade, for example) or an extended
core class (the term used for elective classes like art or music). Grade level teachers were
considered “academic” and extended core teachers were considered “elective.” Again, a
score of “0” was used to indicate “academic” and “1” was used to indicate “elective /
extended core” for purposes of the analysis.
Grade Level. Due to the nature of the study sites that agreed to participate (a
grades 4-8 intermediate school and grades K-8 elementary/middle school), it became

48
necessary to include elementary teachers (grades K-5) in the data collection, since both
buildings had significant populations of these teachers who interacted on a regular basis
with the middle school teachers. Therefore teachers were scored using “Yes” if they
taught elementary school and “No” if they taught middle school. For coding purposes,
“0” was used to indicate “elementary” and “1” to indicate “middle school” during the
analysis.
Possible Mediating Variables
While Frank et al. (2004) determined that access to social capital is a significant
contributing factor to implementation of technology innovations; they also acknowledged
that many other factors contributed to the eventual adoption or rejection of new
technologies. Furthermore, they acknowledged that their research remained exploratory
in nature and that significant future research was needed to explore other possible
contributory factors. Therefore, data were collected to explore the potential of several
variables to mediate or modify the relationship between teachers’ adoption of innovative
technologies and those teachers’ access to social capital, thereby attempting to the body
of knowledge in this research area. Due to the small population and resulting small
sample sizes at each study site, three common variables were selected from traditional
diffusion literature for evaluation. They included the age of participants, their teaching
experience, and length of time they had been assigned to the study setting.
Age. It was possible that younger teachers might have related to innovative
technologies in differing ways from older teachers. Likewise, social interactions between
teachers of different ages may have differed. Therefore, the age (in years) of each
participant was collected.

49
Experience. Since adoption of innovative technologies was being studied in the
context of education, it was possible that more experienced teachers may have exhibited
differing attitudes and abilities related to technological innovations. Therefore, the
number of years each teacher had been teaching was collected.
On-site experience. Because each study setting had a unique blend of both
innovative technologies and expertise among teachers, it followed that teachers who had
been assigned to the building longer may have acclimated themselves to the innovative
technologies or integrated themselves into the social structure in different ways than
newer teachers. Therefore, the number of years a teacher had been working at the study
setting was also collected.
Comparison Variables
During the instrument development process, additional questions were added,
drawn from the diffusion of innovation literature, aimed at examining adoption of
innovative technologies and access to social capital by teachers at each study site, thereby
allowing comparison with the study variables for the purposes of assessing the reliability
of the questionnaire.
Innovator categories. The study drew from the work of Rodgers (1995, pp. 262-
264) and his definitions of innovator categories to have teachers self-assess the degree to
which they adopt innovative technologies. Rodgers grouped members of an organization
as innovators, early adopters, early majority, late majority, and laggards based on how
quickly they were to fully adopt the innovation.
For each technology in the study, participants were asked to indicate which group
they belonged to by selecting a response that best described their use of each innovative

50
technology present at the study site. Table 5 shows Rodgers’ categories and the matching
prompt from the survey instrument.
Table 4
Innovator Categories
Innovator Categories
Rodgers (1995)
Survey Questionnaire Prompt
Innovator “I was using this technology before anyone else was aware of it”
Early Adoptor “I was among the first to use this technology when it became available”
Early Majority “Less than half of the staff was using this technology when I started using it”
Late Majority “More than half of the staff was using this technology when I started using it”
Laggard “I have not yet begun to use this technology”
Social interaction. Similar to the access to social capital variable, this variable
was constructed from participants’ responses to multiple variables. Drawing from Frank
et al.’s (2004) methodology, participants were asked to self-assess both the help they
received from other teachers as well as the help they provided in return. To gather this
data, a 5-point Likert scale (1 = “Strongly Agree,” 2 = “Agree,” 3 = “Neither Agree nor
Disagree,” 4 = “Disagree,” 5 = “Strongly Disagree”) was used to elicit responses to two
questions. The first question was designed to assess help received: “The knowledge,
skills, training and support I receive from my colleagues helped me incorporate
innovative technologies into my daily teaching practice.” The second was designed to
assess the help they gave to their colleagues: “The help I gave to my colleagues allowed
them to successfully incorporate innovative technologies into their daily teaching
practice.”

51
The measure of social interaction was calculated by simply multiplying the help
received by the help given, consistent with the method used to calculate social capital.
Study Population, Participants, and Sampling Plan
Potential research participants were available in a single medium-to-large
Midwestern, urban school district. Teachers from this pool were selected to serve as
participants in the study. The following descriptions represent the specifics used in
participant selection and recruitment.
Sampling Plan
As mentioned previously, data collection took place during a scheduled, bi-
weekly staff meeting. The plan was to have all such teachers in attendance participate in
the survey questionnaire—comprising a census of teachers at each site. While 100%
participation would have been ideal, it was anticipated that at least 75% of teachers
would choose to participate, yielding a sample of 30 to 45 individuals per study site. This
plan represented the reality that some teachers either would inevitably miss the data
collection meeting or choose not to participate.
This sampling plan represented a convenience sample. However, the limited
size of the teacher population at each site, compared to the sample size necessitated by
the correlational methodology selected, prohibited the use of true random sampling for
this study.
Study Populations
The unit of analysis for the study was three individual schools housed in two
school buildings located in a single school district. Due to differences in setting, as well
as innovative technologies present at each site, each school represented a single,

52
independent unit of observation. The selected school district contained approximately
three high schools, seven middle and intermediate schools, and fifteen elementary
schools. Individual elementary schools were initially ruled out as potential study sites
due to the low population of teachers present in each building (generally less than
twenty). The large high schools were also ruled out due to issues of accessibility (all
three were involved in complex accreditation projects, and initial contact with principals
suggested that they would not be able to fully participate).
Both Fraenkel and Wallen (2003) as well as Isaac and Michael (1995) suggested a
minimum of thirty participants in a sample to ensure valid results using correlational
analysis. Combined with other factors, this minimum number of participants led to the
identification of middle or intermediate schools within the district as ideal sites for the
study. After contacting the principals at these schools, three buildings volunteered to
participate. Due to scheduling conflicts, one of the three eventually dropped out of the
study, leaving two buildings available for the study. Data collection occurred at each site
during regularly scheduled, bi-weekly staff meetings. This allowed access to nearly all of
the staff members assigned to each site.
During the instrument development phase, it was noted that both of the schools
being studied shared a common building with an elementary school. The first study site
was the district’s only intermediate school and therefore included six elementary teachers
(grades 4-5) among its staff. These teachers interacted daily with the middle school staff
and attended all meetings and professional development sessions. Therefore, these
teachers were included in the data collection as part of the intermediate school staff.

53
The second school consisted of the middle school staff assigned to one of two “K-
8 elementary” schools in the district. This building housed both a traditional grades K-5
elementary and grades 6-8 middle school within the same building. Each staff functioned
as an independent unit, with differing work schedules, meeting days, and so on.
Therefore, the middle school teachers were sampled during a Monday meeting and the
elementary teachers several weeks later on a Wednesday. The original intent was to use
the elementary school as a third independent study site.
However, since the approximately twenty elementary teachers constituted a very
small sample but did share common resources (including available technologies) and
frequently interacted with the middle school staff in common areas, both schools were
combined into a single combined sample. This is consistent with the district’s
conventions as both schools share a common administration and secretarial and support
staff, as well as being housed in a single building.
Since the technologies present at each school were likely to be unique, and each
setting was likewise individual, it was important to note that these schools could not be
combined into a single population but rather represented individual, independent
populations for purposes of the study. While results of the study in each building are
therefore not generalizable outside of the that building’s population, the inclusion of two
populations did allow some comparison of results and a degree of practical transferability
of results to similar populations within the district.
Study Participants
Participants for the study were drawn from the teachers assigned to the schools
serving as study sites. Thirty-nine participants from 46 teachers available at the first site

54
completed surveys: 33 middle school and 6 elementary school teachers. Thirty-three
middle school teachers were sampled from the 50 teachers available at the second site
and 21 elementary school teachers from the 23 available at the third site. The last two
samples were later aggregated into a single 53-teacher sample from 72 available at the
combined site. The discrepancy in totals at the merged site was due to the inclusion of a
single teacher assigned to both sites, who turned in an identical questionnaire at both
sites. In total, 92 of a potential 112 teachers (82%) chose to participate in the study.
The first site was a grade 4-8 intermediate school. This meant that both
elementary and middle school teachers were present at the site. Several factors
contributed to determining how to group these participants. First, both staffs were
housed in the same building and shared the facility, common resources, administration
and support staff. Second, since only 4th and 5th grade are taught at the school, there were
relatively few elementary teachers. However, those elementary teachers shared common
work schedules and lunch and planning time, as well as having attended and participated
in all staff meetings and other building functions. Therefore it was determined that they
composed a single social network within the building and were combined and treated as a
single population for purposes of the study.
Likewise, the second site—a K-8 elementary/middle school—also had both
elementary and middle school teachers assigned to the building. They similarly shared
common administration, facilities, and technologies. However, because the building
housed kindergarten through 5th grade as well as middle school, there were significantly
more elementary school teachers assigned to the building (23 as compared to 6 at the first
site). Furthermore, the elementary and middle school staff had different work schedules,

55
different meeting days, and reported to different assistant principals. Therefore, they
were originally treated as independent samples and data were collected on two different
occasions.
However, some contradictory evidence emerged that seemed to suggest that the
two staffs actually composed a single social network. These include the fact that they
were both housed in a relatively new (3-year-old) building and took a lot of pride in their
school. They also shared common facilities (gym, media center, cafeteria, etc.) and
access to the same innovative technologies. In fact, the same survey questions were used
at both sites, with the sole exception of a wording change on question #6 to reflect the
different naming conventions used at each level for academic versus elective teachers.
Additionally, examination of the questionnaires revealed that a few middle school
teachers reported receiving assistance from elementary teachers in learning to use
technologies, and vice versa.
Since the case could be made either way, data from the second site were reported
as “Site 2” to indicate the middle school staff and “Site 3” to indicate the elementary
staff. To include the possibility that they are actually a single social network, data were
also reported for “Site 2 + Site 3 combined” to indicate the unified K-8 staff.
Human Subjects
Since the research collected data or information from and about human subjects,
the researcher took the required precautions to insure the safety, confidentiality and
anonymity of the subjects as required by the EMU Dissertation Manual (2006, pp. 6, 9,
13). Prior to beginning the study, the Protection and Use of Human Subjects in Research
Certification (Appendix E) program offered by the Eastern Michigan University

56
Graduate School was completed and submitted. The Eastern Michigan University
Request for Human Subjects Approval (2006) form (Appendix F) was submitted to the
University Human Subjects Review Committee (UHSRC). Approval to conduct the
study was granted by the UHSRC on January 18, 2008 (Appendix G). As the instrument
development and pilot survey progressed, the modified survey instruments were re-
submitted to the UHSRC for approval, which was granted on February 18, 2008
(Appendix H).
Because of the nature of research on social capital, it was necessary to collect
specific identifying information from study participants, including name, gender,
teaching assignment information, years of teaching experience, and age. Due to this
requirement, significant efforts had to be undertaken to protect the participants’
anonymity and confidentially both during data collection and in the final publication.
Specifics of these efforts are included in the Request for Human Subjects Approval
(2006) form (Appendix F).
Instrument Development
Developing a valid instrument is a complex, time-consuming, and demanding
undertaking (Buckingham & Saunders, 2004; Fraenkel & Wallen, 2005; Isaac & Michael,
1995). Due to the complexities of the research questions, the differing innovative
technologies at each study site, and the unique characteristics of the participants,
population, and study setting, no suitable instrument could be located appropriate to
conduct an examination of the research variables. Frank et al. (2004) provided a survey
with their study, which served as the basis for developing a suitable survey as well as
methodology for evaluating variables for technology adoption and access to social

57
capital. Therefore, the study utilized the following procedure to customize the necessary
instrumentation for each study site.
First, following a review of relevant literature, specific study sites were identified
and selected based on characteristics appropriate for the study methodology. These
included having a staff large enough to provide data appropriate for correlational analysis
techniques (approximately 30 needed), the presence of various technologies that might be
considered innovative, a willingness to participate, and availability of suitable meeting
time with which to collect data from staff members.
Permission was sought from the district superintendent as well. Since it was
necessary to know if the district was available for research prior to submitting the
dissertation proposal, this request was made prior to formal approval of the proposal.
Such permission was granted on December 13, 2007, via an email (Appendix J).
Identification of innovative technologies present in study setting.
Since the research was founded on the exploration of adoption of innovative
technologies by teachers, the first consideration had to be precisely defining exactly
which innovative technologies were to be explored in the study. Using Rodgers’ (1995)
definition of an innovation as “an idea, practice, or object that is perceived as new by an
individual or other unit of adoption” (p. 11), the process began by examining available
historical documentation for insight into which ideas, practices, or objects might meet
this definition in the study site. These documents include the district’s strategic plan for
technology, minutes of the district Technology Advisory Committee (TAC), and the
building’s School Improvement Plan (SIP), all of which were publicly available via the
district website.

58
In order to determine which innovative technologies should be included in the
study, the researcher met with and interviewed several key policy makers at each study
site. An outline/script of these interview sessions is included in Appendix B. These
interviews included the principal and assistant principal(s), several teachers (both middle
and elementary level), building media specialists, and assigned computer technicians.
The interviews focused on identifying a few (2-3) key innovative technologies present
and widely accessible by teachers at the study setting.
During the interviews, approximately a dozen potential innovative technologies
were identified at each site. Discussions continued until all participants could agree on a
list of 3-4 innovative technologies to focus on for each site. Sometimes it was decided
that several innovative technologies could be encompassed under a single innovative
technology. For instance, in one school, several online resources were being used by
teachers. However, it was decided that use of these sites was dependent on teachers’
access to computers for their students. Since the school had both common computer labs
and mobile laptop computer labs that teachers could use, it was decided to assess the use
of the labs, rather than the use of each online resource.
However, participants also felt that specific use of many technologies was
important. While data resulting from these questions was not within the scope of the
researcher’s analysis of adoption of innovations and access to social capital, it was
nonetheless collected to provide a more complete view of how these innovative
technologies were used at each site for potential future research.

59
Customization of Draft Instrument
Once the key innovations had been identified for each site, the researcher and key
policy makers at each site formulated questions about each innovation using Frank et al.’s
(2004, p. 11) survey and the interviews as a guideline.
First, the level of each teacher’s use of each technology was assessed by asking
“On how many occasions did you use [technology X] for during the 2007 Fall semester
(September 4, 2007 through January 23, 2008)?” The use of the continuous variable
occasions rather than Frank et al.’s (2004) ordinal 5-point scale (daily=180; weekly=40;
monthly=9; yearly=1; never=0) was intended to provide finer differentiation between
levels of adoption of innovative technologies during the 90-day analysis period. The
question was repeated for each technology in the study. In addition, follow-up questions
were asked for some technologies to collect data on the various ways teachers might use
that technology. Refer to sample instrument in Appendix D.
In order to determine access to training, help, and support through social
interactions, data on both how often each teacher received help, as well as how often
he/she provided such support was collected. Additionally, in order to examine the
magnitude of this support, it was necessary to determine the identity of the person
providing/receiving this assistance.
To achieve this, two questions were asked: First, to assess the amount of help a
teacher received, the survey asked: “Reflect on the teachers who helped you learn to use
[Technology X] during Fall Semester 2007 (September 4, 2007 to January 25, 2008).
Please print the name of each person in the table below. Also write the number of
occasions you received such help from each person. Last, for each person, please check

60
the box that best describes how helpful their help, training and support was as you
learned to use [Technology X] during Fall Semester 2007 (September 4, 2007 to January
25, 2008).”
To assess the amount of assistance that the teacher provided to others, the survey
asked: “Reflect on the teachers who you helped learn to use [Technology X] during Fall
Semester 2007 (September 4, 2007 to January 25, 2008). Please print the name of each
person in the table below. Also write the number of occasions you provided such help to
that person.”
As with the level of adoption of innovative technologies, these questions used the
continuous variable occasions rather than Frank et al.’s (2002) categories.
With data from these questions, it was possible to calculate and assign each
teacher a value representing both their level of adoption of the innovative technologies
present in the building, as well as their access to social capital.
Once questions had been developed for evaluating the relationship between these
variables, it was necessary to collect information to examine that relationship among
several sub-groups based on demographic variables. Therefore, questions were included
that asked gender (male/female), age (years), experience (years teaching), assignment
(years teaching at the study site), course taught (core academic/elective). Again, refer to
Appendix D for specific questions used.
Instrument Validity
Once these customized instruments had been modified, a sample instrument was
produced and shared with a panel of eight experts familiar with the study site, diffusion
of innovation theory, and/or survey design and statistical analysis (Appendix C). These

61
experts were drawn from the school district and local universities, as well as other PhD
students in the researcher’s cohort.
The purpose of this examination was to establish the face validity (Buckingham &
Saunders, 2004, p. 65) and content-related validity of the instrument (Fraenkel & Wallen,
2003, p. 159). Feedback was received from six of these experts. Based on their
suggestions, several minor corrections were made, as well as the inclusion of a section of
the survey instrument in which participants self-assess their innovator category (Rodgers,
1995, p. 262), as well as their access to help from colleagues and help provided to their
peers. This data were collected in to provide a cross reference to data collected on
adoption of innovation and access to social capital in an effort to provide a preliminary
measure of instrument reliability.
Pilot Study and Instrument Revision
Once the instrument had been developed, a small pilot study was conducted at the
district’s math/science/technology academy on January 18, 2008. This site was chosen
based on its similar size and characteristics to the study sites, as well as its proximity and
accessibility to the researcher.
The purpose of this pilot study was to have participants fill out the survey
questionnaire and give the researcher feedback on issues of readability, clarity, and
interpretation. Additionally, the data collected allowed the researcher to set up his data-
recording protocols and run some tests of analysis techniques to insure that data collected
was appropriate for the analysis techniques proposed. Feedback from participants was
used to make revisions to the instrument. These included additions to the instructions,

62
rewording of several questions, correction of various spelling and grammatical errors,
and the inclusion of reminders on several questions.
Instrument Finalization and Approval
After modification to the surveys based on input from both the pilot group and the
panel of experts, final copies of each instrument were produced and forwarded to the
UHSRC for final approval (Appendix H).
Data Collection Procedure
Data were collected from participants at each site in a single session, utilizing an
existing all-staff meeting. These meetings were held on the first and third Monday of
every month. However, the first meeting also coincided with department meetings, and
was therefore unavailable as a data collection date. Since the focus of the survey and
period of observation was the Fall 2007 semester, an attempt was made to collect data on
the first several of these meetings of the second semester. This requirement, along with
need for the researcher to be present at data collection, imposed a restriction on the
number of research sites that could be evaluated during the study.
Data were collected using the following protocol: Building administrators and
other personnel not participating in the study were asked to leave the room, thereby
insuring the anonymity and confidentiality of respondents. The researcher began by
providing participants with a brief description of research problem, questions, and
procedures. A cover letter (Appendix K) and two copies of the informed consent
agreement (Appendix I) were distributed to all participants.
After discussing the survey, passing out and collecting one copy of the informed
consent letters, and addressing any questions or concerns brought forth by teachers, the

63
survey instrument was distributed to each participant. The researcher personally read the
instructions out loud to participants and remained available to answer questions as
participants filled out the questionnaire. Completed surveys were hand collected and
sealed in a large envelope until coding and entry into statistical software. Upon
completion and verification of data entry, original paper surveys were destroyed by
shredding. Teachers who elected not to participate remained in the room during data
collection but were not required to fill out a survey (a total of only one teacher fit this
category).
There were a total of 31 teachers who did not attend these meetings for a variety
of reasons (12 at the first site, 17 at the second site, and two at the third site). These
teachers received a follow-up email (Appendix L) describing the research and asking
them to participate. The cover letter, informed consent agreements, and survey
instrument were sent to them via the inter-school mail system, along with a copy of the
email request.
Based on the low response to this email, a final follow-up email was sent on
March 21, 2008 (Appendix M), in an effort to obtain a few more responses.
One missing survey from the first site, three from the second, and two from the
third were received and added to the appropriate data set. Since all participants were
available at the third site (though one elected not to participate and one was out on
medical leave and unavailable) these emails were not sent to participants at that building.
Data Analysis
Once information had been collected, it was coded and entered into a Statistical
Package for the Social Sciences (SPSS) database. This software allowed a variety of

64
statistical methods to be employed to aid in finding answers to the research questions.
The specific statistical methods used to describe the data and answer each research
question are presented below:
1. What technologies that may be labeled as innovative existed in the study settings?
Data collected in the interview and document collection process were presented
using a table showing the name of each technology. A narrative was included to
describe the results of the data collected and to support selection of these
technologies.
2. What was the current level of adoption of these innovative technologies by
teachers in the study settings? Simple descriptive statistics including range,
mean, median, mode, standard deviation, histograms, and tables were used to
describe adoption of innovative technologies. Skewness, kurtosis, and the
Shapiro-Wilk W test of normality were used to test for normal distribution of
adoption data. Additionally, Cronbach’s alpha was used to evaluate the reliability
of the instrument in determining the level of adoption of innovative technologies
using the innovator category self-assessment data as a comparison.
3. What was the current level of access to social capital by teachers in the study
settings? While the construct variable used to examine this question is fairly
complex, the same descriptive statistics statistical methods used to describe level
of adoption were employed to describe access to social capital. Skewness,
kurtosis and the Shapiro-Wilk W test of normality were used to test for normal
distribution of access to social capital data. Additionally, Cronbach’s alpha was

65
used to evaluate the reliability of the instrument in determining the level of access
to social capital using the social interaction self-assessment data as a comparison.
4. Did various sub-groups of teachers based on gender (male versus female),
assignment (academic versus elective), or grade level (elementary versus middle
school) exhibit different levels of adoption of innovative technologies? In order to
evaluate whether differences exist among groups, the Mann-Whittney U test was
used to test a non-directional hypothesis: H0: No differences in adoption of
innovative technologies exist between male and female teachers (for example).
This test was deemed most appropriate due to the small sample size and skewed
distribution of data.
5. Did various sub-groups of teachers based on gender (male versus female),
assignment (academic versus elective), or grade level (elementary versus middle
school) exhibit different levels of access to social capital? In order to evaluate
whether differences exist among groups, the Mann-Whittney U test was used to
test a non-directional hypothesis: H0: No differences in access to social capital
exist between academic and elective teachers (for example). This test was
deemed most appropriate due to the small sample size and skewed distribution of
data.
6. Did a relationship exist between teachers’ access to social capital and level of
adoption of innovative technologies in the study setting? Due to the nature of the
data, the non-parametric Spearman’s rho was used to calculate a correlation
coefficient (rs) to test the following hypothesis at an α = .05 level of significance:
H0: No relationship exists between level of adoption and access to social capital.

66
7. Did a relationship exist between several potentially confounding variables (age,
experience, on-site experience) and level of innovative technology adoption by
teachers in the study setting? Spearman’s rho was used to calculate a correlation
coefficient (rs) to test the following hypothesis at an α = .05 level of significance:
H0: No relationship exists between implementation and (potential confounding
variable).
8. What was the relationship between level of adoption of innovative technologies
and access to social capital by teachers controlling for any confounding variables
identified in questions 5-7 above? The potentially confounding variables for this
study included gender (male or female), assignment (academic or elective), grade
level (elementary or secondary), age (in years), experience (years teaching), and
on-site experience (years teaching at the study site). For any confounding
variables found to be significant at an α = .05 level of significance, partial
correlation could be used to re-evaluate the relationship between level of adoption
and access to social capital (the zero-order correlation) while controlling for
significant co-variables (the 1st or 2nd order correlation). However, no such
significant confounding variables were detected during the study, and therefore
this analysis was not performed.
Results of all statistical analysis were reported using standard notations, graphs,
and tables as indicated in the American Psychological Association (APA) Publications
Manual (5th ed.) (2001).

67
Summary
Three schools housed in two buildings were identified as study sites for this
research study. Teachers at each site composed three independent populations (units of
analysis). A census of teachers at each site was attempted. Because several teachers
chose not to participate, the resulting participants represented a convenience sample of
each population.
After innovative technologies were identified by a panel of experts at each site, a
custom survey questionnaire was developed and validated for each study setting. This
instrument was used to collect data used to answer the research questions.
A variety of parametric and non-parametric statistical techniques were used to
describe and analyze the data. Correlational techniques were used to examine the
relationship between teacher’s level of adoption of innovative technologies and access to
social capital.

68
Chapter 4: Findings, Analysis, and Discussion
This chapter describes the data and presents the findings and analyses derived
from those data. Demographic data used to describe the study sites were obtained
through review of public documentation. Data from the instrument development process
used to answer Research Question 1 were obtained from informal interviews and
conversations with key policy makers at each site. Data used to answer the remainder of
the research questions were obtained from survey questionnaires filled out by participants
during a single staff meeting at each study site. Included in each section is some brief
discussion of the justification of the analysis being performed, as well as a summary of
the findings.
Research Question 1
What technologies that may be labeled as innovative existed in each study
setting?
There were two aspects of this questions that needed to be answered. First,
specific sites suitable for data collection had to be identified. Based on the unique
characteristics of each of those sites, data were collected to identify technologies that
were present at each site and considered innovative.
Site Selection
A single medium-to-large, midwestern, urban school district served as the overall
setting for the survey. From the seven middle/intermediate schools and 19 elementary
schools in the district, three schools volunteered and were selected to participate in the
study. Site 1 was a grade 4-8 intermediate school, while Site 2 and Site 3 were a grades
K-5 elementary and grades 6-8 middle school, respectively. Both were housed in a single

69
grade K-8 building sharing common administration and support personnel. Table 5
presents a brief demographic summary of each site.
Table 5 Study Site Demographic Data
Type of School
Grade Level
No. Students
No. Staff
Staff Assignment
Site 1 Intermediate 4-8 505 46 40 middle 6 elementary
Site 2 Middle 6-8 615 50 50 middle
Site 3 Elementary K-5 429 23 23 elementary
Site 2 + Site 3a Merged K-8 1044 72b 49½ middle
22½ elementary aSites 2 and 3 are presented both individually and together as they are both housed in the same facility. bDiscrepancy in total is due to a single participant participating in both surveys with identical questionnaires, due to job assignment in both settings.
Innovative Technology Identification Meetings
As detailed in the methodology section of this dissertation, the survey instrument
was based on that used by Frank et al. (2004), modified to address the adoption of several
innovative technologies at each site, rather than a single technology. In order to tailor the
survey questionnaire to each individual study setting, the researcher met with key
technology policy makers at each school. The purpose of these meetings was to identify
the innovative technologies present in each building. Those involved in these meetings
included the researcher, representatives of building administration, district technology
technicians, and other support personnel as well as classroom teachers assigned to the
site. These meetings generally lasted approximately 90 minutes and resulted in a group
consensus identifying the 3-4 innovative technologies to be examined at each site. The
persons in attendance as well as innovative technologies identified are detailed in Table
6. Attendees’ names were withheld to protect their anonymity and confidentiality, as

70
specified in the informed consent agreement (Appendix I). For details of these meetings,
see Appendix B.
Table 6
Instrument Development Meeting Summary
Meeting Date
Participants Innovative Technologies Identified / Selectedb
Site 1
January 25, 2008
Researcher Principal Assistant Principal Building Technician Counselor / Technology Advisor Media Specialist Science Teacher / Technology
Committee Chair
Document Camera
(ELMO) Computer Labs
(dedicated and mobile) Digital Cameras and
Video Cameras Data Projectors
Site 2 + Site 3 Combineda
January 28, 2008 Researcher Principal Assistant Principals (2) Computer Lab Manager Media Specialist Elementary Bilingual Specialist
(Teacher) Middle School Language Arts
Teacher
Promethean Boards Mobile Computer Labs Dukane DVD/VHS
System
aInstrument development for sites 2 and 3 was conducted at the building level and included administrators and support staff common to both buildings as well as teacher representatives from both elementary and middle school staffs. bTechnologies were referred to by these names in the instrument, but are coded in order (top to bottom) for each site as “Technology 1, Technology2, Technology 3, Technology 4” in the data analysis to allow comparison between sites.
Summary of Results, Research Question 1
Based on the data available, the researcher identified four innovative technologies
at Site 1 (Document Camera [ELMO], Computer Labs, Digital and Video Cameras, LCD
Projectors) and three identical innovative technologies at Sites 2 and 3 (Promethean
Boards, Mobile Computer Labs, Dukane DVD/VHS System).
It is important to note that many technologies were identified as innovative at
each site. This stands in stark contrast to much of the existing diffusion of innovation
literature (see Cuban et al., 2001; Frank et al., 2004; Lancaster & Lancaster, 2002;

71
Loveless, 1996; Smerdon et al., 2000; United States Congress OTA, 1995; Wells &
Lewis, 2006) that tend to focus on a single innovation.
Interesting comparisons among the types of technologies identified as innovative
also emerged from these findings: All study sites identified computer labs as innovative.
Likewise, all sited identified technologies that served similar purposes as innovative (the
Document Camera [ELMO], LCD Projectors and Promethean Board are all used to
display instructional materials via a projection system). However, each site also
identified unique technologies as innovative (the DVD/VHS Dukane system and Digital/
Video Cameras).
These findings supported the researcher’s decision to treat each study site as an
independent sample, since variations among innovative technologies served to define
each study site as a unique population and prohibited the combination of findings into a
single over-arching sample.
Research Question 2
What was the current level of adoption of these innovative technologies by
teachers in the study setting?
Based on the methodology used by Frank et al. (2004), information used to
evaluate this question was obtained by asking teachers to report how many occasions
during the Fall 2007 semester they used each innovative technology identified in their
building. The level of adoption was simply the sum of these occasions. Table 7
summarizes the total level of adoption for each technology at each setting.

72
Table 7
Mean Level of Adoption of Innovative Technologies Technology 1 Technology 2 Technology 3 Technology 4a Total Level of
Adoption N x s x s x s x s x s Site 1
39
77.69
134.14
69.82
112.75
9.92
23.381
19.29
19.959
154.95
238.07
Site 2 33 9.94 27.024 10.24 18.16 4.70 9.49 -- -- 24.88 36.96
Site 3 21 5.14 11.13 3.29 4.52 1.95 8.72 -- -- 10.38 20.66
Site 2+3 Merged
53b 7.66 22.21 7.30 14.82 2.94 7.78 -- -- 17.91 30.96
aFour technologies were identified at Site 1, while only 3 were used at sites 2 and 3. bDiscrepancy in total due to one teacher submitting identical questionnaires at both sites due to their assignment to both buildings.
Preliminary examination of these results revealed that the teachers at Site 1
exhibited a much higher mean level of adoption of innovative technologies ( x =154.95
occasions per semester) followed by Site 2 ( x =24.88 occasions per semester), while Site
3 showed the lowest level ( x =10.38 occasions per semester). The merged data from
Sites 2 and 3 combined showed a level of adoption ( x =17.91 occasions per semester),
roughly half way between Sites 2 and 3, as expected. Similarly, the individual innovative
technologies at each school also showed differing levels of adoption ranging from the
highest reported level of adoption (the document camera [ELMO] at Site 1, x =77.69
occasions per semester) to the lowest (mobile computer labs at Site 3, x =3.29 occasions
per semester).
Before these findings could be used in further statistical analysis, a more rigorous
examination of the data was conducted to establish the suitability of the data for the
chosen analytic techniques. First, the distribution of the adoption data for each individual
innovative technology at each site was examined (Table 8).

73
Table 8
Distribution of Adoption Data by Innovative Technology
N Range Mean Median Mode Valid Missing Min Max x s
Site 1
Document Camera (ELMO) 39 0 0 500 77.69 134.14 20 0 Computer Labs 38 1 0 500 69.82 112.754 42.50 0
Digital and Video Cameras 39 0 0 100 9.92 23.38 1 0 LCD Projectorsa 38 1 0 90 19.29 19.95 13.50 0
Total Level of Adoption 39 0 0 1038 154.95 238.07 99 0
Site 2
Promethean Boards 33 0 0 100 9.94 27.02 0 0 Dukane DVD/VHS 33 0 0 90 10.24 18.16 5 0
Mobile Computer Labs 33 0 0 40 4.70 9.49 0 0 Total Level of Adoption 33 0 0 150 24.88 36.96 8 0b
Site 3
Promethean Boards 21 0 0 40 5.14 11.13 0 0 Dukane DVD/VHS 21 0 0 20 3.29 4.52 2 1
Mobile Computer Labs 21 0 0 40 1.95 8.72 0 0 Total Level of Adoption 21 0 0 90 10.38 20.66 4 0b
Site 2 + Site 3 (Merged)
Promethean Boards 53c 0 0 100 7.66 22.21 0 0 Dukane DVD/VHS 53c 0 0 90 7.30 14.82 3 0
Mobile Computer Labs 53c 0 0 40 2.94 7.78 0 0 Total Level of Adoption 53c 0 0 150 17.94 30.96 5 0
aFour technologies were identified at Site 1, while only 3 were used at sites 2 and 3. bMultiple modes exist, lowest value reported. cDiscrepancy in total due to one teacher submitting identical questionnaires at both sites due to their assignment to both buildings.
Aside from the obvious differences between levels of adoption of the various
innovative technologies, marked divergence among mean, median, and mode for these
technologies was identified. Also noted were the relatively large standard deviation
values compared to the means. According to Myers and Well (2003, p. 124), this could
be indicative of a non-normal distribution. Additionally, the existence of two innovative
technologies that displayed multiple modes suggested that the data did not meet the
unimodal assumption of normality (Hurlburt, 2003, p. 41). In order to further examine
these possibilities, the distribution of adoption data was displayed graphically using

74
histograms (Appendix N, Figure N-1). A representative example of these histograms is
presented in Figure 15.
5004003002001000
Reported No. of Occasions Computer Labs Used
25
20
15
10
5
0
Num
ber o
f Tea
cher
s R
espo
ndin
g
Mean = 69.82Std. Dev. = 112.754N = 38
Site 1, InnovativeTechnology 2
Figure 15. Representative example of a histogram for adoption data.
Visual examination of these histograms further suggested that, in addition to the
divergence in measures of central tendency, these data displayed a strongly negative
skew, providing further evidence against supporting the assumption of normality. To
further test the distribution of these values, both skew and kurtosis values were computed
for each innovative technology at all study sites. Table 9 presents the results of these
analyses.
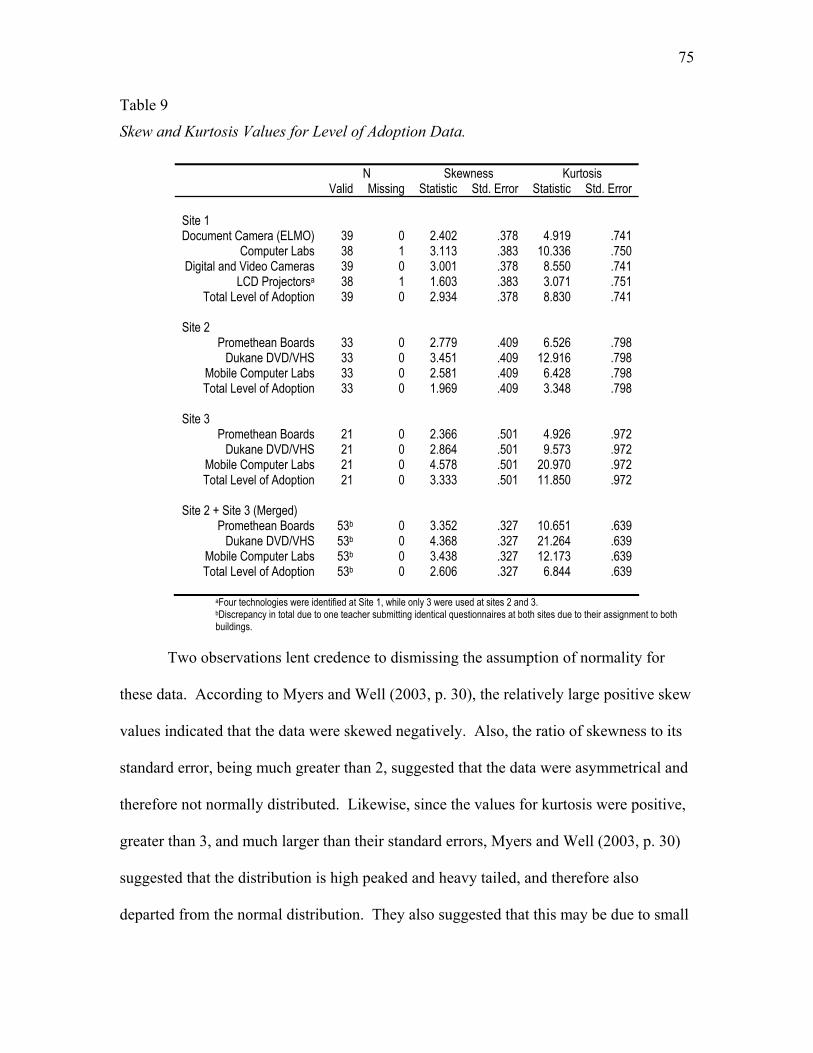
75
Table 9
Skew and Kurtosis Values for Level of Adoption Data.
N Skewness Kurtosis Valid Missing Statistic Std. Error Statistic Std. Error
Site 1
Document Camera (ELMO) 39 0 2.402 .378 4.919 .741 Computer Labs 38 1 3.113 .383 10.336 .750
Digital and Video Cameras 39 0 3.001 .378 8.550 .741 LCD Projectorsa 38 1 1.603 .383 3.071 .751
Total Level of Adoption 39 0 2.934 .378 8.830 .741
Site 2
Promethean Boards 33 0 2.779 .409 6.526 .798 Dukane DVD/VHS 33 0 3.451 .409 12.916 .798
Mobile Computer Labs 33 0 2.581 .409 6.428 .798 Total Level of Adoption 33 0 1.969 .409 3.348 .798
Site 3
Promethean Boards 21 0 2.366 .501 4.926 .972 Dukane DVD/VHS 21 0 2.864 .501 9.573 .972
Mobile Computer Labs 21 0 4.578 .501 20.970 .972 Total Level of Adoption 21 0 3.333 .501 11.850 .972
Site 2 + Site 3 (Merged)
Promethean Boards 53b 0 3.352 .327 10.651 .639 Dukane DVD/VHS 53b 0 4.368 .327 21.264 .639
Mobile Computer Labs 53b 0 3.438 .327 12.173 .639 Total Level of Adoption 53b 0 2.606 .327 6.844 .639
aFour technologies were identified at Site 1, while only 3 were used at sites 2 and 3. bDiscrepancy in total due to one teacher submitting identical questionnaires at both sites due to their assignment to both buildings.
Two observations lent credence to dismissing the assumption of normality for
these data. According to Myers and Well (2003, p. 30), the relatively large positive skew
values indicated that the data were skewed negatively. Also, the ratio of skewness to its
standard error, being much greater than 2, suggested that the data were asymmetrical and
therefore not normally distributed. Likewise, since the values for kurtosis were positive,
greater than 3, and much larger than their standard errors, Myers and Well (2003, p. 30)
suggested that the distribution is high peaked and heavy tailed, and therefore also
departed from the normal distribution. They also suggested that this may be due to small

76
samples and/or extreme (outlier) values. Elimination of these values was deemed
impossible, as it would have reduced already small sample sizes, especially in analysis of
differences between groups.
Since preliminary analysis suggested that the data were not normally distributed,
the Shapiro-Wilk W test was used to empirically test for normality in the adoption of
innovative technologies data. Table 10 reflects the results of this analysis.
Table 10
Shapiro-Wilk W test for Normality for Level of Adoption Data.
W d.f. Sig.
Site 1
Document Camera (ELMO) .555 39 .000** Computer Labs .574 39 .000**
Digital and Video Cameras .399 39 .000** LCD Projectorsa .830 39 .000**
Total Level of Adoption .607 39 .000**
Site 2
Promethean Boards .417 33 .000** Dukane DVD/VHS .548 33 .000**
Mobile Computer Labs .564 33 .000** Total Level of Adoption .676 33 .000**
Site 3
Promethean Boards .545 21 .000** Dukane DVD/VHS .662 21 .000**
Mobile Computer Labs .237 21 .000** Total Level of Adoption .515 21 .000**
Site 2 + Site 3 (Merged)
Promethean Boards .395 53b .000** Dukane DVD/VHS .470 53b .000**
Mobile Computer Labs .438 53b .000** Total Level of Adoption .594 53b .000**
aFour technologies were identified at Site 1, while only 3 were used at sites 2 and 3. bDiscrepancy in total due to one teacher submitting identical questionnaires at both sites due to their assignment to both buildings. **Significant at the α=.01 level
The results of this analysis allowed the researcher to reject the null hypothesis
(H0= adoption data is normally distributed) and conclude that the data were best suited to
statistical analytical techniques not dependent on the assumption of normality.

77
Other Measures of Adoption of Innovative Technologies
A second measure of adoption was the self-reported innovator category reported
by participants for each innovation (Table 11).
Table 11
Summary of Innovator Category Data
N Range Mean Median Mode Valid Missing Min Max x s
Site 1
Document Camera (ELMO) 36 3 1 5 3.31 1.064 3.50 4.00 Computer Labs 37 2 1 5 3.30 .996 3.00 4.00
Digital and Video Cameras 34 5 1 5 3.50 1.228 3.50 4.00 LCD Projectorsa 35 4 2 5 4.00 1.095 4.00 4.00
Mean Innovator Category 38 1 1.5 5 3.50 .924 3.50 4.00
Site 2
Promethean Boards 29 4 1 5 4.31 1.442 5.00 5.00 Dukane DVD/VHS 30 3 1 5 3.20 1.297 3.50 4.00
Mobile Computer Labs 29 4 1 5 3.31 1.285 3.00 3.00 Mean Innovator Category 30 3 1 5 3.61 1.065 3.83 4.33
Site 3
Promethean Boards 20 1 2 5 4.10 1.165 5.00 5.00 Dukane DVD/VHS 18 3 1 5 3.28 1.179 4.00 4.00
Mobile Computer Labs 20 1 1 5 4.05 1.317 5.00 5.00 Mean Innovator Category 20 1 1.67 5 3.84 .884 4.00 4.67
Site 2 + Site 3 (Merged) c
Promethean Boards 48 5 1 5 4.27 1.300 5.00 5.00 Dukane DVD/VHS 47 6 1 5 3.28 1.210 4.00 4.00
Mobile Computer Labs 48 5 1 5 3.65 1.329 5.00 5.00 Mean Innovator Category 49 4 1 5 3.75 .959 5.00 4.00b
aFour technologies were identified at Site 1, while only 3 were used at sites 2 and 3. bMultiple modes exist, lowest value reported. cDiscrepancy in total due to one teacher submitting identical questionnaires at both sites due to their assignment to both buildings.
The primary reason these data were collected was to establish the reliability of the
survey instrument to accurately assess the level of technology adoption by teachers at the
study site. To do so, the researcher calculated Cronbach’s alpha (Fraenkel & Wallen,
2003, p. 168) for each site, using the individual innovative technology adoption data,
individual technology adopter category responses, total innovative technology adoption

78
data and mean technology adopter level. Unfortunately, the self-assessment variables
were opposite in direction, with higher levels of adoption of innovative technologies
equating to lower scores on the innovator category self-assessment. In order to correct
for this and conform to the assumptions of the statistical test, dummy variables were used
to mathematically reverse the innovator categories for purposes of this calculation. Table
12 presents the results of the analysis.
Table 12
Reliability Coefficients for Adoption Data
Cases
No. of Items N Valid Excluded Cronbach’s alpha
Site 1
10
39
29
10
.693
Site 2
8 33 29 4 .658
Site 3
8 21 18 3 .747
Site 2 + Site 3 (Merged)
8 53a 46 7 .677
a Discrepancy in total due to one teacher submitting identical questionnaires at both sites due to their assignment to both buildings.
Cronbach’s alpha is used to test the reliability of the survey instrument in
measuring adoption of technology. Fraenkel and Wallen (2003) suggested that a lenient
alpha value of at least .60 is necessary to reject the null hypothesis (H0= survey
questionnaire does not reliably measure adoption of innovative technologies) in
exploratory research. Since the alpha variables in the study all exceeded that value, it
was concluded that the survey questionnaire reliably measured level of adoption of
innovative technologies.

79
Summary of Results, Research Question 2
The results of the adoption of innovative technologies analyses yielded several
interesting facts. First, levels of adoption varied greatly both between individual
technologies and between study settings as evidenced by both the large range of values
and the very large standard deviations reported. When comparing individual innovative
technologies, this variation may be attributable to differences in the technologies
themselves. However, when comparing differences between populations (Site 1 to Site 2
for example), these variations might also be caused by differing interpretations of the
survey questions that asked for the “number of occasions” each technology was used
during the previous semester. Based on the fact that a semester is approximately 100
days long, the range of adoption values for Computer Labs at Site 1 (from 0 to 500
occasions) when compared to Site 2 (from 0 to 40 occasions) may just as likely have been
caused by actual level of usage than by teachers interpreting “number of occasions” as
“class periods” at Site 1 and “school days” at Site 2. The existence of the possibility of
differing interpretations in each study site further supported treating each site as an
independent population.
The divergence of measures of central tendency, distribution of adoption values
visualized in the histograms, skewness, kurtosis, and Shapiro-Wilks W test all led to the
conclusion that that these data were not normally distributed. This finding directly
impacted the selection of analytic techniques employed to answer the remaining research
questions.
The use of Cronbach’s alpha revealed that the survey questionnaire reliably
measured level of adoption of innovative technologies. The results of this post hoc test of

80
reliability provided evidence to begin to validate the study methodology, including the
development and use of customized instrumentation to collect data from diverse,
independent populations identified and discussed in Research Question 1.
The fact that variations in level of adoption existed for all technologies in all
settings bore credence to the supposition that these technologies exhibited some level of
innovativeness, since they were not routinely used by all teachers. Likewise, the fact that
many teachers at each site reported not using the technologies at all supported the major
assumption of the research project, that innovative technologies are indeed underutilized
by at least some teachers.
Research Question 3
What was the level of access to social capital by the teachers in the study setting?
This question was evaluated through the use of a complex variable, constructed
from the response to three individual questions on the survey questionnaire. To
determine how often the teachers received help from their colleagues for each
technology, participants were asked to name all of the persons who provided such help,
along with the number of occasions on which this occurred (for specifics of the questions
used, see Appendix D). Since the respondent often reported more than one person, the
number of occasions was summed to yield a measure of help received. Details of the
construction of this variable are discussed in the methodology section at length.
To determine how often the teacher helped others use technology, participants
were asked to name all of the persons who they helped learn to use each innovative
technology identified at the study site. The value was then modified by multiplying by
the teacher’s level of adoption for the identified technology to account for that teachers’

81
expertise in using the technology. Again, multiple responses meant that the researcher
had to sum the responses.
Access to social capital was calculated for each technology by multiplying the
amount of help received by the amount of help given. These numbers and calculations
were recorded on the survey questionnaire and entered into the data set as a single value.
Table 13 summarizes the access to social capital measure for each technology at
each site, as well as the total level of access to social capital for each site.
Table 13
Access Social Capital by Teachers
Technology 1
Technology 2
Technology 3
Technology 4b Total Level of
Access to Social Capital
x s x s x s x s x s
Site 1
543.26
1872.40
282.46
1041.45
758.69
1715.32
--
--
1584.41
3152.80
Site 2 608.91 1712.26 1705.85 2883.03 339.91 713.49 -- -- 2654.67 4443.55
Site 3 1418.33 1684.55 829.14 1247.83 165.05 408.39 -- -- 2412.52 2488.74
Site 2+3 Merged
941.08 1743.75 1379.15 2427.43 273.53 620.34 -- -- 2593.75 3806.14
aFour technologies were identified at Site 1, while only 3 were used at sites 2 and 3. bValue for Technology 4 was dropped from analysis. See discussion below
Interestingly, Site 1 demonstrated the lowest mean level of access to social capital
( x = 1618.56) even though it showed the highest level of adoption of innovative
technologies. Access to social capital for the individual technologies ranged from a high
( x = 1715.32) for Technology 3 (digital and video cameras) at Site 1 and a low of ( x =
165.05) for Technology 3 at Site 3 (Dukane DVD/VHS System).
After data were collected, during the data entry process, a data collection error
was identified on the Site 1 surveys, resulting in no usable data being collected on

82
teachers providing help to others on the use of Technology 4 (LCD projectors).
Therefore, the access to social capital values for this technology were not calculated for
Technology 4 (LCD projectors) at Site 1 and are not reported for this innovative
technology in any of the following analyses.
Several factors contributed to this decision. First, the LCD projectors used by
teachers are part of the document camera (ELMO) system, and some of the teachers’
access to social capital related to its use may have been captured by analysis of that
innovative technology. Participants reported relatively low levels of usage for this
technology ( x = 19.29 occasions, s=19.59). Only 12 respondents (31%) reported
receiving help using this technology, all of them from a single colleague. Of these 12
respondents, nine reported receiving assistance from the building media specialist. These
factors made it likely that few participants (approximately four) would have reported
providing help to their colleagues.
The researcher was cautious about making any inferences based on observations
at this level due to the multiplicative nature of this construct variable. Inherent in the way
this variable was calculated are a very large range among reported values and huge
variances, as witnessed by the large standard deviations observed. Just as with the level
of adoption data, teacher’s access to social capital required further analysis to determine
its suitability for various statistical analytic techniques.
As with the adoption of innovative technology data, skew and kurtosis values
(Table 14), and histograms (Appendix N, Figure N-2) were prepared for the data. Figure
16 presents a representative example of these histograms.

83
Table 14
Skew and Kurtosis Values for Access to Social Capital Data
N Skewness Kurtosis Valid Missing Statistic Std. Error Statistic Std. Error
Site 1
Document Camera (ELMO) 39 0 5.173 .378 28.796 .741 Computer Labs 39 0 5.329 .383 30.359 .750
Digital and Video Cameras 39 0 2.275 .378 4.271 .741 Total Access to Social Capital 39 0 3.605 .378 16.178 .741
Site 2
Promethean Boards 33 0 4.074 .409 18.719 .798 Dukane DVD/VHS 33 0 2.357 .409 4.799 .798
Mobile Computer Labs 33 0 2.879 .409 9.257 .798 Total Access to Social Capital 33 0 3.437 .409 14.151 .798
Site 3
Promethean Boards 21 0 .718 .501 -.953 .972 Dukane DVD/VHS 21 0 2.509 .501 7.568 .972
Mobile Computer Labs 21 0 2.482 .501 5.068 .972 Total Access to Social Capital 21 0 3.333 .501 11.850 .972
Site 2 + Site 3 (Merged)
Promethean Boards 53a 0 2.513 .327 7.949 .644 Dukane DVD/VHS 53a 0 2.786 .327 7.697 .644
Mobile Computer Labs 53a 0 3.067 .327 11.038 .644 Total Access to Social Capital 53a 0 3.378 .327 15.771 .644
aDiscrepancy in total due to one teacher submitting identical questionnaires at both sites due to their assignment to both buildings.
20000.0015000.0010000.005000.000.00
Total Access to Social Capital Score: All InnovativeTechnologies
30
25
20
15
10
5
0
Num
ber o
f Tea
cher
s R
espo
ndin
g
Mean = 1584.4103Std. Dev. = 3152.80457N = 39
Site 1, Total Access to Social Capital
Figure 16. Representative example of a histogram for access to social capital data.

84
Apparent from this analysis was the strong negative skew the data exhibited, as
well as high peaks and strong tails visible on the histograms that manifested as high
kurtosis values. Both skew and kurtosis values were very large—more than twice the
value of the standard error. With the exception of the Promethean Boards (Technology 1
at Site 3), these observations suggested a non-normal distribution to the data. Further
analysis was needed to verify the normality of these data. The Shapiro-Wilk W test was
chosen for its power with small samples—up to approximately 50 (Myers & Well, 2003,
p. 185). Table 15 presents the results of the normality analysis.
Table 15
Shapiro-Wilks W Test for Normality for Access to Social Capital Data
W
d.f.
Sig.
Site 1
Document Camera (ELMO) .317 39 .000** Computer Labs .302 39 .000**
Digital and Video Cameras .512 39 .000** Total Access to Social Capital .552 37 .000**
Site 2
Promethean Boards .413 33 .000** Dukane DVD/VHS .611 33 .000**
Mobile Computer Labs .556 33 .000** Total Access to Social Capital .596 33 .000**
Site 3
Promethean Boards .793 21 .001** Dukane DVD/VHS .688 21 .000**
Mobile Computer Labs .460 21 .000** Total Access to Social Capital .873 21 .011*
Site 2 + Site 3 (Merged)
Promethean Boards .613 53a .000** Dukane DVD/VHS .588 53a .000**
Mobile Computer Labs .515 53a .000** Total Access to Social Capital .658 53a .000**
aiDscrepancy in total due to one teacher submitting identical questionnaires at both sites due to their assignment to both buildings. *Significant at the α=.05 level **Significant at the α=.01 level

85
Based on these results, the null hypothesis (H0= access to social capital data is
normally distributed) was rejected and a conclusion was drawn that the data were best
suited to statistical analytical techniques not dependent on the assumption of normality.
Other Measures of Access to Social Capital
Additional data were collected in order to examine teacher’s access to social
capital. In particular, two questions on the survey questionnaire were used in an attempt
to gather this data. The first asked teachers to self-assess the degree to which their
colleagues’ help allowed them to use the innovative technologies in their classrooms
using a 5-point Likert scale. Table 16 summarizes those results. The second asked
teachers to self-assess the degree to which they believed that their assistance helped
others to use the innovative technologies in the classroom. Table 17 summarizes those
results. Last, the a measure of social capital was created by multiplying the “help
received” rating by the “help given” rating, consistent with the multiplicative method of
calculating the access to social capital scores. Table 18 summarizes those results. See
the sample instrument in Appendix D for the exact questions asked and the responses
available to respondents.

86
Table 16
Summary of Help Received Self-Assessment Data
N Range Mean Median Mode Valid Missing Min Max x s
Site 1
Document Camera (ELMO) 39 0 1 5 2.33 1.305 2.00 2.00 Computer Labs 39 0 1 5 2.18 1.211 2.00 2.00
Digital and Video Cameras 35 4 1 5 2.60 1.218 2.00 2.00 Mean Help Received 39 0 1 5 2.34 1.163 2.00 2.00
Site 2
Promethean Boards 29 4 1 5 3.59 1.476 3.00 5.00 Dukane DVD/VHS 32 1 1 5 2.69 1.176 2.00 2.00
Mobile Computer Labs 30 3 1 5 2.90 1.296 2.50 2.00 Mean Help Received 32 1 1 5 2.97 1.106 3.00 3.00
Site 3
Promethean Boards 18 3 1 5 1.89 1.079 2.00 1.00 Dukane DVD/VHS 19 2 1 5 2.21 1.032 2.00 2.00
Mobile Computer Labs 16 5 1 5 3.13 1.500 3.00 2.00a Mean Help Received 19 2 1 3.67 2.39 .788 2.33 2.00
Site 2 + Site 3 (Merged) b
Promethean Boards 46 7 1 5 2.98 1.556 3.00 5.00 Dukane DVD/VHS 50 3 1 5 2.54 1.129 2.00 2.00
Mobile Computer Labs 45 8 1 5 3.02 1.340 3.00 2.00 Mean Help Received 50 3 1 5 2.79 1.009 2.67 3.00
aMultiple modes exist, lowest value reported. bDiscrepancy in total due to one teacher submitting identical questionnaires at both sites due to their assignment to both buildings

87
Table 17 Summary of Help Given Self-Assessment Data
N Range Mean Median Mode Valid Missing Min Max x s
Site 1
Document Camera (ELMO) 38 1 1 5 2.71 1.183 3.00 3.00 Computer Labs 39 0 1 5 2.51 1.189 3.00 3.00
Digital and Video Cameras 35 4 1 5 2.97 1.043 3.00 3.00 Mean Help Given 39 0 1 5 2.69 1.000 2.75 3.00
Site 2
Promethean Boards 29 4 1 5 2.67 1.047 3.00 2.00 Dukane DVD/VHS 33 0 1 5 2.88 1.147 3.00 3.00
Mobile Computer Labs 30 3 1 5 3.13 1.187 3.00 3.00 Mean Help Given 33 0 1 5 2.91 .939 3.00 3.00a
Site 3
Promethean Boards 15 6 1 4 4.10 1.165 5.00 5.00 Dukane DVD/VHS 16 5 1 5 3.28 1.179 4.00 4.00
Mobile Computer Labs 15 6 1 5 4.05 1.317 5.00 5.00 Mean Help Given 17 4 1 4 3.84 .884 4.00 4.67
Site 2 + Site 3 (Merged) b
Promethean Boards 43 10 1 5 3.28 1.161 3.00 3.00 Dukane DVD/VHS 48 5 1 5 2.83 1.191 3.00 3.00
Mobile Computer Labs 44 9 1 5 3.30 1.212 3.00 3.00 Mean Help Given 49 4 1 5 3.06 1.016 3.00 3.00
aMultiple modes exist, lowest value reported. bDiscrepancy in total due to one teacher submitting identical questionnaires at both sites due to their assignment to both buildings

88
Table 18
Summary of Social Interaction Construct Data
N Range Mean Median Mode Valid Missing Min Max x s
Site 1
Document Camera (ELMO) 38 1 1 25 6.92 5.966 4.00 4.00 Computer Labs 39 0 1 25 5.69 5.172 4.00 3.00a
Digital and Video Cameras 33 6 2 25 8.27 6.286 6.00 4.00a Social Interaction 39 0 1 25 6.81 5.457 5.00 500
Site 2
Promethean Boards 27 6 1 25 13.00 7.957 9.00 9.00 Dukane DVD/VHS 32 1 1 25 7.53 5.291 7.00 4.00a
Mobile Computer Labs 29 4 1 25 10.07 7.101 9.00 4.00a Social Interaction 32 1 1 25 9.33 5.279 8.78 7.00a
Site 3
Promethean Boards 17 4 1 25 6.35 5.396 5.00 4.00 Dukane DVD/VHS 17 4 1 25 7.41 5.580 6.00 6.00
Mobile Computer Labs 15 6 1 25 11.60 8.236 9.00 6.00 Social Interaction 17 4 1 14.67 7.26 4.004 6.67 4.00a
Site 2 + Site 3 (Merged) b
Promethean Boards 41 12 1 25 10.24 7.690 9.00 4.00a Dukane DVD/VHS 47 6 1 25 7.64 5.379 8.00 4.00a
Mobile Computer Labs 42 11 1 25 10.33 7.281 8.50 6.00 Social Interaction 48 5 1 25 8.77 4.856 7.75 4.00
aMultiple modes exist, lowest value reported. bDiscrepancy in total due to one teacher submitting identical questionnaires at both sites due to their assignment to both buildings
The primary reason these data were collected was to establish the ability of the
survey instrument to reliably measure access to social capital by teachers at the study site.
To do so, Cronbach’s alpha (Fraenkel & Wallen, 2003, p. 168) was calculated for each
technology at each site, using the individual access to social capital data, individual social
interaction scores, total social capital data, and total social interaction scores.
Unfortunately, the self-assessment variables are opposite in direction, with higher levels
of access to social capital equating to lower scores on the social interaction self-
assessment. In order to correct for this and conform to the assumptions of the statistical

89
test, dummy variables were used to mathematically reverse the social interaction
categories for purposes of this calculation. Table 19 presents the results of the analysis.
Table 19
Reliability coefficients for adoption data
Cases
No. of Items N Valid Excluded Cronbach’s alpha
Site 1
10
39
33
6
.639
Site 2
8 33 27 6 .687
Site 3
8 21 14 7 .639
Site 2 + Site 3 (Merged)
8 53a 39 14 .674
a Discrepancy in total due to one teacher submitting identical questionnaires at both sites due to their assignment to both buildings.
Cronbach’s alpha is used to test the null hypothesis: H0 = survey questionnaire
does not reliably measure access to social capital. Fraenkel and Wallen (2003) suggested
that a lenient alpha value of at least .60 was necessary to reject the null hypothesis in
exploratory research. Since the alpha variables in the study all exceeded that value, it
was determined that the survey questionnaire reliably measured access to social capital
by teachers in the study.
Summary of Results, Research Question 3
Several findings again emerged from the analysis of access to social capital at
each site. First, levels of access to social capital varied greatly, both between individual
technologies and between study settings as evidenced both by the large range of values
and by the very large standard deviations reported. Multiple factors (variables) influence
access to social capital, with each variable contributing an inherent variability and

90
sampling error. The construction of the access to social capital variable multiplies these
variations.
Once again, the divergence of measures of central tendency, distribution of access
to social capital values visualized in the histograms, skewness, kurtosis, and Shapiro-
Wilks W test all led to the conclusion that these data were not normally distributed.
Therefore, future analysis would require the use of statistical techniques robust to the
violation of this assumption.
The results of the Cronbach’s alpha revealed that the survey questionnaire
reliably measured access to social capital by teachers at all study sites. As discussed in
Research Question 2 above, this also helped to validate the methodology and use of
customizable instrumentation at each study site.
Variations existed in the access to social capital reported by teachers both within
and between study populations. Based on the work of Frank et al. (2004), who suggested
that variations in access to social capital may be responsible for the observed differences
in adoption of innovative technologies, this observation was used as justification for
conducting an analysis of the relationship between these variables (Research Question 6)
as well as to validate the definition of each study site as an independent sample in the
investigation.
Research Question 4
Did various sub-groups of teachers based on gender (male versus female),
assignment (academic versus elective), or grade level (elementary versus middle school)
exhibit different levels of technology adoption?
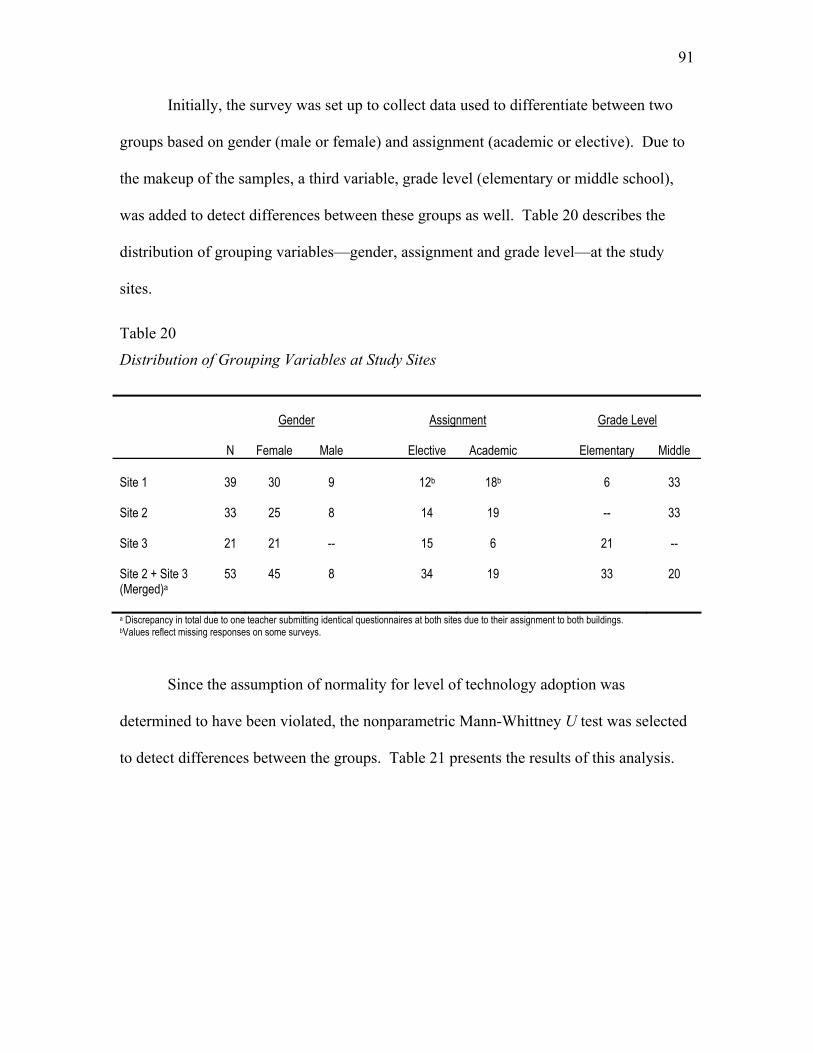
91
Initially, the survey was set up to collect data used to differentiate between two
groups based on gender (male or female) and assignment (academic or elective). Due to
the makeup of the samples, a third variable, grade level (elementary or middle school),
was added to detect differences between these groups as well. Table 20 describes the
distribution of grouping variables—gender, assignment and grade level—at the study
sites.
Table 20
Distribution of Grouping Variables at Study Sites
Gender
Assignment
Grade Level
N
Female
Male
Elective
Academic
Elementary
Middle
Site 1
39 30 9 12b 18b 6 33
Site 2
33 25 8 14 19 -- 33
Site 3
21 21 -- 15 6 21 --
Site 2 + Site 3 (Merged)a
53 45 8 34 19 33 20
a Discrepancy in total due to one teacher submitting identical questionnaires at both sites due to their assignment to both buildings. bValues reflect missing responses on some surveys.
Since the assumption of normality for level of technology adoption was
determined to have been violated, the nonparametric Mann-Whittney U test was selected
to detect differences between the groups. Table 21 presents the results of this analysis.

92
Table 21 Mann-Whittney U Test of Adoption Means between Groups
Gender
Assignment
Grade Level
N
U
Sig.
U
Sig.
U
Sig.
Site 1
39
117.000
.548
68.500
.094
98.000
.969
Site 2
33 95.000 .833 132.500 .985 -- b -- b
Site 3
21 -- -- 16.000 .023* -- b -- b
Site 2 + Site 3 (Merged)a
53 154.500 .525 263.500 .268 202.000 .018*
a Discrepancy in N due to one teacher submitting identical questionnaires at both sites due to their assignment to both buildings. b Unable to perform analysis due to only a single group at the study site. *Significant at the α = .05 level
The results of the non-parametric tests revealed only two significant differences
(α = .05) between groups. The first was between academic and elective teachers at Site 3.
However, even though a non-parametric test was used, the small N (21) and small cell
size (only six academic teachers in one of the groups) cast some doubt on the validity of
that result. The second significant difference was between elementary and middle school
teachers using the merged data for Sites 2 and 3. The researcher noted that significant
differences did not exist between these groups in the unmerged data, since Site 2 is
entirely a middle school and Site 3 entirely an elementary.
Summary of Results, Research Question 4
The non-parametric Mann-Whittney U test detected statistically significant
differences between academic and elective teachers at Site 3 as well as between
elementary and middle school teachers using the Site 2 and 3 merged data. These results
might be explained by small sample size (N = 21) at Site 3 and the fact that data were
collected at two different times in the merged data set. Because there was no pattern of
significant differences across the study populations, it was concluded that none of these

93
variables constituted a confounding variable when examining the relationship between
adoption of innovative technologies and access to social capital by teachers.
Research Question 5
Did various sub-groups of teachers based on gender (male versus female),
assignment (academic versus elective), or grade level (elementary versus middle school)
exhibit different levels of access to social capital?
The same groups that were used to examine patterns of adoption of innovative
technologies were also employed in an effort to answer this question. Likewise, the same
Mann-Whittney U test was used to test for significant differences between means at each
study site. Table 22 presents the results of the non-parametric test.
Table 22
Mann-Whittney U Test of Social Capital Means between Groups
Gender
Assignment
Grade Level
N
U
Sig.
U
Sig.
U
Sig
Site 1
39
123.000
.680
56.500
.023*
67.000
.200
Site 2
33 90.000 .672 128.000 .854 --b -- b
Site 3
21 -- b -- b 17.000 .026* -- b -- b
Site 2 + Site 3 (Merged)a
53 161.000 .623 259.500 .233 315.000 .781
a Discrepancy in N due to one teacher submitting identical questionnaires at both sites due to their assignment to both buildings. b Unable to perform analysis since only a single group present at study site. *Significant at the α = .05 level
The results of the non-parametric tests revealed two significant differences (α =
.05) between groups. Academic and elective teachers exhibited different levels of access
to social capital at Sites 1 and 3. However, two factors may have contributed to these

94
findings. First, at Site 1, nine teachers out of 39 (23%) neglected to provide this data.
This error in sampling may contribute significant error to the analysis. Second, there
were only six elective (extended core) teachers at Site 3. This small cell size likewise
casts doubt on the validity of this result.
Summary of Results, Research Question 5
Two significant differences were detected between academic and elective teachers
at Sites 1 and 3 by the non-parametric Mann-Whittney U test. The small number of
elementary teachers (n = 6) at Site 1 and the small population size (N = 21) at Site 3 cast
serious doubt on the validity of these result. It is likely that these findings are the result
of sampling error rather than actual differences between groups. Therefore, it was
concluded that none of these variables represented a confounding variable in examining
the relationship between level of adoption of innovative technologies and access to social
capital by teachers.
Research Question 6
Did a relationship exist between teachers’ access to social capital and level of
adoption of innovative technologies in the study setting?
This was the primary question posed to examine the research problem. Initial
scatter plots of the data (Appendix N, Figure N-3) suggested that a linear relationship
might exist between the research variables. Figure 17 is a representative example of
those scatter plots. Visual inspections of these scatter plots revealed the existence of
numerous extreme or outlier variables in the data.

95
Site 2
25000.0020000.0015000.0010000.005000.000.00
Total Access to Social Capital
150.00
120.00
90.00
60.00
30.00
0.00
Tota
l Lev
el o
f Ado
ptio
n: A
ll In
nova
tive
Tech
nolo
gies
Figure 17. Representative example of scatter plot: Adoption and access to social capital.
Before investigating any relationship between the research variables, it was
necessary to examine the extreme values present in the data and determine if they
accurately represented the level of adoption of innovative technologies and teachers’
access to social capital, or whether they represented errors in data collection and therefore
needed to be eliminated from the data as outliers. The original surveys were reviewed,
the respondents’ answers checked, and the adoption and social capital variables re-
calculated. No errors were detected in the coding of data. Similarly, those surveys were
compared to the electronic database and verified for accuracy. Again, no error in data
entry was detected.
Based on this analysis, it was determined that the extreme values in the data
accurately represented the adoption of innovative technologies and teachers’ access to
social capital. Support for these extreme values can be found in Rodgers (1985)

96
definition of “innovators,” who represent those technology users who adopt technologies
two or more standard deviations from the mean (see Figure 18). According to this model,
a few extreme values should exist in any group of technology adopters, representing this
small but influential group of technology innovators.
Figure 18. Rodgers (1985) innovator categories.
In order to explore any potential relationship between these variables, a
correlation coefficient needed to be calculated. Since neither the dependent variable
(level of adoption of innovative technologies) nor the independent variable (level of
access to social capital by teachers) were normally distributed, Spearman’s rho (rank-
order correlation coefficient—rs ) was used to examine the data. Myers and Well (2003)
pointed out that “…[the Spearman rho coefficient] diminishes the importance of extreme
scores” (p. 48). Both variables of interest exhibited significant negative skew, implying
that such extreme scores exist in the data, and providing support for the decision to use
this analysis technique. Table 23 reports the results of the correlation analysis for all
technologies at each site, as well as the aggregate value for each technology at each site.
Early Majority (34%)
Late Majority (34%)
Laggards (16%)
Early Adopters (13.54)
Innovators (2.5%)
X-2δ X-1δ X X+1δ

97
Table 23
Correlational Analysis: Adoption and Access to Social Capital
Spearman’s N rs Sig.
Site 1
Document Camera (ELMO) 39 .508 .001** Computer Labs 39 .226 .172
Digital and Video Cameras 39 .384 .016* Total Social Capital 39 .350 .029*
Site 2
Promethean Boards 33 .682 .000** Dukane DVD/VHS 33 .632 .000**
Mobile Computer Labs 33 .765 .000** Total Social Capital 33 .541 .001**
Site 3
Promethean Boards 21 .665 .001** Dukane DVD/VHS 21 .415 .061
Mobile Computer Labs 21 .640 .002** Total Social Capital 21 .643 .002**
Site 2 + Site 3 (Merged)
Promethean Boards 53 .618 .000** Dukane DVD/VHS 53 .587 .000**
Mobile Computer Labs 53 .727 .000** Total Social Capital 53 .563 .000**
*Significant at the α=.05 level **Significant at the α=.01 level
Summary of Results, Research Question 6
Results from the statistical tests clearly showed a strong, positive correlation
between level of adoption of innovative technologies and teachers’ access to social
capital. Nearly all the comparisons were significant at least the .05 level. Remarkably,
given the relatively small sample size, a majority of the significant correlations were, in
fact, significant at the .01 level. Only two technologies exhibited no significant
correlation: The use of computer labs at Site 1 (rs = .226, Sig. = .172) and the Dukane
DVD/VHS system at Site 3 (rs = .425, Sig. = .061). Since the second of these was nearly
significant, and the population size was fairly small (N = 23), it is possible that this

98
finding is the result of Type II error rather than an actual difference in the relationship
between the variables.
Based on the results of the correlational analysis, the researcher concluded that,
with the exception of the use of computer labs at Site 1, a statistically significant
relationship did indeed exist between level of adoption of innovative technologies and
teacher’s access to social capital. The discrepancy with computer labs may have been
caused by any number of factors. Perhaps computer labs are not particularly innovative,
or many teachers already used them prior to the test period. However, without a metric to
measure these assumptions, such analysis is purely speculative. Since the rest of the
findings in three different study settings, as well as three other technologies in the
building, all support the existence of a relationship between adoption of innovative
technologies and teachers’ access to social capital, it appears that the computer labs at
Site 1 were not perceived to be an innovative technology that would be impacted by
social capital.
Research Question 7
Did a relationship exist between several potentially confounding variables (age,
experience, on-site experience) and level of innovative technology adoption by teachers
in the study setting?
Given the relationship between level of adoption of innovative technologies and
access to social capital by teachers, the researcher was able to investigate the possibility
that several potential confounding variables may also have influenced level of adoption
of innovative technologies. Data were collected on three such variables: teachers’ age,
the number of years they had been teaching (experience), and the number of years

99
assigned to the study setting (on-site experience). Histograms of all potential
confounding variables (Appendix N, Figure N-4) were created. Figure 19 is a
representative sample of such a histogram.
6050403020
Age
10
8
6
4
2
0
Freq
uenc
y
Mean = 39.91Std. Dev. = 9.797N = 53
Site 2 + Site 3 (Merged)
Figure 19. Representative histogram of possible confounding variables and adoption.
Table 24 reports the distribution of each potential confounding variable at each
study site. Additionally, the Shapiro-Wilk W statistic was calculated as a test for
normality for each variable.

100
Table 24
Distribution of Potentially Confounding Variables
N Range Mean Median Mode Normality Valid Missing Min Max x s W Sig.
Site 1
Age 36 3 23 52 35.64 7.69 33.5 33 .927 .020* Experience 39 0 0 22 8.05 5.33 8 3 .941 .054
On-Site 39 0 0 11 3.10 3.24 3 0b .835 .000**
Site 2
Age 33 0 25 58 42.18 9.94 42 32b .952 .148 Experience 33 0 1 36 12.82 9.64 9 9 .909 .009**
On-Site 33 0 0 4 2.27 1.27 3 3 .858 .001**
Site 3
Age 21 0 27 56 36.86 8.90 37 28 .882 .016* Experience 21 0 1 28 9.57 6.96 8 6 .894 .027*
On-Site 21 0 0 4 2.38 1.28 3 3 .812 .001* Site 2+Site 3
(Merged) a
Age 53 0 25 58 39.91 9.80 40 43 .936 .007** Experience 53 0 1 36 11.47 8.83 9 3 b .890 .000**
On-Site
53 0 0 4 2.30 1.27 3 3 .842 .000**
a Discrepancy in N due to one teacher submitting identical questionnaires at both sites due to their assignment to both buildings. b Multiple modes exist, lowest value reported. *Significant at the α = .05 level **Significant at the α = .01 level
As expected, nearly all the potential confounding variables were normally
distributed at an α = .05 level. The only exceptions were age at Site 2 and experience at
Site 1 (though it was nearly significant). These results were probably due to the
relatively small population sizes (N = 39 and N = 21, respectively). Because the
potentially confounding variables were normally distributed but the level of adoption of
innovative technologies was not, Spearman’s rho was again selected to determine if a
relationship existed between the variables. Table 25 summarizes the results of these
analyses. No correlation between any of these variables and level of adoption was found
at any of the study sites.

101
Table 25
Correlational Analysis: Adoption and Potentially Confounding Variables Spearman’s
N rs Sig.
Site 1
Age 36 -.037 .828 Experience 39 -.090 .854
On-Site 39 .182 .269
Site 2
Age 33 .110 .541 Experience 33 .030 .869
On-Site 33 .238 .183
Site 3
Age 21 -.049 .832 Experience 21 -.193 .401
On-Site 21 .141 .542
Site 2 + Site 3 (Merged) a
Age 53 .190 .172 Experience 53 .046 .742
On-Site 53 .197 .157
a Discrepancy in N due to one teacher submitting identical questionnaires at both sites due to their assignment to both buildings.
Summary of Results, Research Question 7
Based on results of this analysis, it was concluded that no statistically significant
relationship existed between any of the potentially confounding variables and level of
adoption of innovative technologies at the .05 level. This meant that, while a statistically
significant relationship existed in every study setting between access to social capital and
the level of adoption of innovative technologies, no such relationship was detected for
more common factors drawn from diffusion of innovation literature. This finding
supported the basic premise of the research that access to social capital was not only a
contributory factor to adoption of innovative technologies, but in fact the primary factor
in the adoption process.

102
Research Question 8
Did a relationship exist between several potentially confounding variables (age,
experience, on-site experience) and level of innovative technology adoption by teachers
in the study setting?
Only three cases were detected where a confounding variable had an effect on one
of the study variables (Table 26).
Table 26
Significant Confounding Variables ( α = .05)
Significant Confounding Variables
Site 1 Grade Level (Social Capital)
Site 2
None
Site 3
Assignment (Social Capital)
Site 2 + Site 3 (Merged)
Grade Level (Adoption of Technology)
Note: Parentheses indicate variable affected by confounding variable.
As discussed in the appropriate sections above, the validity of each of these
findings is suspect based on small sample size, sampling error, or other reasonable
explanations. Therefore, while statistically significant, they were rejected as confounding
variables for purposes of evaluating the relationship between adoption of innovative
technologies and access to social capital by teachers.
Summary of Results, Research Question 8
Since none of these variables was consistent across all study sites, technologies,
or study variables, and evidence existed that questions the validity of the finding of
significance, it was determined that there were no confounding variables that impacted
the overall relationship between access to innovative technologies and teachers’ access to

103
social capital in the study. Because no meaningful, significant factors were identified,
that could not be explained away sampling and data collection errors, no further analysis
of the relationship between research variables was necessary.
Discussion
Few would argue the fact that good research is the product of quality data and
appropriate statistical analysis. Just as important, however, is the careful consideration of
assumptions made and existing limitations. The following is a brief discussion of these
considerations as they pertain to the more important findings from the research study.
Site Selection and Instrument Customization
The sample used in the research was limited by feasibility, access, and suitability
of the site for data collection. The study was further limited by the methodology used to
collect data. While it was established that the survey questionnaire was valid during the
instrument development process, the data generated may have been more prone to bias
based on self-response than data collected via more direct observational methods. On the
other hand, the use of survey methods did allow the researcher to collect data from a
larger number of participants in a short time period. In all, the chosen methodology
provided a reasonable balance between the need for a manageable sample size while still
controlling for as many other variables as possible.
A concerted effort was made to locate a suitable instrument prior to beginning the
research. Several potential instruments related to the investigation of technology
adoption or access to social capital were found. One promising questionnaire was the
Teaching with Technology Instrument (TTI; Atkins & Vasu, 1998). According to the
authors, the instrument was intended to help plan for professional development of

104
teachers by measuring their knowledge and use of technologies. However, after review
of the instrument, the researcher determined that the instrument was better suited to
assessing teachers’ knowledge of the use of technology, rather than documenting their
actual level of adoption. Grootaert et al. (2004) presented the Integrated Questionnaire
for the Measurement of Social Capital (SC-IQ). The purpose of the survey was “to
provide a core set of survey questions for those interested in generating quantitative data
on various dimensions of social capital as part of [other surveys]” (p. 1). Upon review of
the questionnaire, it became obvious that the questions were far better suited to
examining patterns of social capital at the national level, taking into account a sample
drawn from all segments of the populations. It became clear that, while the instrument
could differentiate between groups from different backgrounds, nationalities, income
levels, or other socio-economic classes, it was ill-suited to detect differences in access to
social capital in the somewhat homogenous micro-segment of the population represented
by teachers in the study setting.
Since innovative technologies within a particular district was the focus of the
research, no existing instrument offered the unique cross section of technologies targeted
by this study. In addition, the measurement of social capital was also unique at each site.
The instrumentation used by Frank et al. (2004) was the most promising but, again, not
specific enough to address the exact research questions posed. However, it did serve as a
foundation upon which one could base the questions of a custom survey. Rather than
writing entirely new questions, slight modifications of the questions in the Frank et al.
survey were used to more specifically address the particular technologies and details of
social interactions necessary to collect data at each site.

105
Last, the use of a custom instrument for each study setting prohibited reliability
testing of the instrument before it was administered. Therefore, data were collected on
the instrument using different questions to evaluate the research variables. This allowed
for the calculation of a reliability statistic (Chronbach’s alpha) in a post hoc test of
reliability. In essence, each survey represented a pilot study. However, the repetition of
the instrument customization process in multiple settings, coupled with the finding of
post hoc reliability, served to provide some validation of the instrument customization
process, if not the actual survey instrument.
In summary, several technologies were identified as innovative at each study site
based on a structured interview and used to customize a survey instrument for each
setting. Data were collected from each site and used to examine both teachers’ level of
adoption of those innovative technologies as well as their access to social capital. The
data for each of these variables exhibited noteworthy variation and non-normal
distribution. Minimal differences between differing groups of teachers were detected,
which could be explained by sampling error. A post hoc test was used to determine that
the customized survey instrument reliably measured each of the research variables. A
statistically significant correlation between level of adoption of innovative technologies
and teachers’ access to social capital was also detected. However, none of the potentially
confounding variables tested were determined to modify the relationship between the
research variables.

106
Chapter 5: Summary, Conclusions, and Recommendations
This chapter summarizes the research conducted and findings that emerged.
Conclusions are drawn from those findings. Also included are the implications of the
findings for teachers, administrators, and technology leaders in schools. Finally,
recommendations for further research are presented.
Summary
This research project began with the observation that teachers in the United States
are provided with access to a variety of innovative technologies that promise to improve
their teaching practice. In examining the use of these technologies, previous research had
shown that, despite this access, teachers were slow to adopt these technologies.
Typically, these researchers drew on diffusion of innovation and social network theory to
examine the potential cause of this lag in adoption. Emerging from this research,
teachers’ access to social capital was identified as a promising contributory factor.
However, little research could be identified that specifically explored this link between
access to social capital and adoption of innovative technologies in schools. Therefore,
this research study sought to empirically explore these two variables and evaluate any
relationship between them.
In order to conduct the investigation, data were gathered from teachers at three
schools located in two buildings within a single school district. Qualitative data were
obtained through structured interviews to identify potentially innovative technologies and
to customize a survey instrument (adapted from Frank, et al., 2002) to examine those
technologies at each individual site. Quantitative data collected via these survey

107
instruments was then used to characterize and evaluate both the level of adoption of each
innovative technology and teachers’ access to social capital. Further statistical analysis
was conducted to establish that a relationship existed between these factors. Last, data
were collected to examine if several potentially confounding variables contributed to that
relationship. Based on addressing the eight formal research questions posed by the
researcher, several important findings and understandings emerged from the study and
are presented below.
Using the data collected during the innovative technology identification meetings,
it was established that multiple innovative technologies existed in each study setting.
While many such innovative technologies were present at each site—as would be
expected within a single school district—it was noted that some variation among those
innovative technologies also existed. This was important in that, since the specific
technologies differed from site to site, it could be established that each site represented a
unique and independent population, and therefore data and results from one site could not
be combined with other sites to represent a larger, general population.
When examining the data on level of adoption of innovative technologies, it was
noted that none of the technologies identified were used by all teachers. This provided
evidence that these technologies qualified as innovative. More importantly, since these
technologies were available to all teachers but not used by all, it was shown that the
underutilization of innovative technologies identified as a significant research problem
did indeed exist in the study populations.
As predicted by diffusion of innovation theory, variation existed among the level
of adoption of innovative technologies by individuals at each site, thereby giving

108
credence to the idea that some factor or factors was contributing to this variation.
Because each site represented a unique population and used unique combinations of
innovative technologies, the use of a customized instrument was indicated. Due to the
fact that each instrument needed to be somewhat unique, it became impossible to identify
and use an existing instrument for this purpose. Because of this restriction, the post hoc
reliability of each instrument was measured using Cronbach’s alpha. The results of this
analysis indicated that the use of customized instruments did reliably measure levels of
adoption of innovative technologies at each site.
Analysis of the distribution of adoption of innovation data indicated that it was
not normally distributed. This revelation was important in the selection of analysis
techniques used later in the study.
Similar findings were uncovered when the teachers’ access to social capital was
evaluated at each study site. Variations again existed. These data were also not normally
distributed. Likewise, the results of Cronbach’s alpha showed that, even though a
customized instrument was used for each study site, those instruments did reliably
measure access to social capital.
Both access to social capital and level of adoption of innovative technologies
were further examined within a variety of binomial subgroups based on gender (male or
female), area of assignment (academic or elective), and grade level (elementary or middle
school). Only a few such differences were detected. Upon deeper analysis, it was
established that all of these findings were probably due to sampling error and small
population sizes and not indicative of actual differences in the study populations.
Therefore, based on the research methodology used, it was determined that these

109
variables did not represent statistically significant contributing factors in the context of
this study.
Spearman’s rho (rs) was the statistical tool used to evaluate the relationship
between teachers’ adoption of innovative technologies and access to social capital. A
significant positive correlation did indeed exist between the research variables.
Three factors gleaned from the literature on diffusion of innovation were tested to
see if they might modify this relationship. These factors included age, teaching
experience and years working at the study site, all measured in years. Spearman’s rho
(rs) was again used evaluate the relationship. No statistically significant correlation was
found between these potential co-variables and the research variables.
In summary, the methodology allowed for the identification of innovative
technologies present in the study settings, as well as the collection of data to reliably and
empirically measure the level of adoption of those innovative technologies, and the
teachers’ access to social capital. A statistically significant positive relationship was
found to exist between these variables. Last, no such statistically significant relationship
was present when examining factors including age, years of teaching experience, and
number of years assigned to the study setting.
Conclusions
Drawing from the findings of the research study, several conclusions about the
adoption of innovative technologies and access to social capital by teachers are posed
below.
The innovative technology identification teams at all study sites had little
difficulty identifying numerous “new” technologies present at each school. Further, the

110
existence of multiple and unique innovations at each site led to the conclusion that
teachers are routinely exposed to these innovations.
The analysis of level of adoption of individual innovative technologies yielded
two important facts. First, none of the technologies was routinely used by all teachers,
supporting the conclusion that these technologies were indeed innovative. Secondly, the
variation in levels of adoption allowed one to conclude that many of these technologies
were in fact underutilized, as predicted by previous research.
Similarly, it was noted that teachers exhibited differing levels of access to social
capital. Furthermore, the variation in access to social capital was positively correlated
with level of adoption of innovative technologies. This allowed one to conclude that
teachers with higher access to social capital also exhibit higher levels of adoption of
innovative technologies. One exception to this conclusion emerged from the results from
the analysis of Computer Lab usage at Site 1. This discrepancy led to the conclusion that
a more precise definition of innovative technologies and / or level of adoption is desirable
for future studies.
The considerable variation noted in both level of adoption of innovative
technologies and teachers’ access to social capital further suggested that participants’
unique interpretations of innovative technologies and/or social capital may have
introduced a degree of error into the results. Based on this assumption, it was concluded
that more precise definitions and/or explorations of these variables are indicated for
inclusion in future research.
In examining this relationship between research variables, variations in access to
social capital and level of technology adoption were not present in common subgroups of

111
teachers based on gender, teaching assignment, and instructional level. Furthermore, no
relationship between level of adoption and common confounding variables (age,
experience and length of assignment) was detected. Based on these findings, social
capital was identified as the main contributory factor. Furthermore, none of the
potentially confounding variables contributed significantly to the observed variance in
level of technology adoption.
Last, and perhaps most important, the existence of the relationship between
teachers’ access to social capital and level of adoption of innovative technologies yielded
the conclusion that actions by change agents in schools aimed at increasing teachers’
access to social capital may lead to increased adoption of innovative technologies and
therefore more efficient and effective use of scarce resources.
Recommendations
Future studies in a variety of settings will be needed before a comprehensive
model explaining the complex relationship between the study variables can be
constructed. However, should the relationship between teachers’ access to social capital
and level of adoption of innovative technologies prove valid in the general population,
this understanding promises to be a powerful tool with the potential to aid teachers,
administrators, and government policy makers to more efficiently and effectively utilize
their innovative technology resources. A discussion of several recommendations follows.
Important recommendations have been underlined for emphasis
Recommendations for Teachers
Teachers may stand to benefit the most from the knowledge gained during this
study. To do so, they must first recognize that multiple innovative technologies are

112
present in their workplace. Rather than waiting passively for these technologies to work
their way into their daily teaching practice, teachers should look to each other for the
help, support, and assistance they need when learning to use those technologies. This
will require that they not only tap existing social communication channels but actively
seek out new sources of knowledge, help, and support. Additionally, teachers must learn
to identify roadblocks to social interaction and work towards removing them, allowing
the free flow of expertise to occur. Furthermore, once they learn to use innovative
technologies available to them, they must also employ their social network to disseminate
that knowledge to other teachers.
Finally, teachers should seek out new technologies and bring them into their
buildings, secure with the knowledge that the requisite skills and knowledge necessary to
drive the adoption of those innovations reside within the social structure of the school.
These understandings must also be communicated to post-secondary students and
pre-service teachers as they prepare to enter the teaching profession. These fledgling
teachers potentially represent a great source of social capital based on the specialized, up-
to-date, and perhaps “innovative” knowledge, skills, and techniques they possess. When
one considers that veteran teachers gain their social capital through experience and social
interaction, it is apparent that both new and old teachers can make significant
contributions to the adoption of innovation process.
Recommendations for Administrators
Similarly to teachers, administrators must recognize that innovative technologies
exist within their schools. They must also recognize that the teachers assigned to the
building represent, in and of themselves, change agents who can be empowered to drive

113
the adoption of those innovative technologies. Administrators must also seek to enable
the creation of social capital. This might take many forms: scheduling teachers time to
interact, creating common meeting areas, devoting professional development time to the
transfer of knowledge on the use of innovative technologies, and so on. While a cost—
perhaps significant—can be associated with these measures, it can be recouped both in
the elimination of outside sources of help, training, and support, as well as through the
potential for increased productivity brought about through the use of those technologies.
The social network existing within a school building is a valuable resource.
Administrators must strive to lean all they can about their human assets and manage these
assets to maximize the impact these actors can apply.
Last, administrators must recognize that they themselves are part of the social
network in the school and should also participate in the exchange of knowledge, skills,
and support needed to drive the adoption of innovative technologies. Uniquely,
administrators are in the position to act as both the facilitators and actors in the adoption
process.
Recommendations for Government Policy Makers
Government policy makers must recognize that innovative technologies are
widely available in schools. However, it can also be argued that these resources are
underutilized. Therefore, these policy makers should shift the focus of their efforts
towards driving the adoption of these innovations, rather than on the continual acquisition
of new technologies with little or no thought to their deployment. This should include
specifying funding for the professional development of teachers in the use of existing
technologies. Since this study has shown that teachers’ access to social capital is the

114
primary factor in that adoption, these efforts should be directed at increasing that social
capital. Such efforts might include support and funding for research on the relationship
between adoption of innovative technologies and teachers’ access to social capital,
increasing the quality and quantity of social interaction among teachers, and providing
funding towards removing obstacles to such social interaction.
Suggestions for Further Study
This research study was exploratory in nature. Future research should be
conducted to explore the adoption of innovative technologies in schools and teachers’
access to social capital. The purpose of these studies should be both to duplicate the
findings of this study and to expand the inquiry to pertinent related topics. The following
discussion suggests several areas that future researchers might focus on in their
exploration of these variables and the relationship(s) between them.
Research Methodologies
In order to validate the findings of this research and potentially expand those
findings to the general population, future researchers must repeat this study, both in
similar settings and by applying the methodology to related settings—larger schools,
colleges, adult education, technical training, and apprenticeship programs, and so on.
Innovative technology identification meetings with key technology policy makers
in schools could be used as a stand-alone tool to both identify innovative technologies
and plan teacher professional development targeted at improving the usage of those
innovations. Likewise, the customized survey methodology used in this study could be
used to quickly provide technology leaders with a snapshot of the existing state of
adoption of innovations present in school settings.

115
Further research will also lead to incremental revisions to the survey instrument
used in this study. Such improvements might focus on making the instrument more
precise and less prone to differences in interpretation. It is unlikely, but possible, that
these revisions may eventually lead to a multi-purpose instrument that could be used in
any study setting. The advantage to this approach would be increased confidence in the
results due to the use of an instrument judged as both valid and reliable prior to its
deployment as part of the study.
Larger studies should also be conducted. Besides adding to the predictive power
of the results, these studies may provide the opportunity for true random sampling. This
in turn may lead to a more normal distribution of data and the ability to use more
powerful statistical analytic techniques to investigate the relationship between level of
adoption of innovative technologies and teachers’ access to social capital.
Innovative Technologies
One interesting finding emerging from this research study was the reported
existence of multiple innovative technologies at each site. One possible area of inquiry
would focus on studying this phenomenon in multiple sites to establish whether
innovative technologies are indeed pervasive in schools today.
It may also desirable to characterize “innovative” in the context of educational
technologies. To that end, a comprehensive qualitative investigation of innovations in
school settings might be conducted. Such a project should include multiple methods and
multiple modes of data collection in an attempt to precisely define what is, and is not,
truly innovative in school settings. This understanding would also be useful in future
repetitions of this research study, as it would allow the researcher to more precisely

116
customize the survey questionnaire to accurately collect data on adoption of those
technologies.
Alternate methods for determining the existence of innovative technologies in
schools could also be investigated. Rather than relying on qualitative, self-reported
methods as in this study, direct observation, historical research, or physical inventory
could provide an objective measure of the technologies present at a research site.
Last, research should focus on the shelf life of technology adoption. It is unlikely
that the methodology used in this research study—limiting the exploration of adoption of
innovative technologies to a single semester—accurately reflect the actual life cycle of
those innovations, from acquisition through initial usage and ending with pervasive
adoption or rejection of the technology. It may be more enlightening to identify an
innovative technology and follow it through the adoption process, from beginning to end.
Such a case study may reveal factors or characteristics of the technology or the teachers
that were not captured by this study.
Adoption of Innovative Technologies
Once the existence of innovative technologies has been established, the question
of whether or not they are fully utilized emerges. In this study, teachers self-reported
their level of usage or each technology. A more precise measurement may be more
desirable. Case studies or direct observations could be used to more objectively measure
teachers’ level of usage of innovative technologies.
Future researchers might use the existing methodology, but define adoption more
specifically by more rigorously defining the use of each innovation. Perhaps adoption
could be measured in minutes, hours, or days rather than the more vague “occasions.”

117
This might require the use of participant journals, direct observation, or video taping
teachers in the classroom to accurately collect such data.
A study that focuses on innovative technologies present in multiple schools, as
well as on the intended use of each technology, could be of interest to policy makers. For
instance, in this study, the LCD Projectors at Site 1 and the Promethean Boards at Site 2
may serve similar functions. From an economy of scale standpoint, the school district
might have been better served to adopt one or the other as standard at all schools, thereby
condensing the training, support, and maintenance required.
Teachers’ Access to Social Capital
While it is interesting to know that increasing teachers’ access to social capital
leads to an associated increase in level of adoption of innovative technologies, a deeper
understanding of the complex interactions that make up that social capital promises to
provide the basis for many future studies. Beyond simply measuring teachers’ self-
reported interactions, a researcher might conduct one-on-one observations, case studies,
or other research to precisely measure such interaction. Furthermore, research should be
conducted to uncover other factors that may contribute to social capital—direct
interaction, indirect interaction, rank or social standing, cultural or gender norms, and so
on.
The researcher feels strongly that future research should also attempt to
differentiate between channels of communication to see if any particular method of
exchanging knowledge, skills, and support is better suited to increasing the level of
adoption of innovative technologies. These might include casual conversation (during
breaks), formal conversations (during professional development meetings), electronic

118
communication (email and chat), written communication (training documents) or other
factors.
Author’s Comments
(Note: Due to the introspective nature of this section, it has been intentionally
presented in the first person.) As a teacher/researcher, I have the unique opportunity to
bring together my two existing social networks—both academic and professional. This
research project represents not only an academic exercise, but an attempt to better
understand my own professional practice. There are multiple purposes for this
introspective investigation, including a desire to improve my teaching, improve the
achievement of my students, and inspire or empower my colleagues to take full
advantage of the technological advancements available to them as teachers.
Upon completion of this project, many opportunities have presented themselves to
put the knowledge gained from the study into practice. One improvement to my personal
professional practice immediately springs to mind. While I consider myself an “early
adopter” or “innovator” when it comes to educational technologies, this study has made
me realize that there are many innovations available to me personally, that for one reason
or another have not found their way into my daily practice. However, I also know that
many of my colleagues are using them successfully in their classrooms. It is now
incumbent on me to draw on that expertise and learn to incorporate those technologies
into my own classroom. Likewise, I need to begin to disseminate the expertise I possess
outward to my colleagues—especially those who are somewhat hesitant or resistant to
adopting new technologies.

119
While the pursuit of personal improvement is a meaningful goal, it is in the arena
of professional leadership that I feel the knowledge gained from this study will best be
employed. By combining suggestions for improved policy and practice, backed by
empirical data, it may be possible to convince educators that social interaction is a
potentially powerful tool for the improvement of teaching practice. Since social
interaction is, by definition, a participatory activity, strong leadership both externally
(from administrators and policy makers) and internally (from other teachers) will be
needed to encourage all teachers to draw on the expertise latent in their existing social
network. A paradigm shift in approach may be needed to make this work. The
traditional role of leaders—who set goals, agendas, and procedures for the persons
underneath them in the organization—runs counter to the findings of this study. In order
to draw on the social network, those leaders must be part of the social network and “lead
by example.” As a leader, I myself must create a school culture, through my personal
actions, in which the free exchange of ideas and expertise are not only encouraged, but
required.
By employing the understandings generated by this project, I will continue to
grow as a professional. However, the opportunity to grow as a researcher also exists.
This study represents only a preliminary step in the understanding of the relationship
between access to social capital and adoption of innovative technologies in schools. The
results of this study have suggested many new, relevant research questions to me,
including questions about the nature of communication within social networks, the
definition of innovation as it applies to educational technologies, and the role of
leadership in changing school culture. Primarily of interest to me is a deeper

120
investigation of the social networks in school. It appears to me that significant future
investigation will be needed to identify, describe, and quantify the many potential factors
that influence or impact the creation of social capital by teachers. Only by rigorous
examination of these factors can the true nature and potential of these powerful social
networks be understood, harnessed, and put to use.
While the repetition of this study in other settings should be undertaken, my next
research project will probably focus on a deeper investigation of social networks in
schools. Likewise, that research will probably tend towards the action research realm of
investigation—the acquisition of knowledge not only for knowledge’s sake, but for the
improvement of my own professional practice.
Closing Remarks
Increasing teachers’ access to social capital leads to an increase in level of
adoption of innovative technologies. While seemingly a simple observation, this finding
represents the first step in empowering classroom teachers to improve their teaching
practice through the use of emerging technologies. In the modern educational climate of
increased demands on teachers and shrinking budgets, this promises to be not only an
effective tool, but relatively inexpensive to implement. It is no longer acceptable to
simply provide teachers with new technologies with little or no thought given to teaching
them how to use them. However, this research has shown that this assistance does not
necessarily have to be external, but may indeed exist within the existing social structure
of schools; an underutilized resource simply waiting to be tapped. In closing, one would
be wise to reflect on the sage advice of E. F. Schumacher (1973), who noted: “…it is

121
somewhat foolhardy to put great power into the hands of people without making sure that
they have a reasonable idea of what to do with it” (p. 86).

122
References Cited
American Psychological Association. (2001). Publication manual of the American
Psychological Association (5th ed.). Washington, D.C.: American Psychological
Association.
Atkins, N. E. & Vasu, E. S., (1998). The Teaching with Technology Instrument:
Effectively measuring where teachers are and planning for staff development.
Learning and Leading with Technology 25(8), 35-39.
Bijker, W. E. (2001). Understanding technological culture through a constructivist view
of science, technology and society. In S. H. Cutcliffe & C. Mitcham (Eds.),
Visions of STS: counterpoints in science, technology, and society studies. Albany:
State University of New York Press.
Buckingham, A., & Saunders, P. (2004). The survey methods workbook: From design to
analysis. Cambridge: Polity Press.
Bush, G.W. (2001). No child left behind. Washington, D.C.: U.S. Department of
Education. Retrieved November 11, 2006 from: https://www.whitehouse.gov/
news/reports/no-child-left-behind.pdf.
Cuban, L. (1986). Teachers and machines: The classroom use of technology since 1920.
New York: Teachers College Press.
Cuban, L., Kirkpatrick, H, & Peck, C. (2001). High access and low use of technologies
in high school classrooms: Explaining an apparent paradox. American
Educational Research Journal, 38(4), 813-834.

123
Cutcliffe, S. H. (2000). Ideas, machines and values: An introduction to science,
technology and society studies. Lanham, MD: Rowman & Littlefield Publishers,
Inc.
DuFour, R., & Eaker, R. (1998) Professional learning communities at work: Best
practices for enhancing student achievement. Bloomington, Indiana: National
Education Service.
Eastern Michigan University Dissertation Manual. (2006, Fall). Ypsilanti, MI: Eastern
Michigan University Graduate School. Retrieved May 28, 2007 from
http://www.gradschool.emich.edu/downloads/downloads_subdir/thesisdissert/diss
ertation/Diss_MANUAL.pdf.
Eastern Michigan University Request for Human Subjects Approval. (2006, September).
Ypsilanti, MI: Division of Academic Affairs. Retrieved May 28, 2007 from:
http://ord.emich.edu/downloads;downloads_subdir/humansubjects/emu_forms/ap
p_form_word6.doc.
Finley, L. & Hartman, D. (2004). Institutional change and resistance: Teacher
preparatory faculty and technology integration. Journal of Technology and
Teacher Education, 12(3), 319-337.
Fraenkel, J. R., & Wallen, N. E. (2003). How to design and evaluate research in
education (5th ed.). Boston: McGraw Hill.
Frank, K. A., Zhao, Y., & Borman, K. (2004). Social capital and the diffusion of
innovations within organizations: The case of computer technology in schools.
Sociology of Education, 7(2), 148-171.

124
Gray, K. C., (2001). Teachers’ perceptions of innovation adoption. Action in Teacher
Education, 23(2), 30-35.
Grootaert, C., Narayan, D., Nyhan-Jones, V., and Woolcock, M. (2004). Measuring
social capital: An integrated questionnaire. Washington, D. C.: The World Bank.
Holland, P. E. (2001). Professional Development in Technology: Catalyst for school
reform. Journal of Technology and Teacher Educations, 9(2), 245-267.
Hurlburt, R. T. (2003). Comprehending behavioral statistics [3rd ed.]. United States:
Wadsworth.
Isaac S. and Michael, W. B. (1995) Handbook in research and evaluation [3rd ed]. San
Diego, California: Educational and Industrial Testing Services.
Johnson, Frank (2006). Current expenditures for public elementary and secondary
education: School year 2003-04 (NCES 2006-352). U.S. Department of
Education. Washington, DC: National Center for Education Statistics. Retrieved
November 22, 2006 from
http://nces.ed.gov/pubsearch/pubsinfo.asp?pubid=2006352.
Kleinman, D. L. (2000a). Democratization of science and technology. In D. L.
Kleinman (Ed.), Science, technology & democracy. Albany: State University of
New York Press.
Kleinman, D. L., (Ed.) (2000b), Science, technology & democracy. Albany: State
University of New York Press.

125
Kollie, E. (2005). Tools of the trade: Investing in all kinds of technology makes sense for
many reasons, not the least of which include improved education, productivity
and efficiency for financial savings. School Planning and Management 44(8), 23-
25.
Lancaster, P. E., & Lancaster, S. J. C. (2002). Integration, access, & preparation: A
school of education’s efforts to enhance a state’s technology program. Journal of
Special Education Technology(17)(4) p. 45-8.
Loveless, T. (1996). Why aren't computers used more in schools? Educational Policy,
10(4), 448-467.
McRobie, G. (1981). Small is possible. New York: Harper & Row, Publishers, Inc.
Myers, J. L. & Well, D. A. (2003). Research design and statistical analysis [2nd ed.].
Mahwah, New Jersey: Lawrence Erlbaum Associates.
National Commission on Excellence in Education (1983). A nation at risk: The
imperative for educational reform. Retrieved October 1, 2005 from the United
States Department of Education Web site: http://www.ed.gov/pubs/NatAtRisk/
index.html.
Nutt, P. & Backoff, R. (1992). Strategic management of public and third sector
organizations. San Francisco: Jossey-Bass Publishers.
Pearson, G. & Young, T. (Eds.). (2002). Technically speaking: Why all Americans need
to know more about technology. Washington, DC. National Academy Press.
Pool, R. (1997) Beyond engineering: How society shapes technology. New York: Oxford
University Press.

126
Rai, R. K. (2004). Development and implementation of technology plans in Tennessee
public school systems. Dissertation Abstracts International, 66 (01), 77A. (UMI
No. 3162012).
Rodgers, E. M. (1995). Diffusion of innovations [4th ed.]. New York: The Free Press.
Schön, D. A. (1983). The reflective practitioner: How professionals think in action.
United States: Basic Books.
Schumacher, E. F. (1973) Small is beautiful: a study of economics as if people mattered.
London: Blond & Briggs Ltd.
Shibley, I. A. (2001). Technology integrated learning, staff development: It's a total
package. Educational Technology, 41(6), 61-63.
Smerdon, B., Cronen, S., Lanahan, L., Anderson, J., Iannotti, N., & Angeles, J. (2000).
Teacher’s tools for the 21st century: A report on teacher’s use of technology
(Statistical Analysis Report). (Report No. NCES-2000-102). Washington DC:
National Center for Education Statistics. (ERIC Document Reproduction Service
No. ED444599).
Snyder, T. D., Tan, A. G., & Hoffman, C. M. (2005). The digest of education statistics,
2005. (Report No. NCES-2006-030). Washington, DC: National Center for
Educational Statistics. (ERIC Document Reproduction Service No. ED492945).
Towle, A. (1989). Modern biology. New York: Holt, Rinehart and Winston.
United States Congress. (2001). No child left behind act of 2001. Public Law 107-110,
107th Congress. Washington, DC: Government Printing Office.

127
United States Congress, Office of Technology Assessment. (1995). Teachers and
technology: Making the connection. (Report No. OTA-EMR-616). Washington
DC: U.S. Government Printing Office. (ERIC Document Reproduction Service
No. ED386155).
Van Duijn, M. A. J., & Vermunt, J. K. (2006). What is special about social network
analysis? Methodology 2(6), 2-6.
Wells, J., & Lewis, L. (2006). Internet Access in U.S. Public Schools and Classrooms:
1994–2005 (NCES 2007-020). U.S. Department of Education. Washington, DC:
National Center for Education Statistics.
Yager, R. E. (2002). Science-technology-society and education: A focus on learning and
how persons know. In S. H. Cutcliffe & C. Mitcham (Eds.), Visions of STS:
counterpoints in science, technology, and society studies. Albany: State
University of New York Press
Zhao, Y., & Cziko, G. A. (2001) Teacher adoption of technology: A perceptual control
theory perspective. Journal of Technology and Teacher Education, 9(1), 5-30.
Zhao, Y. & Frank, K. A. (2003). Factors affecting technology uses in schools: An
ecological perspective. American Educational Research Journal, 40(4), 807-840.
Zhao, Y., Pugh, K., Sheldon, S., & Byers, J. (2002). Conditions for classroom teacher
innovations. Teachers College Record 104(3), 842-515.

128
Appendices

129
Appendix A: Research Procedure Schematic
Q8
Summarize Results, Draw Conclusions, and
Make
Repeat Instrument Development and Data
Collection at Similar Site(s)
Descriptive Statistics Correlation Mann-Whittney U Partial Correlation or Regression Research Questions
Q
Examine Relationship(s) Between Adoption and
Social Capital Q6
Evaluate the Impact of Significant Confounding
Variables on the Relationship between Adoption and
Access to Social Capital
Examine Relationship(s) Between Adoption and
Mediating Variables
Q7
Review Literature, Obtain UHSRC Approval, and Identify Potential Study Site
Collect Documentation and Secure Appropriate Permissions
Interview Policy Makers
Develop Instrument
Q1
Q1
Conduct Pilot Study
UHSRC Instrument Approval
UHSRC Instrument Approval
Refine Instrument
Collect Data
Describe Access to Social Capital (IV)
Describe Level of Adoption (DV)
Describe Potential Mediating Variables: Age,
Experience, On-Site Experience
Q2 Q3
Q1
Examine Differences in Access to Social Capital among
sub-groups Q5 Q4 Examine Differences in Level of
Adoption among sub-groups

130
Appendix B: Details of Innovative Technology Identification Meetings
The following script/outline was used to conduct each meeting:
1. Welcome attendees to meeting. Pass out informed consent agreements. Record
persons in attendance, as well as their assignment / capacity within the study
setting.
2. Introduce researcher and give brief overview of research project.
3. Give participants an opportunity to ask any questions. Collect signed informed
consent agreements.
4. Define “innovative technology” for participants. Prompt: “For purposes of the
research project, an innovative technology can be a piece of equipment, program,
process or other resource available to all teachers. It must be new enough that not
all teachers have fully adopted it as of Fall semester 2007.”
5. Solicit a list of innovative technologies present in the study site. Prompt: “What
innovative technologies are present in your building?”
6. Record all responses in research notebook. Researcher may not be familiar with
all technologies, so further explanation could be requested. Typical prompts:
“What is that exactly?”, “How would a teacher use that?”, “Is that similar to...?”
7. Encourage more ideas. Prompt: “Are there any other innovative technologies
you can think of?”
8. As list grows, continue to read list to participants and have them discuss whether
all of the technologies still belong on the list. Typical prompt: “Do you still think
that XXXXX is an innovative technology?” Remove any technologies that
participants agree does not belong.

131
9. For remaining items, ask if two or more could be combined under one title.
Prompt: “Do any of these technologies depend on one another, or could a single
technology cover both?”
10. Remind participants that the study seeks to limit the innovative technologies
under observation to between two and four technologies. Prompt: “Remember,
the study will only examine two to four of these technologies.”
11. Have participants begin to rank-order their selections by asking them to identify
the most innovative or important innovative technology present in the study
setting. Prompt: “Which of the technologies on the list do you think is the most
innovative or important for the study to examine?”
12. Discuss the selection with all participants until an agreement is made to place that
technology on the “final” list.
13. Repeat steps 10-12 until a rank ordered list is created, and all participants agree
with the ranking.
14. Ask participants if each of the top selections should be included. Prompt: “Do
you think this technology should be included in the study?”
15. If final list is four or less, proceed to next step. Otherwise repeat step 14.
16. Thank participants for their time. Give them contact information if they have
further comments or questions.
Note: All technologies, lists and notes were recorded in researcher’s research notebook.

132
Appendix C: Expert Panel Used for Validity and Reliability Analysis
Name
Affiliation
Qualification
Dr. John C. Dugger, PhD
Eastern Michigan University
College of Technology, Dissertation Chair
Dr. Sema Kalaian, PhD Eastern Michigan University
College of Technology, Dissertation Committee Member, Statistics and Research Methods Professor
Dr. Shereen Arraf, PhD Dearborn Public Schools
Director of Assessment, PhD in Statistics
Dr. John A. Bayerl, PhD Northern Michigan University
Professor of Guidance and Counseling
Dr. Sean Goffnett, PhD Central Michigan University
PhD from EMU College of Technology
Mr. Glenn Melynko Dearborn Public Schools
Middle School Principal, Doctoral Student, EMU College of Education
Mr. Brian Hoxie Eastern Michigan University
University Administrator, Doctoral Student, EMU College of Technology
Mr. Russell Rhoton Eastern Michigan University
Lecturer and Doctoral Student, EMU College of Technology

133
Appendix D: Sample Survey Instrument
Instructions: You may complete the following questionnaire in either pen or pencil. The researcher
has extra pencils if you need one. Please write neatly and legibly, and answer each question as completely as possible. When asked to fill in a number, please use a single number (example “8”) not a range
of numbers (example 10-12). Please complete the questionnaire individually, without consulting your colleagues. If you have any questions or do not understand a question, please raise your hand and
ask the researcher for clarification. When finished, please raise your hand and your completed questionnaire will be
collected. Section 1: Demographic Information 1) Please print your name legibly: _____________________ ___________________ (First) (Last) 2) Please check your gender: [ ] Male [ ] Female 3) Please write your current age: (years) 4) Please write the number of years you had been teaching prior to the beginning of the Fall 2007 semester (September 4, 2007). Round up to the nearest whole year. If this is your first year teaching, write “0”: (reminder: write only a single, whole number)
(years) 5) Please write the number of years you had been assigned to this building prior to the beginning of the Fall 2007 semester (September 4, 2007). Round up to the nearest whole year. If this is your first year teaching in this building, write “0”: (reminder: write only a single, whole number)
(years) 6) Please indicate your teaching assignment during the Fall 2007 semester (September 4, 2007 to January 25, 2008):
_____ Number of extended core (elective) hours _____ Number of core (academic) hours _____ Other hours. Explain:_______________________________

134
Section 2: Personal Innovative Technology Assessment
7) Three innovative technologies have been identified in your building: Promethean Boards, the Dukane VHS/DVD system, and Laptop Carts. Under each of the technologies listed in the table below, please place a single check mark ( ) next to the description that best describes your use of that technology in your daily teaching practice during the Fall 2007 Semester (September 4, 2007 to January 25, 2008). You will have a total of three (3) check marks, each in its own column when you’re done.
Promethean Boards
Dukane VHS / DVD System
Laptop Carts
“I was using this technology before anyone else was aware of it”
“I was among the first to use this technology when it became available”
“Less than half of the staff was using this technology when I started using it”
“More than half of the staff was using this technology when I started using it”
“I have not yet begun to use this technology”
Instructions for Questions #8-11: Take a moment to reflect on how you and your colleagues have helped, trained, and supported each other as you’ve learned to use these three technologies during the Fall 2007 semester (September 4, 2007 to January 25, 2008). For each question, please place a single check mark ( ) next to the description that best describes your reaction to the question. You will have a total of three (3) check marks, each in its own column when you’re done with each question.
8) During the Fall 2007 Semester (September 4, 2007 to January 25, 2008) my teacher colleagues where an important source of knowledge, skills, training and support when learning to use innovative technologies (Promethean Boards, Dukane VHS/DVD System, Laptop Carts)in my daily teaching practice.”
Promethean
Board Dukane
VHS/DVD System
Laptop Carts
Strongly Agree
Agree
Neither Agree nor Disagree
Disagree
Strongly Disagree

135
9) “The knowledge, skills, training and support I receive from my colleagues helped me incorporate innovative technologies (Promethean Boards, Dukane VHS/DVD System, Laptop Carts) into my daily teaching practice.”
Promethean
Board Dukane
VHS/DVD System
Laptop Carts
Strongly Agree
Agree
Neither Agree nor Disagree
Disagree
Strongly Disagree
10) “The assistance I gave to others teachers was an important source of the
knowledge, skills, training and support they needed when learning to use innovative technologies (Promethean Boards, Dukane VHS/DVD System, Laptop Carts) in their daily teaching practice.”
Promethean Board
Dukane VHS/DVD
System
Laptop Carts
Strongly Agree
Agree
Neither Agree nor Disagree
Disagree
Strongly Disagree
11) “The help I gave to my colleagues allowed them to successfully incorporate innovative technologies (Promethean Boards, Dukane VHS/DVD System, Laptop Carts) into their daily teaching practice.”
Promethean Board
Dukane VHS/DVD
System
Laptop Carts
Strongly Agree
Agree
Neither Agree nor Disagree
Disagree
Strongly Disagree

136
Section3: Use of Innovations These questions ask you to indicate how often you used innovative technologies (Promethean Boards, Dukane VHS/DVD System, Laptop Carts) during the Fall semester (September 4, 2007 to January 25, 2008).
12) On how many occasions did you use the Promethean Boardin your classroom during the Fall ’07 Semester (September 4, 2007 to January 25, 2008?
(write a single, whole number)
(occasions)
12a) Please indicate which of the following you used the Promethean
Board for:
[ ] As a data projection system [ ] Video streaming.
[ ] Assessment using the acu-vote system. [ ] Presenting curricular materials [ ] Small group instruction [ ] Other: Please list: _________________________________________ _________________________________________
13) On how many occasions did you use a Dukane VHS/DVD System in your classroom during the Fall ’07 Semester (September 4, 2007 to January 25, 2008?
(write a single, whole number)
(occasions)
14) On how many occasions did you sign out or use a Laptop Cart in your classroom during the Fall ’07 Semester (September 4, 2007 to January 25, 2008)?
(write a single, whole number)
(occasions)

137
14a) Please indicate which of the following you used the Laptop Cart for:
[ ] Internet research [ ] Small group instruction
[ ] iBlog [ ] iLearn [ ] Online text or supplementary materials provided by book publisher. [ ] Subscription services (Atomic Learning, Study Island) [ ] Other: Please list: _________________________________________ _________________________________________ _________________________________________
Section 4: Getting Help
15) Reflect on the teachers who helped you learn to use the Promethean Board during Fall Semester 2007 (September 4, 2007 to January 25, 2008). Please print the name of each person in the table below. Also write the number of occasions you received such help from each person. Last, for each person, please check the box that best describes how helpful their help, training and support was as you learned to use the Document Camera during Fall Semester 2007 (September 4, 2007 to January 25, 2008).
Name of Person helping you use the Promethean Board
(Please Print)
First Last
Number of occasions on which they provided help to you.
(Single, whole number)
How helpful was that support?
5 = Very Helpful 4 = Somewhat Helpful 3 = Undecided 2 = Somewhat Unhelpful 1 = Not helpful at all

138
16) Reflect on the teachers who helped you learn to use the Dukane VHS/DVD System during Fall Semester 2007 (September 4, 2007 to January 25, 2008). Please print the name of each person in the table below. Also write the number of occasions you received such help from each person. Last, for each person, please check the box that best describes how helpful their help, training and support was as you learned to use the Data Projector during Fall Semester 2007 (September 4, 2007 to January 25, 2008).
Name of Person helping you use the Dukane VHS/DVD System
(Please Print)
First Last
Number of occasions on which they provided help to you. (Single, whole number)
How helpful was that support?
5 = Very Helpful 4 = Somewhat Helpful 3 = Undecided 2 = Somewhat Unhelpful 1 = Not helpful at all
17) Reflect on the teachers who helped you learn to use the Laptop Carts during Fall
Semester 2007 (September 4, 2007 to January 25, 2008). Please print the name of each person in the table below. Also write the number of occasions you received such help from each person. Last, for each person, please check the box that best describes how helpful their help, training and support was as you learned to use Digital or Video Camera during Fall Semester 2007 (September 4, 2007 to January 25, 2008).
Name of Person helping you use the Laptop Carts
(Please Print)
First Last
Number of occasions on which they provided help to you. (Single, whole number)
How helpful was that support?
5 = Very Helpful 4 = Somewhat Helpful 3 = Undecided 2 = Somewhat Unhelpful 1 = Not helpful at all

139
Section 5: Giving Help
18) Reflect on the teachers who you helped learn to use the Promethean Board during Fall Semester 2007 (September 4, 2007 to January 25, 2008). Please print the name of each person in the table below. Also write the number of occasions you provided such help to that person.
Name of Person you Assisted using the Promethean Board during the Fall ’07 Semester:
(Please Print) First Last
Number of occasions you provided that assistance (Single, whole number)
19) Reflect on the teachers who you helped learn to use the Dukane VHS/DVD
Systgem during Fall Semester 2007 (September 4, 2007 to January 25, 2008). Please print the name of each person in the table below. Also write the number of occasions you provided such help to that person.
Name of Person you Assisted using the Dukane VHS/DVD System during the Fall ’07 Semester:
(Please Print) First Last
Number of occasions you provided that assistance (Single, whole number)

140
20) Reflect on the teachers who you helped learn to use a Laptop Carts during Fall
Semester 2007 (September 4, 2007 to January 25, 2008). Please print the name of each person in the table below. Also write the number of occasions you provided such help to that person.
Name of Person you Assisted using the Laptop Carts during the Fall ’07 Semester:
(Please Print) First Last
Number of occasions you provided that assistance (Single, whole number)
That’s it! You’re done! Raise your hand and the researcher will collect the
questionnaire. Thank you for your participation.

141
Appendix E: Protection and Use of Human Subjects in Research Certification

142
Appendix F: Eastern Michigan University Request for Human Subjects Approval CHECK ONE ___ FACULTY/STAFF X DOCTORAL ___ MASTER’S ___UG Student
PROJECT TYPE – STUDENTS
X Dissertation ___ Master’s Thesis ___ GR Project ___ Honor’s Thesis
___ UG Project
FACULTY/STAFF/DOCTORAL researchers should submit this completed form and the proposal with all required elements as email attachments to [email protected]. Also, send one hard copy of signed original approval form with proposal and all required elements to: Human Subjects Review Committee, Starkweather Hall, Eastern Michigan University, Ypsilanti, MI 48197 (734.487.0042). Date Submitted: December 11, 2007
Title of Project: The Diffusion of Innovative Technologies Among Teachers: Examining
the relationship between access to social capital and Technology Adoption in Schools.
Principal Investigator: John P. Bayerl
Department: College of Technology, Doctoral Program Phone (248) 543-6287
Email: [email protected] –or- [email protected] Fax: N/A
Co-PI/Project Director: N/A
If a student project, list faculty sponsor: Dr. John C. Dugger, PhD.
Signature of faculty sponsor: X
Student number: E0031106 Program and status/year: College of Technology, Doctoral Program Mailing address: 1561 Moorhouse Street, Ferndale, Michigan 48220 If an external grant is being sought for this project, state the funding source and submission deadline: N/A Is this application X New _____Modification of previously approved study
If Modification: a. Date of last approval by this Committee N/A

143
b. Principal Investigator of previously approved protocol N/A c. Describe any modifications to the previously approved protocol: N/A d. Were any Human Subjects problems encountered in previous research? No ___ Yes ___
If yes, how were they addressed? N/A
I. If you are requesting an exemption from HSRC review, explain the statutory basis for the requested exemption (see attached list of exempt project types):
N/A
II. Numbers, Types and Recruitment of Subjects
A. Numbers and characteristics of subjects (e.g., age ranges, sex, ethnic background, health status, disabilities, etc.):
(See Proposal pp. 45-48). The subjects of this study will be two or three groups of approximately 30-50 adult, middle school teachers drawn from a single school district (approximately 90-150 total participants). Additionally, the researcher will interview principals, assistant principals, lead teachers and technicians from each
B. Special Classes. Explain the rationale for the use of special classes or subjects such as pregnant women, children, prisoners, mentally impaired, institutionalized, or others who are likely to be particularly vulnerable.
None.
C. How are the individual participants to be recruited for this research? Is it clear to the subjects that participation is voluntary and that they may withdraw at any time without negative consequences?
(See Proposal pp 48-51). The researcher will collect data from teachers at a single, existing staff meeting. Participants will be given a description of the research as well as informed consent documentations. The voluntary nature of participation will be specifically explained to the participants, prior to participation, both verbally and in written documentation.
III. Informed Consent
A. To what extent and how are the subjects to be informed of research procedures
before their participation?

144
Voluntary participation in the research involves only filling out a survey questionnaire. All participants will be given verbal and written instructions before participating in the research (should they choose to do so). A question and answer session will be included for purposes of clarification and the addressing of concerns.
B. Attach a copy of the written "Informed Consent” form or a written statement of the oral consent. (See attached checklist for essential elements of informed consent).
Checklist attached. See also, Proposal Appendix D.
IV. Risks Involved in the Research
Describe potential risks involved in project/research participation. What procedures will be in place to minimize any risks to subjects?
(See proposal pp 49-51). Due to the nature of research into social networks, participants will be asked to provide potentially identifying information in the process of completing the questionnaire. While this information is necessary to construct variables, personal information will not be reported in the results—only the aggregate. However, it is acknowledged that this might lead to personal or professional criticism or embarrassment, both real or imagined. The researcher will take specific precautions to minimize or eliminate these risks including:
1) All participants will be provided with a copy of this research proposal, as well as two copies of an informed consent letter. A signed copy of the informed consent letter will be returned to the researcher.
2) Only participants and the researcher will be allowed in the room while surveys are being filled out. The researcher will hand collect all surveys and seal them in a large envelope upon completion.
3) Surveys will be stored in a locked file cabinet off-site until they are entered into the statistical software for analysis. After data is coded and checked for accuracy, paper surveys will be destroyed via a paper shredder.
4) After data is coded and variables constructed, actual teacher names will be replaced with pseudonyms assigned using a random number table and a “baby names” book and original documents with identifying information will be destroyed by paper shredder.
5) Actual teacher names will never be used in reporting results, analyzing findings or reporting conclusions. If it is necessary to refer to a specific teacher in order to illustrate a point, the pseudonym will be used along with no other identifying information.
6) Results for individual sub-groups will be reported in the aggregate. Small groups (3 or fewer participants) will be avoided both to preserve anonymity and confidentiality and to increase validity of results.

145
7) No identifying information will be included with any historical documents included in the analysis. If such information is included, and the resource must be included, that information will be physically redacted (deleted via word processor and replaced with an ellipse (…) or cut from the document with a razor blade prior to scanning).
8) Data files will be stored on password protected computers owned by the researcher. Data transfer between machines will be made via 128-bit encrypted USB flash memory, not via email, ftp, or other non-secure network protocol.
9) After publication of the researcher’s dissertation, all related data files and other data collected will be destroyed.
10) Participants will be free to withdraw from the study at any time, with no explanation or and no negative consequences.
11) Should any other requirement emerge from UHSRC or district review, such requirements will be amended to this proposal before conducting the research.
Does the research involve any of the following procedures? Deception of the participant? No X Yes ___ Punishment of the participant? No X Yes ___ Use of drugs/medications in any form? No X Yes ___ Electric shock? No X Yes ___ Deliberate production of anxiety or stress? No X Yes ___ Materials commonly regarded as socially unacceptable? No X Yes ___ Use of radioisotopes? No X Yes ___ Use of chemicals? No X Yes ___ Drawing of blood? No X Yes ___ Handling of any other bodily fluid? No X Yes ___ Any other procedure that might be regarded as inducing in the participant any altered state or condition potentially harmful to his/her personal welfare? No X Yes ___ Any other procedure that might be considered to be an invasion of privacy? No X Yes ___ Disclosure of the name of individual participants? No X Yes ___ Any other physically invasive procedure? No X Yes ___
If the answer to any of the above is "Yes,” please explain this procedure in detail and describe procedures for protecting against or minimizing any potential risk.
N/A
V. Confidentiality
A. To what extent is the information confidential and to what extent are provisions made so that subjects are not identified?

146
(See proposal pp. 49-51). Names of participants and their colleagues will be collected in order to map the complex interactions between participants. Some personal information (age, gender, classroom assignment, classroom language, teaching experience) will also be collected. However, these data will be coded and used in the creation of variables. In this process, the identity of individuals will be eliminated, producing aggregate data used for analysis.
B. What are the procedures for handling and storing data so that confidentiality of
the subjects is protected (particular attention should be given to the use of photographs, video and audio recordings)?
(See proposal pp. 49-51. See also: Section IV: Risks Involved in Research Above). Specific procedures are in place to both handle and store data including the use of sealed envelopes, assignment of random identification to individual responses, storage of data in locked cabinets and secure electronic storage as well as the destruction of data once research is completed. For more detail please refer to proposal for details.
C. How will the results of the research be disseminated? Will the subjects be
informed of the results? Will confidentiality of subjects or organizations be protected in the dissemination? Explain.
Primary outlet for dissemination of results will be the publication of the researcher’s doctoral dissertation—a requirement of the degree program. Results may—upon request—be shared with participants at another staff meeting. It is important to acknowledge that results are expressed in terms of the organization, and not the individual.
VI. Describe any anticipated benefits to subjects from participation in this research.
The purpose of the research is to explore the relationship between social interactions (social capital) and adoption of educational technologies in school. As such, knowledge gained from the study may be used to better understand these issues in the participants workplace, and might lead to improved usage of those technologies.
VII. Submitting Your Protocol – CHECKLIST
X If this is a Doctoral dissertation, Master’s or Honor’s thesis, please attach your
Committee Approval form. NOTE: Master’s and Honor’s thesis that are not beyond minimal risk should be submitted to College committees. Check here if not applicable _____.

147
X If available, attach a full copy of your research proposal (grant, thesis, dissertation proposal, etc.) Check here if not available _____.
X Regardless of whether or not a full research proposal is available, attach a concise
summary (2-5 pages) that includes: • A brief summary of the background literature stimulating this research • Rationale for the proposed study, including goals, research questions or hypotheses • A description of the participants and how they will be recruited • A detailed description of study methodology NOTE: You may “cut-and-paste” as needed from your full proposal, if available, and the committee may refer to the full proposal for clarification.
X Consent Agreement(s) -- (Check here if not applicable _____). See attached checklist of
required elements to include in these consent documents. NOTE: Please add the following statement to the final copy of your Informed Consent Agreement: “This research protocol and informed consent document has been reviewed and approved by the Eastern Michigan University Human Subjects Review Committee for use from _________ to _________ (date). If you have questions about the approval process, please contact Dr. Deb de Laski-Smith (734.487.0042, Interim Dean of the Graduate School and Administrative Co-chair of UHSRC, [email protected]).”
X Copies of all instruments, questionnaires, or tests to be used (if instruments are not fully
developed yet, attach drafts, and so indicate).—Sample draft of instrumentation is included in Appendix E of the proposal.
N/A If your research constitutes institutional or departmental assessment, your study should have
first been approved by the Director of EMU Institutional Assessment; if it has been, on what date _________ . Please attach confirmation of approval. Check here if not applicable _____.
N/A Flyers to be posted on campus (NOTE: These must be stamped with Committee
Approval prior to posting).
For clarification on human subjects procedures at EMU, please see this webpage: http://www.ord.emich.edu/federal/federal_comp_subdir/humansubjects/human.html Principal Investigator (Signature) Date:
Checklist of Required Elements of Informed Consent X A statement that the study involves research X Purpose of the research X Duration of subject’s participation X Description of the procedures followed

148
X Means of public dissemination X Description of foreseeable risks or discomforts to subject X Description of benefits to subject or to others N/A Disclosure of appropriate alternative procedures or courses of treatment X Statement of extent to which confidentiality of records identifying subject is maintained X Statement of how participant confidentiality is maintained in public dissemination __N/A_ For research that poses greater than minimal risk, information regarding medical treatments or counseling should personal injury or problems occur X List of contacts who can answer questions about the research and subject’s rights and
respond to research-related injury to subject. Include the paragraph above regarding how to contact the UHSRC, in addition to information about how to contact the investigator(s).
X Statement that participation is voluntary X Statement that refusal to participate will involve no penalty or loss of benefits X Statement that the subject may discontinue participation at any time X Statements of significant new findings developed during the course of research that may relate to subjects’ willingness to continue participation Rationale for Exclusion of a Required Element: N/A

149
Appendix G: UHSRC Approval of Initial Proposal

150
Appendix H: UHSRC Approval of Revised Proposal

151
Appendix I: Informed Consent Agreement
Project Title: The Diffusion of Innovative Technologies Among Teachers: Examining the Relationship between Access to Social Capital and Technology Adoption in Schools. Investigator: John P. Bayerl, College of Technology, Eastern Michigan University Co-Investigator / Advisor: Dr. John C. Dugger, PhD. Purpose of the Study: The purpose of this research study is to gain a better understanding of the relationships between social interactions of teachers and the level of technology adoption in schools. Procedure:
The researcher will explain the study to you, answer any questions you may have, and witness your signature to this consent form.
You will be asked to complete questionnaires about your use of several key pieces of technology available in your school, as well as your interactions with your colleagues as you learn(ed) how to use those technologies. You will also be asked a few demographic questions for purpose of examining the other variables among sub-groups.
Upon completing the questionnaires, you will be given a duplicate copy of this informed consent, which includes follow-up contact information, if needed. The approximate total time to complete the questionnaires should be about 10-15 minutes.
Confidentiality:
You will be asked to provide your name and the name of some of your colleagues during this survey. This is necessary to model the flow of information between teachers in your building. Once the structure of this web of interactions is known, the researcher will replace each of the names with a randomly generated alias. Only these aliases will be used in the final results. Results will be stored separately from the consent form, which includes your name. All information will be kept in locked file cabinets of the study investigator.
Expected Risks:
There are no foreseeable risks to you by completing this survey, as all results will be kept completely confidential.
Expected Benefits:
Based on the results of this survey, patterns of usage of selected technologies will be identified along with the effect of social interactions on learning to use those technologies. These findings will be used to provide meaningful professional development aimed at increasing use of educational technologies in your building.

152
Voluntary Participation: Participation in this study is voluntary. You may choose not to participate. If you do decide to participate, you can change your mind at any time and withdraw from the study without negative consequences.
Use of Research Results: Results will be presented in aggregate form only. No names or individually identifying information will be revealed. Results may be presented at research meetings and conferences, in scientific publications, and as part of a doctoral dissertation being conducted by the principal investigator.
Future Questions:
If you have any questions concerning your participation in this study now or in the future, you can contact the principal investigator, John P. Bayerl at (248) 543-6287 or via e-mail: [email protected]. This research protocol and informed consent document has been reviewed and approved by the Eastern Michigan University Human Subjects Review Committee for use from January 8, 2008 to January 9, 2009. If you have questions about the approval process, please contact Dr. Deb de Laski-Smith (734.487.0042, Interim Dean of the Graduate School and Administrative Co-Chair of UHSCR, [email protected].
Consent to Participate: I have read or had read to me all of the above information about this research study, including the research procedures, possible risks, side effects, and the likelihood of any benefit to me. The content and meaning of this information has been explained and I understand everything that has been presented. All my questions, at this time, have been answered. I hereby consent and do voluntarily offer to follow the study requirements and take part in the study. PRINT NAME: __________________________________________________________ Signatures: X_________________________________________________ ____________ Participant (your signature) Date X_________________________________________________ ____________
Investigator Date

153
Appendix J: District Permission to Conduct Research
From: Artis, John B Sent: Thu 12/13/2007 3:31 PM To: Bayerl, John P Subject: RE: Permission to conduct Doctoral Research. John, permission granted. John Artis ________________________________ From: Bayerl, John P Sent: Thursday, December 13, 2007 2:55 PM To: Artis, John B Cc: Mital, Dawn M Subject: Permission to conduct Doctoral Research. Dr. Artis: Greetings. In addition to teaching GIS at the Michael Berry Career Center, I have been pursuing my PhD in Technology from Eastern Michigan University. My research interest is in the diffusion of technology innovations by teachers (how do new technologies spread through the school). I recently had my research proposal approved by my dissertation committee and have submitted it to the University Human Subjects Research Committee at EMU for approval. I would like your permission to conduct a survey at 2-3 of our middle schools. The research would include: 1. Meeting with the principal, media specialist and other key technology team members in each building for about 30 minutes to identify some target innovations being used at each site. The purpose of this is to develop a custom instrument to measure the level of usage of those technologies. 2. Collecting data via the survey from the staff at a Monday staff meeting second semester (about 20 minutes time). My target date to begin is the middle of January. I have some flexibility in the data collection, but the nature of our calendar, and breaks second semester places some limitations on such research.

154
I have talked informally to a couple of principals who are interested in helping with the research, but am waiting for all the appropriate approvals before formally asking them. I've attached a summary of the proposal and related documents for you to review. I am always available to discuss this in greater detail if you need more clarification. Thanks,
John P. Bayerl

155
Appendix K: Data Collection Cover Letter
Teachers: Thank you for taking time out of your busy schedule to participate in this research project. I am looking at the adoption of innovative technologies in schools, and the role of teacher interactions in that adoption. This scientific research project has been reviewed and approved by the Eastern Michigan University Human Subjects Review Board, my dissertation committee, and our superintendent, Dr. John Artis. You will find two copies of an informed consent agreement attached to this letter. Before filling out the questionnaire, you will be required to sign one of these agreements and give it to the researcher. The second copy is for your records and contains contact information about the researcher should you have any questions or concerns at a later date. Every effort has been made to protect your identity, anonymity and confidentiality in the published results. These results will be in the form of aggregate data, with no person identified individually. Copies of the results will be made available to you if you would be interested in them. Simply contact the researcher and let him know you would like a copy. Participation in this study is completely voluntary, and you may withdraw from the project at any time. If you have any questions, concerns or comments, please feel free to ask me before consenting to participate. Thank you again for helping me in this endeavor. Sincerely, John Bayerl PhD Candidate College of Technology Eastern Michigan University [email protected]

156
Appendix L: Follow-Up E-Mail to Participants who missed the Data Collection Meeting
From: Bayerl, John P Sent: Tuesday … To: … Subject: Teacher Technology Survey from staff meeting yesterday. Dear Colleagues, My name is John Bayerl and I teach at the Michael Berry Career Center. I am also a PhD student at Eastern Michigan University, College of Technology. With the blessing of the University, [the superintendent] and your Principal, …, I am doing my dissertation research on teachers' use of innovative technologies at your Middle School last semester. I presented a staff survey yesterday to all the teachers at the staff meeting. In order to make my results a little better, I would like to collect responses from as many teachers as possible. I am sending you this email because you are one of the teachers who were not in attendance. I hope that you will consider participating in my study by filling in a brief questionnaire. I am sending them to you through interschool mail. In each package you will find: 1. A white cover letter that is yours to keep. 2. A green informed consent letter that you must sign and return to me should you choose to participate. 3. A yellow survey that needs to be filled out and returned to me should choose to participate. They went out in inter-school mail today. If you would like to participate, simply fill out the yellow and green sheets and send them back to me through inter-school mail. If you are concerned about the confidentiality of your answers, I can arrange to stop by after school and pick them up personally. I would like them returned by Friday March 28th (or earlier if possible, but I know you're busy at the end of the marking period). Thank you for your consideration. Sincerely, John Bayerl
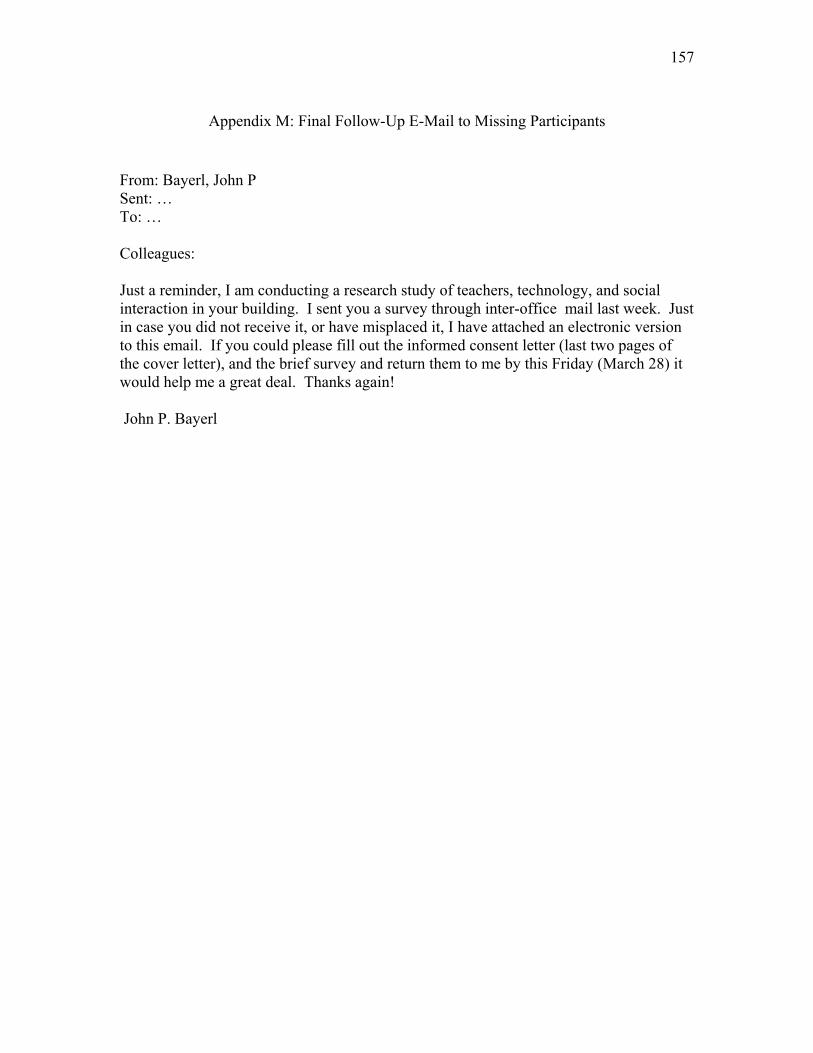
157
Appendix M: Final Follow-Up E-Mail to Missing Participants
From: Bayerl, John P Sent: … To: … Colleagues: Just a reminder, I am conducting a research study of teachers, technology, and social interaction in your building. I sent you a survey through inter-office mail last week. Just in case you did not receive it, or have misplaced it, I have attached an electronic version to this email. If you could please fill out the informed consent letter (last two pages of the cover letter), and the brief survey and return them to me by this Friday (March 28) it would help me a great deal. Thanks again! John P. Bayerl

158
Appendix N: Statistical Charts
This appendix contains the SPSS graph output for various analyses conducted during the study including distribution of adoption data histograms (Figure N-1), distribution of access to social capital data (Figure N-2), scatter plots comparing access to social capital and level of adoption data (Figure N-3) and distribution of potentially confounding variable histograms (Figure N-4).
5004003002001000
Reported No. of Occasions Document Camera Used
25
20
15
10
5
0
Num
ber o
f Tea
cher
s R
espo
ndin
g
Mean = 77.69Std. Dev. = 134.142N = 39
Site 1, Innovative Technology 1
5004003002001000
Reported No. of Occasions Computer Labs Used
25
20
15
10
5
0
Num
ber o
f Tea
cher
s R
espo
ndin
g
Mean = 69.82Std. Dev. = 112.754N = 38
Site 1, InnovativeTechnology 2
100806040200
Reported No. of Occasions Digital or Video Camera Used
40
30
20
10
0
Num
ber o
f Tea
cher
s R
espo
ndin
g
Mean = 9.92Std. Dev. = 23.381N = 39
Site 1, Innovative Technology 3
100806040200
Reported No. of Occasions LCD Projector Used
14
12
10
8
6
4
2
0
Num
ber o
f Tea
cher
s R
espo
ndin
g
Mean = 19.29Std. Dev. = 19.959N = 38
Site 1, Innovative Technology 4

159
1200.001000.00800.00600.00400.00200.000.00
Reported Total No. of Occasions InnovativeTechnologies Used
20
15
10
5
0
Num
ber o
f Tea
cher
s R
espo
ndin
g
Mean = 154.9487Std. Dev. = 238.06666N = 39
Site 1, Total Level of Innovative Technology Adoption
100806040200
Reported No. of Occasions Promethean Board Used
30
25
20
15
10
5
0
Num
ber o
f Tea
cher
s R
espo
ndin
g
Mean = 9.94Std. Dev. = 27.024N = 33
Site 2, Innovative Technology 1
100806040200
Reported No. of Occasions Mobile Computer Labs Used
25
20
15
10
5
0
Num
ber o
f Tea
cher
s R
espo
ndin
g
Mean = 10.24Std. Dev. = 18.156N = 33
Site 2, Innovative Technology 2
403020100
Reported No. of Occasions Dukane DVD/VHS SystemUsed
25
20
15
10
5
0
Num
ber o
f Tea
cher
s R
espo
ndin
g
Mean = 4.7Std. Dev. = 9.485N = 33
Site 2, Innovative Technology 3
150.00120.0090.0060.0030.000.00
Reported Total No. of Occasions InnovativeTechnologies Used
25
20
15
10
5
0
Num
ber o
f Tea
cher
s R
espo
ndin
g
Mean = 24.8788Std. Dev. = 36.955N = 33
Site 2, Total Level of of Innovative Technology Adoption

160
20151050
Reported No. of Occasions Mobile Computer Labs Used
12
10
8
6
4
2
0
Num
ber o
f Tea
cher
s R
espo
ndin
g
Mean = 3.29Std. Dev. = 4.518N = 21
Site 3, Innovative Technology 2
403020100
Reported No. of Occasions Dukane DVD/VHS SystemUsed
20
15
10
5
0
Num
ber o
f Tea
cher
s R
espo
ndin
g
Mean = 1.95Std. Dev. = 8.721N = 21
Site 3, Innovative Technology 3
100.0080.0060.0040.0020.000.00
Reported Total No. of Occasions InnovativeTechnologies Used
20
15
10
5
0
Num
ber o
f Tea
cher
s R
espo
ndin
g
Mean = 10.381Std. Dev. = 20.65787N = 21
Site 3, Total Level of Innovative Technology Adoption
100806040200
Reported No. of Occasions Promethean Board Used
50
40
30
20
10
0
Num
ber o
f Tea
cher
s R
espo
ndin
g
Mean = 7.66Std. Dev. = 22.211N = 53
Site 2 + Site 3 Merged, Innovative Technology 1
100806040200
Reported No. of Occasions Mobile Computer Labs Used
50
40
30
20
10
0
Num
ber o
f Tea
cher
s R
espo
ndin
g
Mean = 7.3Std. Dev. = 14.819N = 53
Site 2 + Site 3 Merged, Innovative Technology 2
403020100
Reported No. of Occasions Promethean Board Used
20
15
10
5
0
Num
ber o
f Tea
cher
s R
espo
ndin
g
Mean = 5.14Std. Dev. = 11.132N = 21
Site 3, Innovative Technology 1

161
403020100
Reported No. of Occasions Dukane DVD/VHS SystemUsed
50
40
30
20
10
0
Num
ber o
f Tea
cher
s R
espo
ndin
g
Mean = 2.94Std. Dev. = 7.782N = 53
Site 2 + Site 3 Merged, Innovative Technology 3
150.00120.0090.0060.0030.000.00
Reported Total No. of Occasions InnovativeTechnologies Used
40
30
20
10
0
Num
ber o
f Tea
cher
s R
espo
ndin
g
Mean = 17.9057Std. Dev. = 30.95671N = 53
Site 2 + Site 3 Merged, Total Level of Adoption of Innovative Technologies
Figure N-1. Distribution of level of adoption histograms
120001000080006000400020000
Access to Social Capital Score: Document Camera(ELMO)
40
30
20
10
0
Num
ber o
f Tea
cher
s R
espo
ndin
g
Mean = 543.26Std. Dev. = 1872.399N = 39
Site 1, Innovative Technology 1
70006000500040003000200010000
Access to Social Capital Score: Computer Labs
40
30
20
10
0
Num
ber o
f Tea
cher
s R
espo
ndin
g
Mean = 282.46Std. Dev. = 1021.452N = 39
Site 1, Innovative Technology 2
70006000500040003000200010000
Access to Social Capital Score: Digital & Video Cameras
30
20
10
0
Num
ber o
f Tea
cher
s R
espo
ndin
g
Mean = 758.69Std. Dev. = 1715.322N = 39
Site 1, Innovative Technology 3
20000.0015000.0010000.005000.000.00
Total Access to Social Capital Score: All InnovativeTechnologies
30
25
20
15
10
5
0
Num
ber o
f Tea
cher
s R
espo
ndin
g
Mean = 1584.4103Std. Dev. = 3152.80457N = 39
Site 1, Total Access to Social Capital

162
1000080006000400020000
Access to Social Capital Scores: Promethean Boards
30
25
20
15
10
5
0
Num
ber o
f Tea
cher
s R
espo
ndin
g
Mean = 608.91Std. Dev. = 1712.258N = 33
Site 2, Innovative Technology 1
120001000080006000400020000
Access to Social Capital Scores: Mobile Computer Labs
20
15
10
5
0
Num
ber o
f Tea
cher
s R
espo
ndin
g
Mean = 1705.85Std. Dev. = 2883.033N = 33
Site 2, Innovative Technology 2
40003000200010000
Access to Social Capital Scores: Dukane DVD/VHSSystem
25
20
15
10
5
0
Num
ber o
f Tea
cher
s R
espo
ndin
g
Mean = 339.91Std. Dev. = 713.487N = 33
Site 2, Innovative Technology 3
25000.0020000.0015000.0010000.005000.000.00
Total Access to Social Capital Scores: All InnovativeTechnologies
25
20
15
10
5
0
Num
ber o
f Tea
cher
s R
espo
ndin
g
Mean = 2654.6667Std. Dev. = 4443.54957N = 33
Site 2, Total Access to Social Capital
500040003000200010000
Access to Social Capital: Promethean Boards
12
10
8
6
4
2
0
Num
ber o
f Tea
cher
s R
espo
ndin
g
Mean = 1418.33Std. Dev. = 1684.55N = 21
Site 3, Innovative Technology 1
6000500040003000200010000
Access to Social Capital Scores: Mobile Computer Labs
14
12
10
8
6
4
2
0
Num
ber o
f Tea
cher
s R
espo
ndin
g
Mean = 829.14Std. Dev. = 1247.833N = 21
Site 3, Innovative Technology 2

163
1400120010008006004002000
Social Capital Scores: Dukane DVD/VHS System
20
15
10
5
0
Num
ber o
f Tea
cher
s R
espo
ndin
g
Mean = 165.05Std. Dev. = 408.385N = 21
Site 3, Innovative Technology 3
8000.006000.004000.002000.000.00
Total Access to Social Capital Scores: All InnovativeTechnologies
10
8
6
4
2
0
Num
ber o
f Tea
cher
s R
espo
ndin
g
Mean = 2412.5238Std. Dev. = 2488.73523N = 21
Site 3, Total Access toSocial Capital
1000080006000400020000
Access to Social Capital Scores: Promethean Boards
40
30
20
10
0
Num
ber o
f Tea
cher
s R
espo
ndin
g
Mean = 941.08Std. Dev. = 1743.753N = 53
Site 2 + Site 3 Merged, Innovative Technology 1
120001000080006000400020000
Access to Social Capital Scores: Mobile Computer Labs
40
30
20
10
0
Num
ber o
f Tea
cher
s R
espo
ndin
g
Mean = 1379.15Std. Dev. = 2427.428N = 53
Site 2 + Site 3 Merged, Innovative Technology 2
40003000200010000
Access to Social Capital Scores: Dukane DVD/VHSSystem
50
40
30
20
10
0
Num
ber o
f Tea
cher
s R
espo
ndin
g
Mean = 273.53Std. Dev. = 620.336N = 53
Site 2 + Site 3 Merged, Innovative Technology 3
25000.0020000.0015000.0010000.005000.000.00
Total Access to Social Capital Scores: All InnovativeTechnologies
40
30
20
10
0
Num
ber o
f Tea
cher
s R
espo
ndin
g
Mean = 2593.7547Std. Dev. = 3806.13814N = 53
Site 2 + Site 3 Merged, Total Access to Social Capital
Figure N-2. Distribution of access to social capital histograms

164
Site 1
120001000080006000400020000
Access to Social Capital
500
400
300
200
100
0
Leve
l of A
dopt
ion:
Doc
umen
t Cam
era
(ELM
O)
70006000500040003000200010000
Access to Social Capital
500
400
300
200
100
0
Leve
l of A
dopt
ion:
Com
pute
r Lab
s
70006000500040003000200010000
Access to Social Capital
100
80
60
40
20
0
Leve
l of A
dopt
ion:
Dig
ital &
Vid
eo C
amer
as
20000.0015000.0010000.005000.000.00
Total Access to Social Capital
1200.00
1000.00
800.00
600.00
400.00
200.00
0.00
Tota
l Lev
el o
f Ado
ptio
n: A
ll In
nova
tive
Tech
nolo
gies

165
Site 2
1000080006000400020000
Access to Social Capital
100
80
60
40
20
0
Leve
l of A
dopt
ion:
Pro
met
hean
Boa
rds
120001000080006000400020000
Access to Social Capital
100
80
60
40
20
0
Leve
l of A
dopt
ion:
Mob
ile C
ompu
ter L
abs
40003000200010000
Access to Social Capital
40
30
20
10
0
Leve
l of A
dopt
ion:
Duk
ane
DVD
/VH
S Sy
stem
25000.0020000.0015000.0010000.005000.000.00
Total Access to Social Capital
150.00
120.00
90.00
60.00
30.00
0.00
Tota
l Lev
el o
f Ado
ptio
n: A
ll In
nova
tive
Tech
nolo
gies

166
Site 3
500040003000200010000
Access to Social Capital
40
30
20
10
0
Leve
l of A
dopt
ion:
Pro
met
hean
Boa
rds
6000500040003000200010000
Access to Social Capital
20
15
10
5
0
Leve
l of A
dopt
ion:
Mob
ile C
ompu
ter L
abs
1400120010008006004002000
Access to Social Capital
40
30
20
10
0
Leve
l of A
dopt
ion:
Duk
ane
DVD
/VH
S Sy
stem
8000.006000.004000.002000.000.00
Total Access to Social Capital
100.00
80.00
60.00
40.00
20.00
0.00
Tota
l Lev
el o
f Ado
ptio
n: A
ll In
nova
tive
Tech
nolo
gies

167
Site 2 + Site 3 Merged
1000080006000400020000
Access to Social Capital
100
80
60
40
20
0
Leve
l of A
dopt
ion:
Pro
met
hean
Boa
rds
120001000080006000400020000
Access to Social Capital
100
80
60
40
20
0
Leve
l of A
dopt
ion:
Mob
ile C
ompu
ter L
abs
40003000200010000
Access to Social Capital
40
30
20
10
0
Leve
l of A
dopt
ion:
Duk
ane
DVD
/VH
S Sy
stem
25000.0020000.0015000.0010000.005000.000.00
Total Access to Social Capital
150.00
120.00
90.00
60.00
30.00
0.00
Tota
l Lev
el o
f Ado
ptio
n: A
ll In
nova
tive
Tech
nolo
gies
Figure N-3. Level of adoption and access to social capital scatter plots.

168
6050403020
Age
15
12
9
6
3
0
Freq
uenc
y
Mean = 35.64Std. Dev. = 7.687N = 36
Site 1
2520151050
Years of Teaching Experience
12
10
8
6
4
2
0
Freq
uenc
y
Mean = 8.05Std. Dev. = 5.326N = 39
Site 1
121086420-2
Years Teaching at Study Site
10
8
6
4
2
0
Freq
uenc
y
Mean = 3.1Std. Dev. = 3.243N = 39
Site 1
706050403020
Age
5
4
3
2
1
0
Freq
uenc
y
Mean = 42.18Std. Dev. = 9.942N = 33
Site 2
403020100
Years of Teaching Experience
10
8
6
4
2
0
Freq
uenc
y
Mean = 12.82Std. Dev. = 9.639N = 33
Site 2
543210-1
Years Teaching at Study Site
15
12
9
6
3
0
Freq
uenc
y
Mean = 2.27Std. Dev. = 1.257N = 33
Site 2

169
6050403020
Age
7
6
5
4
3
2
1
0
Freq
uenc
y
Mean = 36.86Std. Dev. = 8.901N = 21
Site 3
302520151050
Years of Teaching Experience
10
8
6
4
2
0
Freq
uenc
y
Mean = 9.57Std. Dev. = 6.961N = 21
Site 3
543210-1
Years Teaching at Study Site
12
10
8
6
4
2
0
Freq
uenc
y
Mean = 2.38Std. Dev. = 1.284N = 21
Site 3
6050403020
Age
10
8
6
4
2
0
Freq
uenc
y
Mean = 39.91Std. Dev. = 9.797N = 53
Site 2 + Site 3 (Merged)
403020100
Years of Teaching Experience
12
10
8
6
4
2
0
Freq
uenc
y
Mean = 11.47Std. Dev. = 8.833N = 53
Site 2 + Site 3 (Merged)
543210-1
Years Teaching at Study Site
25
20
15
10
5
0
Freq
uenc
y
Mean = 2.3Std. Dev. = 1.265N = 53
Site 2 + Site 3 (Merged)
Figure N-4. Distribution of potentially confounding variables histograms