The DFC Model: a Regulatory Tool Used in Riparian Forest Management in Washington Steve McConnell...
48
The DFC Model: a Regulatory Tool Used in Riparian Forest Management in Washington • Steve McConnell • Upper Columbia United Tribes • Spokane, WA • Growth Model Users Group Meeting • January 11, 2007
-
Upload
giles-shields -
Category
Documents
-
view
215 -
download
0
Transcript of The DFC Model: a Regulatory Tool Used in Riparian Forest Management in Washington Steve McConnell...

The DFC Model: a Regulatory Tool Used in Riparian Forest
Management in Washington
• Steve McConnell• Upper Columbia United Tribes
• Spokane, WA
• Growth Model Users Group Meeting• January 11, 2007

Acknowledgements
• NWIFC, CMER, UCUT
• John Heimburg
• Dave Schuett-Hames, Ash Roorbach
• Chris Mendoza, Pete Heide
• Doug Martin, Nancy Sturhan
• Darin Cramer, Dawn Hitchens and Bonnie Thompson

Presentation Outline
• DFC Model Attributes and Role in Management
• Desired Future Condition (DFC) management concept
• Key attributes of DFC Rules• DFC Model role in management• Model origins and characteristics• Overview of CMER DFC related studies

DFC Model
• Only growth and yield model used as a regulatory tool
• Derived from ORGANON, SMC version
• A whole stand model

DFC Model
• Utilizes landowner collected data
• Simple enough for lay-persons to use
• Limited number of outputs – only those that pertain directly to what landowners need to know to implement rules

DFC Model Role
• Project stand basal area growth from current age to stand age 140
• Determines if stands will meet DFC Target• Provides prescriptive details based on site and
stand characteristics• Takes a very complicated set of rules and
makes them comprehensible!

Characteristics of DFC Rules for Riparian Forests
• Fish-bearing streams on private forest lands in western Washington
• Core, Inner and Outer Zones
• Zone widths vary by site class (I-V) and stream size (LE or GT 10’)
• The DFC target is a stand-age-140 basal area target, for each site class

DFC: Desired Future Condition
• Characteristics and functions of mature, unmanaged riparian forests – Habitat conditions
desirable for salmon recovery

DFC: Desired Future Condition
• Goal-oriented management system• “…The stand conditions of a mature
riparian forest, agreed to be 140 years of age …a reference point on a pathway and not an endpoint for stands.”
• Gauged against a stand basal area target

Management Along Westside, Type F Streams Varies By:
• Site productivity: site class I-V
• Stream-size: LE 10’ vs. GT 10’
• Harvest method:– no-cut– thin from below– leave trees closest to the stream

RMZ’s: a Graphical Depiction
• Zones – core, inner and outer

RMZs: Location, Activities Allowed and Size
• Core Zone: closest to stream, no cutting, always 50’ wide
• Inner Zone: some cutting, variable width (10 to 100 feet)
• Outer Zone: furthest from stream, more cutting, variable width (22 to 67 feet)

RMZ Widths, by Stream Size
Inner and Outer Zone Widths for Current "DFC" Rules
020406080
100120
iz small iz large oz small oz large
Zone and stream size combination
Wid
th (
ft)
I
II
III
IV
V

Forest Practices Rules Stand Age-140 Basal Area Targets
Basal Area Target
285 275 258224
190
0
100
200
300
I II III IV V
Site Class
Bas
al A
rea
(sq
ft/a
cre)
Stand Basal Area for DFC Rules is Calculated fromthe Area-Adjusted Core+Inner zones

DFC: Desired Future Condition
• Management today that puts stands on a trajectory towards “DFC”
• Stand growth and Rx details derived from the DFC Model


DFC Model Problems
• Three errors in DFC Model calculations were identified, none of them making significant differences to the desktop analysis but possibly affecting implementation

DFC Model Problems
• 1) Stand age 140 BAPA is inflated for stands younger than 35 years,
• 2) An incorrect value is used in for small stream site class 1, 2, and 3 per acre calculations
• 3) For Option 1, the DFC Model gives different inner zone leave tree numbers on the graphical interface than are counted in the inner zone stand table

Desktop Analysis Results
Inner Zone Area vs. the Number of Trees per Acre Represented by a Single Tree in DFC Model
Calculations for the Thin-from-Below Prescription
0
2
4
6
8
10
Individual Stands
Tree
s pe
r Acr
e;
Inne
r Zon
e A
rea
(Acr
es)
Number ofTrees per AcreRepresented by One Tree
Area of Inner ZoneStands (Acres)
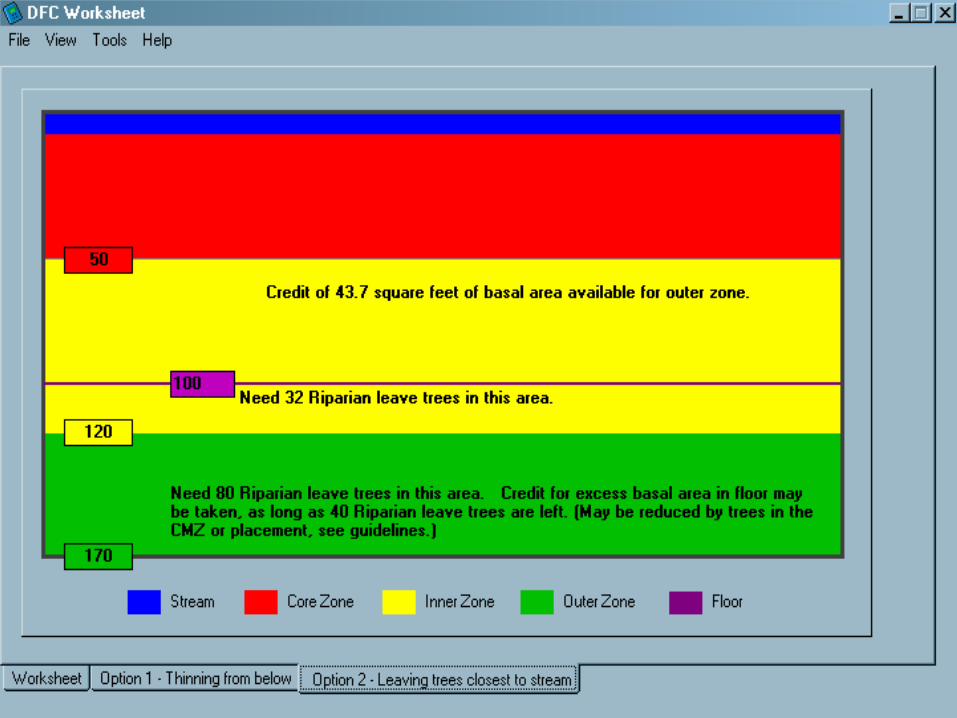
Sensitivity Analysis (Roorbach)
• Scrunches variability for most input variables, minimizing the difference in stand age 140 Basal Area
• Major Species, DF or WH, makes an important difference in DFC Model outputs– the largest DFC Model related difference found
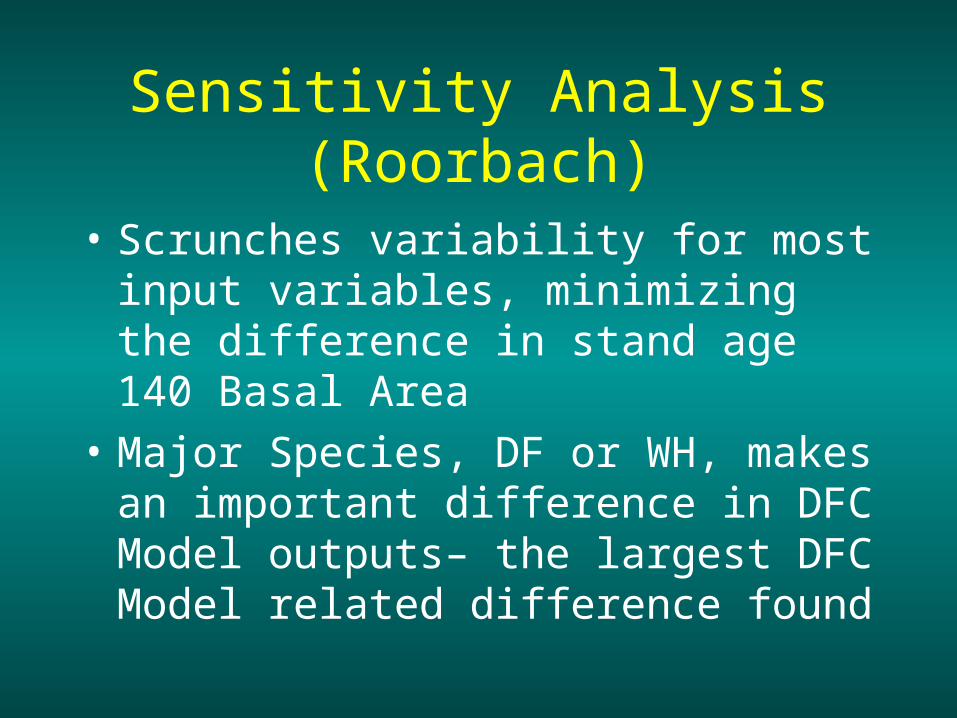
DFC Model Related Reports
• Desktop analysis
• Riparian stand characteristics
• Sensitivity analysis (Roorbach et al.)
• FPA field check review
• Model and manual problems
• Synthesis

Desktop Analysis: Exploratory Origins
Initial analyses were:– unstructured; outcomes were evaluated without
specific objectives.– from a small sample of FPAs from the
Olympic Peninsula,– from FPAs that were approved just after new
rules were developed

Desktop Analysis: Exploratory Results
• Noticed that projected ba-140 almost always exceeded rule ba target
• Determined that the required 57 ltpa was a constraint to inner zone timber harvest
• Later, determined that the option 2 minimum floor width also constrained timber harvest more than the rule ba target.

Desktop Analysis: Follow-up Exploratory Study
• Developed a Study Design (was not reviewed by the SRC)
• Developed specific objectives

Desktop Analysis Follow-up: Study Design
• Selected 150 FPAs from 2003 and 2004, 75 from each year
• Used first DFC worksheet from each FPA
• Developed criteria for rejecting FPAs that lacked data or did not meet criteria

Desktop Analysis Follow-up: Objectives
• Quantify DFC model-projected BA-140 for each of three riparian prescriptions: 1) no-cut, 2) thin-from-below, and 3) leave trees closest to the stream
• Determine the effect of rule components (required leave trees – option 1, and required floor widths, option 2) on DFC Model BA-140 projections

Desktop Analysis Results
Core+Inner Zone BA-140 by Rx's, across all Site Classes
0
100
200
300
400
500
Riparian Prescription
Bas
al A
rea
(ft2
/are
a)
no-cut
Opt-1
Opt-2
366.3 335.9 299.2
150 150 108

Desktop Analysis Results
Stand Age 140 Basal Area per Acre, by Site Class and Riparian Prescription
0
100
200
300
400
500
1 2 3 4 5
Site Class
Bas
al A
rea
per
Acr
e
(ft2 /a
cre) no-cut
Opt-1
opt2

Desktop Analysis Results
DFC Model After Thin Leave Trees per Acre, by Rule Constaint, for the 140 Stands Requiring 60 or fewer
Residual Trees per Acre
56
57
58
59
60
61
Individual Stands
Tree
s pe
r Acr
e
One Stand Constrained by basal area
One Stand Constrained by Basal AreaAND Trees per Acre
All other, 138 out of 140 Stands, Constrained by Trees per Acre

Desktop Analysis Results
DFC Model After Thin Leave Trees per Acre, by Rule Constraint, for the Ten Stands Requiring More Than 60
Residual Trees per Acre
60.8 61.5 62.2 63.7 64.9
70.9 71.5 72.8 73.1
97.0
60
70
80
90
100
Individual Stands
Tree
s pe
r A
cre
Stands Constrained by Basal Area
=>Stands Constrained
by TPA<=

Desktop Analysis Results
Timber Harvest Constraints for the Thin From Below Prescription: Trees Per Acre and Basal Area per Acre
-100
0
100
200
300
400
500
Riparian Stands, Sorted by Ascending Stand Age 140 Basal Area, Minus One Tree
Bas
al A
rea
(ft2
/acr
e)
and
Tre
es p
er A
cre
7 stands constained by basal area only
1 stand constrained by basal areaAND trees per acre
142 stands constrained by trees per acre only
basal area
Trees per Acre

Desktop Analysis ResultsSite
ClassSteam Size
Floor Width
Average floor width plus and
minus one standard deviation
Number of Stands
Constrained by Floor Width
Number of Stands
Constrained by Basal Area
Target
Total
1 Small 80’ 103.0 12.6 0 5 5
1 Large 100’ 102.0 4.0 3 1 4
2 Small 80’ 87.4 7.1 7 25 32
2 Large 100’ 102.6 5.7 20 7 27
3 Small 80’ 80.4 1.8 38 2 40

Desktop Analysis Results
Floor Width and Basal Area Credit for Site Class 2, Large Stream Stands
0
100
200
300
400
Individual Stands
Flo
or
wid
th (
ft);
Bas
al
Are
a C
red
it (
sqft
/acr
e)
credit
f loor
120'
100'
0
360.5

Desktop Analysis: Conclusions
• DFC model projected core+inner zone BA-140 exceed rule targets, because
• The 57 iz ltpa (opt-1) almost always (95.3% of worksheets reviewed) required leaving more trees than the rule target alone
• The minimum floor widths (opt-2) usually (63% of worksheets reviewed) required leaving more trees than the rule target alone

Riparian Stand Characteristics
• Applicable only to subset of riparian stands that meet DFC requirements and selected by landowner for harvest
• Provide an overview of characteristics of stands submitted by landowners for management under current rules
• A few highlights only

Site and Stand Analyses:Site Class
Number of Riparian Stands by Site Classand DNR Region
0 0
9
01 4
45
92
39
25
81 3 2 10 0 0 1
0
10
20
30
40
50
NW OLY PC SPS
DNR Region
Nu
mb
er
of
Rip
ari
an
Sta
nd
s
1
2
3
4
5

Site and Stand Analyses:Major Species
Number of Riparian Stands by Major Species and DNR Region
18
55
103
38
26
9
0
10
20
30
40
50
60
NW OLY PC SPS
DNR Region
Nu
mb
er
of
Rip
ari
an
Sta
nd
s
DF
WH

Site and Stand Analyses:HA BA by Major Species
Core vs. Inner Zone Harvest Age Basal Area by Major Species
050
100150200250300350400
Core Inner
Riparian Management Zone
Ba
sa
l Are
a
(sq
ft/a
cre
)
DF
WH
For DF, n = 74
For WH, n = 76

Site and Stand Analyses:Conclusions (Cont.)
• Most stands (88.7) were on Site Class 2 and Site Class 3
• There was an almost even split in # of FPAs evaluated,by Species (74 DF and 76 WH)
• In core zones, on average, basal area and trees per acre were higher, and percent conifer lower

Site and Stand Analyses:Conclusions (Cont.)
• Stands with WH as major species had higher tpa, ba, and RD, but lower qmd than stands with Douglas-fir as major species

DFC Field Check Study
• Most stand inventory and site attribute data collected were similar between landowner and CMER Staff– Stream size– Major species– Stand age– Stand inventory

DFC Field Check Study
• Biggest differences to buffer strip configuration are a result of stream size call, CMZ delineation and landowner decision on outer zone trees

DFC Field Check Study
• There were methodological findings, for example:
• 1) there is no method prescribed for determining RMZ length and this can lead to a lot of variability,
• 2) the Board Manual and other materials provided to landowners are confusing, difficult to follow and have errors within

Synthesis
• The basal area target is a less important constraint to inner zone timber harvest than is the leave tree requirement or minimum floor width
• Landowners use Option 2 (leave trees closest to the stream) preferentially

Synthesis
• There may be differences in harvest age Douglas-fir and western hemlock stands in terms of basal area, tpa, relative density, qmd and conifer percent. Possibly there should be different management prescriptions for these.