
The development of measures of process harmonizationpurl.tue.nl/43315068687251.pdf · The...
46
The development of measures of process harmonization Heidi L. Romero, Remco M. Dijkman, Paul W.P.J. Grefen, Arjan van Weele Beta Working Paper series 415 BETA publicatie WP 415 (working paper) ISBN ISSN NUR 982 Eindhoven April 2013
Transcript of The development of measures of process harmonizationpurl.tue.nl/43315068687251.pdf · The...

The development of measures of process harmonization
Heidi L. Romero, Remco M. Dijkman, Paul W.P.J. Grefen, Arjan van Weele
Beta Working Paper series 415
BETA publicatie WP 415 (working paper)
ISBN ISSN NUR
982
Eindhoven April 2013

1
The development of measures of process harmonization
Heidi L. Romero, Remco M. Dijkman, Paul W.P.J. Grefen , Arjan van Weele
Eindhoven University of Technology, PO Box 513, 5600 MB Eindhoven, The Netherlands
Abstract
Recent years have witnessed a marked increase in interest by researchers and practitioners in the
concept of process harmonization. However, they fail to present performance measures to evaluate the
extent of process harmonization achieved after implementing harmonization initiatives. At a process
level, measures provide information to control and manage processes in order to improve them.
Given the importance of process harmonization in process improvement as has been attributed in the
literature, there is a need of measures to evaluate to what extent processes are harmonized (i.e. to what
extent differences and inconsistencies are eliminated). The aim of this study is to develop and validate
a set of operational measures to evaluate the level of harmonization of business processes in an
organization.
The research approach was composed of two phases: First, an exploratory phase to derive a
measurement model composed by a set of measures of process harmonization; and second, a
confirmatory phase to empirically assess the measurement model derived. As a result, a valid and
reliable hierarchical measurement model was developed composed by a second order formative
construct “process harmonization” and three first order reflective constructs: representing data,
resources and IT-related measures.
Keywords: harmonization, business process, hierarchical measurement model, partial least squares

2
1. Introduction
Interest in process harmonization by researchers and practitioners has increased in the last years
(Ricken and Steinhorst, 2005; Fernandez and Bhat, 2009). Process harmonization is the process of
designing and implementing business process standards across different regions or units, so
as to facilitate achieving the targeted business benefits arising out of standardization, whilst
ensuring a harmonious acceptance of the new processes by the different stakeholders
(Fernandez and Bhat 2010, p.368). This interest has been expressed in theoretical efforts: (1) by
researchers explaining the concept, and (2) by practitioners describing methodologies to harmonize
business processes. However, they fail to identify performance measures to evaluate the extent of the
of process harmonization achieved after implementing harmonization initiatives, and its further link
with the improvements achieved as results of harmonization efforts.
Performance measurement is of critical importance for organizational management (Dess and
Robinson, 2006). At a process level, measurements provide information to control and manage
processes in order to improve them. “Unmeasured and unchallenged performance does not improve”
Ebert (2005). Given the importance of process harmonization in process improvement as has been
attributed in the literature (Foster and Herndon 1997, Hammer 1990, Stein 1999), there is a need for
measures to evaluate to what extent processes are harmonized (i.e. to what extent differences and
inconsistencies are eliminated).
Therefore, the aim of this study is to develop and validate a set of operational measures to evaluate the
level of harmonization of business processes in an organization. This set of operational measures can
be useful for two main reasons: First, researchers can use them to develop normative theory based
upon empirical investigation on process harmonization; and second, practitioners can have a
mechanism for relating process performance in terms of the level of harmonization, to specific actions
at an organization. For instance, if a company that produces electronic devices offers support after
sale for the products. Imagine that the general management decides to change from having one
centralized personnel in customer service, to outsource this process to call centers distributed in
different locations around the world. If the after sales support is critical for this type of products and
the company has experience a significant drop in sales, it is possible to evaluate the level of
harmonization of this process within the different locations and link these measures with specific
actions to be taken. Measures provide direction of which aspects of the process harmonization can be
improved.
The main research question to be addressed by this study is: What measures can be used to evaluate
the level of harmonization of business processes in an organization? An integral approach for
construct measures and validation procedures has been followed to achieve the goal of this study. It is
based on the approaches proposed by Churchill’s (1979) and MacKenzie et al. (2011). It is divided in
two phases: an exploratory phase and a confirmatory phase. This approach uses different methods for
data collection, including literature review, interviews with experts, workshops and an online survey,
to gather different views of the concept.
The remainder of this document is organized as follows: First, the paper presents an overview of the
methodology followed to conduct this study, including a detailed description of each step. This is
followed by an explanation of the exploratory phase and the confirmatory phase. For both phases, the
description of each step is divided in three parts: the unit of analysis, procedure, and results.
Conclusions, limitations and future directions are then discussed in the last section.
3
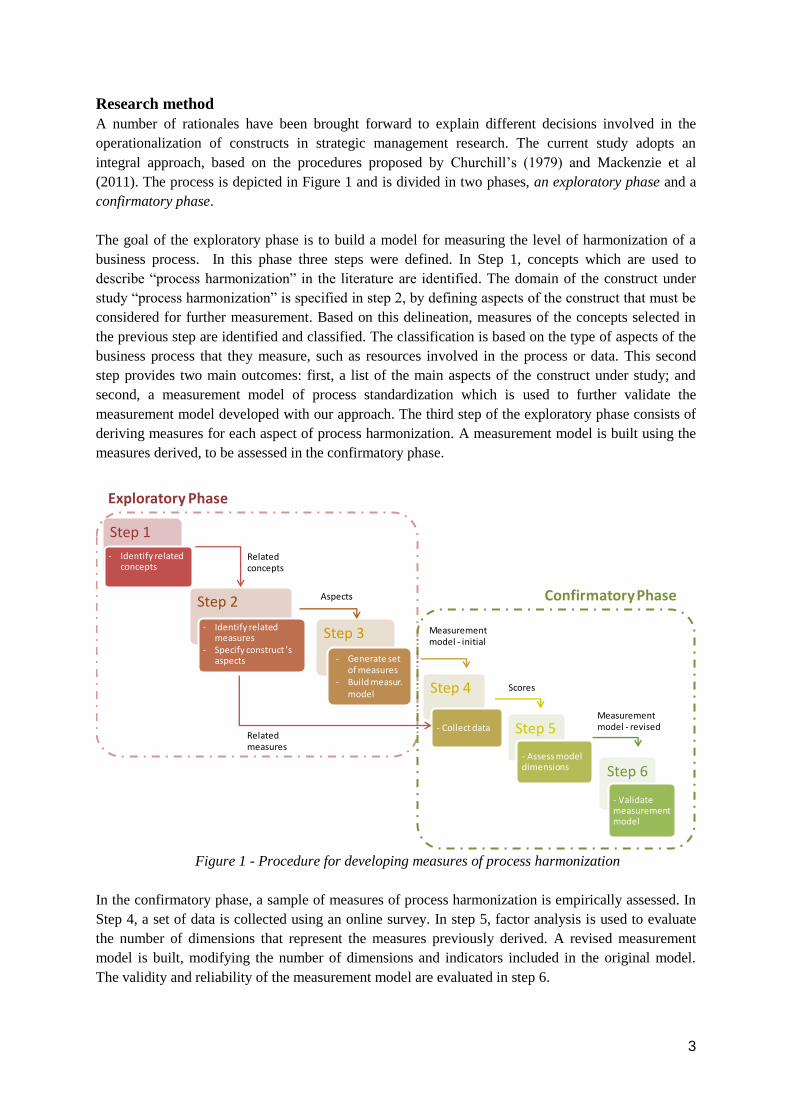
Research method
A number of rationales have been brought forward to explain different decisions involved in the
operationalization of constructs in strategic management research. The current study adopts an
integral approach, based on the procedures proposed by Churchill’s (1979) and Mackenzie et al
(2011). The process is depicted in Figure 1 and is divided in two phases, an exploratory phase and a
confirmatory phase.
The goal of the exploratory phase is to build a model for measuring the level of harmonization of a
business process. In this phase three steps were defined. In Step 1, concepts which are used to
describe “process harmonization” in the literature are identified. The domain of the construct under
study “process harmonization” is specified in step 2, by defining aspects of the construct that must be
considered for further measurement. Based on this delineation, measures of the concepts selected in
the previous step are identified and classified. The classification is based on the type of aspects of the
business process that they measure, such as resources involved in the process or data. This second
step provides two main outcomes: first, a list of the main aspects of the construct under study; and
second, a measurement model of process standardization which is used to further validate the
measurement model developed with our approach. The third step of the exploratory phase consists of
deriving measures for each aspect of process harmonization. A measurement model is built using the
measures derived, to be assessed in the confirmatory phase.
Figure 1 - Procedure for developing measures of process harmonization
In the confirmatory phase, a sample of measures of process harmonization is empirically assessed. In
Step 4, a set of data is collected using an online survey. In step 5, factor analysis is used to evaluate
the number of dimensions that represent the measures previously derived. A revised measurement
model is built, modifying the number of dimensions and indicators included in the original model.
The validity and reliability of the measurement model are evaluated in step 6.
Step 2
- Identify related measures
- Specify construct ’s aspects
Step 3
- Generate set of measures
- Build measur. model Step 4
- Collect data Step 5
- Assess model dimensions Step 6
- Validate measurement model
Step 1
- Identify related concepts
Related concepts
Exploratory Phase
Aspects
Measurement model - initial
Scores
Related measures
Confirmatory Phase
Measurement model - revised
4
Exploratory Phase
An understanding of the concept of process harmonization is required to derive measures. In the
exploratory phase, the meaning of this construct is analyzed. The main goal is to derive a
measurement model, including different aspects and a list of measures of process harmonization.
Step 1: Identifying related concepts
This step consist of searching in the literature to identify concepts related to process harmonization, to
better understand the construct under study and define it’s domain. “It is imperative, though that,
researchers consult the literature when conceptualizing constructs and specifying domains”
(Churchill, 1979, p.67).
Unit of analysis
The unit of analysis in the first step was a selection of conference papers, journal papers, managerial
papers, thesis reports and company reports, which analyze the concept of “process harmonization”.
The search engines used include Google Scholar, ABI/ INFORM, EMERALD and SPRINGER. A
literature review was conducted following a research protocol based on the protocol proposed by
Vanwersch et al (2011), to illustrate the decisions made during the process. It helped to identify how
the construct has been used in prior research and how it differs from other related constructs.
Procedure for step 1
A literature review was conducted to broad the knowledge base in the research area of process
harmonization, which is very fragmented and previous contributions have not been contextualized
(Kumar 2010, p.30). An iterative process was followed, which includes four steps: search, select,
classify and analyze. An iterative process was chosen because this is an explorative research in which
we do not know in advance how extensive the available literature is. The search step involves: (1) a
pre-search, using Google Scholar as a search engine, to identify how extensive the literature on this
topic is and to determine the keywords to be used for the search; (2) a systematic search, using the
keywords that were identified in the pre-search step and three search engines: ABI/INFORMS,
EMERALD and SPRINGER; and (3) a cross-reference search, using a backward tracing technique,
looking at the references of articles collected during the systematic search. The type of documents
chosen in this phase include: conference papers, journal papers, managerial papers, thesis reports and
company reports.
A next step was the selection process which consisted of the evaluation of all the articles selected,
using two different criteria: relevance and quality. The relevance criterion help us to evaluate if the
article contributes to achieve the goals of this study, while with the quality criterion helps to assess the
quality of the sources. Documents collected were analyzed looking at phrases or words in the text to
capture the contextual meaning of the concept as suggested in Strauss and Corbin (1998). Concepts
used to describe process harmonization were highlighted and linked to each document. Table 1 shows
a concept matrix suggested in Webster and Watson (2002), which was used to summarize the findings
and to identify which are the concepts mostly associated with process harmonization.
Results of step 1
The analysis of the literature found ten different concepts related to process harmonization in the 33
articles selected. Table 1 shows a summary of the findings. It includes the list of articles selected and
concepts identified to describe process harmonization. The concepts found include: standardization,
adaptation, integration, alignment, collaboration, centralization, modularization, coordination,
homogenization and customization.

5
Table 1 - Concept Matrix
No. Article
Concepts
Sta
nd
ard
iza
tio
n
Ad
ap
tati
on
Inte
gra
tio
n
Ali
gn
men
t
Co
lla
bo
rati
on
Cen
tra
liza
tio
n
Mo
du
lari
zati
on
Co
ord
ina
tio
n
Ho
mo
gen
iza
tio
n
Cu
sto
miz
ati
on
1 Ang and Massingham (2007) X X
2 Hofreiter et al (2005) X
X
3 Boersma and Kingma (2005) X
X
4 Buchta et al (2010) X
5 Carmichael (1997)
X
6 Dai et al (2010) X
7 Girod and Bellin (2011) X
8 Helfert (2009) X
9 Hufgard and Gerhardt (2011)
X
10 Kobayashi et al (2002) X
11 Kubicek et al (2011) X
X X
12 Kumar and Harm (2004) X
13 Lee et al (2005) X
14 Liere van et al (2004) X
X X X
15 López-Ortega and Ramírez-Hernández
(2007) X
16 McLaren (2002) X
X
17 Moffat and Archer (2004)
X
X
18 Mortensen and Lemoine (2007) X
X
19 Münstermann et al (2009) X X
20 Münstermann et al (2010) X
X
21 Münstermann et. al_2 (2010) X
X
22 Norta and Eshuis (2010)
X
X
23 Perego and Salgaro (2010)
X
24 Rohloff (2011) X
25 Rosenkranz (2010) X
26 Schäfermeyer (2010) X
27 Schmidt et al (2010)
X
28 Shang and Seddon (2007)
X
29 Sorenson and Sorensonn (2001) X
X
30 Tregear (2010) X
X
31 Ventura Martins and Rodriguez da Silva
(2006) X
32 Wüllenweber et al (2008)
X
33 Zhao (2004) X
Total 23 2 10 4 2 2 1 2 3 1

6
Process standardization was the concept mostly related with process harmonization in the literature in
69% of the documents selected, followed by integration in only 30%. Therefore, only the concept of
process standardization will be selected to understand how it has been measured previously in the
literature and the specific underlying aspects that different authors captured in their measures.
Therefore, the next step is to identify in the literature some measures of process standardization.
Step 2: Defining aspects
In this step, different measures of “process standardization” are identified and classified based on the
type of process aspects that they measure. The output of this step is a set of the main aspects of
process standardization that must be considered to derive new measures of process harmonization.
Additionally, measures of process standardization are further used to assess the validity and reliability
of the measurement model in step 6.
Unit of analysis
The unit of analysis of this step is a combination of literature and a group of participants selected
according to a set of criteria. From the documents found in the literature research in the previous step,
only research papers which present measures of process standardization were selected. Additionally, a
group of professionals in Procurement and academics in business process management was selected
for a workshop. The selection of practitioners from only one specific process type “Procurement” was
made to focus on identifying aspects and measures of process harmonization, for a process which was
well-known by all the participants to reduce the scope of discussions. The workshop included nine
participants organized in two mixed groups with three academics and four practitioners.
Procedure for step 2
Measures of process standardization identified in the literature are summarized in Table 2. Each
measure was classified looking at words in the text that capture aspects of the process that they
measure. For instance, “During the execution of the process we follow a well-regulated process cycle”
refers to the order in which the activities in the process are performed. In this example the keyword is
“process cycle”. Therefore, the aspect associated with this measure is control flow. The same analysis
was done with all the measures indicated in Table 2 and indicated in the column Aspect.
Additionally, a workshop was conducted to identify the set of aspects relevant for process
harmonization from a practical perspective. Participants were asked to identify factors that exert an
influence in the harmonization level of a procurement process and specific aspects of process
harmonization related to these factors. As part of the outputs of this workshop we collected a set of
aspects of harmonization from a practical perspective. Table 2 shows a list of aspects identified
though the literature review, compared with the output of both professional groups in the workshop.
All the aspects identified at least by two sources were included as an input for next step.
Results of step 2
Table 2 shows the different measures and the aspects of a business process standardization that they
evaluate. Most of the measures defined evaluate one specific aspect, besides measures 14 and 15
which are general, and evaluate the level of standardization of the process as a whole. The list of
aspects identified includes: activities, control flow, data, management, information technology and
resources. Activities refer to the level of standardization of specific steps in the process. Control-flow
measures the level of standardization of the sequence of activities. Data measures the level of
standardization of input and output data used in the process. Management measures the
standardization of the process assessment. Information Technology refers to the level of

7
standardization of IT systems.
Table 2 - Aspects derived from measures of process standardization
No. Measures Citation Aspect
1 There are mandatory specifications for each step
of the process.
Beimborn et al (2009) Activities
2 Business units have similar or overlapping
operations.
Ross et al (2009) Activities
3 Process is efficient and organized with
transparent and comprehensible activities.
Münstermann et al
(2009, 2010)
Activities/ Control
flow
4 We have documented all actions of the business
process to a great extent.
Münstermann et al
(2009, 2010);
Schäfermeyer (2010);
Wüllenweber et al
(2008)
Activities/ Control
flow
5 There is a fixed procedure for the collaboration
between departments.
Münstermann et al
(2009, 2010)
Control flow
6 The process runs through mandatory process
steps.
Beimborn et al (2009) Activities
7 During the execution of the process we follow a
well-regulated process cycle.
Münstermann et al
(2009, 2010);
Schäfermeyer (2010);
Wüllenweber et al
(2008)
Control-flow
8 The execution of the business process is strongly
standardized.
Münstermann et al
(2009, 2010);
Schäfermeyer (2010);
Wüllenweber et al
(2008)
Control-flow
9 Data is standardized across business units. Ross et al (2009) Data
10 Process performance is reported globally. Tregear (2010) Data/ Management
11 IT decisions are centralized. Ross et al (2009) Information technology
12 There are globally integrated business processes
often with support of enterprise systems.
Ross et al (2009) Information technology
13 Global quality assurance on process work. Tregear (2010) Management
14 The department already worked with process
standards in the process.
Münstermann et al
(2009, 2010)
Not specified
15 The process is highly standardized Beimborn et al (2009);
Ross et al (2009);
Schäfermeyer (2010);
Wüllenweber et al
(2008)
Not specified
16 Centralized management often applying
functional/ process/business units matrices.
Tregear (2010); Ross
et al (2009)
Resources
17 There is a centralized control over business
process design.
Ross et al (2009) Resources /
Management
The aspects derived from the literature were compared with those identified during the workshop.
Table 3 include a list of all the aspects of process harmonization identified using the literature and two
professional teams who participated in the workshop. Aspects identified through at least two sources
were included.

8
Table 3 - Aspects selected based on literature and practice
No. Aspects Source
Literature Workshop team1 Workshop team2
1 Activities X X
2 Control flow X X X
3 Data X X
4 Management X
5 Information technology X X X
6 Human Resources X X
Activities and control-flow are considered together, because in some cases the distinction to what
extent a measure evaluates each individual activity or the collection of activities with a predefined
order. Therefore, both activities and the relationship between these activities are included in one
aspect.
Step 3 - Defining measures
To evaluate how the different aspects previously identify really reflect different parts of the
concept under study, empirical research was conducted. This step consists of defining measures for
each aspect previously identified.
Unit of analysis
Units of analysis in this stage were two professionals engaged in harmonization projects in large scale
companies and three academics. Two interviews were conducted with these experts. One expert is a
professional responsible to conduct a large scale harmonization project in a governmental
organization in the last six years. The other expert conducted a study about the impact of factors such
as information technology in process standardization versus harmonization in value chain
management. This study included six multinational companies, in which two of them show successful
results in their harmonization efforts. The academics are participating in a project of process
harmonization and were exposed to literature and practical experiences in the topic.
These professional and academic experts were selected considering their experience, to identify
indicators of process harmonization that they have seen in practice in the companies studied and in
previous literature on the topic.
Procedure for step 3
Interviews were conducted using a questionnaire with open questions to identify specific measures
that they have used in the companies involved, to evaluate the level of harmonization after their
harmonization initiatives were conducted. They were also asked about the motivation and expected
benefits when conducting these initiatives. These questions helped to identify which measures are
significant for the companies. The meeting with academics was performed after the interviews and
was performed informally as a brainstorming to generate ideas of more measures aligned with those
gathered in practice. The original list of measures was rewritten considering that its wording was as
simple and precise as possible, as suggested in the literature by Tourangeau et al (2000). This process
was not exhaustive because it was only intended to generate a first set of measures which allows a
quantitative validation of the aspects proposed.
Results of step 3

9
A first set of measures of process harmonization were gathered as a result of this step. An initial list of
eight measures was developed and is depicted in Table 4. Table 4 shows the measures related to each
one of the aspects: Activities and control flow, data, Information Technology (IT) and Human
Resources. This initial set includes one indicator for activities (IA1), two related to Data aspect (ID1
and ID2), two related to resources (IR1 and IR2) and finally three defined for Information Technology
(IT1, IT2 and IT3).
Table 4 - Measures of process harmonization ID Measures Aspect
IA1 The percentage of common activities in the process. Activities
ID1 The number of different documents used as input for the same process. Data
ID2 The number of different output reports. Data
IR1 The percentage of common roles in the process. Resources
IR2 The number of different roles executing the same activity. Resources
IT1 The number of different software applications in used in the process. IT
IT2 The number of different supplier's paid for the software applications. IT
IT3 The amount of money paid for the software applications. IT
Using this set of measures we built a measurement model which evaluates the level of
harmonization of a business process in an organization. This initial measurement model derived is
depicted in Figure 2. It shows that the level of harmonization is composed by four different aspects as
identified before (data, activities, resources and IT). Each one of these aspects is measured through a
set of indicators. The indicators are represented as reflective because within each aspect, they are
expected to be correlated. As a results, a hierarchical model (reflective first order (for data, Activities
(ACT), Resources (RES) and IT) with a formative second order (business process harmonization-
BPH) model was derived.
Figure 2 – Initial hierarchical model (reflective first order and formative second order)
Empirical research is conducted in the next step to assess the number of different dimensions

10
underlying this model and its structure.
Confirmatory Phase
The confirmatory phase is a staged process whereby the measurement model built in the exploratory
phase is assessed in terms of dimensionality, validity and reliability. The assessment is performed
following three steps: (1) Collecting data for model validation; (2) Assessing the model dimensions;
and (3) Validating the measurement model derived.
Step 4: Collecting data
Empirical research was conducted to identify how much the current set of measures actually reflects
different aspects of the harmonization level. An online survey was conducted to achieve the goal of
this step, using the constructs derived in the previous steps (Data, resources, Activities and IT), and
using two reflective constructs taken from the literature for validation. These constructs are business
process standardization (BPS) operationalized by a 3-item instrument developed by Münstermann et
al (2010), and business process complexity (BPC) operationalized with a 5-item instrument developed
by Schäfermeyer et al (2012). Details about these constructs are further provided.
Unit of analysis
The targeted respondents for the online survey were professionals with experience in business process
management (BPM) practices. The survey instrument was distributed in two languages: English and
Dutch, targeting a different group of professionals within BPM. The Dutch questionnaire was sent to
the members of the BPM round table at Eindhoven University of Technology, with more than 300
members registered when the survey was conducted. The questionnaire translated to English was
distributed throughout BPM experts worldwide invited through advertisements made on LinkedIn in a
group called BPMInstitute.org with 1,311 members. It was also published though an internal
communication portal used in an international consultancy firm in The Netherlands (with 1,779
members registered). Professionals in BPM assumed the role of key informants because they provide
information on an aggregate unit of analysis (in this case a harmonization project) by reporting on
organizational characteristics (Dillman, 2007).
Procedure for step 4
The survey instrument is included in Appendix A and it requires around 20 minutes for completion. It
was built using a Google document and the link for access was distributed to the targeted population.
A set of criteria described in Dillman (2007) were considered to design the questionnaire. This set of
criteria focuses on reducing the sources of error when conducting survey research, to be able to
generalize sample results to a defined population.
The sources of error include: coverage error, sampling error, measurement error and nonresponsive
error. The coverage error is “the result of all units in a defined population not having a known
nonzero probability of being included in the sample drawn to represent the population”. The sampling
error is “the result of surveying a sample of the population rather than the entire population”. The
measurement error is “the result of inaccurate responses that stem from poor question wording, poor
interviewing, survey mode effects and/or some aspect of the respondent’s behavior”. And the
nonresponse error is “the result of no response from people in the sample, who, if they had
responded, would have provided different answers to the survey questions than those who did respond
to the survey”. This section shows the decisions made to reduce the sources of errors described before
when designing the survey instrument.
11
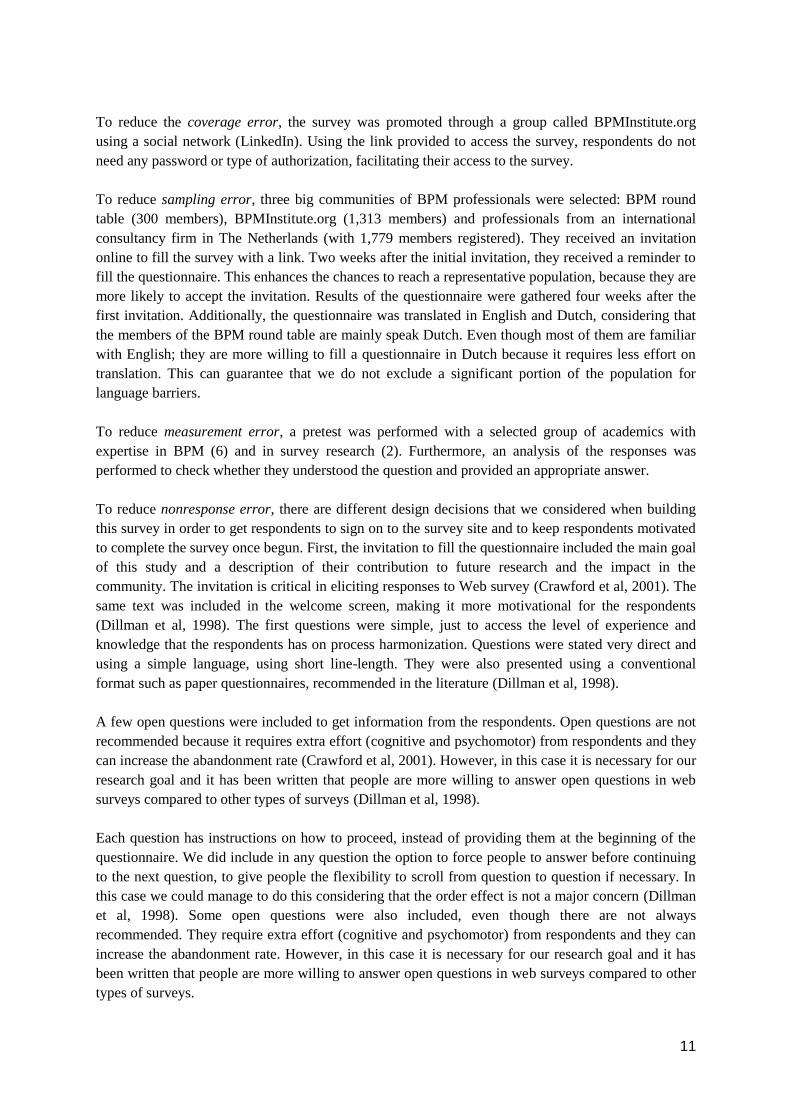
To reduce the coverage error, the survey was promoted through a group called BPMInstitute.org
using a social network (LinkedIn). Using the link provided to access the survey, respondents do not
need any password or type of authorization, facilitating their access to the survey.
To reduce sampling error, three big communities of BPM professionals were selected: BPM round
table (300 members), BPMInstitute.org (1,313 members) and professionals from an international
consultancy firm in The Netherlands (with 1,779 members registered). They received an invitation
online to fill the survey with a link. Two weeks after the initial invitation, they received a reminder to
fill the questionnaire. This enhances the chances to reach a representative population, because they are
more likely to accept the invitation. Results of the questionnaire were gathered four weeks after the
first invitation. Additionally, the questionnaire was translated in English and Dutch, considering that
the members of the BPM round table are mainly speak Dutch. Even though most of them are familiar
with English; they are more willing to fill a questionnaire in Dutch because it requires less effort on
translation. This can guarantee that we do not exclude a significant portion of the population for
language barriers.
To reduce measurement error, a pretest was performed with a selected group of academics with
expertise in BPM (6) and in survey research (2). Furthermore, an analysis of the responses was
performed to check whether they understood the question and provided an appropriate answer.
To reduce nonresponse error, there are different design decisions that we considered when building
this survey in order to get respondents to sign on to the survey site and to keep respondents motivated
to complete the survey once begun. First, the invitation to fill the questionnaire included the main goal
of this study and a description of their contribution to future research and the impact in the
community. The invitation is critical in eliciting responses to Web survey (Crawford et al, 2001). The
same text was included in the welcome screen, making it more motivational for the respondents
(Dillman et al, 1998). The first questions were simple, just to access the level of experience and
knowledge that the respondents has on process harmonization. Questions were stated very direct and
using a simple language, using short line-length. They were also presented using a conventional
format such as paper questionnaires, recommended in the literature (Dillman et al, 1998).
A few open questions were included to get information from the respondents. Open questions are not
recommended because it requires extra effort (cognitive and psychomotor) from respondents and they
can increase the abandonment rate (Crawford et al, 2001). However, in this case it is necessary for our
research goal and it has been written that people are more willing to answer open questions in web
surveys compared to other types of surveys (Dillman et al, 1998).
Each question has instructions on how to proceed, instead of providing them at the beginning of the
questionnaire. We did include in any question the option to force people to answer before continuing
to the next question, to give people the flexibility to scroll from question to question if necessary. In
this case we could manage to do this considering that the order effect is not a major concern (Dillman
et al, 1998). Some open questions were also included, even though there are not always
recommended. They require extra effort (cognitive and psychomotor) from respondents and they can
increase the abandonment rate. However, in this case it is necessary for our research goal and it has
been written that people are more willing to answer open questions in web surveys compared to other
types of surveys.

12
Following the decision of using open questions, we decided not to use a progress pointer. Basically,
we consider that in our questionnaire with open questions, if we include a progress pointer based on
number of items completed, this may produce the backfire effect of increasing the abandonment rate
(Crawford et al, 2001; Couper et al, 2001). The main reason is because we may underestimate the
duration of the survey due to the open questions. We made this decision even though there are
contradictory findings with respect to the effect of progress pointers used in surveys. Some authors
arguing that indicating progress through the survey increase the motivation to complete the survey
while reducing abandonment (Dillman et al, 1998).
Another decision that we considered in the design of the survey instrument is the number of questions
on a single screen. We decided to include only one question per screen, to reduce the correlation in
responses among items sharing one single screen (Couper et al, 2001), except for question 7 and 9 in
which they are related. The downside of this decision is that it can increase the time taken to answer
the survey. This is not very critical in this case, considering that the survey is relatively short with few
questions. In questions 4 and 8, we used check boxes, but we restricted it to only a few options to
avoid that the respondent only focus the attention on the first options ignoring the last ones (Couper et
al, 2001).
In the survey besides the set of indicators derived in the previous phase, two constructs were
evaluated: business process standardization and business process complexity. Measures of these two
concepts can be seen as reflective measures of process harmonization, because if the level of
harmonization increases we can expect that the level of standardization also increases while the
process complexity decreases. They were operationalized using instruments provided in the literature
and depicted in Table 5. Business process standardization (BPS) was operationalized by a 3-item
instrument developed by Münstermann et al (2010), which assess the level of standardization of a set
of business processes. This was a measurement model selected in Step 2 to be used for further
validation. The second construct operationalized is business process complexity (BPC). It was
operationalized with a 5-item instrument developed by Schäfermeyer et al (2012), and described as
the level of difficulty reported by project managers and operators, during process standardization or
execution.
Table 5 – Description of constructs and measures used in the survey
Construct Item Measures
BPS BPS1 The execution of the business process is strongly standardized.
BPS2 We have documented all actions of the business process to a great extent.
BPS3 During the execution of the process we follow a well-regulated process cycle.
BPC BPC1 The employees executing the business process need to be able to flexible
adjust themselves to the differing process sequences
BPC2 The set of inputs necessary for process execution differ often
BPC3 The business process is characterized by uncertainty
BPC4 The business process is very complex
BPC5 A lot of information is needed to execute the business process
After the survey questionnaire was complete, a pre-test was conducted using cognitive interviewing.
The questionnaire used for the pre-testing is included in Appendix B. The pretest included 6
academics with experience in BPM and two with experience in conducting research in social science,
to evaluate the survey instrument (Collins, 2003). After the results of the pre-test were collected, the
survey questions were further improved and an additional check was performed but only with

13
informal experts’ interviews. The online survey was sent with a reminder two weeks later, to increase
the respondent rate. The data was collected after four weeks for further analysis.
Finally, when the data was collected we assumed that responses from people who did not participate
in the survey are no different than those who did participate. This assumption was represented using
the following hypothesis:
H0: µrespondents 1 = µNo-respondents 2
H1: µrespondents 1 ≠ µNo-respondents 2
This assumption was tested conducting a non-response bias analysis to evaluate the extent to which
our sample represents the population of this study and the biases observe in the responses due to
nonresponse. An extrapolation method was carried over successive waves of the survey. We identified
two waves of questionnaire returns. Respondents in the first (early) wave are those who replied after
the survey was made available for the first time. The second (late) wave includes respondents who
replied after a reminder was sent, two weeks after the first invitation to fill the survey.
The analysis includes the comparison of descriptive statistics of the demographic data and comparison
of key variables (Sheikh and Mattingly, 1981; Etter and Perneger, 1997). The demographic
considered were: the origin of respondents divided per language (Dutch and International sample), the
experience in process harmonization projects (yes/no, and the time of experience), and the role of
respondents in harmonization projects. The key variables include the indicators of process
harmonization evaluated in the survey (ID1, ID2, IA1, IR1, IR2, IT1, IT2, IT3) and the comparison
was conducted using an Independent sample two-tailed T-test with a level of significance of 0.05. We
compared differences in their perception about the extent to which the indicators derived in our
measurement model actually reflect the level of harmonization of a process. Additionally, we evaluate
that the assumptions of the T-test were met using Levene's Test for Equality of Variances. In both
tests, two paired T-test and Levene’s test, the null hypothesis can be rejected if the p-value calculated
is smaller than 0.05.
Results of step 4
Table 6 shows the demographics of participants divided in two groups early and late respondents. In
total, 119 responses were gathered. They are composed by sample groups: the Dutch sample and the
International sample. The response rate for the Dutch sample is 16.7%, with 50 complete surveys out
of a targeted population of 300 members of the BPM round table by the time the survey was
conducted; And 2.23% for the International sample with 69 responses out of a population of 3,092
members (1,313 form the LinkedIn community and 1,779 from an international consultancy
company).
Our response rate of 16.7% in the Dutch sample slightly exceeds the 10–12% rate that Hambrick et al.
(1993) describe as typical for surveys of executives. However, for the International sample this
response rate was significantly reduced to 2.23%. Even though the survey was implemented following
guidelines such as Dillman (1978), we expected to obtain a low response rate due to the subject of the
survey. A difficulty to obtain a higher response rate is that not everyone in the sampling frame may be
familiar with the subject of the survey. They are professionals in business process management
(BPM) but not necessarily focused on process harmonization within BPM. For the Dutch sample we
have closer contact with the potential participants and have more control over their expertise in BPM,
compared to the International sample. Therefore, potential respondents which are unfamiliar with the
topic may not feel interested or uninformed to provide enough input to the survey
14
Table 6 - Participants demographics divided early and late respondents
Demography Category
Respondents (early) Non-respondents (late)
Frequency Percentage Frequency Percentage
Language Dutch 38 38,0 12 63,2
English 62 62,0 7 36,8
Experience Yes 53 53,0 13 68,4
No 47 47,0 6 31,6
Experience time
None 47 47,0 6 31,6
Less than 1 year 30 30,0 8 42,1
1 to 3 years 20 20,0 5 26,3
More than 3 years 3 3,0 0 0,0
Role
Project manager 50 50,0 0 0,0
Manager 2 2,0 4 21,1
Process architect 20 20,0 4 21,1
Business analyst 8 8,0 1 5,3
Consultant 14 14,0 2 10,5
Other 6 6,0 8 42,1
Comparing the level of experience between both samples, we can observe that the percentage of
people with experience in harmonization projects increased by 15% in the late response sample
compared to the early response. However, the time of experience was reduced. It can be observed that
in the late response sample none of the respondents had more than three years of experience.
Significant differences were observed in terms of the role in both samples. The majority of early
respondent were project managers while in the late response sample these group is distributed among
managers and others. It is possible that the term project manager is too specific and therefore, several
terms for managers with the same type of function can be used. However, in terms of the role we can
conclude that significant differences are register in the early and late respondent’s sample.
After observing differences in demographic characteristics of both samples, we decided to evaluate to
what extent these differences influence their responses. The descriptive statistics for all the responses
are shown in Appendix C and Appendix D. Appendix C shows the descriptive statistics of each of the
indicators collected for two groups (1- early and 2- late respondents). For each of the indicators, the
mean, standard deviation and standard error mean was calculated. They are further used for the t-test.
The results gathered show that for all the indicators, the significance p-value) of Levene’s test is
greater than 0.05, except for IT3 which is 0.007. These results indicate that the assumption that the
variances are equal cannot be rejected and therefore, the results of the T-test for equal variance should
be conducted. Only for IT3 we considered the results for equal variance not assumed. The results of
the T-test for all the indicators show a p-value greater than 0.05. Therefore, no significant differences
are detected, and at 0.05level of significance, the null hypothesis that early and late responses are not
different (H0:µrespondents1 =µNo-respondents2) cannot be rejected, and we consider that there is no response
bias in the results obtained.

15
Step 5: Assessing model dimensions
Factor analysis is used in this step to suggest the number of dimensions underlying the level of
harmonization of a business process. Data collected in the previous step was used as an input for
factor analysis.
Unit of analysis
The unit of analysis in this stage is the responses gathered of 119 professionals in BPM. They are the
responses provided using both the Dutch and English questionnaire. The answers provided were their
opinion based on previous experience or knowledge on the topic. They needed to evaluate to what
extent the provided measures actually assess an aspect of process harmonization. Their input was
provided using a Likert scale from 1 until 5.
Procedure for step 5
Content validity of the items generated and the dimensionality of the construct under study are
evaluated using Exploratory Factor Analysis (EFA), which is conducted using the software package
for statistical analysis SPSS. Five steps were followed to conduct this Exploratory Factor Analysis as
suggested by Hair et al. (2006): (1) Examine the factor loading matrix; (2) identify significant
loadings in the matrix; (3) assess communalities; (4) Re-specify the factor model if needed; and
(5) Label the factors.
There are three EFA decisions which are very important for the outcome of the analysis: (a) the factor
extraction model used; (b) the number of factors retained; and (c) the method used to rotate factors, if
more than one factor is retained (Conway and Huffcutt, 2003). Common factor analysis is the factor
extraction model selected. It is more appropriate than the component factor analysis considering that
the goal of this step is to identify latent dimensions represented in the original variables and we do not
have previous knowledge about the amount of specific of error variance (Hair et al., 2006).
The number of factors to retain was based on the following three criteria: (1) The latent roots or
eigenvalues should be greater than 1; (2) The conceptual foundation, indicating the underlying
dimensions of the concept based on the theory; And, the scree test criterion, which indicates the
maximum number of factors that must be retained as the value where the inflexion point occurs.
Finally, an orthogonal rotational method was selected to rotate factors. Varimax was the method
selected because it “has proved successful as an analytical approach to obtaining an orthogonal
rotation of factors” (Hair et al., 2006 p.126).
Results of step 5
The analysis is performed with 119 responses, which constitutes more than 14:1 ratio of observations
per variable. This ratio is more than adequate, a minimum of 50 observations and 5:1 ratio (Hair et al,
2006), for the calculation of the correlations between variables. The overall measure of sampling
adequacy (MSA) of 0.761, and above 0.50 for each individual variable (0.775, 0.798, 0.793, 0.844,
0.679, 700, 729 and 840), indicate that sufficient correlation exists among variables and therefore it is
appropriate to proceed with the factor analysis. An exploratory common factor analysis was
conducted to examine whether the number of dimensions conceptualized could be verified
empirically. Table 8 shows that the total variance can be explained by three factors which can explain
68.67% of the total variance. They also have an eigenvalue of 1 or more.
16
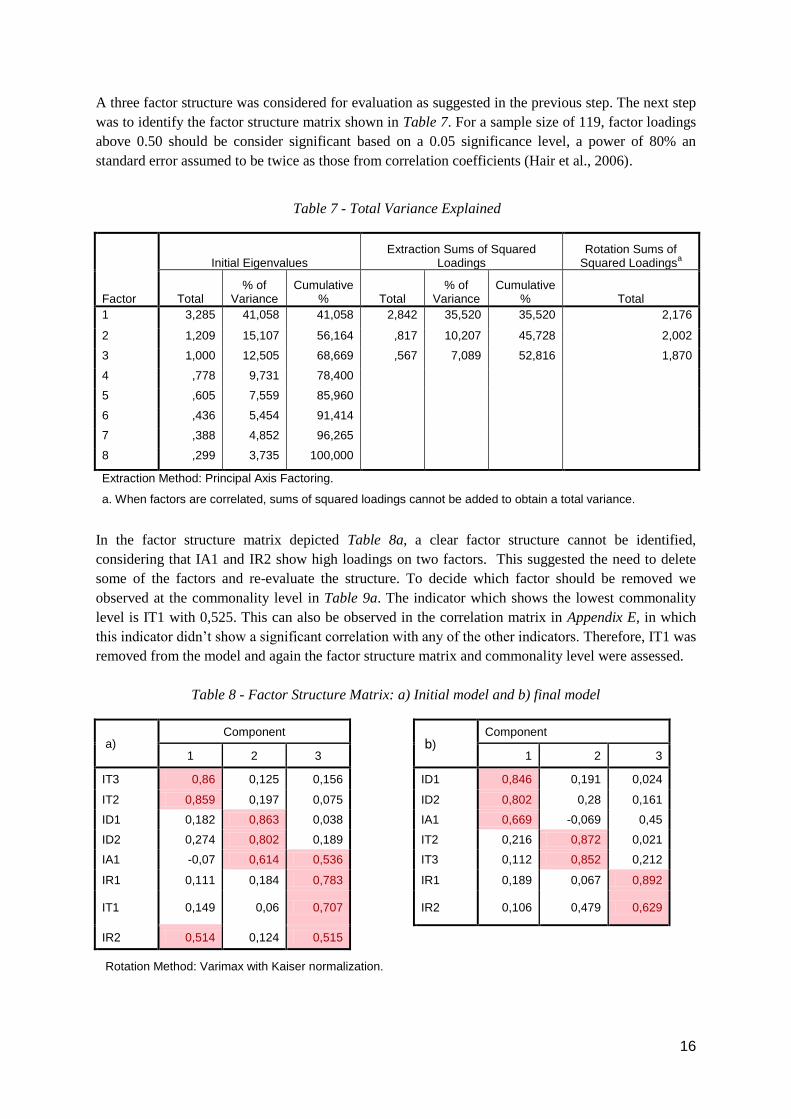
A three factor structure was considered for evaluation as suggested in the previous step. The next step
was to identify the factor structure matrix shown in Table 7. For a sample size of 119, factor loadings
above 0.50 should be consider significant based on a 0.05 significance level, a power of 80% an
standard error assumed to be twice as those from correlation coefficients (Hair et al., 2006).
Table 7 - Total Variance Explained
Factor
Initial Eigenvalues Extraction Sums of Squared
Loadings Rotation Sums of
Squared Loadingsa
Total % of
Variance Cumulative
% Total % of
Variance Cumulative
% Total
1 3,285 41,058 41,058 2,842 35,520 35,520 2,176
2 1,209 15,107 56,164 ,817 10,207 45,728 2,002
3 1,000 12,505 68,669 ,567 7,089 52,816 1,870
4 ,778 9,731 78,400
5 ,605 7,559 85,960
6 ,436 5,454 91,414
7 ,388 4,852 96,265
8 ,299 3,735 100,000
Extraction Method: Principal Axis Factoring.
a. When factors are correlated, sums of squared loadings cannot be added to obtain a total variance.
In the factor structure matrix depicted Table 8a, a clear factor structure cannot be identified,
considering that IA1 and IR2 show high loadings on two factors. This suggested the need to delete
some of the factors and re-evaluate the structure. To decide which factor should be removed we
observed at the commonality level in Table 9a. The indicator which shows the lowest commonality
level is IT1 with 0,525. This can also be observed in the correlation matrix in Appendix E, in which
this indicator didn’t show a significant correlation with any of the other indicators. Therefore, IT1 was
removed from the model and again the factor structure matrix and commonality level were assessed.
Table 8 - Factor Structure Matrix: a) Initial model and b) final model
a) Component
b)
Component
1 2 3
1 2 3
IT3 0,86 0,125 0,156
ID1 0,846 0,191 0,024
IT2 0,859 0,197 0,075
ID2 0,802 0,28 0,161
ID1 0,182 0,863 0,038
IA1 0,669 -0,069 0,45
ID2 0,274 0,802 0,189
IT2 0,216 0,872 0,021
IA1 -0,07 0,614 0,536
IT3 0,112 0,852 0,212
IR1 0,111 0,184 0,783
IR1 0,189 0,067 0,892
IT1 0,149 0,06 0,707
IR2 0,106 0,479 0,629
IR2 0,514 0,124 0,515
Rotation Method: Varimax with Kaiser normalization.

17
Table 9 - Commonality using a principal component analysis: a) Initial model and b) final model
a) Initial Extraction
b) Initial Extraction
ID1 1,000 ,780
ID1 1,000 ,753
ID2 1,000 ,753
ID2 1,000 ,748
IA1 1,000 ,669
IA1 1,000 ,655
IT2 1,000 ,782
IT2 1,000 ,807
IT3 1,000 ,780
IT3 1,000 ,784
IR1 1,000 ,659
IR1 1,000 ,836
IR2 1,000 ,545
IR2 1,000 ,636
IT1 1,000 ,525
As a result, a three factor structure is proposed considering the clear structure shown in Figure 8b, in
which all the variables have high loadings only with a single factor and the minimum level of
commonality of all the factors is 0,636. The group of variables grouped in three factors is label based
on the type of indicators that they represent. A revised measurement model is illustrated in Figure 3,
composed by three factors: DATA, Resources and IT. Data is composed by the indicators IA1, 1D1
and 1D2; Resources by IR1 and IR2 and IT by IT2 and IT3.
Figure 3 – Revised hierarchical model (reflective first order and formative second order)
Step 6: Validating measurement model
In this step the internal consistency and reliability of the model derived is assessed. But internal
consistency is not sufficient, we will also evaluate whether our model correlates with other related
measure and whether it behaves as expected. Two constructs related to process harmonization were
also included in the data gathering efforts to assess the measurement model under study, considering
its hierarchical structure. They include: business process standardization (Münstermann et al, 2010)
and business process complexity (Schäfermeyer et al, 2012).
Unit of analysis
The unit of analysis in this stage is the same as the previous step, 119 responses gathered of
professionals in BPM.
18
Procedure for step 6
The measurement model was specified as a hierarchical factor model type II (reflective first order and
formative second-order) as shown in Figure 3. Smart PLS software was used to measure the scale of
measurement of the first and second order constructs. PLS was chosen for the analysis of this
measurement model for three reasons: (1) it makes fewer demands regarding sample size than other
methods; (2) It is able to handle both formative and reflective indicators; and (3) it is better suited for
theory development than for theory testing.
The repeated indicator approach with mode B on the process harmonization construct and inner path
weighting scheme is used to estimate the hierarchical latent variable model (Becker et al, 2012). This
approach consists of using the indicators twice: (1) for the first-order constructs (Data, resources and
IT) and (2) for the second-order construct (BPH). Having specified the measurement model in this
way, the path coefficients between the first and second order constructs represent the loadings of the
second order latent variable (Löhmoller, 1989; Becker et al., 2012). “This approach produces
generally less biased, and therefore, more precise parameter estimates and a more reliable higher-
order construct score.”(Becker et al, 2012).
The evaluation of the measurement model include: (1) an assessment of the first-order reflective
constructs using the constructs and measures loadings, t-values, AVE, composite reliability and
discriminant reliability; and (2) for the second order formative construct (BPH), evaluate the measures
weights, significance of weights and multicolinearity among measures. The evaluation of the
convergent validity is done using the using the constructs and measures loadings and weights and t-
values. The values of factor loadings and AVE should be above 0.50 and composite reliability above
0.70 (Hair et al, 2006). The discriminant validity for the first-order constructs is evaluated following
the criterion described by Fornell and Larcker (1981). The criterion is that the square root of AVE
should be greater than the variance shared between the construct and other constructs in the model
(Bollen, 1989). The variance inflator factor (VIF) test was used to evaluate multicolinearity among
measures, which is mostly used by authors in the literature when using formative indicators (Ringle et
al, 2012).
Finally, a nomological network is used to assess the validity of the multidimensional structure
(MacKenzies et al., 2011). The direct effect of an antecedent of process harmonization on each aspect
of the concept (Data, Resources and IT) is measured. If they are equal, we consider this as a support
of the multidimensional construct (Edwards, 2001). The antecedent construct selected in this study is
business process complexity, using the construct provided by Schäfermeyer et al. (2012). The final
endogenous construct used to build the nomological network is business process standardization,
using the operationalization proposed by Münstermann et al (2010).
Results of step 6
The repeated indicator Mode B PLS-SEM model used for our analysis is depicted in Figure 4. It
shows how the indicators of each individual first-order construct (Data, Resources and IT) are
repeated in the second-order construct (BPH). An exogenous construct, business process complexity
(BPC), is linked to both first and second order constructs. And finally, a construct of business process
standardization (BPS) is used as a final endogenous construct, considering that its indicators (IS1, IS2
and IS3) can be used as reflective indicators of BPH.
The results gathered from the assessment of the reflective first-order construct are summarized in
Table 10 and Table 11. Table 10 shows the loadings, t-values, average variance extracted (AVE) and

19
composite reliability values for all the indicators and first-order constructs. The results of convergent
validity are satisfactory, considering that all the loadings are above o.5o, with a minimum value for
the reflective indicators of 0.71(IR1). All the reflectively measured first-order constructs (DATA,
RES and IT) showed satisfactory values for convergent validity and reliability, with an AVE >0.50
and composite reliability above 0.70. This suggests that the indicators account for a large portion of
the variance of each latent construct
Figure 4 - A repeated indicator Mode B PLS-SEM model for process harmonization (BPM)
The R-squared of the measurement model of 0.995 shows that the formative higher order construct
(BPH) is explained by its components (DATA, RES, IT). Looking at the t-values at the first-order
construct level, all the weights are significant at a 0.05 level (t > 1.96).
Moreover, the variance inflator factor (VIF) used to test multicolinearity among measures provided
values between 1.20 and 1.96 which is below the threshold of 3. Table 11 shows the correlations
between first-order construct and the square root of average extracted variance (AVE) highlighted in
bold. It shows evidence of discriminant validity, because the squared root of AVE for all the first-
order constructs is greater than their correlation with other constructs in the model.

20
Table 10 - Results of the assessment of reflexive first-order construct: evidence of convergent validity
Constructs Measures Loadings t-value AVE Composite
Reliability
Data 2.3466 0.6600 0.8529
IA1 The percentage of common activities in the process. 0,7366 11.2811
ID1 The number of different documents used as input for the same process. 0,8485 43.6912
ID2 The number of different output reports. 0,8469 22.4686
Resources 2.4602 0.7228 0.8389
IR1 The percentage of common roles in the process. 0,8165 9.4556
IR2 The number of different roles executing the same activity. 0,8826 28.7927
IT 2.2413 0.8339 0.9094
IT2 The number of different supplier's paid for the software applications. 0,9066 29.8478
IT3 The amount of money paid for the software applications. 0,9197 69.6419
Business Process Standardization (BPS) 6.1067 0.5462 0.7801
IS1 The execution of the business process is strongly standardized. 0,8048 13,8649
IS2 We have documented all actions of the business process to a great
extent. 0,5942
3,959
IS3 During the execution of the process we follow a well-regulated process
cycle. 0,7987
10,9688
Business Process Complexity (BPC) 6.8837 0.5085 0.8314
IC1 The employees executing the business process need to be able to
flexible adjust themselves to the differing process sequences
0,5117 3,9149
IC2 The set of inputs necessary for process execution differ often 0,5046 3,6915
IC3 The business process is characterized by uncertainty 0,8210 25,2406
IC4 The business process is very complex 0,8066 23,613
IC5 A lot of information is needed to execute the business process 0,8374 28,1152

21
Table 11 - Correlations of latent variables and evidence of discriminant validity
Constructs BPC BPS DATA IT RES
BPC 0,7131
BPS 0,5761 0,7391
DATA 0,4686 0,3985 0,8124
IT 0,4170 0,3590 0,3699 0,9132
RES 0,3547 0,4289 0,4575 0,4222 0,8502
Collectively, the results have shown that the entire measurement model derived satisfy all the
requirements for validity and reliability.
Conclusions
The result of this study is a validated measurement model to assess the level of harmonization of
business processes in an organization. It provides an answer to our research question: What measures
can be used to evaluate the level of harmonization of business processes in an organization? A set of
seven measures summarized in Table 4 can be used to evaluate the level of process harmonization in
an organization. These measures assess three different aspects of a process that should be harmonized,
including: Resources, Data and Information Technology (IT). This set includes two indicators related
to Resources (IR1, IR2), three indicators related to Data aspect (ID1, ID2, IA1), and two related to
Information Technology (IT2, IT3).
The findings above provide evidence that the model derived is a valid and reliable measurement
model for process harmonization. This measurement model has certain strengths but also exhibits
limitations. A significant strength of this paper is the multi-method approach followed, especially in
the conceptualization step. It enriches the construct providing views from literature together with
practice. The literature provided focus on the main aspects of the construct that were used for further
operationalization. Using these initial set of aspects, practitioners defined measures from their
practical experience.
One limitation of this study is that we do not have a large number of indicators per aspect. This can
lead to an under-specification of aspects that must be considered in the assessment of process
harmonization. The measurement model cannot be evaluated containing only one indicator per aspect.
Therefore, in our current study a maximum number of four aspects could be identified with the initial
set of indicators generated. This is the case with the indicator IA1 which was theoretically defined as
an indicator of Activities, and during the confirmatory phase was further combined with indicators of
Data. It was not a surprise that it was combined with Data considering that the correlation between the
harmonization of the steps followed in a process and the data input or output used, is stronger than the
correlation of data with the number of resources used in the process or IT systems.
By conceptually developing and empirically validating the process harmonization construct, this
paper conveys an important message that effective harmonization initiatives requires an evaluation of
the level of process harmonization achieved at different stages in the process to be able to link these
measures with specific improvements in the organization. Our measurement model of process
harmonization can be used by researchers and company executives to guide future research and
practice.

22
Researchers can use this systematically developed and validated measurement model as a starting
point in the examination of the effects of process harmonization on business performance, or the link
between organizational factors and the level of harmonization. In practice, this measurement model
can be used by firms for measuring its process harmonization level. Some firms can assess the ratio of
input and output of a single process harmonization program. This may serve to justify investments in
these types of improvement programs. The conventional approach of simply investing in IT does not
automatically lead to success of harmonization initiatives. One of the results of our research is that IT
related measures only evaluate one aspect of the level of process harmonization.
The findings of this study provide several opportunities for future research. First, future research may
enrich the number of indicators per aspect and re-evaluate the dimensional structure for the
identification of additional aspects. Second, measures considered in this paper involved the evaluation
of process harmonization at the process level, but future research can extend this view to include some
strategic measures that can also be of interest in practice.
References [1] Ang Z and Massingham P (2007) National culture and the standardization versus
adaptation of knowledge management, Journal of Knowledge Management 11 (2): 5-
21.
[2] Becker, J. M., Klein, K., & Wetzels, M. (2012). Hierarchical latent variable models in PLS-SEM: guidelines for using reflective-formative type models. Long Range Planning.
[3] Beimborn D, Gleisner F, Joachim N and Hackethal A (2009) The role of process standardization in achieving IT business value. In: System Sciences, HICSS'09 42nd Hawaii International Conference on, IEEE: 1-10.
[4] Boersma K and Kingma S. (2005) Developing a cultural perspective on ERP,
Business Process Management Journal 11 (2):123–136. [5] Bollen, K. A. (1989) Structural equations with latent variables. [6] Buchta D, Eul M and Schulte-Croonenberg H (2010) Reducing costs-increasing the
efficiency and effectiveness through IT, Strategic IT Management: 139-211.
[7] Carmichael D (1997) IBM's journey towards a market-driven process-managed
business model, Journal of Market-Focused Management 2 (1): 99-103. [8] Churchill, G. A. (1979) A paradigm for developing better measures of marketing
constructs. Journal of Marketing Research 16 (1): 64-73. [9] Collins, D. (2003) Pretesting survey instruments: an overview of cognitive methods. Springer,
Quality of Life Research 12 (3): 229-238
[10] Conway, J. M., & Huffcutt, A. I. (2003). A review and evaluation of exploratory
factor analysis practices in organizational research. Organizational Research
Methods, 6(2), 147-168. [11] Couper, M.P. and Traugott, M.W. and Lamias, M.J. (2001) Web survey design and
administration. AAPOR, Public opinion quarterly 65 (2):230-253.
[12] Crawford, S.D., Couper, M.P. and Lamias, M.J. (2001) Web Surveys: Perception of burden. Social Science Computer Review, 19, 146-162
[13] Dai Q, Kau R. and Wang B (2011) The value of IT-enabled business process
standardization from the real options perspective: Exploring the Grand Challenges for
Next Generation E-Business. Lecture Notes in Business Information Processing
52(1,3): 160-165.
[14] Dess, G. G., & Robinson, R. B. (2006). Measuring organizational performance in the
absence of objective measures: the case of the privately held firm and conglomerate
business unit. Strategic management journal, 5(3), 265-273.

23
[15] Dillman, D. A. (2007). Mail and internet surveys: The tailored design method. John Wiley &
Sons.
[16] Dillman, D. A., Tortora, R. D., & Bowker, D. (1998) Principles for constructing Web
surveys: an initial statement. Technical Report 98-50, Social and Economic Sciences
Research Center. Washington State University, Pullman,WA.
[17] Ebert, C. (2005). Best Practices in Software Measurement: How to use metrics to
improve project and process performance. Springer-Verlag New York Incorporated.
[18] Etter, J. F., & Perneger, T. V. (1997). Analysis of non-response bias in a mailed
health survey. Journal of clinical epidemiology, 50(10), 1123-1128.
[19] Fernandez J and Bhat J (2010) Addressing the complexities of global process
harmonization. In Handbook of Research on Complex Dynamic Process
Management: Techniques for Adaptability in Turbulent Environments, IGI Global,
368-385.
[20] Fornell, C. and Larcker, D. F. (1981). Evaluating structural equation models with
unobservable variables and measurement error. Journal of marketing research, 39-50
[21] Foster, L. A. and B. T. Herndon (1997). ”Implementation of a Reengineered
Procurement Process at Duke University, Using Technology and Work Process
Design.” In Proceedings of the Information Profession and the Information
Profession, CAUSE conference, 1997. [22] Girod S and J. Bellin (2011) Revisiting the modern multinational enterprise theory:
An emerging-market multi-national perspective, Research in Global Strategic Management 15: 167-210.
[23] Hair, J. F., Black, W. C., Babin, B. J., Anderson, R. E., & Tatham, R. L. (2006).
Multivariate Data Analysis Sixth Edition Pearson Education. New Jersey.
[24] Hambrick DC, Geletkanycz MA and Frederickson JW (1993) Top management
commitment to the status quo: some tests of its determinants. Strategic Management
Journal 14, 401–418.
[25] Hammer, M. (1990). ”Reengineering work: Don’t automate, obliterate.” Harvard
Business Review, July-August 1990, 104-112 [26] Helfert M (2009) Challenges of business processes management in healthcare:
Experience in the irish health-care sector, Business Process Management Journal 15 (6): 937-952.
[27] Hofreiter B, Huemer C and Winiwarter W (2005) Business Collaboration Models and
their Business Context-dependent Web Choreography in BPSS. IJWIS 1(1):33-42 [28] Hufgard A and Gerhardt E (2011) Consolidating business processes as exemplified in
SAP ERP systems, S-BPM ONE-Learning by Doing-Doing by Learning 155-171. [29] Kobayashi T, Onoda S and Komoda N (2002) Workflow business template for
application processes in administration department, Information Technology and Management 3 (1): 43-66.
[30] Kubicek, Herbert; Cimander, Ralf and Scholl, Hans Jochen (2011) Wants and Needs When
Pursuing Interoperability. 2011, Organizational Interoperability in E-Government: 79-84.
[31] Kumar R (2010) Research methodology: A step-by-step guide for beginners, Sage Publications Ltd.
[32] Kumar, S., & Harms, R. (2004). Improving business processes for increased operational
efficiency: a case study. Journal of Manufacturing Technology Management, 15(7), 662-674.
[33] Lee, J. Y., Lee, S., Kim, K., & Kim, H. (2005). A process-centric engineering Web services
framework. The International Journal of Advanced Manufacturing Technology, 26(9), 1173-
1183.
[34] Lillrank P (2003) The quality of standard, routine and non-routine processes,
Organizational Studies 24:215-233.

24
[35] López-Ortega, O., & Ramírez-Hernández, M. (2007). A formal framework to integrate
express data models in an extended enterprise context. Journal of Intelligent
Manufacturing, 18(3), 371-381.
[36] Löhmoller, J. Latent Variable Path Modeling with Partial Least Squares.
1989.Physica-Verlag, Heidelberg.
[37] MacKenzie, S. B., Podsakoff, P. M., & Podsakoff, N. P. (2011). Construct
measurement and validation procedures in MIS and behavioral research: integrating
new and existing techniques. MIS Quarterly, 35(2), 293–334. [38] Martins, P. V., & Silva, A. R. D. (2006). A case study applying process and project alignment
methodology. Journal of the Brazilian Computer Society,12(3), 65-82.
[39] McLaren, Tim; Head, Milena and Yuan, Yufei (2002) Supply chain collaboration
alternatives: understanding the expected costs and benefits. Electronic Networking
Applications and Policy, Volume 12, Number 4, 2002, pp. 348-364
[40] Moffat L and Archer N (2004) Knowledge management in production alliances,
Information Systems and e-Business Management 2 (2): 241-267.
[41] Moffat, L. and Archer, N. (2004) Knowledge management in production alliances.
Information Systems and e-Business Management 2: 241-267
[42] Mortensen O and Lemoine O (2008) Integration between manufacturers and third party logistics providers? International Journal of Operations & Production Management 28 (4): 331-359.
[43] Münstermann B, Eckhardt A and Weitzel T (2009) Join the standard forces-examining the combined impact of process and data standards on business process performance. In System Sciences, HICSS'09 42nd Hawaii International Conference on, IEEE: 1-10. Doi: 10.1109/HICSS.2009.280
[44] Münstermann B, Eckhardt A and Weitzel T (2010) The performance impact of business process standardization: An empirical evaluation of the recruitment process, Business Process Management Journal 16 (1): 29-56.
[45] Münstermann, Björn; Eckhardt, Andreas and Weitzel, Tim (2010) The performance
impact of business process standardization; An empirical evaluation of the
recruitment process. Business Process Management Journal, Bradford: 2010. Vol. 16
(1), p. 29 [46] Norta, Alex and Eshuis, Rick (2010) Specification and verification of harmonized business-
process collaborations. Inf Syst Front 12, p. 457–479
[47] Perego, A. and Salgaro, A. (2010) Assessing the benefits of B2B trade cycle integration: a
model in the home appliances industry. Benchmarking: An International Journal 17 (4): 616-
630
[48] Ringle, C., Sarstedt, M., & Straub, D. (2012) A critical look at the use of PLS-SEM in MIS
quarterly. MIS Quarterly (MISQ), 36(1).
[49] Rohloff, Michael (2011) Advances in business process management implementation based on
a maturity assessment and best practice exchange. Information Systems EBusiness
Management (2011) 9:383–403
[50] Rosenkranz C, Seidel S, Mendling J, Schaefermeyer M and Recker J (2010) Towards
a framework for business process standardization, in: Business Process Management
Workshops, Springer: 53-63. [51] Ross J, Weill P and Robertson D (2006) Enterprise architecture as strategy, Harvard
Business School Press, Boston, MA, USA.
[52] Schäfermeyer M, Grgecic D and Rosenkranz C (2010) Factors influencing business
process standardization: A multiple case study. In: Proc System Sciences (HICSS),
25
43rd Hawaii International Conference. IEEE, pp. 1-10.
[53] Schäfermeyer, M., Rosenkranz, C., & Holten, R. (2012) The Impact of Business Process
Complexity on Business Process Standardization-An Empirical Study. Business &
Information Systems Engineering, 4(5), 261-270.
[54] Schmidt, A.; Otto, B. and Österle, H. (2010) Integrating information systems: case studies on
current challenges. Electronic Markets 20 (2): 161-174
[55] Shang, S. and Seddon, P. B. (2007) Managing process deficiencies with enterprise
systems. Business Process Management Journal, 13(3), 405-416.
[56] Sheikh, K., & Mattingly, S. (1981). Investigating non-response bias in mail surveys. Journal
of epidemiology and community health, 35(4), 293-296.
[57] Sorenson, O. and Sorenson, J.B. (2001) Finding the right mix: Franchising, organizational
learning, and chain performance. Strategic Management Journal 22: 713-724
[58] Stein, T. (1999). ”Making ERP Add Up.” InformationWeek, May 24, 1999. [59] Strauss A and Corbin J (1998) Basics of Qualitative Research. Sage Publications,
London. [60] Tourangeau, R., Rips, L. J., & Rasinski, K. A. (2000) The psychology of survey
response. Cambridge: Cambridge University Press.
[61] Tregear R (2010) Business process standardization, Handbook on Business Process
Management 2: 307-327.
[62] van Liere, D. W., Hagdorn, L., Hoogeweegen, M. R., & Vervest, P. H. (2004). Embedded
coordination in a business network. Journal of Information Technology, 19(4), 261-269.
[63] Webster, J., and Watson, R. T. (2002) Analyzing the Past to Prepare for the Future: Writing a
Literature Review. MIS Quarterly 26 (2): 13-23.
[64] Wuellenweber K, Koenig W, Beimborn D and Weitzel T (2008) The impact of
process standardization on business process outsourcing success, Information Systems
Frontiers 10 (2): 211-224.
[65] Zhao F (2004) Management of information technology and business process reengineering: a case study, Industrial Management & Data Systems 104 (8): 674-680.
26
Appendix A
An online survey was conducted to generate indicators of process harmonization. The survey
questionnaire is included bellow, including its access link. This section presents a description of the
process followed for the survey development and data collection, and a justification of decisions made
in the process.
A1. Questionnaire
This survey can be reached using the following link:
https://docs.google.com/spreadsheet/viewform?fromEmail=true&formkey=dEJ2N183S0MzZkFKc01
hNXQ2cnpzM0E6MQ
Survey on Business Process Harmonization
The purpose of this survey is to identify indicators for measuring the level of harmonization of business
processes in an organization. Business process harmonization is important for practitioners and researchers in
the BPM community, because it is critical for a successful implementation of IT solutions and process
improvement.
We appreciate your collaboration in this research answering a questionnaire of 14 questions that will take
approximately 5 to 10 minutes of your time. It will help us to conduct further empirical research to investigate
the appropriate level of harmonization for organizations in different contexts (i.e. multinational versus domestic
organizations).
We would like you to share your opinions with us, and the information that you provide and your participation
will be held as confidential. Please contact us with any questions or concerns about this survey at
Thank you for your participation in this survey!!
Contact person:
Heidi L. Romero
Tel. (+31) 40 247 3703 / 2290
Question #1
Have you participated in a project for process standardization or process harmonization in a company?
o Yes
o No
Question #2
What was your role in this project?
o Project manager
o Manager
o Process architect
o Business analyst
o Consultant
o Other:
Question #3
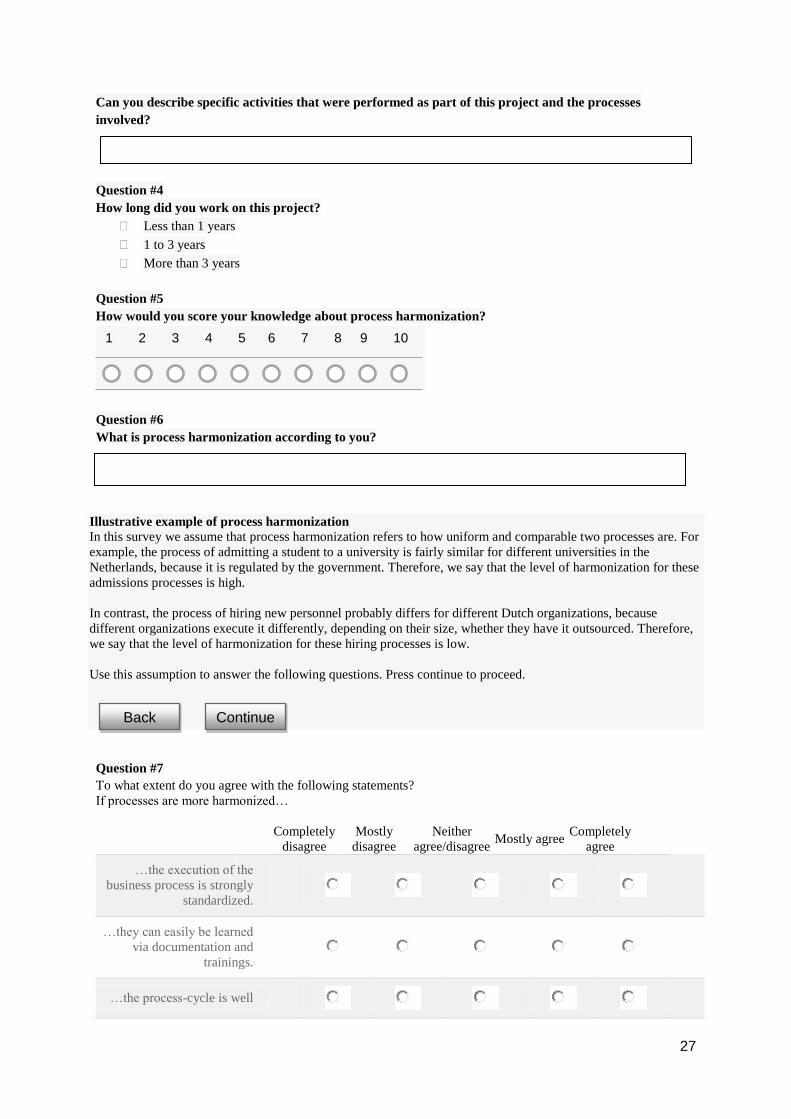
27
Can you describe specific activities that were performed as part of this project and the processes
involved?
Question #4
How long did you work on this project?
Less than 1 years
1 to 3 years
More than 3 years
Question #5
How would you score your knowledge about process harmonization?
Question #6
What is process harmonization according to you?
Illustrative example of process harmonization
In this survey we assume that process harmonization refers to how uniform and comparable two processes are. For
example, the process of admitting a student to a university is fairly similar for different universities in the
Netherlands, because it is regulated by the government. Therefore, we say that the level of harmonization for these
admissions processes is high.
In contrast, the process of hiring new personnel probably differs for different Dutch organizations, because
different organizations execute it differently, depending on their size, whether they have it outsourced. Therefore,
we say that the level of harmonization for these hiring processes is low.
Use this assumption to answer the following questions. Press continue to proceed.
Question #7
To what extent do you agree with the following statements?
If processes are more harmonized…
Completely
disagree
Mostly
disagree
Neither
agree/disagree Mostly agree
Completely
agree
…the execution of the
business process is strongly
standardized.
…they can easily be learned
via documentation and
trainings.
…the process-cycle is well
1 2 3 4 5 6 7 8 9 10
Continue Back
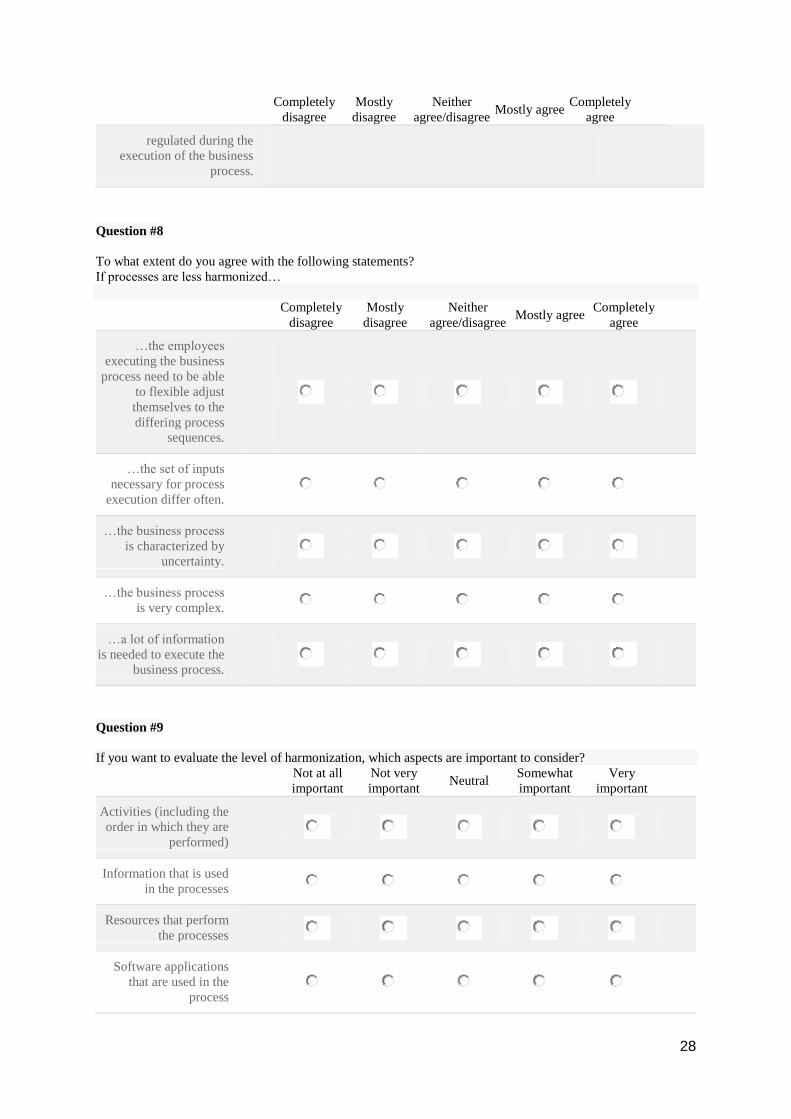
28
Completely
disagree
Mostly
disagree
Neither
agree/disagree Mostly agree
Completely
agree
regulated during the
execution of the business
process.
Question #8
To what extent do you agree with the following statements?
If processes are less harmonized…
Completely
disagree
Mostly
disagree
Neither
agree/disagree Mostly agree
Completely
agree
…the employees
executing the business
process need to be able
to flexible adjust
themselves to the
differing process
sequences.
…the set of inputs
necessary for process
execution differ often.
…the business process
is characterized by
uncertainty.
…the business process
is very complex.
…a lot of information
is needed to execute the
business process.
Question #9
If you want to evaluate the level of harmonization, which aspects are important to consider?
Not at all
important
Not very
important Neutral
Somewhat
important
Very
important
Activities (including the
order in which they are
performed)
Information that is used
in the processes
Resources that perform
the processes
Software applications
that are used in the
process

29
Are there any other aspects that must be considered?
Question #10
To what extent do you agree with the following statements?
The level of harmonization of "information" can be quantified using the following measures:
Completely
disagree
Mostly
disagree
Neither
agree/disagree Mostly agree
Completely
agree
The number of
different documents
used as input for the
same process
The number of
different output reports
What other measures can be used to quantify the level of harmonization of "information"?
Question #11
To what extent do you agree with the following statements?
The level of harmonization of "activities" can be quantified using the following measure:
Completely
disagree
Mostly
disagree
Neither
agree/disagree Mostly agree
Completely
agree
The percentage of
common activities in
the process
What other measures can be used to quantify the level of harmonization of "activities"(including the order in
which they are performed)?
Question #12
To what extent do you agree with the following statements?
The level of harmonization of "software applications" can be quantified using the following measures:
Completely
disagree
Mostly
disagree
Neither
agree/disagree Mostly agree
Completely
agree
The number of
different software
applications in used in
the process
The number of
different supplier's
paid for the software
applications

30
Completely
disagree
Mostly
disagree
Neither
agree/disagree Mostly agree
Completely
agree
The amount of money
paid for the software
applications
What other measures can be used to quantify the level of harmonization of "software applications”?
Question #13
To what extent do you agree with the following statements?
The level of harmonization of "resources" that perform the processes can be quantified using the following
measures:
Completely
disagree
Mostly
disagree
Neither
agree/disagree Mostly agree
Completely
agree
The percentage of
common roles in the
process.
The number of
different roles
executing the same
activity.
What other measures can be used to quantify the level of harmonization of "resources”?
Question #14
In the last question of this survey we want to know, if you engage in a harmonization project and after the
project your processes are more harmonized. Which elements (of your processes or your organization as a
whole) do you expect to have changed? For example, the number of common activities increases.
Thank you for participating in this survey!
Please indicate your e-mail address, if you would like to receive a summary report of the findings of this
research:

31
Appendix B
Questionnaire for pre-testing the survey instrument
Survey
questions
Pre-test questions
For questions
#1,2,3 and 4
1. When we asked questions about your experience in harmonization projects:
1.1. Did you have a particular time period in mind? (i.e. in the last five years)
1.2. How well do you remember this information?
For question #5 2. When we asked to evaluate your knowledge about process harmonization, how did you
estimate your answer?
For question #6 3. What do the terms ‘process harmonization’ and ‘process standardization’ mean to you?
For question #7 4. What do the terms ‘level of similarity’ and ‘level of compatibility’ mean to you?
5. How sure of your answer are you?
6. Were you able to find your first answer to the question from the response option shown?
For question #8
and 9
7. What does the term ‘standard’ mean to you?
8. How sure of your answer are you?
9. Were you able to find your first answer to the question from the response option shown?
For question
#10
10. How did you get your answer?
11. How sure of your answer are you?
12. How did you feel about answering this question?
General 13. Do you have comments about the wording or how some specific question is described?
Please provide any additional comments to improve this survey instrument.
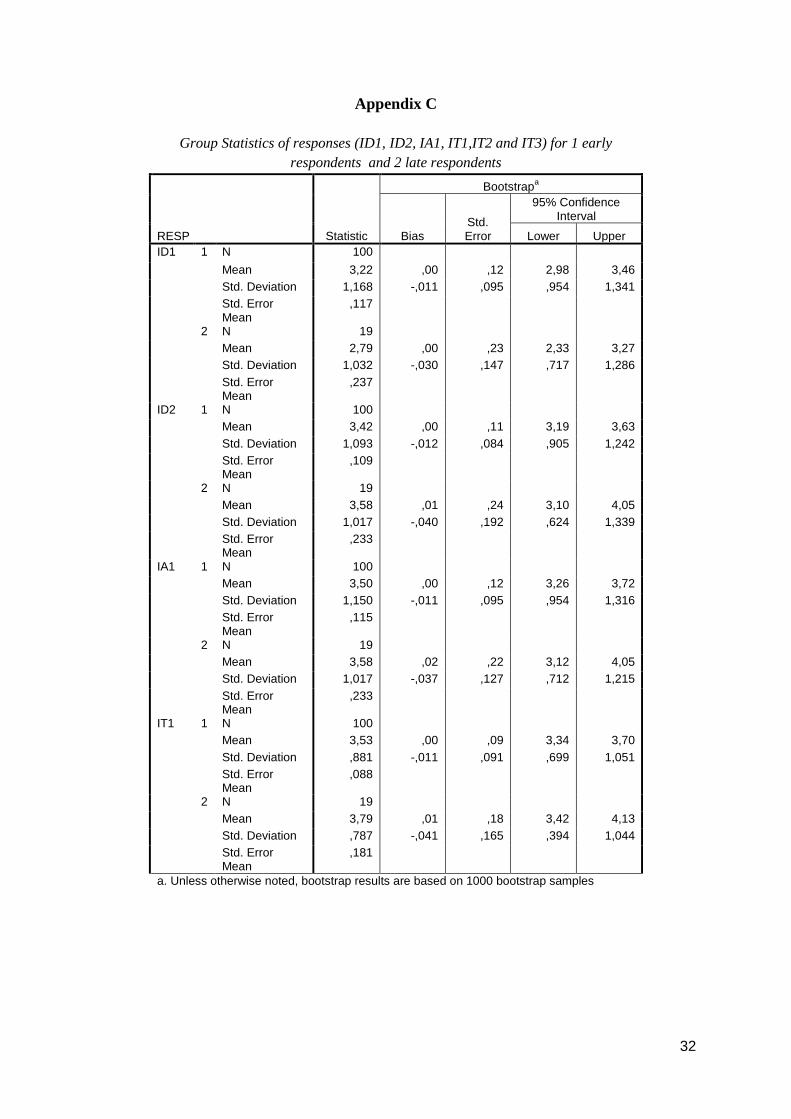
32
Appendix C
Group Statistics of responses (ID1, ID2, IA1, IT1,IT2 and IT3) for 1 early
respondents and 2 late respondents
RESP Statistic
Bootstrapa
Bias Std. Error
95% Confidence Interval
Lower Upper
ID1 1 N 100
Mean 3,22 ,00 ,12 2,98 3,46
Std. Deviation 1,168 -,011 ,095 ,954 1,341
Std. Error Mean
,117
2 N 19
Mean 2,79 ,00 ,23 2,33 3,27
Std. Deviation 1,032 -,030 ,147 ,717 1,286
Std. Error Mean
,237
ID2 1 N 100
Mean 3,42 ,00 ,11 3,19 3,63
Std. Deviation 1,093 -,012 ,084 ,905 1,242
Std. Error Mean
,109
2 N 19
Mean 3,58 ,01 ,24 3,10 4,05
Std. Deviation 1,017 -,040 ,192 ,624 1,339
Std. Error Mean
,233
IA1 1 N 100
Mean 3,50 ,00 ,12 3,26 3,72
Std. Deviation 1,150 -,011 ,095 ,954 1,316
Std. Error Mean
,115
2 N 19
Mean 3,58 ,02 ,22 3,12 4,05
Std. Deviation 1,017 -,037 ,127 ,712 1,215
Std. Error Mean
,233
IT1 1 N 100
Mean 3,53 ,00 ,09 3,34 3,70
Std. Deviation ,881 -,011 ,091 ,699 1,051
Std. Error Mean
,088
2 N 19
Mean 3,79 ,01 ,18 3,42 4,13
Std. Deviation ,787 -,041 ,165 ,394 1,044
Std. Error Mean
,181
a. Unless otherwise noted, bootstrap results are based on 1000 bootstrap samples
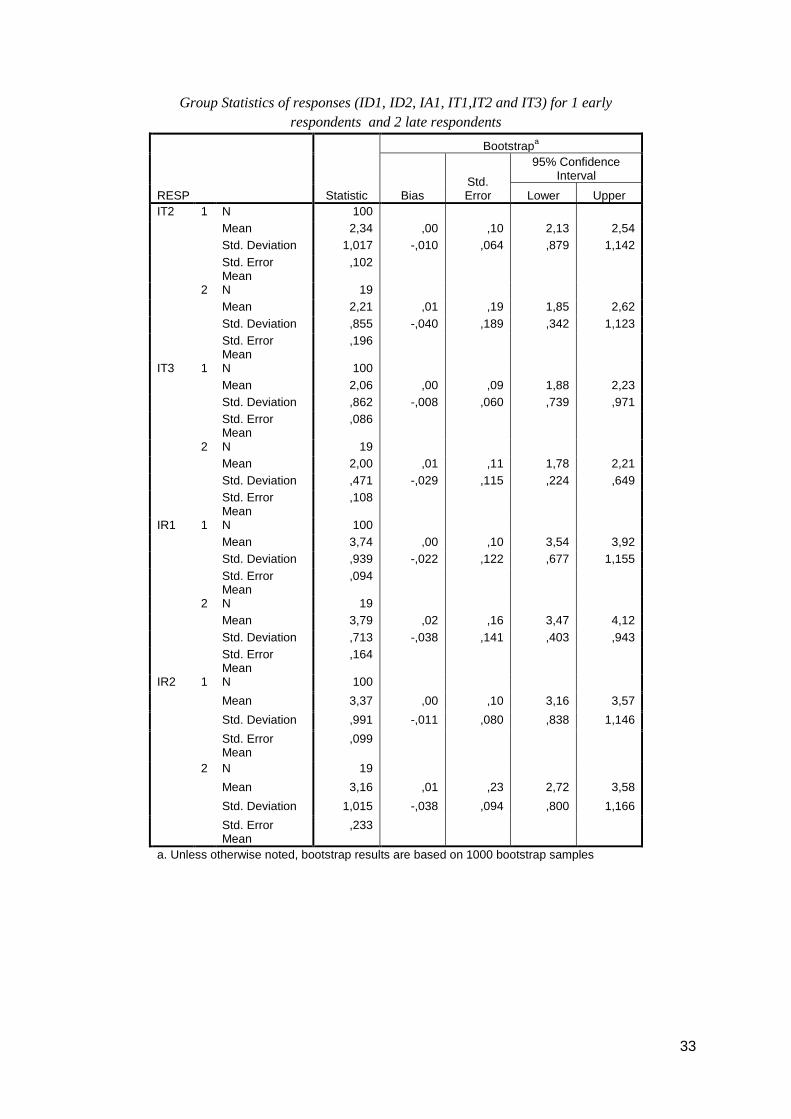
33
Group Statistics of responses (ID1, ID2, IA1, IT1,IT2 and IT3) for 1 early
respondents and 2 late respondents
RESP Statistic
Bootstrapa
Bias Std. Error
95% Confidence Interval
Lower Upper
IT2 1 N 100
Mean 2,34 ,00 ,10 2,13 2,54
Std. Deviation 1,017 -,010 ,064 ,879 1,142
Std. Error Mean
,102
2 N 19
Mean 2,21 ,01 ,19 1,85 2,62
Std. Deviation ,855 -,040 ,189 ,342 1,123
Std. Error Mean
,196
IT3 1 N 100
Mean 2,06 ,00 ,09 1,88 2,23
Std. Deviation ,862 -,008 ,060 ,739 ,971
Std. Error Mean
,086
2 N 19
Mean 2,00 ,01 ,11 1,78 2,21
Std. Deviation ,471 -,029 ,115 ,224 ,649
Std. Error Mean
,108
IR1 1 N 100
Mean 3,74 ,00 ,10 3,54 3,92
Std. Deviation ,939 -,022 ,122 ,677 1,155
Std. Error Mean
,094
2 N 19
Mean 3,79 ,02 ,16 3,47 4,12
Std. Deviation ,713 -,038 ,141 ,403 ,943
Std. Error Mean
,164
IR2 1 N 100
Mean 3,37 ,00 ,10 3,16 3,57
Std. Deviation ,991 -,011 ,080 ,838 1,146
Std. Error Mean
,099
2 N 19
Mean 3,16 ,01 ,23 2,72 3,58
Std. Deviation 1,015 -,038 ,094 ,800 1,166
Std. Error Mean
,233
a. Unless otherwise noted, bootstrap results are based on 1000 bootstrap samples
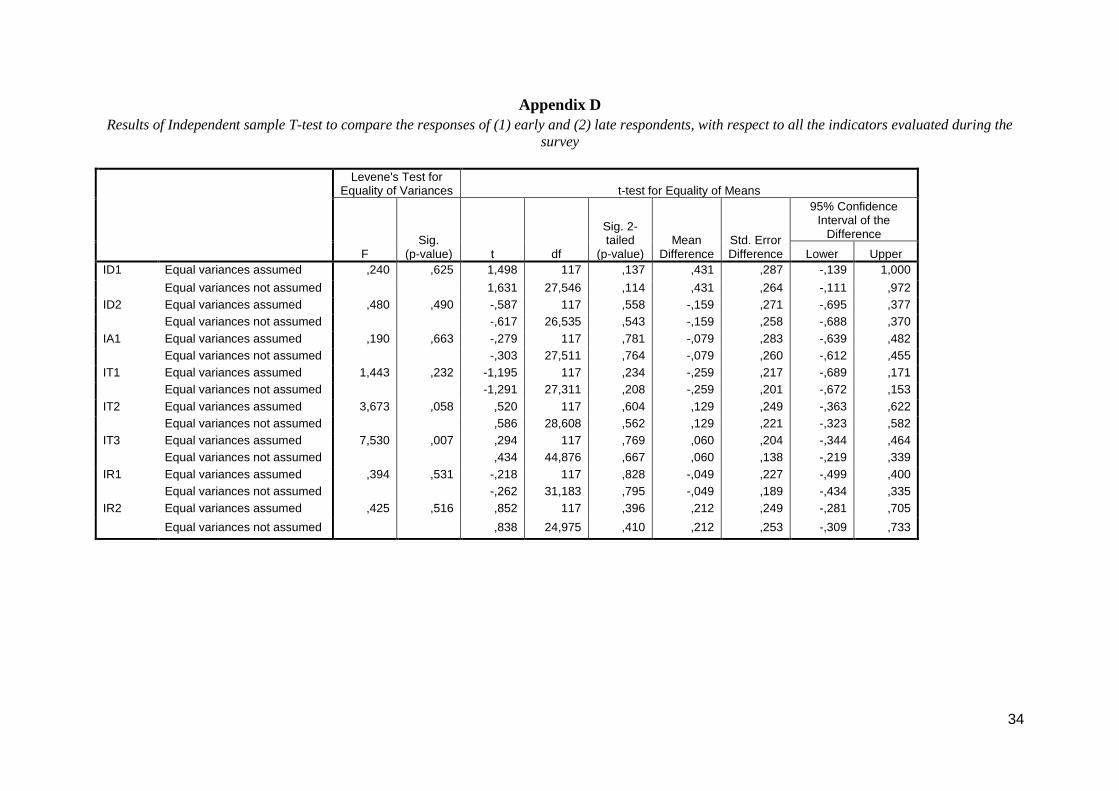
34
Appendix D
Results of Independent sample T-test to compare the responses of (1) early and (2) late respondents, with respect to all the indicators evaluated during the
survey
Levene's Test for Equality of Variances t-test for Equality of Means
F Sig.
(p-value) t df
Sig. 2-tailed
(p-value) Mean
Difference Std. Error Difference
95% Confidence Interval of the
Difference
Lower Upper
ID1 Equal variances assumed ,240 ,625 1,498 117 ,137 ,431 ,287 -,139 1,000
Equal variances not assumed 1,631 27,546 ,114 ,431 ,264 -,111 ,972
ID2 Equal variances assumed ,480 ,490 -,587 117 ,558 -,159 ,271 -,695 ,377
Equal variances not assumed -,617 26,535 ,543 -,159 ,258 -,688 ,370
IA1 Equal variances assumed ,190 ,663 -,279 117 ,781 -,079 ,283 -,639 ,482
Equal variances not assumed -,303 27,511 ,764 -,079 ,260 -,612 ,455
IT1 Equal variances assumed 1,443 ,232 -1,195 117 ,234 -,259 ,217 -,689 ,171
Equal variances not assumed -1,291 27,311 ,208 -,259 ,201 -,672 ,153
IT2 Equal variances assumed 3,673 ,058 ,520 117 ,604 ,129 ,249 -,363 ,622
Equal variances not assumed ,586 28,608 ,562 ,129 ,221 -,323 ,582
IT3 Equal variances assumed 7,530 ,007 ,294 117 ,769 ,060 ,204 -,344 ,464
Equal variances not assumed ,434 44,876 ,667 ,060 ,138 -,219 ,339
IR1 Equal variances assumed ,394 ,531 -,218 117 ,828 -,049 ,227 -,499 ,400
Equal variances not assumed -,262 31,183 ,795 -,049 ,189 -,434 ,335
IR2 Equal variances assumed ,425 ,516 ,852 117 ,396 ,212 ,249 -,281 ,705
Equal variances not assumed ,838 24,975 ,410 ,212 ,253 -,309 ,733
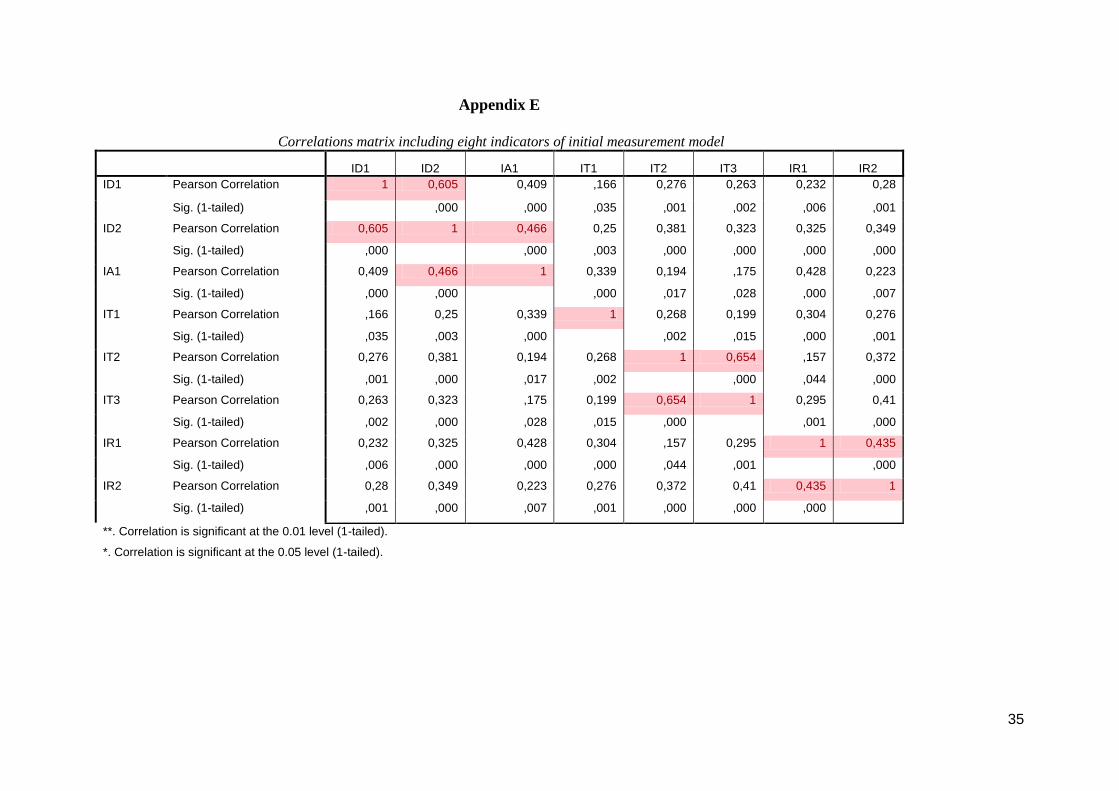
35
Appendix E
Correlations matrix including eight indicators of initial measurement model
ID1 ID2 IA1 IT1 IT2 IT3 IR1 IR2
ID1 Pearson Correlation 1 0,605 0,409 ,166 0,276 0,263 0,232 0,28
Sig. (1-tailed) ,000 ,000 ,035 ,001 ,002 ,006 ,001
ID2 Pearson Correlation 0,605 1 0,466 0,25 0,381 0,323 0,325 0,349
Sig. (1-tailed) ,000 ,000 ,003 ,000 ,000 ,000 ,000
IA1 Pearson Correlation 0,409 0,466 1 0,339 0,194 ,175 0,428 0,223
Sig. (1-tailed) ,000 ,000 ,000 ,017 ,028 ,000 ,007
IT1 Pearson Correlation ,166 0,25 0,339 1 0,268 0,199 0,304 0,276
Sig. (1-tailed) ,035 ,003 ,000 ,002 ,015 ,000 ,001
IT2 Pearson Correlation 0,276 0,381 0,194 0,268 1 0,654 ,157 0,372
Sig. (1-tailed) ,001 ,000 ,017 ,002 ,000 ,044 ,000
IT3 Pearson Correlation 0,263 0,323 ,175 0,199 0,654 1 0,295 0,41
Sig. (1-tailed) ,002 ,000 ,028 ,015 ,000 ,001 ,000
IR1 Pearson Correlation 0,232 0,325 0,428 0,304 ,157 0,295 1 0,435
Sig. (1-tailed) ,006 ,000 ,000 ,000 ,044 ,001 ,000
IR2 Pearson Correlation 0,28 0,349 0,223 0,276 0,372 0,41 0,435 1
Sig. (1-tailed) ,001 ,000 ,007 ,001 ,000 ,000 ,000
**. Correlation is significant at the 0.01 level (1-tailed).
*. Correlation is significant at the 0.05 level (1-tailed).
Working Papers Beta 2009 - 2013 nr. Year Title Author(s)
415 414 413 412 411 410 409 408 407 406 405 404 403
2013 2013 2013 2013 2013 2013 2013 2013 2013 2013 2013 2013 2013
The development of measures of process harmonization BASE/X. Business Agility through Cross- Organizational Service Engineering The Time-Dependent Vehicle Routing Problem with Soft Time Windows and Stochastic Travel Times Clearing the Sky - Understanding SLA Elements in Cloud Computing Approximations for the waiting time distribution In an M/G/c priority queue To co-locate or not? Location decisions and logistics concentration areas The Time-Dependent Pollution-Routing Problem Scheduling the scheduling task: A time Management perspective on scheduling Clustering Clinical Departments for Wards to Achieve a Prespecified Blocking Probability MyPHRMachines: Personal Health Desktops in the Cloud Maximising the Value of Supply Chain Finance Reaching 50 million nanostores: retail distribution in emerging megacities A Vehicle Routing Problem with Flexible Time Windows
Heidi L. Romero, Remco M. Dijkman, Paul W.P.J. Grefen, Arjan van Weele Paul Grefen, Egon Lüftenegger, Eric van der Linden, Caren Weisleder Duygu Tas, Nico Dellaert, Tom van Woensel, Ton de Kok Marco Comuzzi, Guus Jacobs, Paul Grefen A. Al Hanbali, E.M. Alvarez, M.C. van der van der Heijden Frank P. van den Heuvel, Karel H. van Donselaar, Rob A.C.M. Broekmeulen, Jan C. Fransoo, Peter W. de Langen Anna Franceschetti, Dorothée Honhon, Tom van Woensel, Tolga Bektas, Gilbert Laporte. J.A. Larco, V. Wiers, J. Fransoo J. Theresia van Essen, Mark van Houdenhoven, Johann L. Hurink Pieter Van Gorp, Marco Comuzzi Kasper van der Vliet, Matthew J. Reindorp, Jan C. Fransoo Edgar E. Blanco, Jan C. Fransoo Duygu Tas, Ola Jabali, Tom van Woensel

402 401 400 399 398 397 396 395 394 393 392 391
2013 2012 2012 2012 2012 2012 2012 2012 2012 2012 2012 2012
The Service Dominant Business Model: A Service Focused Conceptualization Relationship between freight accessibility and Logistics employment in US counties A Condition-Based Maintenance Policy for Multi-Component Systems with a High Maintenance Setup Cost A flexible iterative improvement heuristic to Support creation of feasible shift rosters in Self-rostering Scheduled Service Network Design with Synchronization and Transshipment Constraints For Intermodal Container Transportation Networks Destocking, the bullwhip effect, and the credit Crisis: empirical modeling of supply chain Dynamics Vehicle routing with restricted loading capacities Service differentiation through selective lateral transshipments A Generalized Simulation Model of an Integrated Emergency Post Business Process Technology and the Cloud: Defining a Business Process Cloud Platform Vehicle Routing with Soft Time Windows and Stochastic Travel Times: A Column Generation And Branch-and-Price Solution Approach Improve OR-Schedule to Reduce Number of Required Beds
Egon Lüftenegger, Marco Comuzzi, Paul Grefen, Caren Weisleder Frank P. van den Heuvel, Liliana Rivera, Karel H. van Donselaar, Ad de Jong, Yossi Sheffi, Peter W. de Langen, Jan C. Fransoo Qiushi Zhu, Hao Peng, Geert-Jan van Houtum E. van der Veen, J.L. Hurink, J.M.J. Schutten, S.T. Uijland K. Sharypova, T.G. Crainic, T. van Woensel, J.C. Fransoo Maximiliano Udenio, Jan C. Fransoo, Robert Peels J. Gromicho, J.J. van Hoorn, A.L. Kok J.M.J. Schutten E.M. Alvarez, M.C. van der Heijden, I.M.H. Vliegen, W.H.M. Zijm Martijn Mes, Manon Bruens Vasil Stoitsev, Paul Grefen D. Tas, M. Gendreau, N. Dellaert, T. van Woensel, A.G. de Kok J.T. v. Essen, J.M. Bosch, E.W. Hans, M. v. Houdenhoven, J.L. Hurink
390 389 388 387 386 385 384 383 382 381 380 379 378
2012 2012 2012 2012 2012 2012 2012 2012 2012 2012 2012 2012 2012
How does development lead time affect performance over the ramp-up lifecycle? Evidence from the consumer electronics industry The Impact of Product Complexity on Ramp- Up Performance Co-location synergies: specialized versus diverse logistics concentration areas Proximity matters: Synergies through co-location of logistics establishments Spatial concentration and location dynamics in logistics:the case of a Dutch province FNet: An Index for Advanced Business Process Querying Defining Various Pathway Terms The Service Dominant Strategy Canvas: Defining and Visualizing a Service Dominant Strategy through the Traditional Strategic Lens A Stochastic Variable Size Bin Packing Problem With Time Constraints Coordination and Analysis of Barge Container Hinterland Networks Proximity matters: Synergies through co-location of logistics establishments A literature review in process harmonization: a conceptual framework
Andres Pufall, Jan C. Fransoo, Ad de Jong Andreas Pufall, Jan C. Fransoo, Ad de Jong, Ton de Kok Frank P.v.d. Heuvel, Peter W.de Langen, Karel H. v. Donselaar, Jan C. Fransoo Frank P.v.d. Heuvel, Peter W.de Langen, Karel H. v.Donselaar, Jan C. Fransoo Frank P. v.d.Heuvel, Peter W.de Langen, Karel H.v. Donselaar, Jan C. Fransoo Zhiqiang Yan, Remco Dijkman, Paul Grefen W.R. Dalinghaus, P.M.E. Van Gorp Egon Lüftenegger, Paul Grefen, Caren Weisleder Stefano Fazi, Tom van Woensel, Jan C. Fransoo K. Sharypova, T. van Woensel, J.C. Fransoo Frank P. van den Heuvel, Peter W. de Langen, Karel H. van Donselaar, Jan C. Fransoo Heidi Romero, Remco Dijkman, Paul Grefen, Arjan van Weele S.W.A. Haneya, J.M.J. Schutten, P.C. Schuur, W.H.M. Zijm
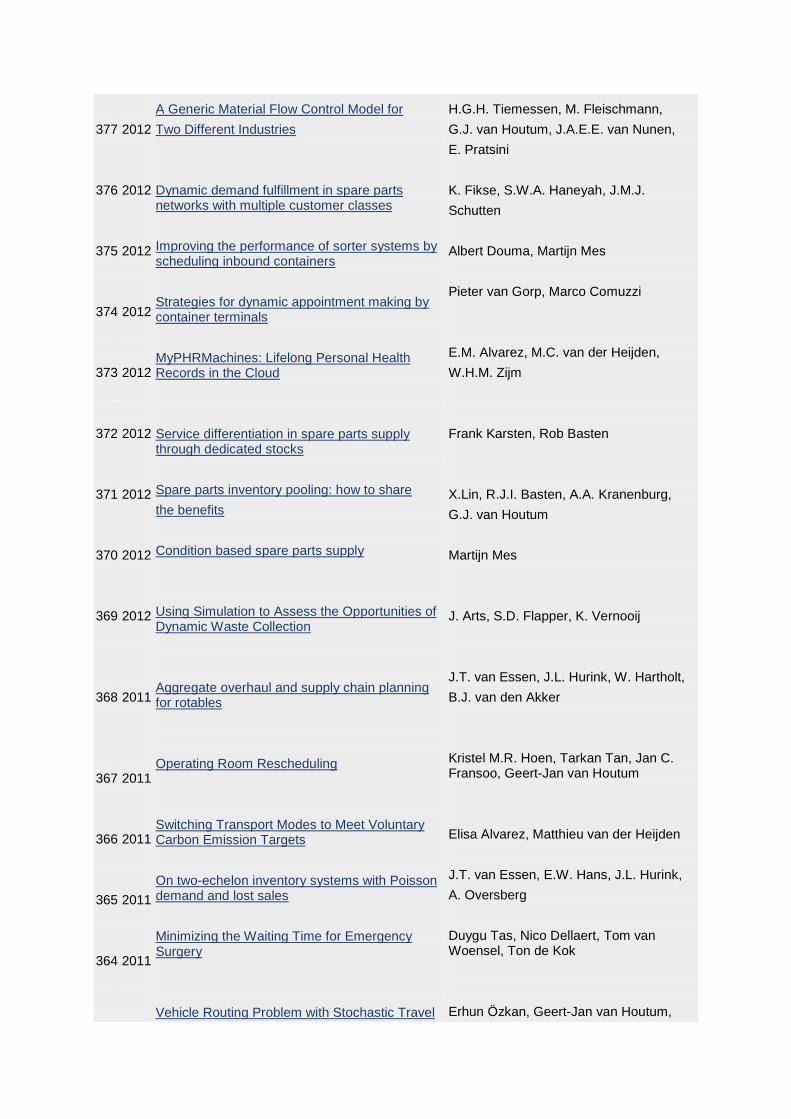
377 376 375 374 373 372 371 370 369 368 367 366 365 364
2012 2012 2012 2012 2012 2012 2012 2012 2012 2011 2011 2011 2011 2011
A Generic Material Flow Control Model for Two Different Industries Dynamic demand fulfillment in spare parts networks with multiple customer classes Improving the performance of sorter systems by scheduling inbound containers Strategies for dynamic appointment making by container terminals MyPHRMachines: Lifelong Personal Health Records in the Cloud Service differentiation in spare parts supply through dedicated stocks Spare parts inventory pooling: how to share the benefits Condition based spare parts supply Using Simulation to Assess the Opportunities of Dynamic Waste Collection Aggregate overhaul and supply chain planning for rotables Operating Room Rescheduling Switching Transport Modes to Meet Voluntary Carbon Emission Targets On two-echelon inventory systems with Poisson demand and lost sales Minimizing the Waiting Time for Emergency Surgery Vehicle Routing Problem with Stochastic Travel
H.G.H. Tiemessen, M. Fleischmann, G.J. van Houtum, J.A.E.E. van Nunen, E. Pratsini K. Fikse, S.W.A. Haneyah, J.M.J. Schutten Albert Douma, Martijn Mes Pieter van Gorp, Marco Comuzzi E.M. Alvarez, M.C. van der Heijden, W.H.M. Zijm Frank Karsten, Rob Basten X.Lin, R.J.I. Basten, A.A. Kranenburg, G.J. van Houtum Martijn Mes J. Arts, S.D. Flapper, K. Vernooij J.T. van Essen, J.L. Hurink, W. Hartholt, B.J. van den Akker Kristel M.R. Hoen, Tarkan Tan, Jan C. Fransoo, Geert-Jan van Houtum Elisa Alvarez, Matthieu van der Heijden J.T. van Essen, E.W. Hans, J.L. Hurink, A. Oversberg Duygu Tas, Nico Dellaert, Tom van Woensel, Ton de Kok Erhun Özkan, Geert-Jan van Houtum,

363 362 361 360 359 358 357 356 355 354 353 352 351 350 349
2011 2011 2011 2011 2011 2011 2011 2011 2011 2011 2011 2011 2011 2011 2011
Times Including Soft Time Windows and Service Costs A New Approximate Evaluation Method for Two-Echelon Inventory Systems with Emergency Shipments Approximating Multi-Objective Time-Dependent Optimization Problems Branch and Cut and Price for the Time Dependent Vehicle Routing Problem with Time Window Analysis of an Assemble-to-Order System with Different Review Periods Interval Availability Analysis of a Two-Echelon, Multi-Item System Carbon-Optimal and Carbon-Neutral Supply Chains Generic Planning and Control of Automated Material Handling Systems: Practical Requirements Versus Existing Theory Last time buy decisions for products sold under warranty Spatial concentration and location dynamics in logistics: the case of a Dutch provence Identification of Employment Concentration Areas BOMN 2.0 Execution Semantics Formalized as Graph Rewrite Rules: extended version Resource pooling and cost allocation among independent service providers A Framework for Business Innovation Directions The Road to a Business Process Architecture: An Overview of Approaches and their Use Effect of carbon emission regulations on transport mode selection under stochastic
Yasemin Serin Said Dabia, El-Ghazali Talbi, Tom Van Woensel, Ton de Kok Said Dabia, Stefan Röpke, Tom Van Woensel, Ton de Kok A.G. Karaarslan, G.P. Kiesmüller, A.G. de Kok Ahmad Al Hanbali, Matthieu van der Heijden Felipe Caro, Charles J. Corbett, Tarkan Tan, Rob Zuidwijk Sameh Haneyah, Henk Zijm, Marco Schutten, Peter Schuur M. van der Heijden, B. Iskandar Frank P. van den Heuvel, Peter W. de Langen, Karel H. van Donselaar, Jan C. Fransoo Frank P. van den Heuvel, Peter W. de Langen, Karel H. van Donselaar, Jan C. Fransoo Pieter van Gorp, Remco Dijkman Frank Karsten, Marco Slikker, Geert-Jan van Houtum E. Lüftenegger, S. Angelov, P. Grefen Remco Dijkman, Irene Vanderfeesten, Hajo A. Reijers K.M.R. Hoen, T. Tan, J.C. Fransoo G.J. van Houtum
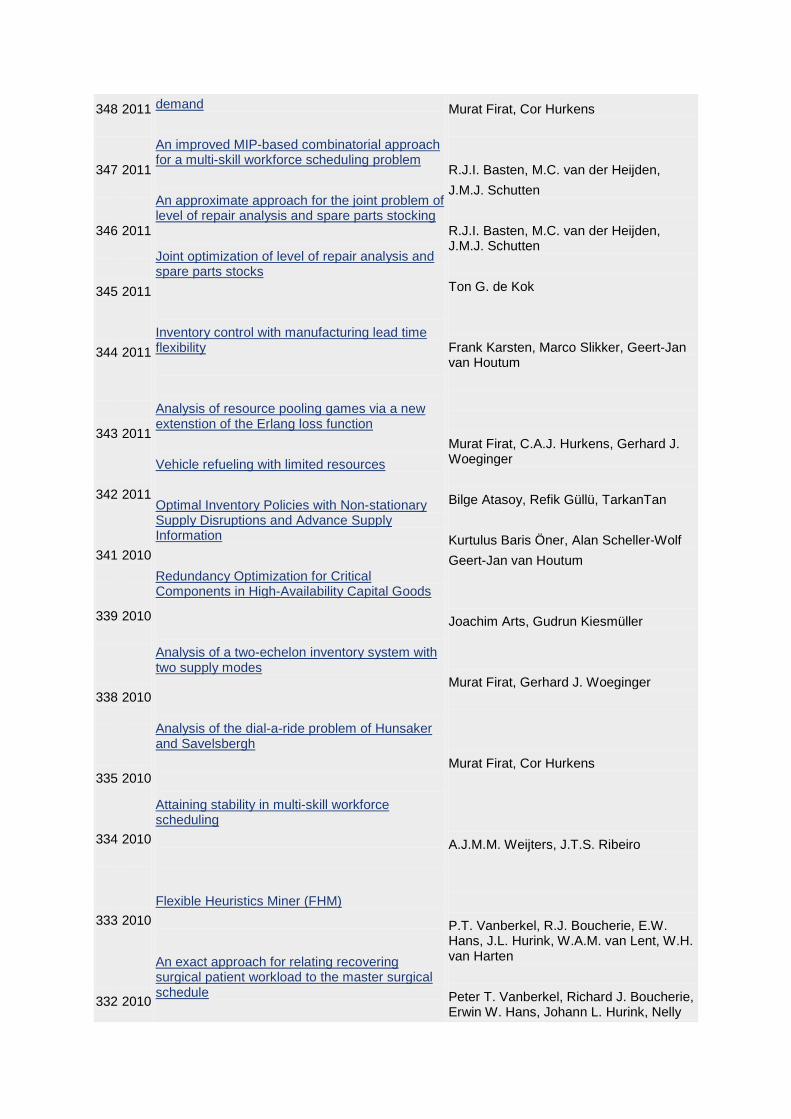
348 347 346 345 344 343 342 341 339 338 335 334 333 332
2011 2011 2011 2011 2011 2011 2011 2010 2010 2010 2010 2010 2010 2010
demand An improved MIP-based combinatorial approach for a multi-skill workforce scheduling problem An approximate approach for the joint problem of level of repair analysis and spare parts stocking Joint optimization of level of repair analysis and spare parts stocks Inventory control with manufacturing lead time flexibility Analysis of resource pooling games via a new extenstion of the Erlang loss function Vehicle refueling with limited resources Optimal Inventory Policies with Non-stationary Supply Disruptions and Advance Supply Information Redundancy Optimization for Critical Components in High-Availability Capital Goods Analysis of a two-echelon inventory system with two supply modes Analysis of the dial-a-ride problem of Hunsaker and Savelsbergh Attaining stability in multi-skill workforce scheduling Flexible Heuristics Miner (FHM) An exact approach for relating recovering surgical patient workload to the master surgical schedule
Murat Firat, Cor Hurkens R.J.I. Basten, M.C. van der Heijden, J.M.J. Schutten R.J.I. Basten, M.C. van der Heijden, J.M.J. Schutten Ton G. de Kok Frank Karsten, Marco Slikker, Geert-Jan van Houtum Murat Firat, C.A.J. Hurkens, Gerhard J. Woeginger Bilge Atasoy, Refik Güllü, TarkanTan Kurtulus Baris Öner, Alan Scheller-Wolf Geert-Jan van Houtum Joachim Arts, Gudrun Kiesmüller Murat Firat, Gerhard J. Woeginger Murat Firat, Cor Hurkens A.J.M.M. Weijters, J.T.S. Ribeiro P.T. Vanberkel, R.J. Boucherie, E.W. Hans, J.L. Hurink, W.A.M. van Lent, W.H. van Harten Peter T. Vanberkel, Richard J. Boucherie, Erwin W. Hans, Johann L. Hurink, Nelly
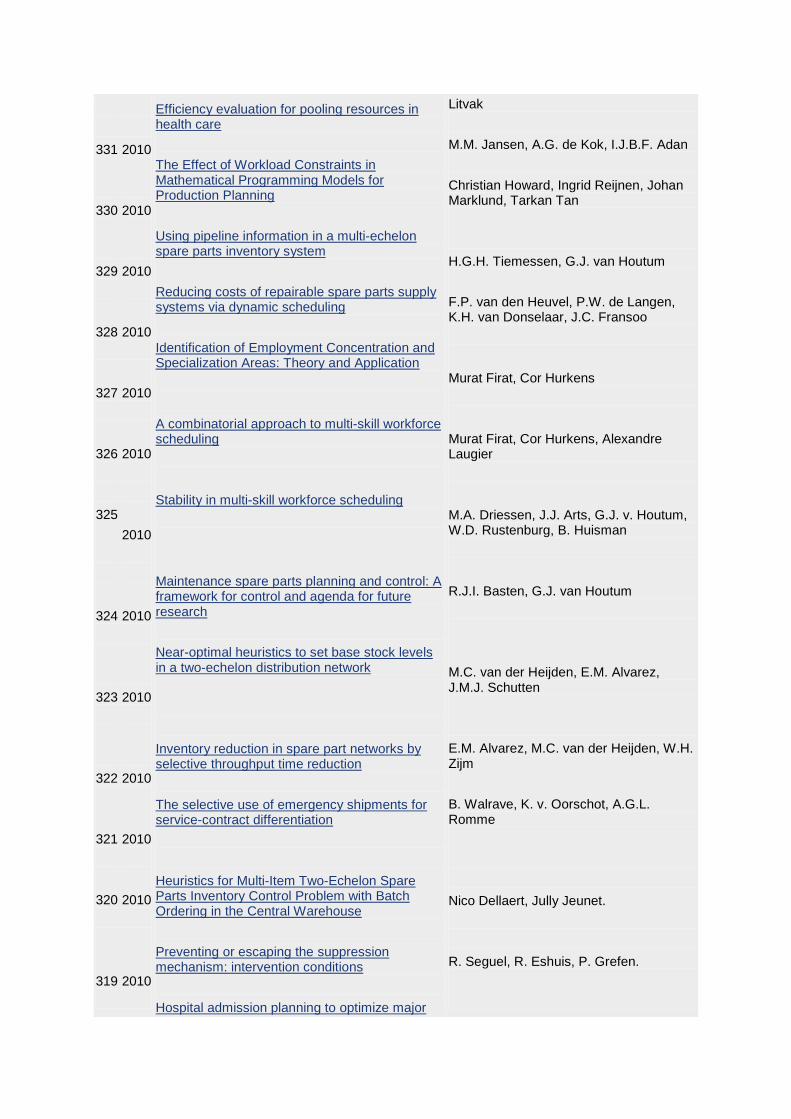
331 330 329 328 327 326 325 324 323 322 321 320 319
2010 2010 2010 2010 2010 2010 2010 2010 2010 2010 2010 2010 2010
Efficiency evaluation for pooling resources in health care The Effect of Workload Constraints in Mathematical Programming Models for Production Planning Using pipeline information in a multi-echelon spare parts inventory system Reducing costs of repairable spare parts supply systems via dynamic scheduling Identification of Employment Concentration and Specialization Areas: Theory and Application A combinatorial approach to multi-skill workforce scheduling Stability in multi-skill workforce scheduling Maintenance spare parts planning and control: A framework for control and agenda for future research Near-optimal heuristics to set base stock levels in a two-echelon distribution network Inventory reduction in spare part networks by selective throughput time reduction The selective use of emergency shipments for service-contract differentiation Heuristics for Multi-Item Two-Echelon Spare Parts Inventory Control Problem with Batch Ordering in the Central Warehouse Preventing or escaping the suppression mechanism: intervention conditions Hospital admission planning to optimize major
Litvak M.M. Jansen, A.G. de Kok, I.J.B.F. Adan Christian Howard, Ingrid Reijnen, Johan Marklund, Tarkan Tan H.G.H. Tiemessen, G.J. van Houtum F.P. van den Heuvel, P.W. de Langen, K.H. van Donselaar, J.C. Fransoo Murat Firat, Cor Hurkens Murat Firat, Cor Hurkens, Alexandre Laugier M.A. Driessen, J.J. Arts, G.J. v. Houtum, W.D. Rustenburg, B. Huisman R.J.I. Basten, G.J. van Houtum M.C. van der Heijden, E.M. Alvarez, J.M.J. Schutten E.M. Alvarez, M.C. van der Heijden, W.H. Zijm B. Walrave, K. v. Oorschot, A.G.L. Romme Nico Dellaert, Jully Jeunet. R. Seguel, R. Eshuis, P. Grefen.

318 317 316 315 314 313
2010 2010 2010 2010 2010 2010
resources utilization under uncertainty Minimal Protocol Adaptors for Interacting Services Teaching Retail Operations in Business and Engineering Schools Design for Availability: Creating Value for Manufacturers and Customers Transforming Process Models: executable rewrite rules versus a formalized Java program Getting trapped in the suppression of exploration: A simulation model A Dynamic Programming Approach to Multi-Objective Time-Dependent Capacitated Single Vehicle Routing Problems with Time Windows
Tom Van Woensel, Marshall L. Fisher, Jan C. Fransoo. Lydie P.M. Smets, Geert-Jan van Houtum, Fred Langerak. Pieter van Gorp, Rik Eshuis. Bob Walrave, Kim E. van Oorschot, A. Georges L. Romme S. Dabia, T. van Woensel, A.G. de Kok
312 2010 Tales of a So(u)rcerer: Optimal Sourcing Decisions Under Alternative Capacitated Suppliers and General Cost Structures
Osman Alp, Tarkan Tan
311 2010 In-store replenishment procedures for perishable inventory in a retail environment with handling costs and storage constraints
R.A.C.M. Broekmeulen, C.H.M. Bakx
310 2010 The state of the art of innovation-driven business models in the financial services industry
E. Lüftenegger, S. Angelov, E. van der Linden, P. Grefen
309 2010 Design of Complex Architectures Using a Three Dimension Approach: the CrossWork Case R. Seguel, P. Grefen, R. Eshuis
308 2010 Effect of carbon emission regulations on transport mode selection in supply chains
K.M.R. Hoen, T. Tan, J.C. Fransoo, G.J. van Houtum
307 2010 Interaction between intelligent agent strategies for real-time transportation planning
Martijn Mes, Matthieu van der Heijden, Peter Schuur
306 2010 Internal Slackening Scoring Methods Marco Slikker, Peter Borm, René van den Brink
305 2010 Vehicle Routing with Traffic Congestion and Drivers' Driving and Working Rules
A.L. Kok, E.W. Hans, J.M.J. Schutten, W.H.M. Zijm
304 2010 Practical extensions to the level of repair analysis
R.J.I. Basten, M.C. van der Heijden, J.M.J. Schutten
303 2010 Ocean Container Transport: An Underestimated and Critical Link in Global Supply Chain Performance
Jan C. Fransoo, Chung-Yee Lee
302 2010 Capacity reservation and utilization for a manufacturer with uncertain capacity and demand
Y. Boulaksil; J.C. Fransoo; T. Tan
300 2009 Spare parts inventory pooling games F.J.P. Karsten; M. Slikker; G.J. van Houtum
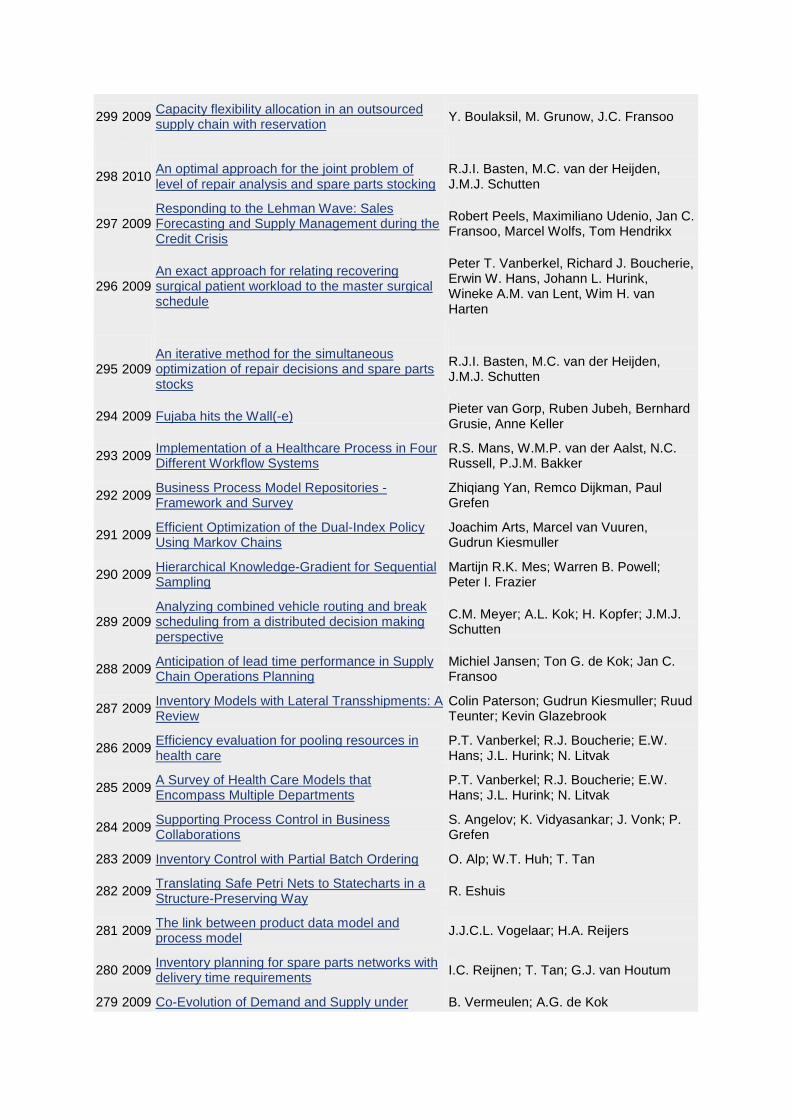
299 2009 Capacity flexibility allocation in an outsourced supply chain with reservation Y. Boulaksil, M. Grunow, J.C. Fransoo
298
2010
An optimal approach for the joint problem of level of repair analysis and spare parts stocking
R.J.I. Basten, M.C. van der Heijden, J.M.J. Schutten
297 2009 Responding to the Lehman Wave: Sales Forecasting and Supply Management during the Credit Crisis
Robert Peels, Maximiliano Udenio, Jan C. Fransoo, Marcel Wolfs, Tom Hendrikx
296 2009 An exact approach for relating recovering surgical patient workload to the master surgical schedule
Peter T. Vanberkel, Richard J. Boucherie, Erwin W. Hans, Johann L. Hurink, Wineke A.M. van Lent, Wim H. van Harten
295
2009
An iterative method for the simultaneous optimization of repair decisions and spare parts stocks
R.J.I. Basten, M.C. van der Heijden, J.M.J. Schutten
294 2009 Fujaba hits the Wall(-e) Pieter van Gorp, Ruben Jubeh, Bernhard Grusie, Anne Keller
293 2009 Implementation of a Healthcare Process in Four Different Workflow Systems
R.S. Mans, W.M.P. van der Aalst, N.C. Russell, P.J.M. Bakker
292 2009 Business Process Model Repositories - Framework and Survey
Zhiqiang Yan, Remco Dijkman, Paul Grefen
291 2009 Efficient Optimization of the Dual-Index Policy Using Markov Chains
Joachim Arts, Marcel van Vuuren, Gudrun Kiesmuller
290 2009 Hierarchical Knowledge-Gradient for Sequential Sampling
Martijn R.K. Mes; Warren B. Powell; Peter I. Frazier
289 2009 Analyzing combined vehicle routing and break scheduling from a distributed decision making perspective
C.M. Meyer; A.L. Kok; H. Kopfer; J.M.J. Schutten
288 2009 Anticipation of lead time performance in Supply Chain Operations Planning
Michiel Jansen; Ton G. de Kok; Jan C. Fransoo
287 2009 Inventory Models with Lateral Transshipments: A Review
Colin Paterson; Gudrun Kiesmuller; Ruud Teunter; Kevin Glazebrook
286 2009 Efficiency evaluation for pooling resources in health care
P.T. Vanberkel; R.J. Boucherie; E.W. Hans; J.L. Hurink; N. Litvak
285 2009 A Survey of Health Care Models that Encompass Multiple Departments
P.T. Vanberkel; R.J. Boucherie; E.W. Hans; J.L. Hurink; N. Litvak
284 2009 Supporting Process Control in Business Collaborations
S. Angelov; K. Vidyasankar; J. Vonk; P. Grefen
283 2009 Inventory Control with Partial Batch Ordering O. Alp; W.T. Huh; T. Tan
282 2009 Translating Safe Petri Nets to Statecharts in a Structure-Preserving Way R. Eshuis
281 2009 The link between product data model and process model J.J.C.L. Vogelaar; H.A. Reijers
280 2009 Inventory planning for spare parts networks with delivery time requirements I.C. Reijnen; T. Tan; G.J. van Houtum
279 2009 Co-Evolution of Demand and Supply under B. Vermeulen; A.G. de Kok
Competition
278 277
2010 2009
Toward Meso-level Product-Market Network Indices for Strategic Product Selection and (Re)Design Guidelines over the Product Life-Cycle An Efficient Method to Construct Minimal Protocol Adaptors
B. Vermeulen, A.G. de Kok R. Seguel, R. Eshuis, P. Grefen
276 2009 Coordinating Supply Chains: a Bilevel Programming Approach Ton G. de Kok, Gabriella Muratore
275 2009 Inventory redistribution for fashion products under demand parameter update G.P. Kiesmuller, S. Minner
274 2009 Comparing Markov chains: Combining aggregation and precedence relations applied to sets of states
A. Busic, I.M.H. Vliegen, A. Scheller-Wolf
273 2009 Separate tools or tool kits: an exploratory study of engineers' preferences
I.M.H. Vliegen, P.A.M. Kleingeld, G.J. van Houtum
272
2009
An Exact Solution Procedure for Multi-Item Two-Echelon Spare Parts Inventory Control Problem with Batch Ordering
Engin Topan, Z. Pelin Bayindir, Tarkan Tan
271 2009 Distributed Decision Making in Combined Vehicle Routing and Break Scheduling
C.M. Meyer, H. Kopfer, A.L. Kok, M. Schutten
270 2009 Dynamic Programming Algorithm for the Vehicle Routing Problem with Time Windows and EC Social Legislation
A.L. Kok, C.M. Meyer, H. Kopfer, J.M.J. Schutten
269 2009 Similarity of Business Process Models: Metics and Evaluation
Remco Dijkman, Marlon Dumas, Boudewijn van Dongen, Reina Kaarik, Jan Mendling
267 2009 Vehicle routing under time-dependent travel times: the impact of congestion avoidance A.L. Kok, E.W. Hans, J.M.J. Schutten
266 2009 Restricted dynamic programming: a flexible framework for solving realistic VRPs
J. Gromicho; J.J. van Hoorn; A.L. Kok; J.M.J. Schutten;
Working Papers published before 2009 see: http://beta.ieis.tue.nl