THE DEVELOPMENT OF LC GENERlC ANALYTICAL …©rémie MBINZE... · Dextropropoxyphene Nipasol...
23
THE DEVELOPMENT OF LC GENERlC ANALYTICAL METHODS TO FIGHT COUNTERFEIT NSAIDS USING DESIGN SPACE OPTIMISATI0N STRATEGY UNIVERSITY of LIEGE SBSP 2012, Blankenberge May 07-08, 2012 J. Mbinze Kindenge , P. Lebrun, B. Debrus, A. Dispas, R.D. Marini, Ph. Hubert
Transcript of THE DEVELOPMENT OF LC GENERlC ANALYTICAL …©rémie MBINZE... · Dextropropoxyphene Nipasol...
THE DEVELOPMENT OF LC GENERlC ANALYTICAL METHODS TO FIGHT
COUNTERFEIT NSAIDS USING DESIGN SPACE OPTIMISATI0N STRATEGY
UNIVERSITY of LIEGE
SBSP 2012, Blankenberge May 07-08, 2012
J. Mbinze Kindenge, P. Lebrun, B. Debrus, A. Dispas, R.D. Marini, Ph. Hubert

2
Agenda
1. Introduction
2. Objectives
3. Methodology
4. Results
5. Conclusion

3
A picture of results published from a large scale study was challenging.
1/3 of antimalarial medicines sampled in three African nations were found to be substandard or counterfeit.
80 % of counterfeit reported in some African’s regions.
1. Introduction
Pictures
Sources : USP-USAID-WHO report: http://www.usp.org/worldwide , Feb. 8, 2010.

4
Therapeutic failure,
Emergence of resistance,
Death,
Lack of health security.
1. Introduction
Consequences

5
Impoverishment of the population,
Loss in market share,
Loss of credibility,
The government / other worldwide
organisations: loss of jobs
1. Introduction
Consequences

6
Detecting and tracing (screening) simultaneously several substances belonging to a pharmacological group / with substances of interest
In this context, interest of separative techniques such as HPLC-UV
Combination of experimental design with Design Space optimization strategy
Presentation of the results of NSAIDS ( Non steroidal anti-inflammatory drugs) method
2. Objectives
Development of generic analytical methods

7
P. Lebrun et al., Chemom. Intell. Lab Sys., 91, pp. 4-16 (2008).
• Analytical responses : Peak retention time RT at
Begining ’B’, Apex ‘A’, End ‘E’
• Modelled responses : Log (w) wB = kR – kB, wE = kE – kR and wA = kR
R1 R2
3. Methodology

8
P. Lebrun et al., Chemom. Intell. Lab Sys., 91, pp. 4-16 (2008).
Criteria to evaluate the quality of a chromatogram :
Separation (S) between peaks : RTB peak2 – RTE peak1
Design space (DS) : area in which the probability for a criteria meet the acceptance limits be superior to the selected level quality (π)
l = 0 (acceptance limit)
3. Methodology

9
3. Methodology
Hubert et al., J. Pharm. Biomed. Anal., 45, pp.82-96 (2007)
Method validation : total error approach
Accuracy profile
10
3. Methodology
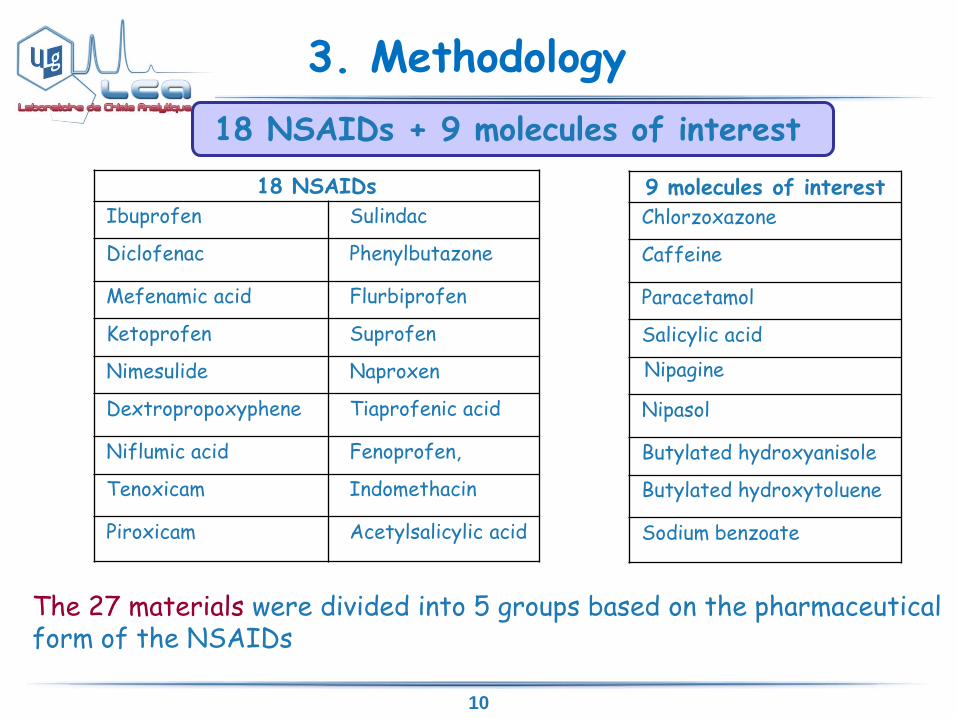
18 NSAIDs + 9 molecules of interest
18 NSAIDs
Ibuprofen Sulindac
Diclofenac Phenylbutazone
Mefenamic acid Flurbiprofen
Ketoprofen Suprofen
Nimesulide Naproxen
Dextropropoxyphene Tiaprofenic acid
Niflumic acid Fenoprofen,
Tenoxicam Indomethacin
Piroxicam Acetylsalicylic acid
9 molecules of interest
Chlorzoxazone
Caffeine
Paracetamol
Salicylic acid
Nipagine
Nipasol
Butylated hydroxyanisole
Butylated hydroxytoluene
Sodium benzoate
The 27 materials were divided into 5 groups based on the pharmaceutical form of the NSAIDs

11
Group 1 Compounds often presented in combination in tablet or capsule
Paracetamol – acetylsalicylic acid – ibuprofen – diclofenac – chlorzoxazone – dextropropoxyphen – nimesulid – ketoprofen – mefenamic acid – salicylic acid – caffeine
Group 2 Compounds presented in combination in syrup and suspension
Paracetamol – ibuprofen – nimesulid – mefenamic acid – nipagine – nipasol – sodium benzoate – BHA – BHT
Group 3 NSAIDs found alone in tablet or capsule
Indomethacine – tenoxicam – piroxicam – flurbiprofen – tiaprofenic acid – naproxen – suprofen – sulindac – phenylbutazone – fenoprofen – niflumic acid
3. Methodology

12
3. Methodology
Group 4 Pharmaceutical combinations presented in tablet or capsule
1 Paracetamol - acetylsalicylic acid - caffeine
2 Paracetamol – ibuprofen
3 Paracetamol – diclofenac
4 Paracetamol – diclofenac – chlorzoxazone
5 Paracetamol – ibuprofen - caffeine
6 Paracetamol – mefenamic acid
7 Paracetamol - dextropropoxyphen
8 Paracetamol – dextropropoxyphen - caffeine
Group 5 Compounds presented in syrup and suspension
1 Paracetamol – nipagine – nipasol – sodium benzoate – BHA - BHT
2 Paracetamol – ibuprofen – nipagine – nipasol – sodium benzoate – BHA - BHT
3 Ibuprofen – nipagine – nipasol – sodium benzoate – BHA - BHT
4 Nimésulide – nipagine – nipasol – sodium benzoate – BHA – BHT
5 Mefenamic acid – nipagine – nipasol – sodium benzoate – BHA - BHT

13 13 13
DOE : central composite design with 3 factors
Factors Levels
pH 1.85 2.42 3.14 4.42 5.71 6.42 7
Gradient time (TG, min) - 20 24.5 40 55.5 60 -
Temperature (Temp, °C) - 20 21.7 27.5 33.3 35 -
32 experimental conditions.
3. Methodology

14
• Validation of the models : R2
Adjusted and residual graphes
4. Results
R2Adjusted ~ 1
• Modelling : Y = XB + E Log (w(A)) = β0 + β1*pH + β2*pH2 + β3*pH3 + β4*pH4 + β5*TG + β6*TG
2 + β7*T°+ β8*T°2 + β9* pH*TG + β10*pH*T° + β11*TG*T° + β12*pH*TG*T°+ Є

15
4. Results
Prediction from DS
Optimal conditions Optimal
P(S>0)
pH Gradient time (minutes)
Temperature (° C)
Group 1 67. 0% 3.05 (2.80-3.10) 49. 30 (40.00-60.00) 34. 5 (20.0-35.0)
Group 2 94. 9% 4.05 (3.90-4.30) 53. 14 (40.00-60.00) 23. 0 (20.0-35.0)
Group 3 23. 0% 7.00 (6.90-7.00) 60. 00 (57.00-60.00) 21. 7 (20.0-27.0)
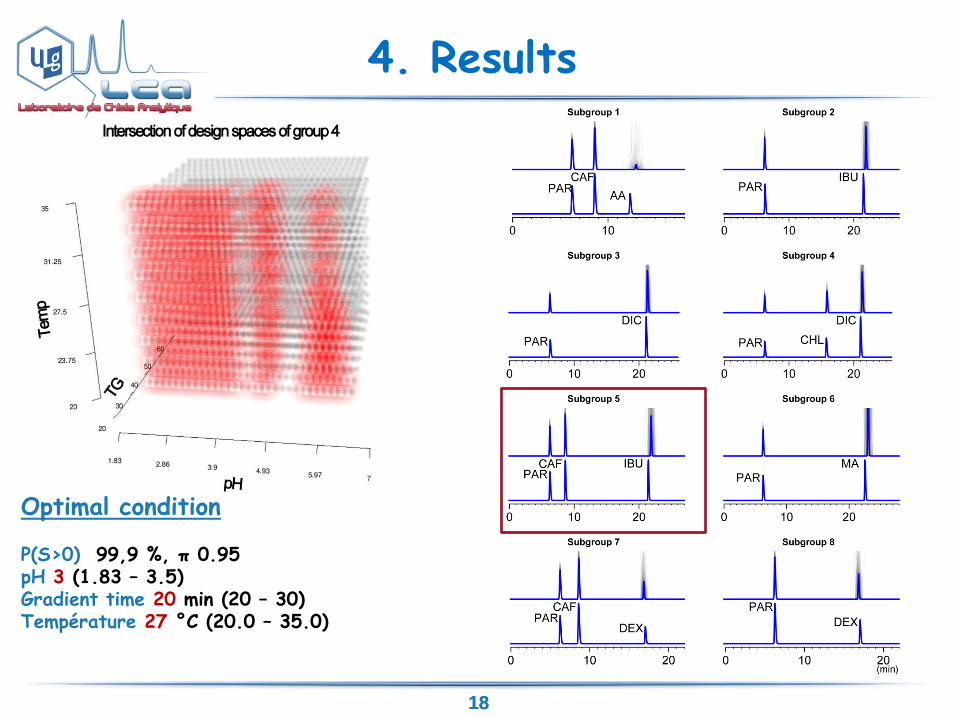
Group 4 99. 9% 3.00 (1.83-3.50) 20. 00 (20.00-30.00) 27. 0 (20.0-35.0)
Group 5 99. 9% 6.14 (6.05-6.20) 35. 00 (34.00-36.00) 29. 4 (23.0-30.0)

16
Validation of the optimal condition for group 2. (Grey) simulations showing the uncertainty of prediction.
Experimental
Simulated
Chromatogram experimental
4. Results
. LC conditions: Analytical column: XBrigde (250 x 4.6 mm; i.d.) packed with octadecyl silica particles (5 µm dp). Mobile phase: mixture of methanol and 20mM ammonium formate buffer at pH 4.05. Gradient increased linearly methanol proportion from 15 % to 95 % in 53,14 minutes. Flow rate: 1.0 mL.min-1, column temperature: 23°C. UV- detection: 220 nm.
17
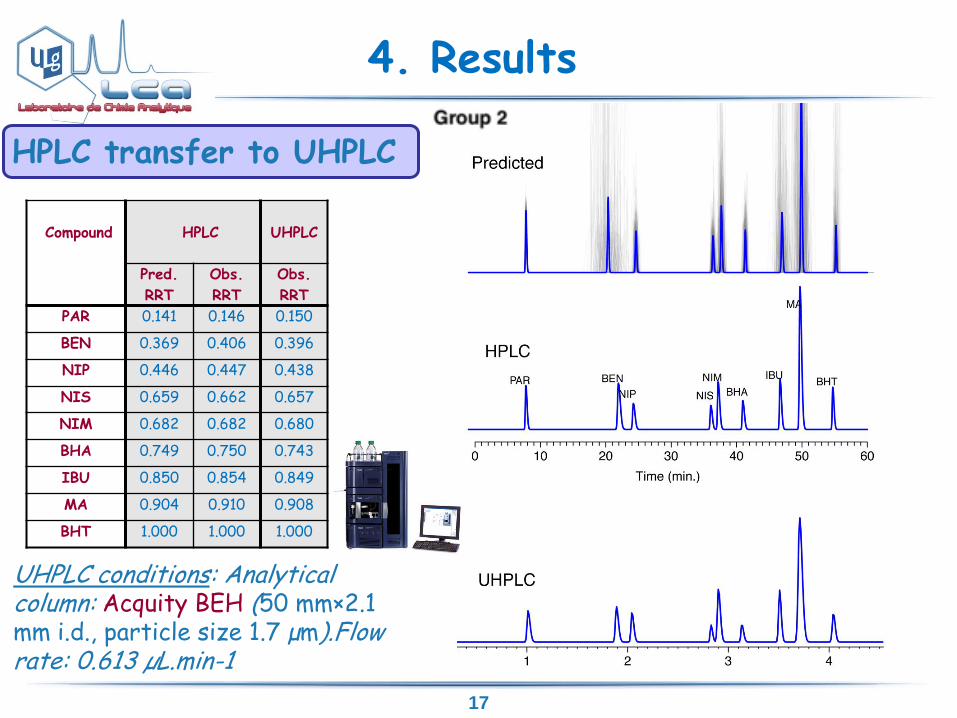
HPLC transfer to UHPLC
4. Results
Compound
HPLC
UHPLC
Pred.
RRT
Obs.
RRT
Obs.
RRT
PAR 0.141 0.146 0.150
BEN 0.369 0.406 0.396
NIP 0.446 0.447 0.438
NIS 0.659 0.662 0.657
NIM 0.682 0.682 0.680
BHA 0.749 0.750 0.743
IBU 0.850 0.854 0.849
MA 0.904 0.910 0.908
BHT 1.000 1.000 1.000
UHPLC conditions: Analytical column: Acquity BEH (50 mm×2.1 mm i.d., particle size 1.7 µm).Flow rate: 0.613 µL.min-1
18 18
Optimal condition P(S>0) 99,9 %, π 0.95 pH 3 (1.83 – 3.5) Gradient time 20 min (20 – 30) Température 27 °C (20.0 – 35.0)
4. Results

19
4. Results
(Red) bias (%).
(Black) acceptance limit (±5%). (Blue) 95% b-expectation tolerance interval. (Green) individual measures. .
Accuracy profiles for quantitative methods validation
Method validation
Legend : PAR. Paracetamol-IBU. Ibuprofen - CAF. Caffeine
For the 4-aminophenol, a one-level calibration is used 0.1% of 4-aminophenol (0.5 µg/mL) in 100% paracetamol (500 µg/mL) LLOQ : 0.1 µg/mL
20
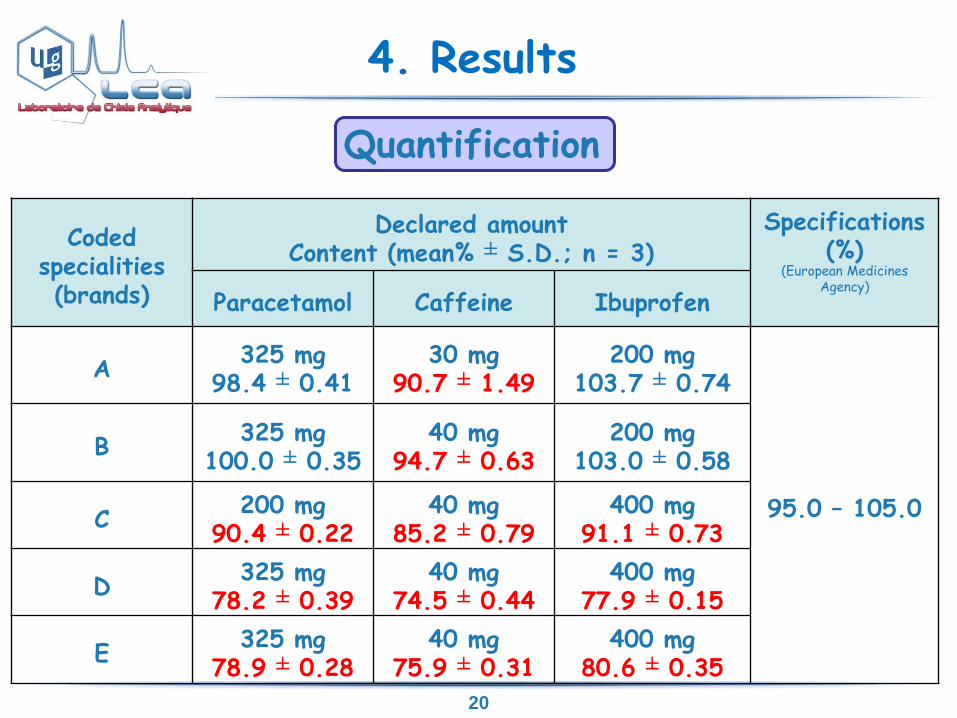
Coded specialities (brands)
Declared amount Content (mean% ± S.D.; n = 3)
Specifications (%)
(European Medicines Agency)
Paracetamol Caffeine Ibuprofen
A 325 mg
98.4 ± 0.41 30 mg
90.7 ± 1.49 200 mg
103.7 ± 0.74
95.0 – 105.0
B 325 mg
100.0 ± 0.35 40 mg
94.7 ± 0.63 200 mg
103.0 ± 0.58
C 200 mg
90.4 ± 0.22 40 mg
85.2 ± 0.79 400 mg
91.1 ± 0.73
D 325 mg
78.2 ± 0.39 40 mg
74.5 ± 0.44 400 mg
77.9 ± 0.15
E 325 mg
78.9 ± 0.28 40 mg
75.9 ± 0.31 400 mg
80.6 ± 0.35
Quantification
4. Results

21
Counterfeit of medicines is a crucial problem of public health. It is so important to develop analytical tools to support decision making of the legal authorities.
The main objective of this work was to develop generic methods able to trace, screen and determine multiple NSAIDs and common associated molecules, in order to detect potential counterfeit drugs.
DS strategy enables robust method development, confirmed by successful transfer method. these validated methods can easily used in quality control laboratory.
5. Conclusion

22
Transfer/ Development of other methods are currently carried out with view on advantages allowing use them efficiently and continuously.
5. Conclusion

23
Thanks for your attention
• See our publications at: http://orbi.ulg.ac.be/; and our posters
Contact: [email protected]
Thanks to : • Prof. Ph. Hubert • Dr. R. Marini • The Belgian University Development Cooperation (CUD) • The Walloon Project PPP (Convention OPTIMAL DS N°917007)


![A. POBUDKOWSKA STUDY OF PH-DEPENDENT DRUGS U. … No1... · Mefenamic acid/MEF 2-(2,3-Dimethylphenyl)aminobenzoic acid C15H15NO2 241.30 Niflumic acid/ NIF 2-{[3-(Trifluoromethyl)phenyl]amino}nicotinic](https://static.fdocuments.in/doc/165x107/5f0f119a7e708231d44255b8/a-pobudkowska-study-of-ph-dependent-drugs-u-no1-mefenamic-acidmef-2-23-dimethylphenylaminobenzoic.jpg)