The Development and Use of Supplemental Metrics in the ...
98
LETTER OF COMMENT NO. APPENDIX III The Development and Use of Supplemental Metrics in the Investment Property Industry Financial statement preparers, investors and financial analysts have long recognized the unique business and economic characteristics of owning and operating investment property. Over a number of years, market forces and industry cooperation has resulted in the development and adoption of supplemental metrics which measure operating results and financial position that more faithfully reflect these characteristics and thus provide more useful information to investors. This Appendix provides more information on the developments of these supplemental metrics and their usage by the global property investment community. Examples of supplementary measures adopted for RElTs and property investment companies around the world include: US and Canada - funds from operations (FFO) US REITs calculate funds from operations (FFO), as recommended by NAREIT, by adding real estate related depreciation and amortization expenses back to earnings, giving a measure of the REIT's performance that more closely reflects economic operating profitability. This is considered to be a better measure of the REIT's performance than reported net earnings. Canadian real estate companies that own and operate investment property report a similar metric recommended by REALpac. Exhibit I1I-A contains a report of the RE1T industry published by Barclays Capital. Whilst the report provides a useful overview of the RE1T industry (with a US focus), the most relevant sections are: 1. Part Four - Stock Analysis and Valuation - evaluates the different metrics used to assess REIT performance and financial position 2. Part Five - Indices and Exchange Traded Funds -closely related to the above industry metrics which form the criteria for assessing company suitability for the index (see Appendix II) Exhibit III-B contains a sample piece of research from RBC Capital Markets and their research on RioCan REIT (a Canadian REIT). It discusses FFO and NOI and clearly indicates how these measures are linked to Net Asset Value (NAV) and REIT share/unit value. Europe - EPRA Earnings and NAV Each year, EPRA publishes its Best Practices Recommendations (BPRs) which provide a framework for encouraging consistent and relevant financial information for real estate companies that own and operate investment property. EPRA recommends two key measures as described below:
Transcript of The Development and Use of Supplemental Metrics in the ...

LETTER OF COMMENT NO.
APPENDIX III
The Development and Use of Supplemental Metrics in theInvestment Property Industry
Financial statement preparers, investors and financial analysts have long recognized the uniquebusiness and economic characteristics of owning and operating investment property. Over anumber of years, market forces and industry cooperation has resulted in the development andadoption of supplemental metrics which measure operating results and financial position thatmore faithfully reflect these characteristics and thus provide more useful information toinvestors. This Appendix provides more information on the developments of these supplementalmetrics and their usage by the global property investment community.
Examples of supplementary measures adopted for RElTs and property investment companiesaround the world include:
US and Canada - funds from operations (FFO)
US REITs calculate funds from operations (FFO), as recommended by NAREIT, by adding realestate related depreciation and amortization expenses back to earnings, giving a measure of theREIT's performance that more closely reflects economic operating profitability. This isconsidered to be a better measure of the REIT's performance than reported net earnings.Canadian real estate companies that own and operate investment property report a similar metricrecommended by REALpac.
Exhibit I1I-A contains a report of the RE1T industry published by Barclays Capital. Whilst thereport provides a useful overview of the RE1T industry (with a US focus), the most relevantsections are:
1. Part Four - Stock Analysis and Valuation - evaluates the different metrics used to assessREIT performance and financial position
2. Part Five - Indices and Exchange Traded Funds -closely related to the above industrymetrics which form the criteria for assessing company suitability for the index (seeAppendix II)
Exhibit III-B contains a sample piece of research from RBC Capital Markets and their researchon RioCan REIT (a Canadian REIT). It discusses FFO and NOI and clearly indicates how thesemeasures are linked to Net Asset Value (NAV) and REIT share/unit value.
Europe - EPRA Earnings and NAV
Each year, EPRA publishes its Best Practices Recommendations (BPRs) which provide aframework for encouraging consistent and relevant financial information for real estatecompanies that own and operate investment property. EPRA recommends two key measures asdescribed below:

EPRA Earnings (equivalent to FFO)For real estate companies, EPRA Earnings is a key measure of a company's profitability and ofits ability to make sustainable dividend payments to shareholders. This metric represents thelevel of recurring income generated from core operational activities, including those operationsof jointly held investment property. EPRA Earnings represents the earnings from the coreoperational activities and provides an indicator of the underlying performance of the propertyportfolio. Therefore, it excludes all income and expense elements, including any changes in theunrealized value of investment property and results from sales of investment properties, that arenot relevant to the on-going operating performance of the property portfolio.
EPRA NAVThe majority of European companies account for real estate at fair value and it has becomecommon for industry analysts to calculate and publish a 'triple net' NAV per share. This is a keyperformance metric used in the European real estate industry and the majority of EuropeanREITs choose to voluntarily disclose this figure based on the balance sheet. The objective of theEPRA NAV measure is to highlight the fair value of equity on a long term basis.
Exhibit III-C contains a regular report published by Morgan Stanley which includesperformance statistics and key stock valuation metrics for a range of pan-European propertycompanies and REITs. This report includes the two key EPRA measures referred to above -EPRA Earnings and "triple net" NAV (see for example Exhibits 10 - 12 of the report). JPMorgan, Nomura, Kempen & Co, BNP Exane, and UBS are also examples of leading providersof real estate equity analysis whose recommendations and forecasts are based on EPRAEarnings, NAV and FFO, which if not specifically published by property companies are thencalculated by analysts.
Australia/Asia - Funds from operations "proxy"To calculate a form of FFO, market analysts in Australia generally adjust the IFRS reported netearnings to eliminate all significant non cash IFRS profit and loss elements. This Adjusted FFO(AFFO) is widely seen as the preferred measure in this region.
Exhibit III-D contains an example of a report prepared by Credit Suisse which analyses thesekey metrics for the Asia/Pacific region.

Exhibit III-A
Barclay Industry Report
EQUITY RESEARCH
REITsREAL ESTATEREITs
SECTOR VIEW
Rating: 1 - POSITIVE
Ross L. Smotrich1.212.526.2306
ross. smotrich@barcap. comBCI, New York
Jeffrey S. Langbaum1.212.526.0971
Jeffrey. langbaum@barcap. comBCI, New York
Matthew Rand1.212.526.0248
[email protected], New York
Ryan H. Bennett1.212.526.5309
ryan. [email protected], New York
Analyst CertificationWe, Ross L. Smotrich and Jeffrey S.
Langbaum, hereby certify [1] thatthe views expressed in this research
report accurately reflect our personalviews about any or all of the subjectsecurities or issuers referred to in this
research report and (2) no part ofour compensation was, is or will be
directly or indirectly related to thespecific recommendations or views
expressed in this research report.
REITs 101: An Introduction
REITs have existed for more than 45 years, but the modern REIT era can be traced
to the early 1990s. In the subsequent 20 years, the real estate industry has
undergone significant and, we think, irrevocable structural change driven by the
shift from privately to publicly owned real estate and the resulting migration of
assets and talent into the public markets. During that period, the REIT sector has
grown and evolved into a viable and credible investment alternative.
Notwithstanding the current credit market and macroeconornic challenges
impacting REITs valuations, we believe these trends are sustainable.
• With this report, we present on overview of the REIT industry, including its history
and performance, fundamental and sector drivers, and, finally, a stock valuation
framework. We are hopeful that experienced investors will use the information
contained herein as a reference, while those new to REITs may find it helpful in
familiarizing themselves with the industry.
• Outlook for the Group. After outperforming the broader market for seven years
through 2006, REITs have underperformed the broader market since early 2007.
Investor sentiment turned materially negative in 2007, driven by the perceptua
connection to weak housing markets, but the group tolled over in 4Q08 on the
heels of the Lehman Brothers bankruptcy and the subsequent credit market
shutdown. REITs do face a series of issues —including macroeconornic concerns,
weak housing markets, and constrained debt markets —with no directional
consensus. Our investment thesis that REITs will likely outperform the broader
equity markets in 2009 is predicated on directional improvement in the debt
markets, driven in turn by government intervention. Should credit markets loosen,
we believe that stocks could rebound considerably, driven by valuation, dividend
income, and better-than-expected long-term business prospects. Overall, we
be ieve that the better run, better capitalized equity REITs should be the primary
beneficiories of the current dislocation, and that when we ook bock one year from
now, those stocks should be materially higher.
Barclays Capital does and seeks to do business with companies covered in its research reports. As a result, investorsshould be aware that the firm may have a conflict of interest that could affect the objectivity of this report.
Customers of Barclays Capitol in the United States con receive independent, third-party research on the company orcompanies covered in this report, at no cost to them, where such research is available. Customers can access thisindependent research at www.lehmanlive.com or can call 1 -800-253-4626 to request a copy of this research.
Investors should consider this report as only a single factor in making their investment decision.
April 01, 2009 PLEASE SEE IMPORTANT DISCLOSURES BEGINNING ON PAGE 89

REITs
Table of Contents
Executive Summary 5
What Is the Focus of this Primer? 6
A REIT Defined 8
Real Estate Investment Trusts 8
Part One: A REIT Defined 14
Internal versus External Management 15
UPREITs and DownREITs 16
REIT Advantages 17
Total Return Vehicle 17
Funding Growth 18
Dividends/Current Income 22
Commercial Real Estate Performance 23
Low Correlation with Other Indices 23
Long-Term Performance 23
PortJ"wo: History 28
Parl Three: Fundamental Overview 36
Part Four: Stock Analysis and Valuation 62
Port Five: Indices and Exchange-Traded Funds 74
Part Six: Current and Future Trends 80
Port Seven: Glossary of REIT Terms 86
REITs
Table of Figures _^____ __
Figure 1; UPREIT Structure 16
Figure 2: Types of U.S. Listed REITs by Equity Market Capitalization,
as of 12/31/08 19
Figure 3: Listed U.S. REITs by Property Type (based on equity market capitalization),
12/31/08 19
Figure 4: Largest Companies by Sector, as of December 31, 2008 1 9
Figure 5: Number of Companies in FTSE NAREIT Composite Index, 1971-2008 20
Figure 6: Growth of Market Cap for FTSE NAREiT Composite Index, 1971-2008
{$ in billions) 21
Figure 7: REITS in the S&P Indices 22
Figure 8: REIT Dividends versus S&P 500 Dividends,
December 1995-February 2009 22
Figure 9: REIT Correlation with Other indices 23
Figure 1 0: Five-Year REIT Performance versus Major Indices,
February 2004-February 2009 24
Figure 11:15-Year REIT Performance versus Major Indices,
October 1992-February 2009 24
Figure 12; Fund Flows, January 1998-February 2009 [$ in billions) 25
Figure 1 3: Timeline of REIT History versus Sector Stock Performance,
January 1972-February 2009 28
Figure 14: REIT IPO Boom of 1993-96 31
Figure 15: Employment Growth and Household Formation, 1976-2008 38
Figure 16: U.S. Job Growth, 2000-1OE [in OOOs) 38
Figure 17: Annual Job Growth |OOOs) versus Apartment Revenue/NOI Growth 39
Figure 18: Rent versus Buy Spread, 1995-2008 40
Figure 19: Rental Growth [through 2014E) 42
Figure 20; Completions and Absorptions (through 2014E] 42
Figure 2 1: Sales of New and Existing Single-family Homes — 1968-2008
(annual rate, in OOOs) 43
Figure 22: Average Rate for Single-Family Mortgage Loans — Monthly Basis,
1989-2009 43
Figure 23: Industrial Market Completions, 1980-2014E 44
Figure 24: U.S. Industrial Market Completions versus Inventory, 1980-2014E 45
Figure 25: World GDP, U.S. GDP, Global Trade Growth, 2001-2010E 45
Figure 26: ISM Manufacturing and Non-Manufacturing Indices,
July 1997-February 2009 46
Figure 27: U.S. Industrial Absorption — Forward Projections, 1991-2014E 46
Figure 28: U.S. Industrial Occupancy, 1990-2014E 47
Figure 29: U.S. Industrial Rent Change, 1990-2014E 47
Figure 30: U.S. White Collar Job Growth, 1991-2014E 49
Figure 31: U.S. Office Absorption, 1991-2014E 49
April 01, 2009 •

REITs
Figure 32: U.S. Office Completions, 1980-2014E 50
Figure 33: U.S. Office Occupancy, 1989-2014E 51
Figure 34: U.S. Effective Renl Change, 1989-2014E 51
Figure 35: Shopping Centers - Shopping Center Formats 52
Figure 36: New Construction — Less than 800,000 sq. ft. (in millions of sq. ft.( 53
Figure 37: Regional Mall Deliveries (in thousands of sq. ft.) 54
Figure 38: Consumer Confidence, 1995-2009 56
Figure 39: Real Personal Consumption Expenditures, 1995-2009 56
Figure 40: U.S, Retail Sales Losing Share in Real Personal Consumption Expenditures. 57
Figure 41: Effective Rent of Shopping Centers, 1990-2012E 58
Figure 42: REIT Historical Forward Multiples — Overall Average,
1996-2009 Year-to-Date 63
Figure 43: REIT Historical Sector P/FFO Forward Multiples, 1998-2009 64
Figure 44: Example of a REIT NAV Calcu ation (Mack-Cali Realty! 66
Figure 45: REIT Dividends versus S&P Dividends versus 1 0-Year Treasury Yield 67
Figure 46: Simon Property Group — Capital Structure, as of 12/3 1 /2008
[$ in millions) 71
Figure 47: REIT Indices Comparison 76
Figure 48: Real Estate ETFs 76
Figure 49: Unprecedented U.S. REIT Volatility- 13 Years of Daily RMZ Returns 77
Figure 50: Globa Proliferation of REIT and REIT-Like Structures 83
Figure 51: REIT Stocks Under Coverage 84
April 01, 2Q09

REITs
Executive Summary
April 01, 2009

REITs
Executive Summary
REITs hove existed for the post 48 years; however, the modern REIT era began in the early
1990s. Emerging from the deep real estate recession of the late 1980s, the industry has
grown from an equity market capitalization of $13 billion (1991) to $188 billion at the
end of 2008. REITs contro $700 billion-$800 billion of commercial real estate assets,
representing 15%-20% of the overall commercial real estate market. Furthermore, over the
past 15 years, REITs have outperformed the major indices, showing an average annua
tota return of 8.2% (as of December 31, 2008), in contrast to the S&P 500 (6.4%),
Nasdaq (4.8%), and the Dow (8.1%). During this period, REITs have become a viable
and credible investment alternative. As a manifestation of this growth and credibility, REITs
are now included in several major indices, such as the S&P 500.
Notwithstanding 15 years of outperforrnance, the past 24 months have proved very
challenging. The stocks hove fallen 75% on a price basis from their February 2007 peak
(versus the S&P 500, which is down 50% over the same period of time], and the overall
equity capitalization of the group (via the MSCI U.S. REIT Index) is down 75% from $401
million to $99 million. The incremental dollar into the group has come from macro hedge
funds which have a bearish view due to the credit market shutdown and the onset of a
global recession. As a result, stocks have been trading at very ow absolute levels.
Nevertheless, we still believe that most REITs will survive as a viable asset class and
warrant investor attention.
What Is the Focus of this Primer?
Industry growth, combined with the view that rea estate is a viable alternative investment,
has increased institutional investor focus on the REIT sector. The breadth of investor interest
in REITs has grown dramatically in recent years, driven by severe considerations, including
inclusion in the indices, past stock performance, and absolute return potential. Thus, this
primer is meant to serve as an introduction to REITs for analysts and portfolio managers new
to the space. It presents an industry overview, including its history and performance,
fundamenta and sector drivers, and finally a stock valuation framework. We also hope
that experienced investors in the space will view the material presented in this primer as a
useful reference. To that end, we present this report in seven main sections:
A REIT Defined (page 8). In addition to a formal definition, this section provides a
conceptua framework from which to view the REIT sector in relation to the broader
securities market.
History (page 28). This section provides an overview of key trends/events that have
shaped the REIT industry/structure into what it is today.
Fundamenta! Overview (page 36). This section outlines fundamental real estate
drivers, as well as specific considerations for each major property type.
Apr',) OT, 2009

REITs
Stock Analysis and Valuation (page 62). This section provides o guide to REIT
security valuation metrics and suggests an analytica framework with which to assess a
REIT's fundamental operating performance, both now and in the future.
REIT Indices (page 74). This section illustrates the differentiated character!sties of the
major REIT indices.
Current and Future Trends (page 80). This section examines where the industry is
likely to go from here.
Glossary of REIT Terms (page 86). This section defines the terms often used in REIT
literature.
April 01, 2009

REITs
A REIT Defined
A Real Estate Investment Trust (REIT) is essentially a corporate entity that owns, operates,
acquires, develops, and manages rea estate assets. However, REITs are differentiated
from other corporate forms by a tax election that eliminates taxes at the corporate evel.
Most of the company's taxable income is passed along to investors in the form of
dividends; shareholders subsequently pay taxes on those dividends.
Real Estate Investment Trusts
To qualify as a REIT for tax purposes a company must:
• distribute at least 90% of taxable income as dividends;
• derive at least 75% of gross income from qualified investments (real property or
mortgage debt);
• derive at least 90% of gross net income from rea property, dividends, interest,
and gains from security sales;
• invest at east 75% of assets in equity ownership of real property, mortgages,
other REIT shares, and government securities and cash;
• ensure that no more than 50% of shares outstanding are owned by five or fewer
individuals (the "five-or-fewer" rue];
• ensure that its shares are owned by at least 100 shareholders; and
• ensure that ihe taxable REIT subsidiary is no arget than 20% of its assets.
Conceptually, a REIT can be viewed much like a mutual fund in that it allows investors to
pool capital and invest in a larger, more diversified rea estate portfolio. Both REITs and
many mutual funds are essentially pass-through vehicles, passing the cash flow from that
portfolio to investors. Like a mutual fund, the original REIT structure created in the 1960s
was a passive investment vehicle; it prohibited the operation and management of
properties by the REIT itself. Over the years, however, legislative and tax code changes
have enabled REITs to become actively managed, fully integrated operating companies.
The fact that a REIT is simultaneously both o pass-through vehicle and an actively managed
investment vehicle has several implications:
• First, real estate industry fundamentas such as market or portfolio occupancy and rent
levels matter, as they directly affect earnings growth, and, in turn, cash flow.
• Second, perhaps contrary to conventional wisdom, management is important. When
REITs were passive investment vehicles, all that mattered was asset performance. Now
that REITs are bona fide operating companies, management has the power to improve
or, conversely, weaken that operating performance, as well as that of the overall

REiTs
A More in-Depth Look
enterprise. Good management will produce significant and efficient returns for the
REIT's portfolio, and guide the REIT through difficult markets.
• Third, as a pass-through vehice, we would argue that the absolute eve and
composition of a REIT's investment returns should reflect those of the underlying asset
class. We view real estate as a tota-return asset, benefiting from steady income and
modest growth. Furthermore, historical rea estate returns have normalized in the low
teens on an unleveraged !RR basis. Similarly, we view a REIT as a total-return security
and expect high-single to low-double-digit returns on a normalized basis, from a
combination of dividend income and growth in earnings (funds from operations) per
share-
All that soid, REITs are stocks, and as with the broader market, sentiment plays an important
roe in actual returns. REITs are relatively illiquid securities; the entire sector trades roughly
$4 billion pet day, neatly equivalent to the most liquid stocks (e.g., average daily volume
for Google is approximately $2 billion].
Given the essential nature of real estate as an asset class, and REITs as a security, we
structured this report in order to touch on both. We begin with an overview of the basics-
definitions, recent performance statistics, breakdowns by property types—and then move
on to a brief history of the sector. The goal, of course, is to provide a sense of how the
REIT sector has evolved into what it is today.
A REIT, by definition, is a rea estate company; for us as fundamental analysts, an
understanding of the underlying property markets is critical. In section three of this report,
therefore, we outline the basic industry drivers. We did not set out to write the definitive
reo! estate textbook; that has been done more effectively elsewhere. In its simplest terms,
however, we view rea estate as the supply and demand for cubic feet. Fortunately, the
demand side of the equation is generally driven by macro-economic considerations with
which most securities analysts are already familiar. As such, in this section, we seek to tie
those macro drivers back to the property ieve for the industry in general as well as focus in
on the specific set of drivers/factors that influence the four main REIT property types below.
• Multi-family [Apartments). The multi-family sector is primarily driven by three factors:
job growth, demographic trends, and single-family housing affordobility.
Demographics, of course, include immigration, household formation, as well as
absolute population growth.
• Office (Central Business District and Suburban). The office sector is driven primarily
by white-collar job growth, which is influenced in turn by the broader service
economy.
• Industrial [Warehouses and Distribution Centers). The industria sector is driven ess
by fob growth, and more by general economic activity, including changes in supply-
chain logistics, global trade, and inventory buildup. The asset cass tends to be
April 01, 2009

REITs
Fundamental KEIT Stock Analysis
relatively stable due to closely correlated supply and demand, largely attributed to the
short development cycle.
• Retail (Regional Malls and Shopping Centers). Near term, the retail sector is driven
less by the consumer and more by retailer exposure. Longer-term fluctuations in
consumer spending, consumer confidence, and, in turn, retail sales affect that balance.
Real estate is both an asset class and a security—just as we analyze the asset using
fundamental metrics, we apply classic securities valuation tools to the stocks—albeit
adapted to fake into account the nature of the underlying business. As such, we analyze
and value RE1T stocks based on earnings multiples, asset values, and yield.
• Earnings Multiples. We analyze REITs based on two primary multiples: price to FFO
(funds from operations! and price to CAD (cash available for distribution), which
approximately parallel the price-to-EPS and price-to-cash-flow (EBITDA) multiples used to
analyze other types of companies. FFO and CAD should reflect the performance of
the underlying portfolio of properties, measured, in turn, by same-store net operating
income [SSNOI), a key measure of property-level performance. As with all multiple
analyses, it is important to factor earnings growth into the equation. Finally,
management's ability to influence these factors may lead to a premium or discounted
valuation.
• Asset Values. Net asset value is a proxy for book value used in conventiona
securities analysis. In essence, our NAV calculation estimates the private market
breakup value of a company's assets. Given the nature of the calculation, we view
this metric as more useful as a relative va uation tool for similar companies at a given
point in time, as opposed to being a useful comparative metric over time or in absolute
terms. We look at the stocks on a price-to-NAV basis, essentially the real estate
equivalent of a price-to-book valuation.
• Dividend Yield. By definition, REITs are total-return vehicles. Historically,
approximately two-thirds of total returns have come from the dividend although in
recent years price appreciation has taken the lead]. Therefore, we look at dividend
yields relative to other REITs, in addition to other income alternatives such as the 10-
year Treasury bond. That said, there is normally on inverse relationship between yield
and earnings growth rates,
Our valuation analysis, aid out in more detail in the "Stock Analysis and Valuation"
section, is supported by an analysis of management's ability to facilitate stability and
growth, and prudently manage the balance sheet. We track a number of ratios and
statistics, with the goal of ensuring that our earnings projections are achievable based on
the company's capital structure. In that vein, we view analyzing REITs as similar to
analyzing other types of companies, the difference being in the metrics used.
April 01, 2009

REITs
^ -r i /r ^ . i i Underlying rea estate fundamentals are relatively visible and quantifiable in the near term;Current Trends/Future Outlook ' s 7 - 1
the stocks, however, are not trading on fundamentals. Instead, a series of risk
considerations overhang the REITs, as well as the broader market. In contrast to past
cycles, there appears to be no directiona consensus on these issues—reasonable people
can look at the same circumstances and reach diametrically opposed conclusions. Finally,
there is the recent stock market voatility, a portion of which is due to REITs trading in line
with financial. Nevertheless, when one layers the potentio impact of these issues on
recent broader market volatility, it is difficult to have conviction on REIT sector performance
going into 2009.
Some of the current issues that REITs face include:
• Challenges in the debt capita markets, with commercial mortgage markets seized up,
leading to questions of when the markets will return to some kind of normalcy.
• Maaoeconomic uncertainty, including GDP growth, the price of oi, inflation, Federal
Reserve policy, and the health of the consumer.
• Material weakening in the housing markets.
• Anecdotal evidence of cap rates gapping out, while questions linger regarding where
asset va ues will level off.
• Re-equalization of the balance sheet as companies address debt maturities in the
context of a scarcity of debt capital.
• Potential privatizations al these levels.
• Restructuring efforts on both the private and public side of real estate.
Notwithstanding current uncertainty, however, we think real estate, and by extension REIT
stocks, will continue to be an important asset cass for a growing audience of investors.
For that reason, we are hopeful that our readers find this primer worthwhile.
April 01,2009 11

REITs
April 01, 2009

REITs
Part One: A REIT Defined
April 01, 2009 13

REITs
Part One: A REIT Defined
Real estate investment trusts (REITs) ore pass-through vehicles designed to facilitate the flow
of rental income and/or mortgage interest to investors. REITs were created in the 1960s to
allow smaller investors the opportunity to pool capital and invest in larger-scale commercial
properties. The positive aspects of REITs today are a direct result of their structure, which
has evolved over time and benefited from a series of tax law and legislative changes.
These changes hove transformed REiTs into actively managed, total-return vehicles that
invest in a broad spectrum of real estate assets. The growth of the sector, along with its
distinct benefits, has led to wider market acceptance, a trend that we expect to be long-
lived.
What Is a REIT? First and foremost, a REIT is a tax election. A real estate company elects REIT status for tax
purposes. In order for a stock to qualify for REIT status and benefit from the elimination of
corporate taxes, it must campy with several distribution and income stream requirements,
as well as major ownership restrictions, as follows:
• it must distribute at least 90% of taxable income as dividends;
• at least 75% of gross income must corne from qualified investments (rea property or
debt secured by real property);
• at least 90% of gross net income must be derived from:
1. real property
2. dividends
3. interest
4. gains from security sales
At least 75% of assets must be invested in:
5. equity ownership of real property
6. mortgages
7. other REIT shares
8. government securities and cash
No more than 50% of shares outstanding can be owned by five or fewer individuals [the
"five or fewer" rule]:
• the shares must be owned by at least 100 shareholders; and
• the taxable REIT subsidiary can be no arger than 20% of the REIT's assets.
REITs are not taxed at the corporate level as long as they pay out 90% of taxable income
in the form of dividends. Instead, REITs are taxed at the shareholder leve , thus avoiding
double taxation. In the regular c-corporation structure, the investor is double-taxed: first at
the corporate income tax level and then at the individual income tax evel. As a
14 April 01,2009

REITs
consequence, investors in a public REIT may receive a higher return on their investment, on
an after-tax basis, than they would receive in a c-corp.
REIT Structure ITs can be either public or private companies, they can be internally or externally
managed, and they can be foimed using an UPREIT, DownRElT, or "normal" structure. The
structure a REIT elects may have a sizable impact on how the REIT operates.
Internal versus External Management
When forming a REIT, the company must decide whether to be internally or externally
managed. Historically, the majority of REITs were externally managed (advised], similar to
a mutual fund structure, due to legisative restrictions against active management. The Tax
Reform Act of 1986 allowed for active, internal management. The result is that REITs look
and function like any other company with employees, a management team, and a board
of directors. Now, more than 90% of public REITs are internally advised. The debate over
the benefits of internal versus external management is lengthy, but the key issues relate to
potential conflicts of interest and the compensation level of the external manager advising
the REIT.
Conventional wisdom is that an externally advised structure carries the theoretical
imperative to grow the company for the sake of size, rather than EPS. However, a number
of the external advisor/ agreements that exist today are structured to mitigate that concern.
First, in most management agreements, base fees are calculated on equity, rather than tota
assets, which should eliminate the pressure to grow the portfolio rather than profits.
Second, most external managers maintain a significant equity investment in the advised
entity, which aligns management and shareholder interests.
Compensation of the external manager, on the other hand, is an issue that is commonly
debated. The compensation structure of an external management agreement resembles
that of what is typically seen in the private equity or hedge fund world. The main
components consist of a base fee (normally approximately 1.5% of equity in addition to an
incentive fee, which is usually cacuated based on a hurdle rate (for example, 25% of the
returns that exceed a 10% FFO return on equity]. These fees can vary from company to
company, but the underlying structure is usually the same. However, external management
agreements also usually include many expense reimbursements, which may vary greatly.
Net-net, we believe most investors would prefer an internally advised structure to eliminate
any potential conflicts of interest or compensation concerns.
That said, we must also note the potential positives of an externa management agreement,
namely the experience, platform, and reationships that an external manager often brings to
the table. A smaller REIT that may not have the resources to support a large management
team may benefit by "outsourcing" management to a larger, more established organization
that may provide a broader array of services and existing relationships.
April 01, 2009 15

REITs
UPREITs and Down REITs
The Umbrella Partnership RE1T [UPREIT) structure was first used by Taubman Centers in its
1992 IPO. The structure faci Stated the growth of the industry by serving as a catalyst to
asset sales. This vehicle allows the owners of a property, or portfolio of properties, to "sell"
their property interests in a tax deferred exchange for units in a limited partnership, the
"Operating Partnership," or OP. The OP is formed simultaneously with the REIT at the IPO,
and the REIT subsequently contributes cash proceeds from the IPO to the partnership in
exchange for an ownership interest in the OP, which becomes the owner of the properties.
The units received by the former property owner are exchangeable into common shares on
a 1:1 basis, and collect o dividend equa to that of the common shares. Capital gains
taxes are deferred until the unit holder converts those units into common shares. We
illustrate the structure in Figure 1.
Figure 1: UPREIT Structure
Partnership Unit holders -convertible to common shares
Subsequent to the IPO, the newly public REIT may use OP units as a currency for property
acquisitions. This structure benefits the origina property owner (who sold the properties to
the OP) by providing the opportunity to defer capital gain taxes, collect the earnings in the
form of dividends, convert its portfolio into a liquid security, improve its balance sheet, and
diversify its portfolio. In addition to being tax-deferred until conversion into common shares,
if the partner retains the units unti death, his/her estate has the ability to convert the units
tax-free.
The REIT benefits by acquiring an interest in the partnership properties and a currency for
future acquisition. The UPREIT affords well-established private real estate companies the
opportunity to derive the benefits of the REIT structure while maintaining an ownership
interest. One concern with the structure is that there might be a conflict of interest between
Apr//0?, 2009
REITs
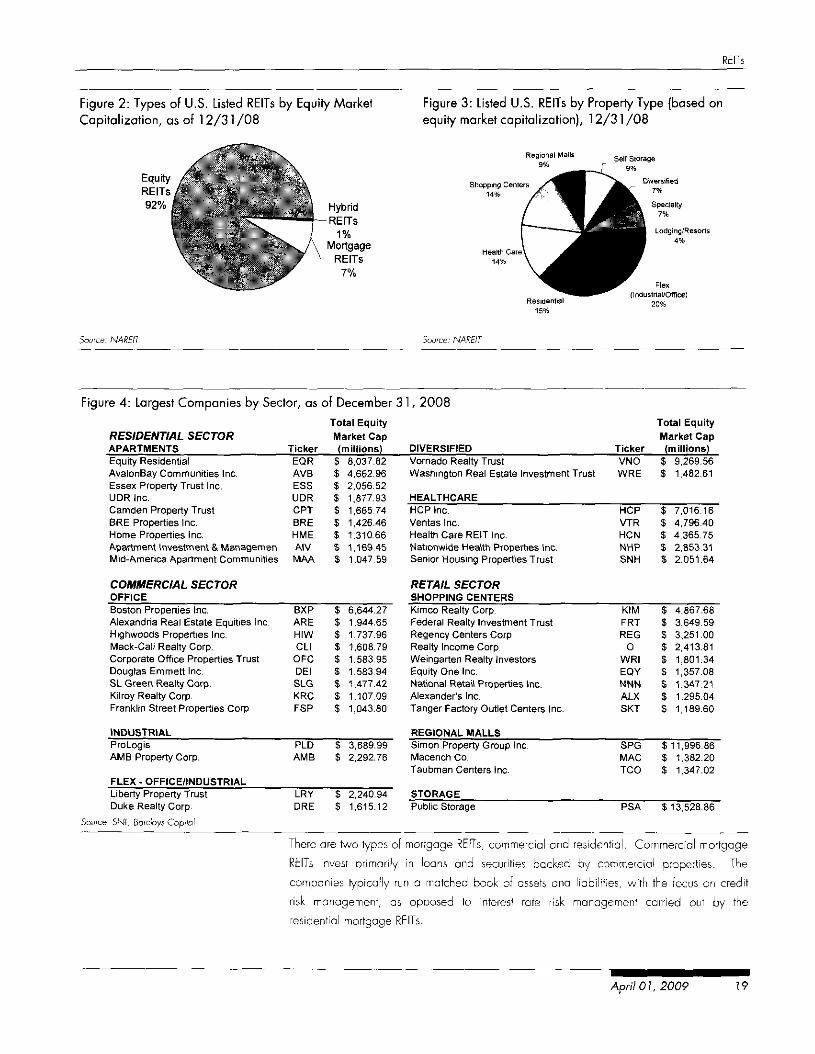
the owners of the units and the management of the REIT. For example, if the company
wishes to sell one of the properties contributed by the partner, the holder of the partnership
units, not the shareholders, will be taxed on the sale.
DownREITs have a simiar structure to UPREITs except that the operating partnership is
usually formed subsequent to the IPO, the purpose being to create partnership units to be
used as a currency for acquisitions- Although units in the DownREtT partnership represent
an ownership interest in just that partnership, and not the REIT as a whole, the conversion of
those units and the dividends paid are similar to that of UPREIT units, in that they are
convertible on a 1:1 basis and receive dividends equal to that of common shares.
Lastly, a REIT may be structured without the use of the UPREIT or DownREIT structure. Under
this "normal" structure, the properties are owned directly by the REIT, not an operating
partnership, the benefit being the elimination of any potential conflicts of interest. But the
"norma " structure a so eliminates the benefit of using OP units as a currency for acquisition.
REIT Advantages
The differentiated structure of a REIT gives it a number of distinct advantages. First, REITs
provide increased liquidity, allowing investors to buy and sell shares more easily than they
would buy and sell actual real estate. Second, whereas purchasing real estate usually
requires a substantial commitment of capital, REITs have no minimum investment
requirement. In this way, investors can buy as many or as few REIT shares as they want.
Third, unlike other types of rea estate, shareholders of a REIT are not held personally liable
for debt incurred by the REIT. In addition, those who invest in a REIT benefit from the
professional management teams that possess vast industry knowledge and expertise.
Total Return Vehicle
Real estate as an asset class is a tota -return investment; REITs are viewed in the same way,
providing investors with both capital appreciation and current income. REIT stocks over the
last 15 years have provided an 8.2% annualized compounded return to investors as of
December 31, 2008. Only about 20% of that return is from price appreciation,
suggesting that the dividend is an integral portion of the REIT's total return. Therefore, the
more efficiently a REIT can increase its earnings, the higher the return it provides to
investors. Since a REIT's dividend is such a meaningful component of its return, REITs must
find innovative ways to increase earnings and, by extension, dividends. In practice, a REFT
can increase its profitability either internally or externally. Internal growth is achieved
through improvements to the existing portfolio. This can be accomplished through
occupancy improvement, rental rate increases, scheduled rent bumps, expense sharing
(common area and maintenance], or tenant upgrades, as well as property redevelopments,
which can lead io rent raises. External growth, on the other hand, is achieved through
property acquisition and development.
April Of, 2009 17

REITs
Funding Growth
Since REITs are required to pay out 90% of their taxable income to shareholders, they are
theoretically left with minimal retained earnings—o ack of capital—with which to acquire
and develop new properties. This circumstance would appear to leave REITs with two
unpleasant choices: either issue or take on new debt to fund these projects or sell equity,
which could dilute existing shareholders. In reality, however, REITs have other options.
Since their taxable earnings include the impact of depreciation, REITs can pay out 90% of
taxable income with a much lower cash flow ratio. On average, we estimate that REITs
actually retain 30%-40% of cash flow. The REIT can then use this undistributed, untaxed
cash to fund its external growth.
Alternatively, a REIT can expand its earnings platform by forming joint ventures (JVs) with
other investors, acquiring private equity capital. In a typica joint venture, an outside
source provides a portion of the capital to fund a specific project, and the REIT uses its
management and other resources to manage the property and earn a fee stream. The
advantage of a JV is that it allows a REIT to expand its operating platform without having to
expend large amounts of capital Furthermore, it allows a REIT to employ more leverage
than if normally would on the balance sheet. Theoretically, such a JV structure should result
in higher returns in invested equity for the REIT. Management's abi ify to generate interna
and external earnings growth, given a REIT's capita restraints, should be an important
consideration for potential investors-
Types of REITs
Having discussed the basic REIT structure, we turn to the different types of REITs. The
NAREIT Composite Index includes equity REITs, mortgage REITS, and hybrid REITs. Equity
REITs own property (land and buildings], whereas mortgage REITs focus on real estate debt,
through originating and acquiring mortgages and mezzanine loans, as well as debt
securities backed by real estate. Hybrid REITs own both real estate and rea estate debt.
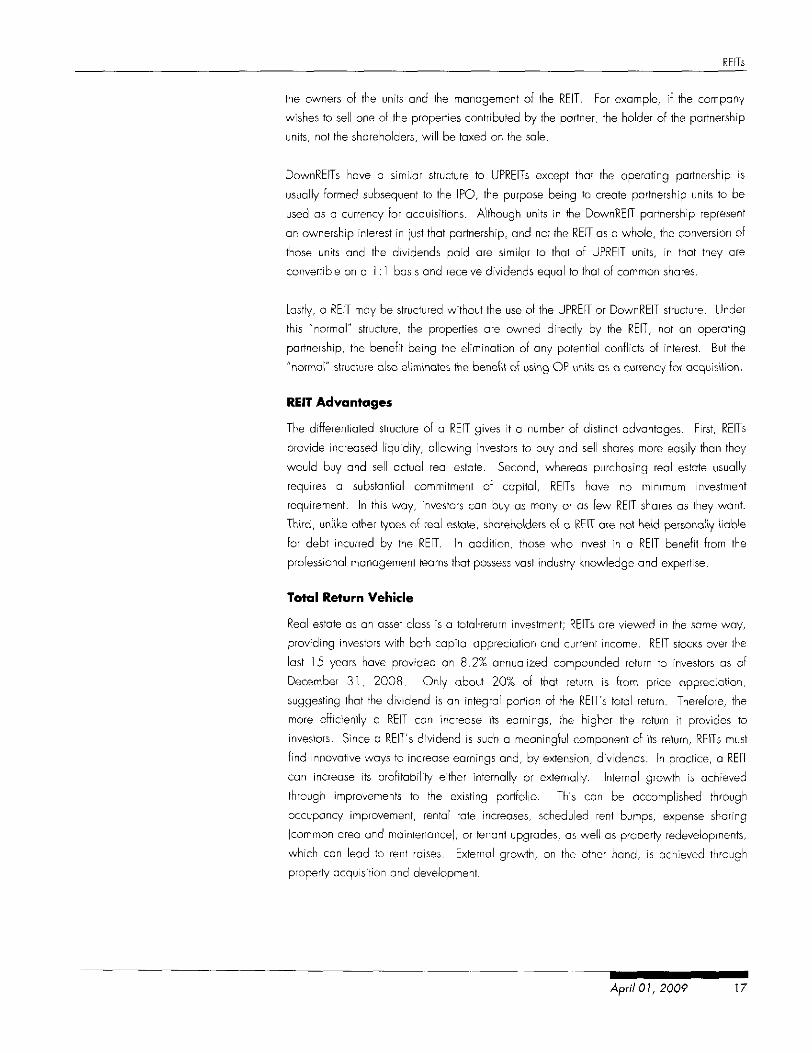
The market is currently dominated by equity REITs, which comprise 92% of the total market
capitalization; mortgage REITs tota 7%, and hybrid REITs total 1%, as of December 31,
2008.
Equity REITs are typically classified by the types of properties owned. The NAREIT Index is
segmented by property types, including office, residential (apartments), shopping centers,
and regiona malls. In Figure 2, we ist the property types by market capitalization and
type, and in Figure 4, we list the largest companies by sector.
April 01, 2009
REITs
Figure 2: Types of U.S. Listed REITs by Equity Market
Capitalization, as of 12/31 /08
HybridREITs
1%Mortgage
REITs7%
Figure 3: Listed U.S. REITs by Property Type (based on
equity market capitalization), 12/31 /08
Regional Malls Self Storage
Shopping Centers14%
Lodging/Resorts4%
Figure 4: Largest Companies by Sector, as of December 31, 2008
RESIDENTIAL SECTORAPARTMENTSEquity ResidentialAvalonBay Communities Inc.Essex Property Trust Inc.UDR Inc.Camden Property TrustBRE Properties Inc.Home Properties Inc.Apartment Investment 8. WlanagemenMid-America Apartment Communities
TickerEQRAVBESSUDRCPTBREHMEAIVMAA
Total EquityMarket Cap(millions)
$ 8,037.82$ 4,662.96$ 2,056.52S 1,877.93$ 1,665.74$ 1,426.46$ 1,310.66S 1,169.45$ 1,047.59
DIVERSIFIEDVornado Realty TrustWashington Real Estate Investment Trust
HEALTHCAREHCP Inc.Ventas Inc.Health Care REIT Inc.Nationwide Health Properties Inc.Senior Housing Properties Trust
TickerVNOWRE
HCPVTRHCNNHPSNH
Total EquityMarket Cap(millions)
$ 9,269.56S 1,482.61
$ 7,016.16$ 4,796.40S 4,365.75$ 2,853.31$ 2,051.64
COMMERCIAL SECTOROFFICEBoston Properties Inc.Alexandria Real Estate Equities Inc.Highwoods Properties Inc.Mack-Cali Realty Corp.Corporate Office Properties TrustDouglas Emmett Inc.SL Green Realty Corp.Kilroy Realty Corp.Franklin Street Properties Corp.
BXPAREHIWCLI
OFCDEISLGKRCFSP
$ 6,644.27$ 1,944.65$ 1 ,737.96$ 1,608.79$ 1,583.95$ 1,583.94$ 1,477.42$ 1,107.09S 1,043.80
RETAIL SECTORSHOPPING CENTERSKimco Realty Corp.Federal Realty Investment TrustRegency Centers Corp.Realty Income Corp.Weingarten Realty InvestorsEquity One Inc.National Retail Properties Inc.Alexander's Inc.Tanger Factory Outlet Centers Inc.
KIMFRTREG
OWRIEQYNNNALXSKT
$ 4,867.68$ 3,649.59$ 3,251.005 2,413.81$ 1,801.34$ 1,357.08S 1,347.21$ 1,295.04$ 1,189.60
INDUSTRIAL REGIONAL MALLSPro Log isAMB Property Corp.
FLEX - OFFICE/INDUSTRIAL
PLDAMB
3,689.992,292.76
Liberty Property TrustDuke Realty Corp.
. SNL, Bora'oys Capital
LRYDRE
2,240.941,615.12
Simon Property Group Inc.Macerich Co.Taubman Centers Inc.
STORAGE
SPGMACTCO
Public Storage
$11,996.86$ 1,382.20S 1,347.02
PSA $13,528.86
There ore two types of mortgage REITs, commercia and resicfentia . Commercial mortgage
REITs invest primarily in loans and securities backed by commercial properties. The
companies typically run a matched book of assets and liabilities, with the focus on credit
risk management, as opposed to interest rate risk management carried out by the
residential mortgage REITs.
April 01,2009

REITs
Rapid Growth
Residentia mortgage REITs focus primarily on originating and acquiring single-family home
loans. The companies thrive during a strong housing market accompanied by a steep yield
curve. Beginning in 2005, the stocks suffered as the flat yield curve dissolved profits. This
led many residential mortgage REITs to cut dividends—a practice that is not uncommon in
the sector and contributes to clearly defined boom and bust cycles. In addition, in 2007,
several residential mortgage REITs encountered excessive delinquencies on their oans,
which led to o liquidity crisis that forced several out of business. Finally, during 2008's
credit crunch, we saw many mortgage REITs close their doors. Two years ago, there were
38 mortgage REITs; as of December 31, 2008 there are 20.
As of December, 2008, 1 36 public REITs wilh an aggregate equity matket capitalization
of $191 billion (down 56% from $438 billion at the end of 2006) were tracked by the
FTSE NAREIT Composite Index. In contrast, the aggregate market capitalization was only
about $13 billion in 1991. Meanwhile, the number of publicly traded REITs has
decreased by approximately 28% while the market capitalization of the companies in the
index has increased by 496%.
Figure 5: Number of Companies in FTSE NAREIT Composite Index, 1971-2008
250-
1971 1974 1977 1980 1983 1986 1989 1992 1995 1998 2001 2004 2007
EO Equity • Mortgage D Hybrid
April 01 2009

REITs
Figure 6: Growth of Market Cap for FTSE NAREIT Composite Index, 1971-2008 ($ in billions)
450 -r~ ~ ~ • " " ~ ' •
350-
300 -
250-
200 -'
150_
100-'
50-'
1971 1974 1977 1980 1983 1986 1989 1992 1995 1998 2001 2004 2007
H Equity • Mortgage D Hybrid
Notwithstanding rapid growth over the last 16 years, industry experts estimate that REITs
have captured only $700 billion-$800 billion [15%-20%) of the overall institutional quality
U.S. commercial real estate market. Therefore, we believe there is plenty of potential
growth left in the publicly traded REIT market.
Market Acceptance REIT popularity and credibility have grown significantly over the last decade, leading to
inclusion in several of the major indices, such as the S&P 500, S&P 400 Mid-Cap, and
S&P 600 Small-Cap. On October 1, 2001, Equity Office Properties Trust, the largest
publicly traded office building owner and manager in the United States at the time,
became the first REIT to be added to the S&P 500. The same day, Hospitality Properties
Trust, an owner and operator of hotels, was added to the S&P 400 Mid-Cap Index. In
addition, Colonial Property Trust, a diversified REIT with properties in the office, retail, and
multi-family sectors, and Kilroy Realty Corporation, an owner of office and industrial
properties in California, were added to the S&P 600 Small-Cap Index. Since then, the
number of REITs included in the S&P indices has risen to 63.
In early 2007, Equity Office Properties and Archstone-Smith were bought out by private
equity investors, which removed them from the S&P 500, but six additional REITs joined the
S&P 500: AvalonBay Communities, Developers Diversified Realty, Host Hotels & Resorts,
HCP, Inc., Healthcare REIT, Inc., and Ventas Inc. However, over the last six months,
Developers Diversified Realty and Genera! Growth Properties were dropped for size
reasons. The number of REITs included in the S&P 500 Index is now 12, In addition, real
estate services company CB Richard Ellis was added to the S&P 500 in fourth quarter
2006, bringing the total number of real estate companies to 13. Figure 7 lists the REITs
that are currently in the major S&P indices.
April 01, 2009 21

REITs
Figure 7: REITS in the S&P Indices% Weight in
S&P 500 Inflsx y,e index S*P 400 Hid Caff IndexAIMCOAvalpnBay CommunitiesBoston PropertiesEauitv ResidentialHCP, Inc.Healtfi Care REH, inc.Host Hotels & ResortsKimco Realty CorporationPlum Creek Timber, Inc.ProLogisPublic Storage, Inc.Simon Propertv GroupVornado Realty TrustTotal
Source: NAREIT
AIVAVBBXPEORHCPHCNHSTKIMPCLPLDPSASPGVNO
0.01%0.06%0.07%0.08%0.07%0.05%0.04%0.03%0.07%0.03%0.10%0.13%0.07%0.01%
Alexandria Real Estate EquityAMB Property CorporationBRE Properties, Inc.Camden Property TrustCousins Properties IncorporatedDuke Realty CorporationEquity One, Inc.Essex Property TrustFederal Realty Investment TrustHigh woods Properties, Inc.Hospitality Properties TrustLiberty Property TrustMacehchMack-Cah Realty Co rpo rationNationwide Health PropertiesPoliach CorporationRayon ierRealty Income CorporationRegency CentersSL GreenUDRWeing3rten Realty Inyestors
Total
% Weight Inthe Index sap 60fl Small Can index
AREAMBBRECPTCUZDREEQYESSFRTHIWHPTLRYMACCUNHPPCHRYNO
REG5LGUDRWRI
032%0.26%0.22%0.23%0.07%0.23%0.08%029%0.49%0.24%0.21%0.32%0.1 8%0.22%041%0.16%038%0.33%0.41%0.15%0.29%0.21%5.71%
Acadia Realty TrustBioMed Realty TrustColonial Properties TrustCedar Shoppma CentersDiamond rock HospitalityEastGroup Properties, inc.Entertainment Properties TrustExtra Space StorageFranklin Street Properties Corp.Home PropertiesInland Real Estate CorporationKilroy Realty CorporationKite Realty Group TrustLaSalle Hotel PropertiesLexington Realty TrustLTC Properties, Int.Medical Properties TrustMid-Amenca Apartment Communities, Inc.National Retail Properties, Inc.Parkway PropertiesPennsylvania Real Estate Investement TrustPost PropertiesPS Business Parks, Inc.Senior Housing Propeties TrustSovran Self StorageTanqer Factory Outlet Centers. Inc.Total
% Weight Inthe Index
AKRBMRCLPCDRDRHEGPEPREXRFSPHMEIRCKRCKRGLHOLXPLTC
MPWMAANNNPKYPBPPSPSBSNHSSSSKT
0.13%0.32%0.13%0.09%0.13%0.27%0.26%0.25%0.25%0.41 %Q.20%0.26%0.06%0.1 3%012%017%0.12%0.30%0.41 %0.08%0.06%0.21%0.23%0.66%0.20%0.34%580%
Why REfTS? Ovet the post few years, REITs have become a viable and credible asset cass, and, as a
consequence, have attracted a good deal of investor attention. This increased focus on the
space can be attributed to a number of factors.
Dividends/Current Income
In genera , REITs provide both moderate earnings growth and ample dividends and as such
are considered total-return vehicles. Historically, approximately two-thirds of the average
REIT total onnua return has come from dividends. On average, the dividend is higher than
regular equities; since 1995 the average dividend yield for REITs is 6.1%, compared to
1.7% for the S&P 500. With such a substantial dividend, pension funds as well as other
institutional investors have historically looked to REITs as an income vehicle.
Figure 8: REIT Dividends versus S&P 500 Dividends, December 1995-February 2009
12.0% i
10.0% -
8.0% •
6.0% •
4.0% -
2.0%
00%
Dec-95 Dec-96 Dec-97 Dec-98 Dec-99 Dec-00 Dec-01 Dec-02 Dec-03 Dec-04 Dec-05 Dec-06 Dec-07 Dec-OS
NAREIT Equity Yield — Ten-Year Treasury Yield — — S&P 500 Dividend Yield
Source: Bloomberg NAKEIT
22 April 01, 2009

REITs
Commercial Real Estate Performance
A sizable portion of the exceptiona performance that REITs enjoyed for the seven-year
period leading up to February 2007 can be attributed to the commercial real estate sector
itself. With interest rates al historically ow leves, investors were willing to pay higher
prices for assets, which in turn resulted in higher REIT NAVs and stock prices. Since then,
fundamentals have remained solid, albeit moderating, but prices of rea estate securities
have declined sharply, in part because of the dissipation of the M&A bid on rea estate
stocks and more recently the credit crunch hitting the capita! markets during 2008. Price
appreciation has historically contributed approximately one-third of REITs' total returns over
the last 20 years; however, price appreciation dominated for much of the past several
years until 2007 and 2008 when REITs fell approximately 65% from their peak in February
2007.
Low Correlation with Other Indices
Another factor that helps explain REITs' recent popularity is that historically the industry holds
a low correlation with other indices and asset classes. After the tech bubble burst in March
2000, REITs garnered stronger investor interest. That said, the recent market downturn
spurred by ihe aedil crisis has increased the correlation between REITs and other indices
and asset classes dramatically particularly trading as finoncials.
Figure 9: REIT Correlation with Other indices
5-year 10-year 15-year
S&P 500 0.84 0.57 0.43Dow 0.78 0.52 0.48
NASDAQ 0.74 0.17 0.13
Long-Term Performance
Over the three-year period ending February 28, 2009, the compound average annual
total return of the FTSE NAREIT U.S. Composite REIT Index (down 33.6%) has
underperformed the S&P 500 [down 16.2%, Nasdaq (down 1 1.8%), and the Dow Jones
Industrials [17.7%j. However, this underperformance appears to be a short-term trend.
Over the last 15 years, the compounded annual total return of the FTSE NAREIT U.S.
Composite REIT Index (8.2%) has outperformed the S&P 500 (6.4%), Nasdaq (4.8%), and
the Dow Jones Industrials [8.1%).
April 01,2009 23

REITs
Figure 10: Five-Year REIT Performance versus Major Indices, February 2004-February 2009
Feb-03 Feb-04 Feb-05
—NAREIT REIT Index
Feb-06
- Dow -
Feb-07
S&P 500
Feb-08 Feb-09
-NASDAQ
Figure 11:15-Year REIT Performance versus Major Indices, October 1 992-February 2009
Feb-93 Feb-95 Feb-97 Feb-99 Feb-01
• NAREIT REIT Index Dow
Feb-03 Feb-05 Feb-07 Feb-09
— S&P 500 NASDAQ
Strong Returns Attracted Fund Flows Notably, REITs were one of few investment alternatives where an investor could get steady
double-digit returns for the several years up unti early 2007, and money flowed into real
estate, both at the direct level and from the securities side, as rea estate's attractive return
potential fueled demand and drove stocks and property values higher. According to AMG
data, $23.3 billion flowed into dedicated REIT mutual funds from 2002 through 2006.
During the first 10 months of 2007, that trend reversed, with $3.9 billion flowing out of the
sector, bringing the six-year net inflows down to $19.4 billion, which is still substantial
growth. Manifestations of this liquidity include the merger/acquisition activity of 2006 and
early 2007, privatizations, and the fotmation of institutiona joint ventures. However, we
caution that it remains unclear whether the recent shift in sentiment will fue further outflows,
24 April 01,2009

REITs
or whether investor allocations have stabilized; we are at an inflection point, in our
opinion.
Figure 12: Fund Flows, January 1998-February 2009 ($ in billions)
$4.0RE Mutual Fund Net Flow
-$3.0 -1-
Conclusion The REIT structure was originally formed to facilitate broad ownership in pools of passively
managed rea estate assets. The REIT structure has transformed over the years, converting
REITs into what they are today: actively managed, fully integrated operating companies.
As tota-return vehicles benefiting from a history of solid performance, REITs have garnered
additional investor interest and continue to gain traction. Our sense is that the benefits
afforded by the REIT structure will facilitate further growth of this evolving industry.
April 01, 2009

REITs
26 April 01 2009

REITs
Part Two: History
Apr!) 01,2009 27

REITs
Part Two: History
The REIT structure has evolved from a passive investment vehicle to on actively managed,
fully integrated operating company. Over the past 50 years, a series of legislative and tax
code changes as well as economic cycles have shaped the growth of the REIT industry.
After a sow start, the group picked up steam in the early 1970s before the OPEC oil
embargo led to rising inflation and an eventual rea estate slump. Since that time, the real
estate industry, and by extension, REITs, have experienced some well-pronounced boom
and bust phases, but over the past several years, the REIT industry has matured into a more
stable, liquid, and transparent group. In our view, the real estate industry has been
irrevocably transformed over the past 10 years by the migration of assets and talent into the
public markets. In that time, we think the public real estate companies have become an
important repository of value creation and operating talent. In this section, we discuss key
events that shaped the industry over the last 45 years as the REIT structure evolved into a
viable and credible asset class.
:igure 13: Timeline
5,000 •
4.500 -
4,000 •
3.500 •
3.000 •
2.500 •
2,000 •
1,500 •
1.000 •
500-
0 -
OPEC OilEmbargo
I
of REIT History versus Sector
TaxFEconomic Acto
Recovery Actof 1981
I— J
Stock Performance, January 1 972-February 2009
Private Equity Boom2004-Feb2007 ^
•' *£
IPO Boom / y
1993-1994 J *\fJ* V ii
Modem REITeform1986
.
egins
'' ^^«^w%^
RMAof 1999 M -
I,1 / •• j.
-/ '' \
/**''•' m^^^
. •mtf,**«*
1971 1973 1975 1977 1979 1981 1983 1985 1987 1989 1991 1993 1995 1997 1999 2001 2003 2005 2007
An Era Begins The REIT era was born with the Real Estate Investment Trust Act of 1960. Until the passing
of the act, commercial real estate was primarily owned by wealthy individuals,
corporations, and institutional investors. This law enabled individual investors to pool
capital into a corporate structure and thus reap the benefits of income-producing real estate
ownership. REITs afforded smaller-scale investors the ability to own larger-scale assets in a
diversified, professionally managed, liquid vehicle.
The 1 960 Trust Act was an outgrowth of the Massachusetts Business Trust Act of 1 827. A
business trust is defined as an entity that is formed to hold property; it is managed by
trustees for the benefit of shareholders in the trust. The REIT Act of 1 960 essentially applied
the same concept to real estate. Conceptually, a REIT is like a mutual fund in that both
REITs and mutual funds manage a pool of assets and pass along the cash flows from their
portfolios to investors, thereby avoiding paying corporate taxes.
28 AprifOJ, 2009

REITs
Growing Pains The new investment vehice was not very popular throughout most of the 1960s. In fact, it
took a most five years for the first REIT, Continental Mortgage, to be traded on the NYSE.
Throughout most of the decade, only 10 publicly traded REITs were established, with an
aggregate market capitalization of just greater than $200 million. The unpopularity of
REITs at the time of their inception was, in our opinion, due to the many restrictions the Act
placed on companies- For example, at that time a REIT was only able to own property,
not manage or operate it.
The first REIT IPO boom occurred from 1969 to 1974, as a number of mortgage REITs
(more than 50) were formed. Many larger banks formed mortgage REITs primarily for three
reasons: to gain o share of the thriving construction loan market; to originate loans off
balance sheet [to minimize the amounts of reserves that the bank was required to maintain];
and to generate fee income from management of the REIT (at this time all REITs were
externally managed]. The surge in the number of REITs coupled with questionable
underwriting standards set the stage for the next 1 0 challenging years.
Inflation
Tax Reform Act of 1986
The 1970s were a difficult decade for the economy, and the REIT industry was not
immune. Rising oil prices triggered by the OPEC oil embargo in 1973 caused inflation to
spike. As a result, the Consumer Pricing Index [CPI) increased 6.3% in 1973, and rose to
a peak of 11 .3% in 1979. Rising inflation led to higher interest rates, significantly
affecting the mortgage REIT industry. While REITs provided mortgage loans at fixed rates
to builders and investors, the liability side was funded at floating rates. Floating rates
reached a level where REITs faced negative spreads between their assets and liabilities.
As a result, and combined with the impact of excess liquidity, many of these companies
went bankrupt.
During the first half of the 1980s, the rea estate industry recovered from the tough
conditions it faced in the ate 1970s. However, REITs, viewed as illiquid and unprofitable,
were still tainted. The negative investor perception of REITs was compounded by the
Economic Recovery Act of 1 98 1, which created a tempting tax shelter for other real estate
ownership formats. The act allowed for accelerated depreciation and, by extension, the
shielding of taxable income. This shelter applied only to privately owned rea estate, not
REITs. Subsequently, funds flowed away from REITs and into real estate limited
partnerships, which offered high returns on capital brought about by the accelerated
depreciation tax shield. A buying spree for tea estate then ensued, driving asset prices to
all-time highs. Private partnerships also had the ability to pay higher prices for real estate
as a result of better after-tax cash positions than REITs. Lastly, many developers felt the
need lo capitalize on this hot market, creeling an abundant amount of supply as a result of
excess liquidity, driving down rental rates and planting the seeds of a real estate downturn.
Weakening fundamentas due to excess supply were compounded by the Tax Reform Act
of 1986, which eliminated the tax shelters real estate investors enjoyed. Specifically, the
depreciation period was lengthened, eliminating the accelerated depreciation and
associated tax benefit. As a result, the ability of limited partnerships to deduct interest,
depreciation, and passive losses was limited. This caused substantia distress in the private
April 01 2009 29

REITs
Seeds of a Downturn
Health Care REITs Boom
real estate market as investors could no onger cover their debt service; delinquencies and,
in turn, foreclosures Increased.
The Tax Reform Act did provide one key benefit for REITs. Until 1986, a REIT was limited to
solely owning properties and was restricted from operating and managing them. The Tax
Reform Act of 1986 removed those restrictions, allowing REITs to both own and operate
properties, giving more control to management and therefore an increased influence on
earnings. The act laid the groundwork for REITs to become actively managed, fully
integrated operating companies and led to the IPO boom of the mid-1990s.
The robust level of inventory built throughout the 1 980s purely for tax reasons rather than a
need for space, together with the Tax Reform Act, which removed most of the tax benefit of
privately owned commercial rea estate, resulted in economically unviable assets and a
wave of foreclosures. These factors contributed to the real estate downturn of the late
1980s/early 1990s. During this period, commercial rea estate values declined 30%-
50%. This crisis affected the REIT market as well. Rising vacancy rates and reduced rents
led to declining revenues and high dividend payout ratios, forcing a large number of REITs
to cut dividends; in turn, share prices dropped sharply. The total return for REITs in 1990
was negative 14.8% [versus the S&P 500, which was down 3.1% on a tota return basis),
at the time, the index's worst annual return since 1974.
Although the REIT recovery and IPO boom did not occur until the early 1990s, some
sectors experienced a rebirth even earlier. The health care sector, in particular,
experienced this growth in the second half of the 1980s. During these years, an
increasing number of health care facility owners looked to monetize their balance sheets,
by transferring their properties into a REIT structure. The health care provider then leased
back the space from the REIT to conduct its operations. Companies such as Health Care
Property Investors, Inc. [1985], Nationwide Health Properties, and Vencor (1989, now
called Ventasl went public over the remainder of the decade. This IPO wave continued in
the early 1990s as National Health Investors, Omega Healthcare Investors (1992], and
Healthcare Realty Trust (1993] went public. Currently, three of the 15 REITs in the S&P
500 are Health Care REITs.
Recovery ana' ExpansionIn the early 1990s, however, the REIT recovery began in earnest. From 1991 to 1993,
total annual returns for REITs averaged about 23.3% [versus the S&P 500, which average
total annual returns of 15.6%]. A portion of this return can be attributed to a market
correction for the stocks after having been heavily penalized in prior years. REITs were
able to acquire an abundant number of properties at discounted levels.
More broadly, many real estate companies were facing insolvency in the early 1990s
because of a lack of capital to fund new investments. Banks had tightened their lending
standards after experiencing an influx of foreclosed properties during the real estate
downturn. Therefore, real estate developers sought alternative venues with which to fund
their projects. Their solution was to go public, in order to raise the additional capita
needed to repay debt to remain solvent and subsequently fund growth. In addition,
April 01, 2009

REITs
management teams felt that by securitizing their portfolios it would make these companies
stronger and more competitive; with this, an era was born. Kirnco, the largest owner of
shopping centers nationwide, went public in November 1991. New REIT structures such
as UPREITs and DownREITs provided liquidity to previously illiquid partnerships by solving
the capital gains tax issue. In November 1992, Taubrnan Centers, Inc. became the first
public REIT with an UPREIT structure. These factors positioned the REIT industry to
experience the strong growth that has put the industry on the map today.
Simultaneously, the Federa Reserve Board was reducing interests rates in an attempt to
bring the national economy out of its long recession, which aided REITs in two ways: 1) the
cost of debt capita was reduced, contributing to the wave of acquisitions; and 2) the yield
on T-Bills dropped to [ust 3.1% by year-end 1993 from 6.2% in January 1991. REIT
dividend yields at ihe lime provided investors a higher income return on a relatively slable
asset.
The aforementioned catalysts enabled the REIT industry to take on a new identity in the
early 1990s. In 1993 alone, 100 REIT equity offerings (including secondaries) occurred,
raising more than $13.2 billion. At the end of 1994, the market capitalization for all
equity publicly traded REITs was about $39 billion, compared with $5.6 billion at year-
end 1990.
Figure 14: REIT IPO Boom of 1993-96
1992 1993 1994 1995 1996
April 01, 2009 31

REITs
Omnibus Budget Reconciliation
Act of 1993
Modernization Act of 1999
Increased investor interest in REITs can further be attributed to the Omnibus Budget
Reconciliation Act of 1993.' Prior to the Act, there were several ownership restrictions
placed on institutional ownership of REITs. However, after the Act was passed, these
restrictions were reduced and other changes were made. For example, a pension fund
was no longer viewed as a sing e shareholder, but instead, each member in the fund was
counted individually- Therefore, it became easier for pension funds and other institutional
investors to own REIT shares, in turn driving demand, causing share prices to appreciate.
In addition to the Omnibus Budget Reconciliation Act of 1993, the Taxpayer Relief Act of
1997 allowed a REIT to provide a small amount of noncustornary services to its tenants.
This concept was further enhanced with the REIT Modernization Act (RMA) of 1999, which
went into effect in 2001. The Act provided more flexibility as it allowed REITs to create
Taxable REIT Subsidiaries2 |TRS), increasing the potentia income sources. Also, the
dividend payout requirement was reduced, from 95% to 90% of taxable income,
increasing potential retained earnings.
The REIT boom continued throughout the mid-1990s. In 1996, the NAREIT Equity REIT
Index produced a total return of 35.3%, followed by a total return of 20.3% in 1 997. This
growth was largely attributed to higher earnings growth stemming from acquisitions and
development. As aforementioned, low real estate values, combined with attractive costs of
capita , provided companies with the opportunity to grow their portfolios accretively.
Furthermore, the significant demand for real estate caused rea estate prices to rise, leading
existing portfolios to be revalued upward, which drove share price appreciation.
Jobs and Growth Tax Relief
Reconciliation Act of 2003
The Jobs and Growth Tax Relief Reconciliation Act of 2003 cut income tax rates on most
dividends and capital gains to individuals to 15% from the ordinary marginal income tax
rate (35%). The premise was to eliminate double taxation. However, REITs do not qualify
for the tax cut because they generally do not pay corporate taxes; therefore, the portion of
REIT dividends taxed as ordinary income pay the ordinary marginal rates. Taking into
consideration the various components of REIT dividends (ordinary dividend, capita gains,
return of capita , etc.), however, the all-in rate is less. We note, however, that even as the
A REIT has to abide by the five-or-fewer rule, stating that 50% of the REIT cannot be owned byfive or fewer individuals, a rule put into effect to prevent large blocks of ownership. It was alsorequired that a REIT must be owned by at least 1 00 shareholders. Prior to the Omnibus Budget
Reconciliation Act of 1993, pension funds and other large institutional investors were counted asa single shareholder, hence limiting their ability to own big blocks of shares.
A taxable REIT Subsidiary provided REiTs three basic benefits. First, ihe ability to provide services to itstenants creates on atmosphere of greater loyally between tenant and landlord Second, ihe REIT cangenerate more income as il charges for the additional services offered. Third, it enables a REIT to havegreater control over ihe quality of services provided to clients. Even with the reduction in restrictions, thereare still guidelines to which the REIT must adhere. A TRS cannot exceed more than 20% of the REIT's grossassets or income.
Other provisions in the RMA are as follows: The dividend distribution requirement lor REITs was reduced toonly 90% of taxable income from 95%. The distribution level was returned to the original level that had beenestablished in 1960 after having previously been raised in 1976. The reduction in the mandatory payout forREITs gave the companies more flexibility when il came lo paying their dividend and allowed for moreretained earnings for investment.
April 01, 2009

REITs
relative spread between REIT yields and other investment alternatives has narrowed, there
has been no discernible trading impact,
Largest LBO Ever Over the next severe years, a combination of historically low interest rates and
strengthening fundamentals brought upon one of the largest commercial real estate bubbles
in history. In what represented the height of the bubble, on February 9, 2007,
Blackstone's acquisition of Equity Office Properties, the largest REIT at the time, closed for
$38.3 billion, which was considered the lorgest leveraged buyout in history. The
agreement was concluded after a two-month bidding war between Blackstone and
Vornado Realty which topped Blackstone's bid in va ue, but included partia stock in the
deal. Equity Office Properties choose to take the oil-cash bid by Blackstone. The deal
effectively was a way for Blackstone to acquire the assets at a wholesale value and then
sell off large chunks of the portfolio at retail prices.
A Question of Survival We believe it is fair to say the bull market for real estate broadly—including single-family,
commercial property and real estate stocks—came to an end in February 2007, coinciding
with the closing of the EOF merger and with the bankruptcy of New Century. During the
summer of 2007, fixed income funds that were invested in RMBS first began to disclose
problems that filtered through the capita markets and caused widespread problems in the
debt securitization markets. The group fell 18% in calendar 2007 (versus the S&P 500,
which gained 3.5%). In 2008, severa banks either decared bankruptcy or became
forced sellers at distressed prices; REIT stocks were flat for the first nine months of the year,
and then, following the Lehman Brothers bankruptcy filing, risk spreads across all asset
classes gapped out, and REITs began their sharp fall. The driver was widespread market
concern that the credit crisis would eliminate capital flow to rea estate for an extended
period of time, if not forever, and force asset values down. The market appeared to be
pricing in an immediate mark to market of all REIT assets and liabi ities, resulting in no
implied equity value; stocks began to trade as if the underlying companies were insolvent,
reflected in materially wider REIT credit default swap spreads. We believe the imperative to
mark what is in essence a long duration asset, typically with matched and staggered debt
maturities, is misplaced. Furthermore, the implicit dependence on NAV gives no value to
the company's franchise or value creation ability. One of the primary advantages of the
REIT structure for the ownership of commercial real estate is the vehicle's access to equity
and debt capita at the corporate eve . Most of the REITs we cover continue to have access
to capita , albeit at more expensive leves than two years ago, and we believe they have
the liquidity to hold onto the bulk of their assets without being forced to sell. This ability to
hold onto assets through the downturn, even if it asts several years, should render the
insolvency-level valuations moot for most REITs.
April Ot, 2009 33

REITs
;34 April 01, 2009

REITs
Part Three: Fundamental Overview
April 01,2009 35

REiTs
Part Three: Fundamental Overview
REITs are pass-through vehicles, and therefore real estate fundamentals such as occupancy
and rent levels matter. Although some real estate property types are more cyclical than
others, the phases of their cycles and underlying fundamentals are similar. To better
understand how the underlying fundamentals are influenced, and in turn affect REIT
performance, we analyze some of the industry's main drivers. Many macroeconomic
factors as well as the overall health of the economy affect the REIT industry generally, while
each property type also is affected by specific factors, including job growth, interest rates,
and demographics. While we did not set out to write the definitive text on real estate, our
intent is to highlight those fundamenta drivers that we think have a material impact on the
various property types.
Job Growth
Job growth affects every property type in some form. The increase in the number of jobs
results in more people looking for places to live and has a direct impact on the multi-family
sector. More jobs translate into more consumer spending as empoyees spend their earned
income boosting retai. This affects the manufacturing sector, which in turn provides a
boost for the industrial sector. However, job (particularly white-collar) growth has the most
direct impact on the office sector.
Interest Rates
Another key macroeconomic factor that clearly affects real estate is the level of interest
rates. Mortgage rotes, which historically move in tandem with Treasury interest rates,
directly affect the cost of borrowing for new projects. A developer might scale back/slow
down development if he ot she is faced with higher borrowing costs. On a more global
sco e, interest rates also affect the overall health of the economy. Historically, the economy
has expanded during periods with low interest rates and hence lower borrowing costs.
This expansion usually has a positive influence on REITs. Conversely, when rates ore high,
the economy historically has contracted, negatively affecting REITs.
From a property sector perspective, rates have a direct, meaningful impact. Higher interest
rates and mortgage costs make home ownership more expensive, therefore increasing
demand for rental units and improving the pricing power of the landlords. Furthermore,
when rates are high, the economy generally contracts, leading to slower or negative job
growth. As a result, multi-family and office vacancies increase. The tetail and industrial
sectors are affected peripherally as interest rates have an impact on consumer spending,
Demographics
Yet another key macroeconomic factor is demographics. The demographics of a given
population have o significant impact on the industry. For example, the density of the
population in an area, the expected population growth, the age of the population, and the
average household income ore all important considerations and directly affect the various
sectors of the REIT industry. Population density, growth, and age influence demand for the
multi-family and retai sectors. Peripherally, the population level affects the industrial sector,
36 AprilQ], 2009

REITs
because the larger the population, the more manufactured goods are consumed by that
area. Average household income affects the retail sector as consumer spending is the most
important driver in the space. In addition, this demographic plays a vita roe in the multi-
family sector as affluence is a main driver of housing affordability.
Supply versus Demand
Real estate may be thought of as the supply and demand of cubic feet. Job growth,
interest rates, and demographics are key demand drivers. If the property market is in
equilibrium (supply meets demand), then occupancy and rents should be stable.
Conversely, if there is an imbalance of supply and demand, then pricing will be skewed.
If supply exceeds demand, either the result of a drop in demand for rea estate with
constant supply or overbuilding at a time of constant demand, vacancies will increase,
causing a shift of pricing power to the tenant. As a result, asking rents will drop.
Conversely, an increase in demand with stable supply, or stable demand coupled with a
decrease in supply, would drive declining vacancy. In that scenario, pricing power is
shifted to the landlord and asking rents should increase.
The opposing forces of supply and demand manifest themselves in changes of occupancy
and rental pricing power. All equity REITs generate a substantial portion of their revenue
from rents. "Rents are determined by the going rates in the assets' respective markets.
Once a price has been set, the lease term—the duration of the agreement between the
tenant and landlord —is determined. The term of ease varies by property type. The
shortest term is in the apartment sector (about 1 2 months), while the longest term is in the
retail sector (20-30 years for anchor tenants and 10 years for in-line retailers).
Another key factor is portfolio rollover. Rollover is the percentage of the leases in a
portfolio that is expiring during any given year. The lower the rollover, the more revenue
stability the portfolio has. However, in certain instances this may backfire as a landlord
might have several long-term leases locked at below-current-market prices. With minima
rollover, landlords might not be able to capture the revenue upside.
Real Estate Cycle
Analysis of the main drivers of the REIT industry can help one better understand the real
estate cycle. An imbalance in supply/demand influences the real estate cyce. If there is a
drop in demand, a result of an economic decline, vacancies typically rise, leading to lower
rents. As a consequence, revenues decline and prices drop. If real estate fundamentals
weaken substantially, the industry goes into a recession. As fundamentals improve, usually
coinciding with an economic recovery, occupancy increases, leading to an increase in
rents and an eventual return to equilibrium. A strengthening economy drives occupancies
higher, causing rents to spike. This eventually results in another imbalance. Developers
that want to take advantage of positive fundamentals will begin construction projects,
which will eventually increase supply. This oversupply, without a change in demand, will
cause vacancies to increase, resulting in lower rents and potentially bringing the industry
April 01,2009 37

REITs
bock into recession. The rea estate cycle affects all property types, some more profoundly
than others.
Multi-family REITs
Having provided a broad overview of the main industry drivers, we will discuss the specific
factors that influence supply and demand for each of the four main property types.
The multi-family industry serves millions of people nationwide, fulfilling a basic need:
shelter. Like the other REIT sectors, the opposing forces of supply and demand are key
factors affecting the sector's growth prospects. Key demand drivers of the industry include
job growth, demographic trends such as household formation, and single-family housing
affordabi ity (linked to single-family home prices and mortgage rates).
The Demand Side
The sector's most notable driver of demand is job growth. As the economy expands, jobs
are created, driving demand for housing. To illustrate, the multi-family industry decline of
2001-03 can be largely attributed to a considerable oss of jobs over that period. In
contrast, one of the contributors to the multi-family market turnaround was the substantial job
growth that began in 2004 and continued through 2007. Slowing employment growth,
partially dtiven by layoffs in the residentia mortgage, construction and the financial
industries, may prove to have a arge impact on demand, depending on how the economy
fares. Barclays Capital's Economics team expects 3.5 million job losses in 2009 and 1.3
million jobs created in 2010.
Figure 15: Employment Growth and HouseholdFormation, 1976-2008
1976 1930 1984 1988 1992 1996 2000 2004 2008
• % Chg in Employment -~-**™%Ch9iri Number of Housertotds
Figure 16: U.S. Job Growth, 2000-1OE (in OOOs}
2,0472,544
2,139
-3,078-3,525
2000 2001 2002 2003 2004 2005 2006 2007 2008 2009E 2010E
Aprf/Oi, 200?
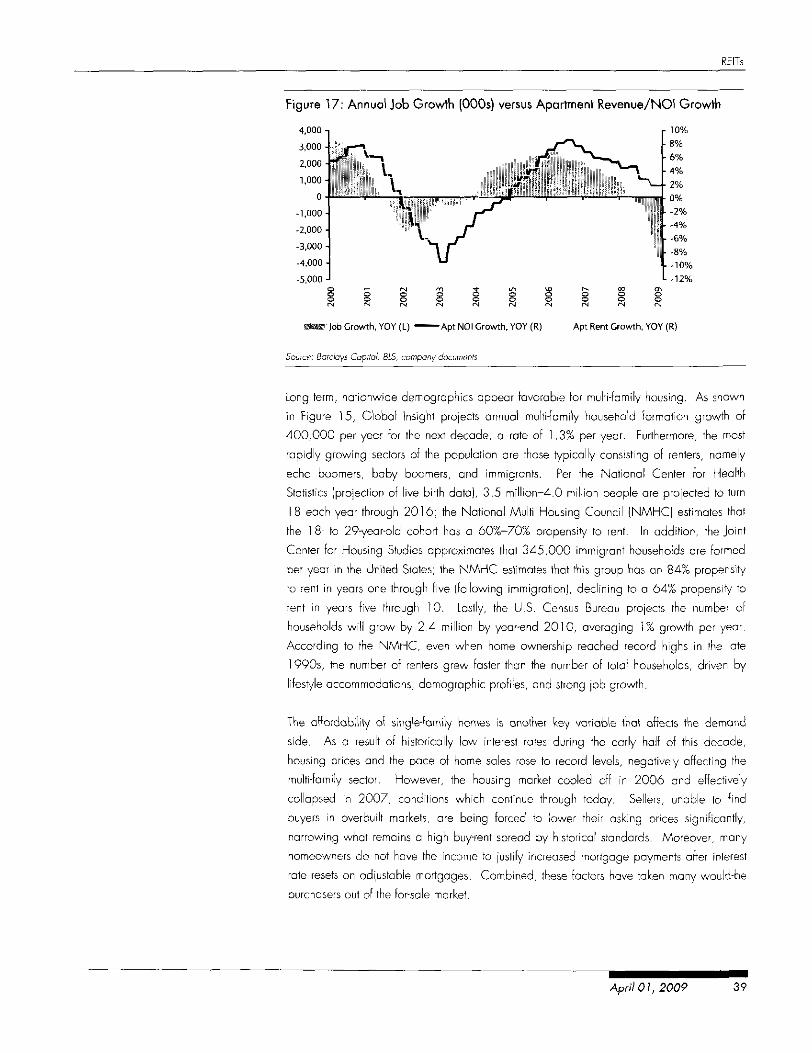
REITs
Figure 17: Annual Job Growth (OOOs) versus Apartment Revenue/NOl Growth
lob Growth, YOY(L) • Apt NOI Growth, YOY(R) Apt Rent Growth, YOY (R)
Long term, nationwide demographics appear favorable for multi-family housing. As shown
in Figure 15, Global Insight projects annual multi-family household formation growth of
400,000 per year for the next decade, a rate of 1,3% per year. Furthermore, the most
rapidly growing sectors of the population are those typically consisting of renters, namely
echo boomers, baby boomers, and immigrants. Per the National Center for Health
Statistics (projection of ive birth data), 3.5 rnillion-4.0 million people are projected to turn
18 each year through 2016; the National Multi Housing Council (NMHQ estimates that
the 18- to 29-year-old cohort has a 60%-70% propensity to rent. In addition, the Joint
Center for Housing Studies approximates that 345,000 immigrant households are formed
per year in the United States; the NMHC estimates that this group has an 84% propensity
to rent in years one through five (following immigration), declining to a 64% propensity to
rent in years five through 10. Lastly, the U.S. Census Bureau projects the number of
households will grow by 2.4 million by year-end 2010, averaging \% growth per year.
According to the NMHC, even when home ownership reached record highs in the late
1990s, the number of renters grew faster than the number of total households, driven by
lifestyle accommodations, demographic profiles, and strong job growth.
The affordabilily of single-family homes is another key variable that affecls the demand
side. As a result of historically low interest rates during the early half of this decade,
housing prices and the pace of home sales rose to record leves, negatively affecting the
multi-family sector. However, the housing market cooled off in 2006 and effectively
collapsed in 2007, conditions which continue through today. Sellers, unable to find
buyers in overbuilt markets, are being forced to lower their asking prices significantly,
narrowing what remains a high buy-rent spread by historical standards. Moreover, many
homeowners do not have the income to justify increased mortgage payments after interest
rate resets on adjustable mortgages. Combined, these factors have taken many would-be
purchasers out of the for-sale market.
April 01, 2009 39

RElTs
Wiften Advisors estimates that, at just under 50%, the percentage discount of the median
rent to principal and interest on a median-priced single-family home is at levels not seen
since the early 1980s. Renting and buying were al patily in 2004 after a decode of a
renta premium; since then, the rental discount has increased rapidly, reflecting the sharp
rise in the median cost of a single-family house, to a high of 1 04% in 3Q06, before falling
to the current 48%- Witten estimates that the affordability gap for the trailing 10 years was
about 57%. This pricing differential has helped rental demand, but housing prices are
falling, indicating that renta rates must fall in order for the rental discount to persist.
Figure 18: Rent versus Buy Spread, 1995-2008
-< oc I5 ~o
120% -j
100%-
80% •
60% -
40% •
20% •
0%
Average: 50.6%
1995 1996 1997 1998 1999 2000 2001 2002 2003 2004 2005 2006 2007 2008
The Supply Side
When analyzing the supply side of multi-family, building permits issued for new construction
are a good forward indicator of new supply, as the number of permits issued directly
affects the number of eventual construction starts. Excess building typically occurs in
tandem with simultaneous downturns in demand, and results in higher vacancies, lower
rents, higher concessions, and declines in revenue for landlords. However, over the past
decade or so, builders have become more disciplined and are able to better forecast drop-
offs in demand and adjust their deliveries accordingly. The cost of construction (material
and labor) was also up considerably over the past few years, although it has moderated
over the past few months. Therefore, many developers opted to cut back the construction
of rental apartments, instead focusing on for-sae development over the last few years,
which only recently has become unfeasible.
Multi-family supply has been very stable from 1 999 through 2008 at between 190,000
and 230,000 units annually, or an average of 1.6% of existing supply, according to CBRE
Econometric Advisors. However, given the economic downturn, CBRE expects completions
to fall below 1% of existing inventory for each year from 2009 through 2014, for an
average of 107,000 units per year and a low of 59,000 in 2010. Notably, however,
there was a coinciding surge in new condominium units and REIS estimates (hat 316,000
apartment units were removed from the rental supply through condo conversions between
40 April 01, 2009

REITs
2003 and 2006. However, many of those units are now re-entering the rental market and
developments originally scheduled to be condos are being finished as rentals.
The most recent housing bull market was unusual in that investors who never planned to live
in their units took advantage of ax lending standards to acquire assets, in turn fueling
appreciation and, ultimately, overbuilding. The subprime fallout led to lower prices and a
surge in foreclosures, and investors who purchased single-family houses or condos with the
intent to quickly resell them have been left unable to find buyers. The result is about 1 3
months worth of for-sale inventory on the market at the current sales pace; an expected
increase in foreclosures is poised to exacerbate the situation. Many of these unsold
condos and single-family homes are now finding their way back to the rental pool,
increasing supply. CBRE Econometric Advisors expects new supply to exceed demand in
2009, before low construction levels fall below expected net absorption of about 60,000
units in 2010; absorption is expected to pick up rapidly after that, reaching 200,000 units
in 2012. That said, there was negative net absorption in 2008 of 108,000 units,
marking the first year of negative apartment absorption since CBRE's data series begins in
1994. The negative absorption resulted in a 1 30-basis-point decline in occupancy levels.
Looking forward, CBRE expects a 90-basis-poinf occupancy decline in 2009 and
occupancy change to be just under flat for 201 0. Rental rates are a so expected to fall in
2009 (by 1.3%] before recovering in 201 0.
Despite favorable demographic conditions, the rapid increase in unemployment in most
markets, which drove negative net absorption in 2008, is expected to be a drag on
demand during 2009 and into 2010. Development pipelines and starts across the
industry are shrinking, but single-family housing supply will be an overhang. Given these
conditions, CBRE Econometric Advisors expects average occupancy increases of just 20
basis points per year, although this is made up of a 90-basis-point occupancy decline to a
low of 93.1% nationally at year-end 2010, followed by a 190-basis-point increase
through year-end 2014. Furthermore, CBRE forecasts average rental rate increases of
1.6% through 2014, lower than historical inflation rates.
April 01, 2009 41
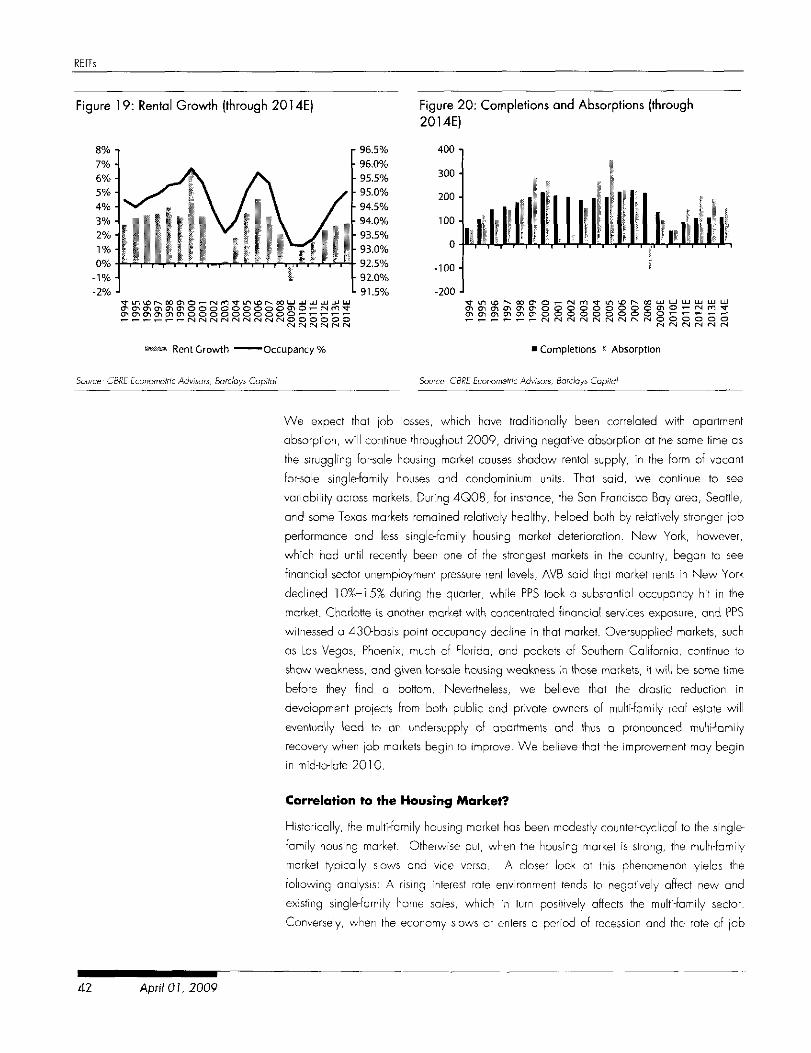
REITs
Figure 19: Rental Growth (through 2014E) Figure 20: Completions and Absorptions (through2014E)
8% -
3%2%1%0%
-1%-2%
96.5%96.0%95.5%95.0%94.5%94.0%
- 93.5%- 93.0%
92.5%92.0%
L 91.5%
400-|
300 •
200 -
100-
0
IN IN rN rs fN IN
Rent Growth "Occupancy %
-100 -
-200-
« Completions * Absorption
Source1 CBRE Econometric Advisors, Barclays Capital
We expect thai job losses, which have traditionally been correlated with apartment
absorption, will continue throughout 2009, driving negative absorption at the same time as
the struggling for-sale housing market causes shadow rental supply, in the form of vacant
far-sale single-family houses and condominium units. That said, we continue to see
variability across markets. During 4Q08, for instance, the San Francisco Bay area, Seattle,
and some Texas markets remained relatively healthy, helped both by relatively stronger job
performance and less single-family housing market deterioration. New York, however,
which had until recently been one of the strongest markets in the country, began to see
financial sector unemployment pressure rent levels; AVB said that market rents in New York
declined 10%-15% during the quarter, while PPS took a substantial occupancy hit in the
market. Charlotte is another market with concentrated financial services exposure, and PPS
witnessed a 430-basis point occupancy decline in that market. Oversupplied markets, such
as Las Vegas, Phoenix, much of Florida, and pockets of Southern California, continue to
show weakness, and given for-sae housing weakness in those markets, it will be some time
before they find a bottom. Nevertheless, we believe that the drastic reduction in
development projects from both public and private owners of multi-family real estate will
eventually lead to an undersupply of apartments and thus a pronounced multi-family
recovery when job markets begin to improve. We believe that the improvement may begin
in mid-to-late 2010.
Correlation to the Housing Market?
Historically, the multi-family housing market has been modestly counter-cyclical to the single-
family housing market. Otherwise put, when the housing market is strong, the multi-family
market typically sows and vice versa. A closer look at this phenomenon yields the
following analysis: A rising interest rate environment tends to negatively affect new and
existing single-family home sales, which in turn positively affects the multi-family sector.
Conversely, when the economy sows or enters a period of recession and the rate of job
April 01,2009

REITs
growth slows, interest rates typically pause or decline, making housing more affordable
and renting ess attractive on a relative basis.
For the past year, however, the severe downturn in the for-sale housing market has
coincided with deterioration in the multi-family renta market. The for-sale housing sector led
the economy into recession, and supply overhang from that market has exacerbated the
impact of increasing unemployment on the multi-family rental market-
Figure 21: Sales of New and Existing Single-family Homes — 1968-2008 (annual
rate, in OOOs)
OH . 1 1 1 1 , , 1 1 I-L 01968 1972 1976 1980 1984 1988 1992 1996 2000 2004 2008
•New Single-Family Home Sales (L) 'Sales of Existing Single-Family Homes (R)
Figure 22: Average Rate for Single-Family Mortgage Loans — Monthly Basis, 1989-2009
1990 1991 1992 1993 1994 1995 1996 1997 1998 1999 2000 2001 2002 2003 2004 2005 2006 2007 2008 2009
Source Federal Reserve Bonk
April 01, 2009 43

RElTs
Industrial REITs We have historically considered the industrial sector to be relatively stable and defensive,
by virtue of its traditional lease structure, short development cycle, correlation of demand
with broader economic direction, and reative ease of financing. It includes distribution
centers, bulk warehouse space, light-manufacturing facilities, and R&D facilities.
There are severa components to the industrial centers' traditional lease structure. Largely,
the terms of the lease depend on whether the project was speculative or build-to-suit. A
speculative developer has ess leverage; in order for the space to get filled, the average
lease term for speculative development is shorter [three to five years), with cheaper rents.
For a build-to-suit property, the tenant is already identified, mitigating ease-up risk. As a
result, typical build-to-suit leases have higher rent and a longer term (about seven to 10
years). Triple-net leases are common as the tenant pays operating costs, real estate taxes,
and utilities, and tenant improvement costs are relatively ow. Most leases have renewa
options and rent increases as part of their origina ease.
Supply
On the supply side, Industrie REITs benefit from short development cycles, which tends to
prevent overbuilding. Since 1992, only 2.9 billion sq. ft. were added to industrial
inventories, representing a 1.5% increase annually. Construction escalated in the late
1990s as the economy was expanding at record leves during the tech bubble, before
receding as demand declined in the early 2000s. Construction escalated again in 2004
through 2006 as the economy once again accelerated, but leves peaked well below
those of the prior cycle. As would be expected given the economy's current slowdown,
construction activity decelerated in 2007 and 2008, falling to 168.9 million sq. ft. in
2008 from a cyclical peak of 191.4 million sq. ft. in 2006. CBRE Econometric Advisors
projects completions to slow further over the next severa years (matching declining
absorption), demonstrating the Industrie sector's ability to quickly limit new supply as the
economy experiences a recession.
Figure 23: Industrial Market Completions, 1980-2014E
45°-- 400-CT
£ 350-o£ 300-
1 25°-& 200-1/1I 15°"I 100-D.E 50-ou 0
44 ApnYOf, 2009
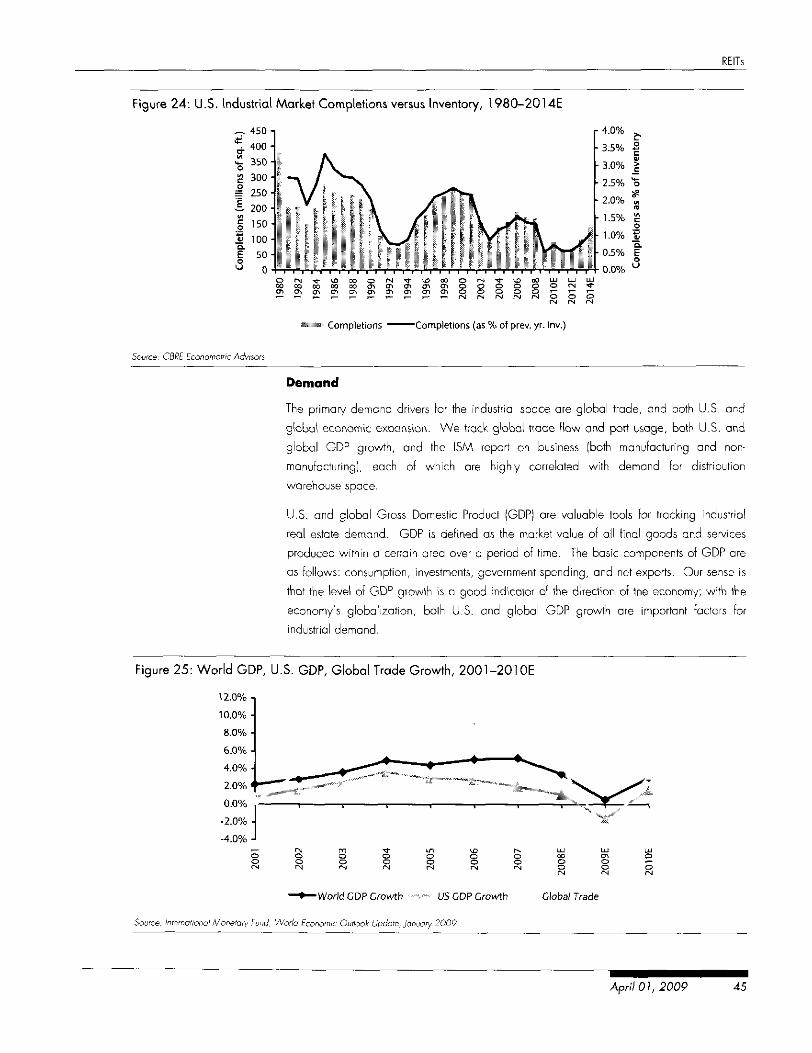
REITs
Figure 24: U.S. Industrial Market Completions versus Inventory, 1980-2014E
--. 450-
1 400-
£ 300-
I 250
& 200
I 15°5 100Q.E 50ou 0
4.0%
-3.5% |
•3.0% I
• 2.5% "5
2.0% *ra
h 1.5% £o
1.0% f
0.5% Eo
0.0% u
Completions •Completions (as % of prev. yr. Inv.)
Demand
The primary demand drivers for the industrial space are global trade, and both U.S. and
global economic expansion. We track global trade flow and port usage, both U.S. and
global GDP growth, and the ISM report on business [both manufacturing and non-
manufacturing], each of which are highly correlated with demand for distribution
warehouse space.
U.S. and global Gross Domestic Product (GDP) are valuable tools for tracking industrial
real estate demand. GDP is defined as the market vaue of all final goods and services
produced within o certain area over a period of time. The basic components of GDP are
as follows: consumption, investments, government spending, and net exports. Our sense is
that the level of GDP growth is o good indicator of the direction of the economy; with the
economy's globalization, both U.S. and global GDP growth are important factors for
industrial demand.
Figure 25: World GDP, U.S. GDP, Global Trade Growth, 2001-2010E
•World GDP Growth US GDP Growth Global Trade
April 01, 2009 45

REITs
The Institute for Supply Management [ISM] manufacturing and non-manufacturing indices
provide a real-time outlook of U.S. economic expansion. The indices are based on a
national survey of purchasing executives of approximately 300 industrial companies. A
reading greater than 50% signals that the economy is expanding. Conversely, a reading
lower than 50% signals thai the economy is contracting.
Figure 26: ISM Manufacturing and Non-Manufacturing Indices, July 1997-February 2009
80-i
70-
60
50
40
30 •
20
TO
0
Jul-97 )ul-98 |ul-99 |ul-00 Jul-01 Jul-02 lul-03 Jul-04 )u1-05 |ul-06 lul-07 |ul-08
~ISM Mfg: PMI Composite Index (SA, 50* = Economic Expansion)
—• ISM Mfg: PMI Composite Index (SA, 50* = Economic Expansion)
Source1 Institute of Supply Management
70-
5040-3020100
Jul-
97
lul- Jul- Jul- Jul- Jul- Jul- Jul-98 99 00 01 02 03 04
lul-05
lul-06
lul-07
jul-
08
ISM Non-Mfg Business Activity Index (SA, 50* = Economic Expansion)
ISM Non-Mfg Business Activity Index (SA, 50* = Economic Expansion)
Our current positive outlook on industrial stocks is despite a weak near-term fundamental
outlook; supply is correcting, but not fast enough to offset the dramatic demand declines
being felt globally. While the ISM data points to a modest rebound in recent months, both
the manufacturing and non-manufacturing index paint a picture of a slowing U.S. economy.
The IMF data show a slowdown in 2008 continuing into 2009 in all three metrics, with
U.S. GDP and global trade expected to turn negative in 2009; this should weigh
significantly on demand for distribution warehouse space. Industrial absorption turned
negative in 2008 for the first time since 2001-02, and CBRE Econometric Advisors
expects absorption to remain negative through 2010, In total, CBRE forecasts negative
absorption of 292.2 million square feet ovet the three-year period. New completions are
expected to slow, but remain positive, exacerbating the demand decline.
Figure 27: U.S. Industrial Absorption — Forward Projections, 1991-2014E
a- 300-
| 200-ET 100-
0
< -100 -I<uZ -200 J
Absorption
Apr// 01 2009

REITs
Occupancy and Rental Rates Declining
As a resulf of the weakening industrial demand, U.S. industrial occupancy fell to 88.6% at
year-end 2008 from 90.5% at year-end 2007, the firsl decline since 2003. As would be
expected given the expected negative absorption over the next several years, CBRE
Econometric Advisors forecasts that occupancy will continue to soften through 2010,
bottoming at 86-0% before beginning to recover. As occupancy levels fall, so too will
renta rates. According to CBRE Econometric Advisors, U.S. industrial rents grew an
average 0.2% in 2008, but are expected to fall for the next three years before rebounding
in 201 2. We expect the public industrial companies to continue to outperform the general
market due to their focus on stronger markets and higher-quality assets.
Figure 28: U.S. Industrial Occupancy, 1990-2014E
•Occupancy %
Figure 29: U.S. Industrial Rent Change, 1990-2014E
8.0% -,
6.0% -
4.0% -
2.0% -
0.0%
-2.0% -
-4.0% -
-6.0% •
-lllllll .h ,||I •ir Y
Rent Growth
April 01,2009 47
REITs
Scaling Back Development
During the last up-cycle [roughly 2005-07), industrial REITs took advantage of the strong
underlying industria fundamentals, surging globa demand for new space, and substantial
liquidity (both equity and debt) by growing their global development businesses. This
proved to be very profitable because of the strong underlying fundamentals, the rising
prices (and margins], and the prevailing business model that allowed the REITs to capture
an upfront developers profit in addition to manogement/incentive fees from the third-party
entities that ended up owning the assets. Heading into 2008, pricing had begun to move
away from the developers, meaning that profit margins would be squeezed, reducing the
expected gains from the development business. However, what became cear was that
development pipelines became over-extended, and over-leveraged, leading to a dramatic
scaling back of activity going forward. Both ProLogis and AMB maintain a global
portfoio, while winding down existing development projects, and will continue to generate
management fees from existing third-party funds they manage. However, incentive fees
and development profits are likely a thing of the past, at least for the foreseeable future.
Office REITs. The key demand driver for the office sector is white-collar job growth. During the 1990s,
the economy—especially technology—was expanding rapidly, creating a surge in demand
for office space. Rents spiked in certain areas of the country as technology companies
increasingly pursued scarce office space. Once the dot-corn bubble burst, the overall
economy went into a recession. This significantly affected job markets across the country,
resulting in a major downturn for the office sector in many arge cities like Boston, Denver,
New York, and San Francisco. As a result of the economic slowdown, the country lost
817,000 office jobs in 200! and 2002, leading to three consecutive years of falling
occupancy, and four years of declining rents. Beginning in 2003, however, job growth
returned, absorption turned positive, occupancies increased and rental rates spiked,
especially in key urban markets. The up-cycle peaked in 2007, which ended with a
nationwide office occupancy of 87.4%.
Demand turned negative again in 2008, with the loss of 261,000 office jobs, driving
average occupancies down to 86.0%- Expectations are that the slowing economy—
especially in the financial services market—will lead to further job losses, declining
absorption, falling occupancy evels, and rental rate declines. Some of the markets that
were the strongest during the recent up-cycle, are expected to be among the most
challenged during the downturn.
48 April 01, 2009

REITs
Figure 30: U.S. White Collar Job Growth, 1991-2014E
•Office job Growth
Figure 31: U.S. Office Absorption, 1991 -2014E
,-, 15° 1cb- 100 Hlf\c| 50E7 oo
s- -so ^oin< -100
Z -150
o i r j i o i C T i c r i C T i c n c r i C T i o o o o o o o o o o
Absorption
Supply: Not the Problem
The other key driver for the sector is the amount of office space available to ease in a
given market. When there is a steady demand with a balanced amount of supply, the
office space is in a state of equilibrium. A spike in demand with stagnant supply will result
in higher occupancy, and pricing power will shift to the landlord- Conversely, with stable
demand and a spike in supply, vacancies will increase, and pricing power will shift to the
tenant, eventually leading to lower rents.
When excess space is developed by companies when demand is strong, oversupply can
result if demand sows before the space hits the market. Unlike the industrial sector, the
office sector has a lengthy construction period, which can be attributed to a long delay
from the time a permit is received to the actual completion of the building. Even if there is
a sizable drop in demand, a project can be too far along for the builder to abort it. These
April 01, 2009

REITs
circumstances can often lead to an oversupply of inventory. However, in densely
populated commercial areas, this tends to be less of a problem as fundamentals correct
themselves much faster than in other areas.
Since 1990, only modest supply has been added to the office market. During the 1990s,
only 400 million sq. ft., averaging about ] .7% increase annually, was added to office
inventories. Most of that space was added between 1999 and 2002, on the heels of the
strong demand of the 1990s, but notable well below the peak construction levels of the
mid-1980s. Looking ahead, office construction leves ore expected to continue to decline.
Figure 32: U.S. Office Completions, 1980-2014E
200-i
£ 180-
d- 160-inc 140-o= 120-J. 100-§ 80-« 60-
40-20-0
a.Eou IL.
Completions
Occupancy and Rents Falling
In 2008, 17.8 million sq. ft. of office space was absorbed nationwide, lagging office
completions of 76.4 million sq. ft. and therefore driving occupancy down to 86.0% at
year-end (a 140-basis-point decline versus 87.4% at year-end 2007; average renta rates
grew 3.7% in 2008, down from 9.8% in 2007 [a!! according to CBRE Econometric
Advisors). CBRE Econometric Advisors projects that the United States will have negative
office absorption of 50.0 million sq. ft. in 2009, average occupancy will fall another 280
bps to 83.2%, ond rents will fall 5.4%.
April Of, 200?

REITs
Figure 33: U.S. Office Occupancy, 1989-2014E
94.0% -I92.0% -90.0% -88.0% -86.0% -84.0% •82.0%80.0% -78.0% -76.0%74.0% -72.0%
o o o o o o o o o o — — — — r-! N < N i N r N < N i N i N i N i N O O O O O O
rvi I'M rsi IN CM rvi
•Occupancy %
Figure 34: U.S. Effective Rent Change, 1989-2014E
15.0% -j
10.0%-
5.0% -
0.0%
-5.0% -
-10.0%-
iII, .010 —
Rent Growth
Still a Positive Mark-to-Market
Despiie a modest decline in average renta rates in late 2008 (1.2% in 4Q08 according
to CBRE Econometric Advisors), and expected continued declines throughout 2009 as
identified in Figure 34, we expect many office landlords to continue to see positive rental
rate increases on new leases signed throughout 2009. This phenomenon is due to the
significant market renta rate increases experienced over the past four years, coupled with
the fact that office leases tend to be relatively long term in nature (five to 10 years, on
average), meaning the rents on expiring leases were signed at low levels. Positive mark to
market is not universe ; CBD office markets are likely to have more of a cushion than
suburban markets because rents in those markets increased more, on average, over the
past few years. Current embedded mark to market will dissipate over time as new leases
are signed, and especially as market rates continue to fall.
April 01, 2009 51

REITs
Retail REiTs The reloi REIT sector, which is driven in the near term by retailer demand for space and in
the longer term by consumer spending, is relatively stable due to its long-term leases. The
performance of the industry can be attributed to the nature of the industry's two main
drivers: 1) the amount of retail space available for lease; and 2) the demand for that
space. Retail rea estate comes in three main forms: regional malls, shopping centers, and
outlet malls.
Shopping Centers
Shopping centers historically have been a popular area for real estate investment, in part
because these properties can be less expensive (depending on size and format), and,
therefore, easier to assemble into o portfolio than other types of real estate. We believe
that the shopping center sector is a stable and mature industry.
In the late 1920s, department stores proliferated throughout cities nationwide. However,
the development of trains and the subsequent proliferation of autos and highways
encouraged migration to the suburbs. This demographic shift established the platform for
shopping centers. A number of today's leading players have roots that date as far back as
the 1920s, including New Plan (acquired by Centra Properties in 2007], Weingarten
Realty, and Federal Realty. In 1962, New Plan, as a c-corporation, and Federal Realty,
as a REIT, were the first rea estate companies to take their portfolios public.
We categorize shopping centers into the following formats: 1) neighborhood centers, 2)
community centers, 3) power centers, and 4) main street retail. Each format has its own set
of business economics that depends largely upon its typical tenant base and those tenants'
sensitivity to changes in discretionary spending. Hence, each format has its own distinct
set of risk/return characteristics.
Figure 35: Shopping Centers - Shopping Center Formats
Format
NumberSize Trading of
(square feet) Radius Anchors Typical AnchorsEconomicSensitivity
Neighborhood Shopping Center 30,000-150,000 3 miles 1 or more Kroger, Publix, Albertsons, Least sensitiveSafeway
Community Shopping Center 100,000 - 350,000 3-6 miles 2 Kohl's, Home Depot, Lowe's, SensitiveWal-Mart
Power Center
Main Street Retail
Source1 ICSC
250,000 - 600,000 5-10 miles 3 or more Best Buy, Bed Bath & More SensitiveBeyond, Lowe's, Staples,Home Depot, Barnes &Noble, Toys'R" Us, Borders
80,000 - 250,000 5-15 miles none Very Sensitive
There has been steady growth (albeit at a decreasing rate) in the size of the shopping
center universe since the 1970s. Historically, the average annua new supply had been
153 million sq. ft. from 1978 to 2006, before tapering off as economic climate
weakened- We project that new supply will steadily decline over the next few years as
52 April 01 2009

REITs
developers wait out the economic downturn. A total of 74.4 million sq. ft. are projected
for delivery through 201 2, well below historical levels.
Figure 36: New Construction — Less than 800,000 sq. ft. (in millions of sq. ft.)
Sf (000)70,000
60,000
50,000
40,000 -
30,000
20,000
10,000 -
0
1980
Average - 32m sf
1984 1988 1992 1996 2000 2004 2008 2012
Regional Malls
The second properly type for retail is the regional mall. The U.S. regional mall sector has
evoved and is now a mature industry property type by the conventional business school
definition.
• Urban and Suburban Development. Although the nation's first encosed regional mall
was built in the 1950s, its roots can be traced to the department stores of the late
19th century. The predecessor of the department slore was the mail order catalog
company, specified ly companies such as Sears, Roebuck & Co. and Montgomery
Ward. However, the culture of consumption changed as the Industrial Revolution
pulled workers from farms to factories and cities. At that time, Alexander's and the
Grand Depot opened; these were known as the first "department stores." Department
stores soon proliferated in cities, but the population soon started to migrate to the
suburbs as a result of innovations in transportation. Department store companies
therefore expanded to the suburbs in the 1930s and 1940s, building large
freestanding stores where real estate was cheap and parking was available.
As more people migrated from cities to suburbs, regiona malls sprouted along new
highways. Development of malls continued unti the late 1980s. The 1980s, hailed as the
boom years for retail development, saw more retai formats created. As a result of bank
deregulation early in the decade, S&Ls were able to extend loans for new commercial reo
estate development. As a result of all this lending, overbuilding occurred. This
overbuilding caused vacancy rates to rise sharply, which eventually led to the real estate
April 01, 2009 S3

FiEITs
market downturn ol ihe end of the decade. Notably, this phenomenon was not limited to
retail rea estate, but extended essentially to all property types.
As a result of the real estate downturn, S&Ls went bankrupt because the property they
owned was worth a fraction of its purchase price. To rebound from the bank crisis in the
late 1980s, construction lenders tightened credit standards and began requiring more
equity from developers. This set the stage for public REIT explosion in the 1990s as many
private developers turned to the public market; the UPREIT structure, as mentioned earlier,
alleviated the tax burden of many private players.
Regional mail construction boomed for 40 years, but after several decades of exponential
growth, the mall sector has been undergoing a period of consoidation. Over the past 15
years, the industry has consolidated both on an asset level and in terms of ownership
concentration. By some estimates, the number of operating malls in the country has
declined to under T ,500 today, driven by structural change in the industry and consumer
preference.
• Limited New Supply. As previously mentioned, the U.S. regiona mall sector is a
mature industry. In addition, the industry has seen a major drop in supply since the
early 1990s. The historical annual average for new construction has been 22 million
sq. ft. over the last few decades (1978-2006). We expect the level of activity to
decrease in the upcoming years and, based upon data provided by CoStar, we
believe that 7.4 million sq. ft. of mall square footage is under construction or being
proposed for completion in 2009, while only 1.1 million sq. ft. of mall square footage
is under construction or being proposed for 2010 as developers pull back
dramatically in response to the credit crisis.
Figure 37: Regional Mall Deliveries (in thousands of sq. ft.
Sf (000)30,000 -:
25,000
20,000
15,000
10,000
5,000
0
Average -11 m sf
1980 1984 1988 1992 1996 2000 2004 2008 2012
012009

REITs
Demand Drivers
The demand drivers for both regional malls and shopping centers are very similar. The
most notable demand driver for the retail sector is retailer demand for space, a function of
retailer profitability and growth objectives. On a macroeconomic basis, this driver relies on
overall long-term consumer spending trends.
The reationship between consumer spending and the success of a particular center is
intuitive. The tenant seeks out a location that will afford it the greatest saes per square
foot. When consumer spending is high, average locations will generally afford the retailer
a meaningfu level of sales and allow it to operate at o healthy profit margin. An above-
average location will usually afford the retailer a so id above-average profit margin. Of
course, when consumer spending is being restrained by external factors, such as bad
weather and high gas prices, the opposite result will occur.
The landlord may also try to capture sales upside by factoring in o percentage of sales
component to the rent charged. As sales increase, this variable component of rent will
increase and, therefore, the RElT's NOI will increase, resulting in a higher real estate
valuation. Thus, increased consumer spending generates increased sales, which generate
increased rent, which provides increased NOI and valuation,
There are severe indicators we use to gauge consumer spending. The first indicator is
retail saes. The second is the Consumer Confidence Index (CCI). The index is a useful
measure for future retail sales as it takes into account current consumer opinion on the
economy and future expectations as well. That is, if the index provides a high reading, it
means that the average consumer feels the economy is in good shape and that he or she
will spend discretionary income as a result of that confidence.
Conversely, if the reading on the index declines, it can be inferred that the average
consumer feels cautious about the economy and might pull back on his spending, resulting
in a drop-off in retail spending.
April 01, 2009 55

REITs
Figure 38: Consumer Confidence, 1995-2009
160
140Consumer Confidence
Historical Average
1994 1996 1998 2000 2002 2004 2006 2008
We also look at consumer expenditures as they relate to wage growth. In 2008, rea
disposable income increased at an annualized rate of 2.2%; real personal consumption
expenditures (PCE) increased 0.2% on the same basis. We think that spending patterns
are important to consider, and we have observed that U.S. retail sales as a percentage of
personal consumption expenditures have declined to 45% from 58% as medical services,
legal services, personal hygiene, and insurance have become more substantial contributors
(see Figure 39).
Figure 39: Real Personal Consumption Expenditures, 1995-2009
Jan-94 Jan-97 Jan-00 Jan-03 Jan-06 Jan-09
April 01, 2009

REITs
Figure 40: U.S. Retail Sales Losing Share in Real Personal Consumption Expenditures
Retail Sales (% ofPCE)
60%
56%
40%
Jan-80 Jan-83 Jan-86 Jan-89 Jan-92 Jan-95 Jan-98 Jan-01 Jan-04 Jan-07
April 01,2009 57

REITs
Soles per square foot, a measure of asset productivity, has accelerated over the past three
decades. Sales per square foot is highly correlated with rental rate growth. With so many
retailers expanding store locations and adding new concepts to their spaces, particularly in
the stronger malls and better-located shopping centers, demand for space has intensified.
As a consequence, rental rates for retail real estate have risen.
Figure 41: Effective Rent of Shopping Centers, 1990-2012E
TW Rent Index($/sf)
$26
$24
$22
$20
$18
$16
$14
$12 -
$101991 1993 1995 1997 1999 2001 2003 2005 2007 2009 2011
Looking Forward.
Retail properties a so tend to benefit from ong lease durations (typically seven to I 0 years]
especially during economic downturns. Leases are typically structured with regular rent
bumps throughout the life of the lease in order to account for expected inflation. In cases
where retailers decide to close stores prior to lease expiration (outside of bankruptcy
cases], the retailer will be obligated to compensate the landlord with a lease termination
fee, which will help cushion the drop-off in revenue in the near term as landlords attempt to
fil l the newly vacant space.
Our chief concern regarding retai RElTs is that store closings could materially impact the
demand for space, in turn leading to a substantial decline in occupancy and rental rates.
Consumer confidence levels are near record lows and there is diminishing access to
consumer credit. Since the start of the recession in December 2007, non-farm payroll have
fallen by approximately 3 million. Although there is speculation that a new administration
will push through additional stimulus relief packages quickly, we are concerned that
potential government action will be neither fast nor substantial enough to spur consumer
spending enough to deter retailer bankruptcies and additional store closings. Currently, the
ICSC estimates that 148,000 stores closed in 2008 and believes another 73,000 stores
will shutter in the first half of 2009. These cosures would reflect levels not seen since
2001.
58 April OJ, 200P

REITs
Despite retai rea estate operating metrics coming off strong levels [occupancy in the low-to
mid-90s, rent growth on new leases in the teens], a proonged consumer/economic
slowdown appears more ikely than not at this juncture and we believe it could have
significant adverse effects on rental rates and occupancy eves. That said, the market
appears to be pricing in a near worst-case scenario, which we believe is unwarranted. In
2009, we project a 1.4% FFO per share decline from the mall REITs and a 21 A% decline
from the shopping center REITs. In comparison, we project a 9.4% decline from our
coverage universe.
April 01, 2009 59

60 April 01,2009

REITs
Part Four: Stock Analysis and Valuation
April 01, 2009 61

REITs
Part Four: Stock Analysis and Valuation
We evaluate REIT stocks just as we would other equities: we utilize earnings multlpes,
asset values, dividend yields, and earnings growth rates. However, some GAAP
accounting concepts are less relevant for REITs. Therefore, the industry has developed
different metrics more consistent with real estate's characteristics as a ong-term, total-return
asset cass. In this section, we first define the metrics that we use to assess REIT
performance, and then we explore the real estate-specific factors and fundamentals that
determine portfolio-evel performance, and, in turn, stock performance. Furthermore, we
note that management plays a key role, just as it does in any other type of company, as
management is responsible for executing the proper strategies to drive earnings growth.
Our valuation analysis, which is laid out in more detail further, is supported by an analysis
of management's ability to facilitate stability and growth, and prudently manage the
balance sheet. We track a number of ratios and statistics, with the goal of ensuring that
our earnings projections are achievable based on the company's capital structure. In that
vein, we view analyzing REITs as quite similar to analyzing other types of companies, the
difference being in the metrics used.
Valuation Metrics Investors initially viewed REITs primarily as an income vehicle and, as such, the dividend
yield played a primary roe in relative valuation. However, as perception of REITs has
shifted toward that of a total-return vehicle—and not simply an income vehicle—multiples
and growth rates have taken on greater importance. We use several valuation metrics to
value REITs on both a stand-alone and relative basis, including: price to FFO [funds from
operations), price to CAD (cosh aval able for distribution), price to NAV (net asset value),
and dividend yield. FFO and CAD should reflect the performance of the underlying
portfolio of properties measured, in turn, by same-store net operating income (SSNOI], a
key measure of property-level performance. As with all multipe anayses, it is important to
factor earnings growth into the equation-
Price to FFO and price to CAD are earnings and cash-flow-driven multipes, respectively.
These metrics approximately parallel price-to-EPS and price-to-cash-flow (EBITDA) multiples
used to analyze other types of companies. The most widely recognized earnings metric for
REITs, however, is FFO. FFO is reported by the vast majority of REITs—and accounts for
the bulk of our estimates, and those tracked in First Call. We also provide annual CAD
estimates, which are more akin to free cash flow and which we utilize as the basis for our
price targets. However, many companies do not report CAD, and First Call does not track
CAD estimates. Net asset value estimates the private market break-up value of a REIT's
portfolio, and is not widely reported or tracked. FFO, CAD, and NAV are specific to the
REIT sector and are described in more detai below.
1) Funds from Operations (FFO}
FFO is the most common metric used to assess REIT performance. It is defined as:
62 Apr',101,2009

REITs
GAAP net income, excluding gains (or losses] from debt restructuring and sales of
properties, plus real estate-related depreciation and amortization and after adjustments for
unconso idated partnerships and joint ventures.
FFO is essentially an operating EPS figure eiminating the impact of real estate
depreciation, which is a major noncash charge and should therefore be added back.
Historically, FFO multiples have ranged from the high single digits to the high teens.
Multiples reached all-time highs in early 2007 due to several factors, including investors
pricing in the recovery in real estate fundamentas, a surge in REIT mergers and
acquisitions, and an overall greater interest in REITs, which drove increased demand of this
relatively small and illiquid sector. As of February 2009, multiples had contracted 61%
from those highs. Figure 42 illustrates FFO multiples over time for the overall REIT sector
and then for the four main property types.
Figure 42: REIT Historical Forward Multiples - Overall Average, 1996-2009 Year-to-Date
19.0x18.Ox17. Ox16.0x
a o a a o o o c f a o Q U
April 01,2009 63

REITs
Figure 43: REIT Historical Sector P/FFO Forward Multiples, 1998-2009
24 .Ox
20.0x •
16 Ox
12 Ox-
8.0x
4. Ox
O.Ox
&v°
Apartment23.2
Average: 13.0i --. Qv17.7x79x
13.7x1 |
mill IIJC
I4.1xBlO4x 13i*«
III> d E & r $ r ^ c \ l ' c \ 5 r ^ c £ c & r ^ r & f ^ -cK* _c*
i _c¥* -cv^ _c** fV _f^ -f*
5 _c^ fV -ff•9 *> *tr V ' V ' V ' V ' V ' V ' y S ?
24 .Ox -,
20 .Ox
16 Ox
12. Ox
fl.Ox
4. Ox-
O.Ox
rf>
Industrial
Average: 11. Ix IT^^'^CQ ;
0^390.3^06XJ | | |125" 11|8i
llllllllllll^ tP" jP" tP" tP" tP" rP" tP" T^
W
24 .Ox
20.0x
16.0x
12 Ox
3. Ox
4. Ox
O.Ox
rf>"
Office
Average: 12.1,
15.0x
a3%^i1'%3x_ 10-4x1 1
Illlllll* o^* _rS^ j*N Q & & J&1 ,&
O^tP tP tP lP lP (P^tP v&
16.3x |
|
| 5.4
ll
24 Ox
20. Ox
16. Ox
12. Ox
e.ox
4.0x
O.Ox
rf>
Retail
18.5x jAverage: 11.1x J_ ^ 1
15.3*5.2x(
0.6x 12-7x| 1 I127* i
• 73JBOX8-9* ' XB • • • • B5x H'1»
Illlllllllllf'^'^^^'fS'ri^'ji1^'& <$? i ^ <$? ffr' f^^ *£^ fffi
<& c& j£^
2} Cash Available for Distribution (CAD)
We define CAD as follows: FFO - recurring, nonrevenue-generating capita expenditures
and adjustments for straight-lining rents.
CAD is a more accurate indicator of a REIT's profitabi ity than simple FFO, because FFO
ignores maintenance capital expenditures and is skewed by the GAAP straight-lining of
rents, in our view. As such, CAD multiples are arguably a better va uation parameter to
use when comparing companies. Our concern, from o methodologica perspective, is how
to calculate CAD consistently across different property sectors. We believe that to
calculate CAD deductions properly (namely, on a normalized long-term basis), it is
necessary to have a detailed understanding of the company and the sector. We provide
CAD estimates for the companies in our coverage universe on an annual basis, as quarterly
fluctuations are harder to predict. Further, many companies do not report CAD and it is not
tracked by First Call. That said, we view CAD as the most appropriate valuation tool, if
applied consistently within a sector.
3) Net Asset Value (NAV)
We view NAV as a proxy for book value statistics used in conventional securities analysis.
In essence, our NAV calculation estimates the private market breakup value of a company's
assets, under the somewhat artificial assumption that it is an orderly liquidation. We are
quick to acknowledge that calculating a company's NAV is more art than science. In
addition, we acknowledge that this exercise may not be appropriate for what is, in
April 01, 2009

REITs
essence, an infinite-life entity. Nevertheless, we believe that it provides a good indication
of relative value, particularly in a bearish equity market, assuming that the methodology is
applied consistently across REITs within a given property sector,
We begin by applying the appropriate property-specific capitalization rate to the
company's projected 1 2-month forward [earnings potential] net operating income (NOI) by
sector. To arrive at our cap rate for a REIT, we take into account the geographic
concentration of its portfolio and the age and overall quality of its assets. We start with a
nominal cap rate (most private market participants buy and sell properties on those terms]
and translate it into an economic cap rate. An economic cap rate is typically lower than its
nominal equivalent because it is applied to NOI, after recurring capital expenditures. Most
buyers actually account for required capital expenditures when determining their offers.
However, we believe it is the best proxy to use in valuing a rea estate portfolio.
Historically, REIT stocks have traded at price-to-NAV ranges from approximately 80% to
1 20% of NAV. We do not view a historical time series NAV analysis as relevant, due to
changing real estate fundamentals; however, we view P/NAV levels as a good measure
of relative value within a sector at a given point in time. In Figure 44, we show the
detailed NAV calculation for Mack-Cali Realty as an example.
April 01, 2009 65

REITs
Figure 44: Example of a REIT NAV Calculation (Mack-Cali Realty)
($ in thousands, except per share data]
Current Mack-Cali Realty Net Asset Value (1)t$ Thousands)
Assumed Assumed NOI Before
Nominal Economic Interest
CapJLate Cap Rate (2) Expense
NOI Contribution from (31:
Office Properties 7.73% 6.27% $284,070
Off/Flex Properties 7.50% 7.50% $38,310
Industrial Properties 8.00% 8.00% 52,346
Third Party Mng't 8.33% $17,020
Total NOI
Balance Sheet Items: % of Carrvina Value (4) B/S ValueCash and Cash Equivalents 34,340
Investment in Securities and Unconsolidated JVs 115% 138,495
Construction in Progress 110% 0
Land Held For Future Development 0
Other Assets 135,663
Total Assets
Gross Market Value of Assets
Total Liabilities Outstanding
Mortgage Debt and Tax exempt debt
Line of Credit
Unsec Debt
Other Liabilities
Preferred
Total Liabilities
Minority Interest
Net Market Value of Assets
Common Shares & Units Outstanding
Current Value Per Share
Valuation Measures:
Price Per Share CLI
Price/Current Value
Total Firm Value/Gross Market Value of Assets (5)
Implied nominal cap rate
(1) CLI's current value is based on 12/31/08 balance sheet, and 4Q08 NOI annualized.
(2) Economic cap rale is used, as NOI includes a deduction for recurring capital expenditures.
(3) Deducts $66.2 million in recurring capital expenditures from CLI's next 12 months estimated NOI.
(4) Unless otherwise specified, amount is 100% of carrying value.
(5} Total enterprise value = market value of common equity plus total liabiiities.
Barclays Capital estimates
Current
Value
$4,528,368
$510,804
$29,319
$204.240
$5,272,731
34,340
1 59,269
0
0
135.663
$329,272
$5,602,003
531,126
161,000
1,533,349
259,084
25,000
$2,509,560
786
$3,091,657
80,857
$38.24
$19.5651.2%
73.0%
11.0%
4) Dividend Yield
In addition to the metrics described in Figure 44, we use dividend yield as an analytical
too!. Dividends remain an important component of REIT total returns (historically accounting
for approximately two-thirds of the total], although in the past few years dividends have
represented a much smaller portion of overall returns. We look at dividend yields relative
to other REITs, in addition to other income alternatives such as the 10-yeai Treasury bond.
April 01, 2009
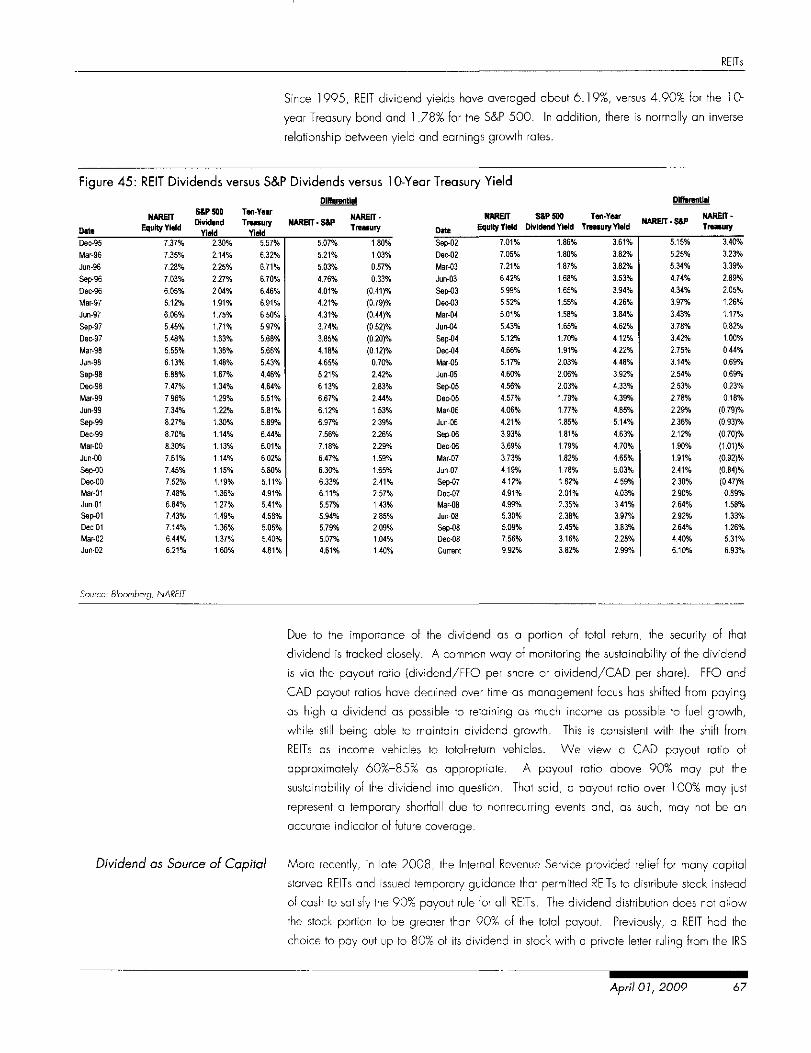
REITs
Since 1995, REIT dividend yields have averaged about 6.19%, versus 4.90% for the 10-
year Treasury bond and 1.78% for the S&P 500. In addition, there is normally an inverse
relationship between yield and earnings growth rates.
Figure 45: REIT Dividends versus S&P Dividends versus 10-Year Treasury YieldDifferential Differentia;
Date
Dec-95
Mar-96
Jun-96
Sep-96
Dec-96
Mar-97
Jun-97
Sep-97
Dec-97
Mar-98
Jun-98
Sep-98
Dec-98
Mar-99
Jun-99
Sep-99
Dec-99
Mar-00
Jun-00
Sep-00
Dec-00
Mar-01
Jun-01
Sep-01
Dec-01
Mar-02
Jun-02
Source: Blooms
NARE9T
Equity Yield
7.37%
7.35%
7.28%
7.03%
6.05%
6.12%
6.06%
5.45%
5.48%
5.55%
6.13%
6.88%
7.47%
7 96%
7.34%
8.27%
8.70%
8.30%
7.61%
7.45%
7.52%
7.48%
6.84%
7.43%
7.14%
6.44%
6.21%
>erg, NAREIT
S&P 500Dividend
Yield2.30%
2.14%
2.25%
2.27%
204%
1.91%
1.75%
1.71%
1.63%
1.36%
1.48%
1.67%
1.34%
1.29%
1.22%
1.30%
1.14%
1.13%
1.14%
1.15%
1.19%
1.36%
1.27%
1.49%
1.36%
1.37%
1.60%
Ten-Year
Treasury NAREfT-S&PYield
5.57%
6.32%
6.71%
6.70%
6.46%
6.91%
6.50%
5.97%
5.68%
5.66%
5.43%
4.46%
4.64%
5.51%
5.81%
5.89%
6.44%
6.01%
6.02%
5.80%
5.11%
4.91%
5.41%
4.58%
5.05%
5.40%
4.81%
5.07%
5.21%
5.03%
4.76%
4.01%
4.21%
4.31%
3.74%
3.85%
4.18%
4.65%
5.21%
6.13%
6.67%
6.12%
6.97%
7.56%
7.18%
6.47%
6.30%
6.33%
6.11%
5.57%
5.94%
5.79%
5.07%
4.61%
NAREIT -TreMiiry
1.80%
1.03%
0.57%
0.33%
(0.41)%
(0.79)%
(0.44)%
(0.52)%
(0.20)%
(0.12)%
0.70%
2.42%
2.83%
2.44%
1.53%
2.39%
2.26%
2.29%
1.59%
1.65%
2.41%
2.57%
1.43%
2.85%
2.09%
1.04%
1.40%
Date &
Sep-02
Dec-02
Mar-03Jun-03
Sep-03
Dec-03
Mar-04
Jun-04
Sep-04
Dec-04
Mar-05
Jun-05
Sep-05
Dec-05
Mar-06
Jun-06
Sep-06
Dec-06
Mar-07
Jun-07
Sep-07
Dec-07
Mar-08
Jun-08
Sep-08
Dec-08
Current
NAREIT
quity Yield
7.01%
7.05%
7.21%
6.42%
5.99%
5.52%
5.01%
5.43%
5.12%
4.66%
5.17%
4.60%
4.56%
4.57%
4.06%
4.21%
3.93%
3.69%
3.73%
4.19%
412%
4.91%
4.99%
5.30%
5.09%
7.56%
9.92%
S&P 500
Dividend Yield
1.86%
1.80%
1.87%
1.68%
1.65%
1.55%
1.58%
1.65%
1.70%
1.91%
2.03%
2.06%
2.03%
1.79%
1.77%
1.85%
1.81%
1.79%
1.82%
1.78%
1.82%
2.01%
2.35%
2.38%
2.45%
3.16%
3.82%
Ten-Year NARETT-SM1
Treasury Yield
3.61%
3.82%
3.82%
3.53%
3.94%
4.26%
3.84%
4.62%
4.12%
4.22%
4.48%
3.92%
4.33%
4.39%
4.85%
5.14%
4.63%
4.70%
4.65%
5.03%
4.59%
4.03%
3.41%
3.97%
3.83%
2.25%
2.99%
5.15%
5.25%
5.34%
4.74%
4.34%
3.97%
3.43%
3.78%
3.42%
2.75%
3.14%
2.54%
2.53%
2.78%
2.29%
2.36%
2.12%
1.90%
1.91%
2.41%
2.30%
2.90%
2.64%
2.92%
2.64%
4.40%
6.10%
NARETT.
Tremury
3.40%
3.23%
3.39%
2.89%
2.05%
1.26%
1.17%
0.82%
1.00%
0.44%
0.69%
0.69%
0.23%
0.18%
(0.79)%
(0.93)%
(0.70)%
(1.01)%
(0.92)%
(0.84)%
(0.47)%
0.89%
1.58%
1.33%
1.26%
5.31%
6.93%
Dividend as Source of Capital
Due to the importance of the dividend as a portion of total return, the security of thai
dividend is tracked closely. A common way of monitoring the sustainability of the dividend
is via the payout ratio [dividend/FFO per share or dividend/CAD per share). FFO and
CAD payout ratios have declined over time as management focus has shifted from paying
as high a dividend as possible to retaining as much income as possible to fuel growth,
while still being able to maintain dividend growth. This is consistent with the shift from
REITs as income vehicles to lotal-return vehicles. We view a CAD payout ratio of
approximately 60%-85% as appropriate. A payout ratio above 90% may put the
sustainability of the dividend into question. That said, a payout ratio over 100% may just
represent a temporary shortfall due to nonrecurring events and, as such, may not be an
accurate indicator of future coverage.
More recently, in late 2008, the Internal Revenue Service provided relief for many capita
starved REITs and issued temporary guidance that permitted REITs to distribute stock instead
of cash to satisfy the 90% payout rule for all REITs. The dividend distribution does not a low
the stock portion to be greater than 90% of the total payout. Previously, a REIT had the
choice to pay out up to 80% of its dividend in stock with a private letter ruling from the IRS
April 01, 2009 67

Qualitative Considerations
and had to permit its shareholders the choice of receiving either cash or stock up to the
maximum allocation. The newly issued guidance extends only to distributions declared
with respect to taxable years ending on or before December 31, 2009.
Beginning in late 2008, a number of REITs began to take advantage of the ruling and
declared stock as a portion of its 2009 dividends in order to preserve cash. In addition,
some larger companies which were perceived to be in relatively better health with respects
to its balance sheet [VNO and SPG1 also included stock as o part of its 2009 projected
dividends.
Underlying Portfolio Performance Drives Earnings
Equity REIT revenues are derived primarily from renta income. Revenue growth is driven
internally primarily via occupancy growth, rent increases upon lease rollover, percentage
rent participation (retail), scheduled rent bumps, property refurbishments, and sale and
reinvestment (capita recycling). The structure of leases is critical, as much of a company's
revenue growth may be dictated by the rent bumps stipulated in its leases [especially true
for net lease companies), or by the percentage rent agreements for retail companies.
External growth is driven by acquisitions, development, and expansion.
Location
Location is obviously a key factor in determining rental rates and rental rate increases.
Central Business District (CBD) office properties generally command a higher rent than
suburban office; proximity to public transportation or other amenities can increase pricing
power for a landlord. Retail properties that are well-positioned with respect to major traffic
arteries or population centers or other synergistic retailers will generally command higher
rents. Rental rates for other property types are a so heavily influenced by simiar factors.
Furthermore, a REIT's overall portfolio may benefit from either its geographic concentration
or diversification, depending on market conditions. For example, over the past severe
years, those REITs with high concentrations of office properties in New York or Washington
D.C. have benefited disproportionately compared to geographically diversified office
REITs, as those two markets have experienced greater occupancy and rental growth than
the average market in the United States.
Portfolio Quality
Portfolio quality [both buildings and tenants) also matters. When analyzing a REIT's
earnings growth opportunities, it is important to assess the quality and condition of its real
estate assets to assess the magnitude of rents the properties will be able to garner, and
what types of capita expenditures (upkeep and remodeling) will be required in the future.
Moreover, higher-quality tenants provide a more reliable income stream; a common metric
observed is percentage of average base rent represented by investment-grade tenants.
Characteristics of Local Markets (Demographics)
Characteristics of local markets [demographics) are important. Property-level performance
will also be influenced by the demographics of the loca market, incuding age levels,
April 01, 2009

REITs
household formations, wage levels, etc. Changing demographics can point to
opportunities or challenges for a REIT and aid in evaluating earnings potential.
Lease Terms
Lease terms a so play a role in determining earnings growth. Many leases have stipulated
rent increases that play a arge part in rental growth. In addition, the length of eases and
the timing of the expiration [rollover) of those leases are critical, as eases may expire
during times of low rental rates or high rental rates, based on the stage of the real estate
cycle. The amount of leasing volume will determine overall occupancies and, as such, is
paramount to a REIT's success.
All of these factors combined determine the level and growth of property-leve revenues,
which, combined with properly operating expenses, determine SSNOI, the key metric for
property-level performance. Property-leve expenses incude rea estate taxes, utilities,
insurance, property management expenses, and recurring capita expenditures (carpeting,
blinds, etc. . Expenses for a REIT include general and administrative costs (similar to that of
other companies) and interest expense, which can be quite arge as properties are
financed with debt (overall REIT leverage currently averages about 65%, but historically has
ranged between 40% and 50% debt to total market cap). Controlling these varied
expenses is paramount as a REIT's existing income stream is largely fixed (dictated by its
leases).
External Growth — Acquisition
and Development
Earnings growth is a critical element in valuing a REIT. Rent growth, coupled with
moderate expense increases, should lead to positive earnings growth. Management savvy
will have an impact on the level and acceleration of this growth, which should be reflected
in vo uotion multiples (P/CAD, P/FFO). The dividend yield often has an inverse
relationship with the level of earnings growth (for example, net lease companies typically
have higher dividend yields and lower growth than other REITs, reflective of their long-term
eases and limited ability to grow earnings at a rapid rate). An increasingly important
component of a REIT's earnings is gains on development, especially in the industrial sector.
This may provide a REIT with considerable gains; however, the realization of this income is
inherently lumpy.
In addition to growing rents and occupancy, REITs grow revenues via acquiring and/or
developing additional properties. In simple terms, acquisition is accretive if the going-in
cap rate (unlevered cash yield) is above the cost of debt. Development, which is inherently
more risky, should generate yields severe hundred basis points above acquisitions. A
company's development pipeline can be an important source of growth and should be
monitored closely. A large development pipeline can be quite beneficial when properties
are selling for above replacement cost. That said, if real estate prices or rents fall while the
properties are being developed, a company may fall short of its initial return projections.
All of these factors (existing portfolio growth and expansion via acquisition and
development) contribute to the growth of earnings and dividends. The rate and success of
that growth is largely influenced by management.
April 01, 2009 69
?EITs
Management — The Critical
Element
Capital Structure
Just os in any other type of company, management is critical. We believe that investing in
REITs is essentially investing in management. Now that REITs ore actively managed
companies, as opposed to passive pools of real estate assets, the quality of management
plays a meaningfu role in determining the growth of the company. Therefore, we evaluate
REIT management teams based on track record, experience, strategy, relationships in the
industry (access to deals), and balance sheet monagement skills. In addition, the level of
insider ownership is important, as it aligns the interests of management and shareholders.
Of note, real estate historically has largely been a family business; however, that is
changing, with more family-run companies being acquired and run by professiona
managers.
Real estate is a capital-intensive industry; therefore, it is important for a company to hove
access to a variety of capital sources in order to fund investment. However, the level of
debt that REITs maintain has declined over the years and now generally hovers at 30%-
50% (of total market cap). With today's declining prices, REITs trade at a debt-to-total
market capitalization of 60%. Many REITs also seek projects where returns are only
justified by employing higher levels of debt; therefore, some REITs pursue these investments
in off-balance-sheet joint ventures where higher leverage can be used. Generally, REiTs
have restrictions [covenants] placed on them, which restrict debt levels. Standard REIT debt
covenants include a maximum of 60% everage, no more than 40% of total assets
comprised of secured debt, a minimum of 1.5x fixed charge coverage, and unencumbered
assets of at least 150% of unsecured debt. As a result, REITs, in general, maintain
relatively conservative capital structures.
Because REITs must pay out at least 90% of taxable income, they generally retain
approximately 35%-40% of cash flow—primarily a result of the depreciation tax shield. In
the current environment, cash flow retention has become more paramount. As such some
companies such as Simon Property Group have decided to pay out their dividend in stock,
allowing the company to further retain more capita .
The main components of a REIT's capital structure are debt (credit facilities, unsecured debt,
secured debt, property-level debt, and joint venture debt), common stock, operating units,
and preferred stock (Figure 46]. Although capital structures and debt levels vary from REIT
to REIT, Figure 46 illustrates the capital structure of Simon Property Group as an example.
70 April 01, 2009

REITs
Figure 46: Simon Property Group — Capital Structure, as of 12/31 /2008 {$ in millions)
Joint Venture UnsecuredDebt, $50 , 0%
OP Units, $2,995 , 7%Joint Venture Mortgage
Debt, $6,571 , 16%
Revolving Credit Facility, _ ,£1 046 3% &fe^ \ •/ \ CorTimon Shares'
$12,290,31%
Fixed Rate UnsecuredDebt, $10,725 , 27%
Fixed Rate MortgagePreferred Stock, $590 , Debt $5 993 15%
1%
Credit Facility
Many REITs iniliaiiy fund property investment via short-term credit facilities, which typically
have maturities of one to two years, with extension options for an additional one to three
years. Interest on these facilities is usually floating-rate, based on a spread over a short-
term index rate (usually 30-day LIBOR). Once a company accumulates a meaningfu
balance on its credit facilities, it will usually roll that short-term debt into something more
permanent, such as long-term, fixed-rate debt or equity.
Secured Debt
REITs may utilize properly-specific mortgage debt or debt secured by a pool of properties,
usually up to a loan-to-value (LTV) level of approximately 80%, but more commonly between
40% and 70%. Property-specific debl financing is more common among net lease
companies as the long-term nature of the leases makes them more easily match financed
via property-specific mortgages. The amount of secured debt that a REIT may issue wi I
often be influenced by the ratings agencies, due to certain requirements dictating the
acceptable levels of secured debt that a company may maintain in order to qualify for a
specific credit rating. Moreover, the cost of debt may influence the amount of secured
versus unsecured debt.
Unsecured Debt
REITs may also issue unsecured debt, which by definition is not backed by any property
interest or any other specific collateral, but is senior to all equity and other subordinate
April 01,2009 71

?EiTs
debt. Maturities usually range from five to 10 years. In the current environment however,
unsecured debt has been a most completely shut off to companies due to historically wide
spreads.
Preferred Stock/Convertible Preferred Stock
Many REITs issue preferred stock; however, it is usually a much smaller portion of the
capital structure.
Trust Preferreds
These securities are becoming more common as of ate, and are different from regular
preferred securities. The securities have a 30-year term, a fixed rate for 10 years thai
subsequently floats based on a spread to LIBOR, and are callable after five years. The
securities are issued by a trust that has been created for the soe purpose of issuing these
securities.
Operating Partnership Units
REITs formed via an UPREIT or DownREIT structure may issue Operating Partnership (OP)
units in exchange for properties. OP units are exchangeable into common stock on a one-
for-one basis, receive dividends, and have voting rights just like common stock. OP units
provide a currency to the REIT to make property acquisitions without the seller incurring an
immediate tax liability. The seller may defer the tax liability until the OP units are converted
to common stock.
Common Stock
The principal component of a REIT's capita structure is common stock. Due to the fact that
REITs must pay out 90% of taxable income as dividends, a REIT generally periodically taps
the equity markets to grow. As such, REIT follow-on equity issuances are common.
71 April 01, 2009

REITs
Part Five: Indices and Exchange-Traded Funds
April 01,2009 73
REITs
Part Five: Indices and Exchange-Traded Funds
RMS versus NAREIJ
Real Estate Indices
A number of indices ore available to investors to monitor REIT stock performance, including
the NAREIT Composite and Equity Indices, Wilshire Real Estate Securities Index, Global
Properly Research 250 Index, Cohen and Steers Realty Majors Index, and S&P REIT
Composite Index. Historically, the Morgan Stanley REIT Index (RMS), now called the MSCI
US REIT Index, was the index of choice for several reasons. However, the NAREIT Equity
and Composite Indices have also become more widely accepted, in our opinion.
In March 2006, FTSE, the global index provider, took over the calculations of the NAREIT
Domestic Real Estate Index Series, which were renamed the FTSE NAREIT US Real Estate
Index Series. We focus primarily on the FTSE NAREIT Equity Index and the FTSE NAREIT
Composite Index. We a so track the performance of the RMS- The reason for focusing on
the NAREIT Equity and Composite Indices is (heir comprehensive nature (the Equity Index
incudes all publicly traded equity REITS, while the composite contains all publicly traded
equity and mortgage REITs), in addition to the availability of data. The RMS had been the
index of choice, as it has dominated the industry since its coming of age in the early
1990s. However, MSCI, a subsidiary of Morgan Stanley, overtook administration of the
index in summer 2005, introducing a real-time, price-only index |RAAZ] while maintaining
the RMS total-return index priced only at the end of each trading day. Subsequently, the
availability of index data became more chalenging. Meanwhile, data on the NAREIT
Equity and Composite Indices are more readily available.
The NAREIT Composite Index is comprised of all 1 35 publicly traded REITs on the NYSE,
the Nasdaq National Market System, and the American Stock Exchange. The Composite
Index incudes 10 residential mortgage REITs and 10 commercial mortgage REITs. In
addition, NAREIT maintains an Equity REIT index that excudes these 29 mortgage REITs;
both indices are market-cap-weighted (float adjusted], calculated on a tota -return basis,
and include a number of smaller companies. The NAREIT Equity Total Return Index can be
found on Bloomberg under the symbol "FNERTR" [Index); the NAREIT Composite Index can
be found on Bloomberg using the symbol "FNCOTR" (Index). Price-only versions of these
indices are maintained as well.
The RMS is relatively comprehensive, although it excludes mortgage REITs. The index
represents approximately 85% of the US REIT universe. We believe that many money
managers will continue to use the RMS; however, we think that use will diminish due to the
difficulty in obtaining index data.
GPR 250 Global Index The Global Property Research 250 Index is a free-float weighted index that tracks the
performance of 250 of the most liquid property companies worldwide. The index includes
only companies with a free-floal market capitalization greater than $50 million. The index
and its constituent data can be found on Bloomberg under the symbo "G250GLOB"
74 April 01, 2009

S&P REST Composite
C&S Realty Majors Index
Wiishire REtT Index
Dow Jones REIT Composite Index
REITs
(Index). We think thai this index will become more relevant as investment managers
become more active in rea estate investment overseas, and as more and more countries
adopt REIT or REIT-like corporate structures.
The S&P REIT Composite was established in 1997. The index includes 100 companies
that were chosen for their liquidity and together represent a diversified portfolio. The
composite contains about 80% of the U.S. REIT capitalization. Although the index is
spread across diversified property types and key regions throughout the country, Mortgage
REITs are not incuded. To qualify for inclusion in this index, companies must possess a
minimum of $100 million in unadjusted market capitalization. The index can be found on
Bloomberg under the symbo "SPREIT" (Index].
The Cohen & Steers Realty Majors Index, formed in 1998, has the fewest constituents of its
peers. The Index, which is rebalanced quarterly, seeks large and liquid REITs of all
property types and geographic locations that address the most significant issues facing the
industry today. In addition, there is an 8% maximum index weight for any company in the
index. As with most of its peers, only equity REITs are included in the C&S Realty Majors
Index. The index can be found on Bloomberg under the symbo "RMP" (Index].
The Dow Jones Wiishire REIT Index was established by Wiishire Associates in September
1991. It is a subset of the Dow Jones Wiishire Real Estate Securities Index (RESI). The
main difference between the REIT Index and the RESI Index is that the REIT Index does not
include rea estate operating companies (REOCs), whereas the RESI Index does. In
addition, the index is a subset of the DJ Wiishire 5000 Composite Index. The index can
be found on Bloomberg under the symbol "DWRTF" (Index).
The companies included in the index must own equity and operate commercia and/or
residential real estate. Mortgage REITS, health care REITs, and other nonREIT real estate
companies, as well as companies that have more than 25% of their assets in direct
mortgage investments, are not included in the index. In addition, companies must have a
total market capitalization of at least $200 million at inclusion. Furthermore, the index is
float-adjusted as it restricts corporate holding, as well as government, employees, and
family holdings.
The Dow Jones REIT Composite Index was established in late December 1991 and
includes all publicly traded U.S. REITs. Unlike most of its peers, the index incudes
mortgage and hybrid REITs. The only requirement to be a member of the index is that the
company must maintain its REIT tax election status. The index and its constituent data can
be found on Bloomberg under the symbol "RCIT" (Index].
April 01, 2009 75
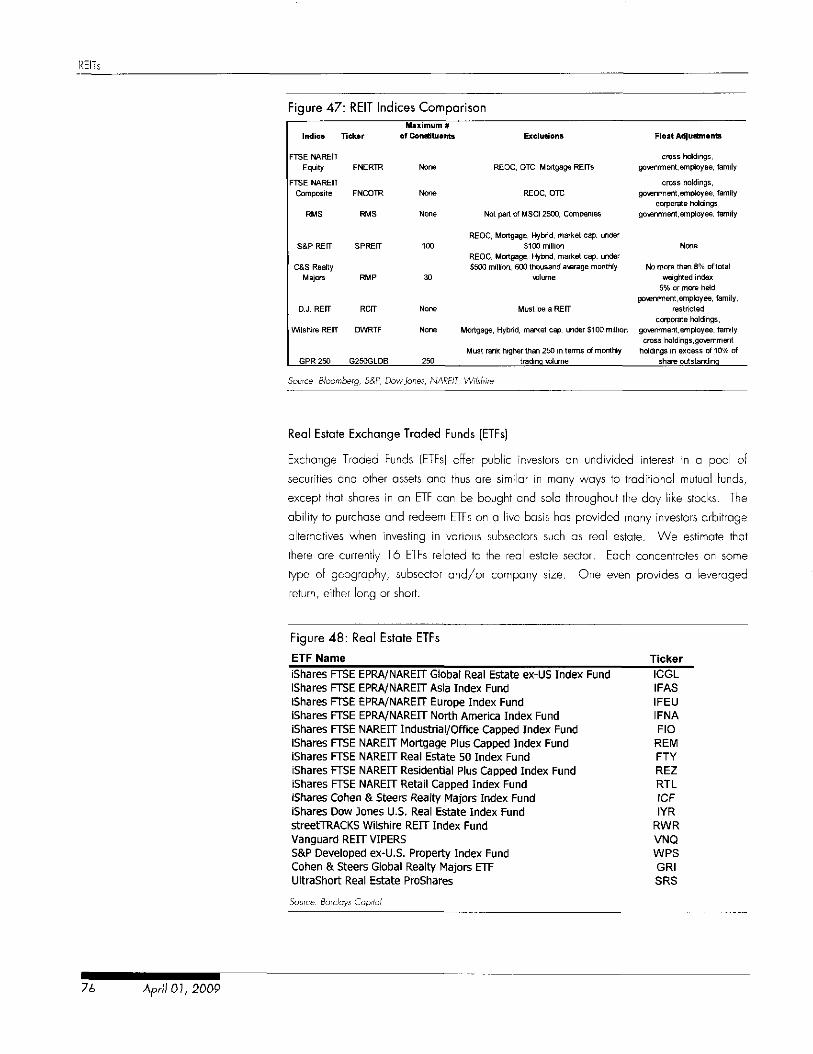
REITs
Figure 47: REIT Indices ComparisonMaximum #
Indies Ticker of Constituents Exclusions
FTSENAREITEquity
FTSE NAREFTComposite
RMS
S&PRETT
C&S RealtyMajors
D.J. REFT
Wilshire REFT
GPR250
FNERTR
FNCOTR
RMS
SPREFT
RMP
RCFT
DWRTF
G250GLOB
None
None
None
100
30
None
None
250
REOC, OTC, Mortgage REFTs
REOC, OTC
Not part of MSCI 2500. Companies
REOC, Mortgage, Hybrid, market cap, under$100 million
REOC, Mortgage, Hybnd, market cap. under$500 million, 600 thousand aierage monthly
\olume
Must be a REFT
Mortgage, Hybrid, market cap. under $100 million
Must rank higher than 250 in terms of monthlytrading \dume
Float Adjustments
cross holdings,government, employee, family
cross holdings,gownrment, employee, family
corporate holdings,government, employee, family
None
No more than 8% of total
weighted index5% or more held,
gownrment, employee, family,
restrictedcorporate holdings.
go\enrm ent, em ployee. fami I ycross hoi dings, government
holdings in excess of 10% ofshare outstanding
Real Estate Exchange Traded Funds (ETFs)
Exchange Traded Funds |ETFs) offer public investors an undivided interest in a DOOI or
securities and other assets and thus are similar in many ways to traditional mutual funds,
except that shares in an ETF can be bought and sold throughout the day like stocks. The
ability to purchase and redeem ETFs on a live basis has provided many investors arbitrage
alternatives when investing in various subsectors such as rea estate. We estimate that
there are currently 16 ETFs related to the real estate sector. Each concentrates on some
type of geography, subsector and/or company size. One even provides a leveraged
return, either long or short-
Figure 48: Real Estate ETFs
ETF Name TickeriShares FTSE EPRA/NAREIT Global Real Estate ex-US Index Fund ICGLiShares FTSE EPRA/NAREFT Asia Index Fund IFASiShares FTSE EPRA/NAREFT Europe Index Fund IFEUiShares FTSE EPRA/NAREU North America Index Fund IFNAiShares FTSE NAREIT Industrial/Office Capped Index Fund FIOiShares FTSE NAREIT Mortgage Plus Capped Index Fund REMiShares FTSE NAREIT Real Estate 50 Index Fund FTYiShares FTSE NAREIT Residential Plus Capped Index Fund REZiShares FTSE NAREIT Retail Capped Index Fund RTLiShares Cohen & Steers Realty Majors Index Fund ICFiShares Dow Jones U.S. Real Estate Index Fund IYRstreetTRACKS Wilshire REFT Index Fund RWRVanguard REFT VIPERS VNQS&P Developed ex-U.S. Property Index Fund WPSCohen & Steers Global Realty Majors ETF GRIUltraShort Real Estate ProShares SRS
April 01,2009

REITs
The growth in real estate-related ETFs has allowed more fast money investors enter the rea
estate space thereby increasing the volatility of the sector. Without doubt, 2008 was the
most volatile year REITs have hod. Figure 49 displays the daily returns of the RMZ Index
since 1 995, which tended to remain between -2% and 2% up unti late 2007; since then,
the returns spread far beyond those eves. There were several reasons for the significant
volatility in 2008, including lower liquidity than other sectors, but the two factors that stood
at the fore during 2008, and which we believe will continue to affect REITs for at least the
next few months, ore 1] hedge fund redemptions and other forced sellers; and 2)
leveraged ETFs. The forced selling, largely caused by redemptions and margin calls,
exacerbated the steep selbff last fall. In addition to funds focused on REITs that saw
redemptions and were forced to sell, some rea estate funds that invested more broadly
saw REITs as their most liquid investment and thus sold them to meet redemptions. The
leveraged ETF factor stems from requirements that leveraged long and short ETFs keep a
steady margin ratio at the close of each day's trading; if REITs gained or lost materially
during the course of the day, a leveraged ETF whose margin levels were affected (long
ETFs on down days, short ETFs on up days) would be forced to trade in the same direction
as the market in order to fix its leverage ratio for the close of trading. Often during 2008,
when REITs had already made a significant move in one direction, the last half hour of
trading saw another leg in the same direction, which significantly aggravated existing
volatility. Leveraged ETF volume may subside, and fund redemptions and forced selling
may slow, but in the near term we expect continued volatility-
Figure 49: Unprecedented U.S. REIT Volatility- 13 Years of Daily RMZ Returns
1997 1998 1999 2000 2001 2002 2003 2004 2005 2006 2007 2008
RMZ Daily Returns 2.00% -2.00%
In summary, although there are many indexes available to REIT investors, we focus on the
NAREIT Equity and Composite Indices, while we also track the RMS and the IYR.
April 01, 2009 77

REITs
This page mtenf/oona//y leh blank
79 April 01, 2009

REITs
Part Six: Current and Future Trends
April 01, 2009 79

REITs
Part Six: Current and Future Trends
In the wake of Lehman Brothers' September 15, 2009 bankruptcy filing, risk spreads
across all asset classes gapped out, and by the end of that month REITs began their sharp
fall. Roughly flat for the first nine months of the year, REITs fell 37.4% during 4Q08, as
measured by the NAREIT Equity REIT index—logging the broader markets considerably (the
S&P 500 fell 2 1.9% in 4Q08]-and ultimately declining 37.7% for full-year 2008 (versus
37.0% for the S&P 500). The year's low came intraday on November 21, the week of the
annual NAREIT convention, when the RMZ [the price-only version of the MSCI REIT Index)
hit 306.91, down about 60% year to date. The driver was widespread market concern
that the credit crisis would eliminate capital flow to rea estate for an extended period of
time, if not forever, and force asset values down. The market appeared to be pricing in an
immediate mark to market of all REIT assets and liabilities, resulting in no implied equity
value; stocks began to trade as if the underlying companies were insolvent, reflected in
materially wider REIT credit default swap spreads.
We believe the imperative to mark what is in essence a long duration asset, typically with
matched and staggered debt maturities, is misplaced. Furthermore, the implicit dependence
on NAV gives no value to the company's franchise or value creation ability. One of the
primary advantages of the REIT structure for the ownership of commercia rea estate is the
vehicle's access to equity and debt capita at the corporate level. Most of the REITs we
cover continue to have access to capital, albeit at more expensive levels than two years
ago, and we believe they have the liquidity to hold onto the bulk of their assets without
being forced to sell. This ability to hold onto assets through the downturn, even if it lasts
several years, should render the insolvency-level valuations moot for most REITs.
The 38% decline in REITs in 2008 actually reflects a slight December recovery from the
sector's negative sentiment and selling. After touching bottom in mid-November, the RMZ
traded up 66% to close 2008 at 509.21. We are not technical analysts, and so we will
not speculate on whether 306.91 will stand as the low of this bear market or whether REITs
might retest the level; we simply believe that investors should expect continued day-to-day
volatility in the near term. We are, however, fundamental analysts, and as such we believe
that REITs remain cheap at current levels: on an absolute price per sq. ft. basis, on an
implied-cap-rate basis, on an earnings-multiple basis, and on the basis of their dividend
yields. In the long term, then, we think that REITs could offer defensive upside potentia .
Barry Knapp, Barclays Capita's U.S. Portfolio Strategist, estimates that the S&P 500 will
decline 1 6% during 2009; at year-end, we expect REITs to have outperformed the broader
equity markets.
How to Play
Not all REITs are created equal; risk/reward profiles vary throughout sectors and specific
stocks. We continue to believe 2009 will be a stock, not a sector, picking exercise. In
general, we would group the stocks into the following categories: Ij large-cap, defensive
names in high-quality markets; 2) mid-cap, less defensive names that nonetheless have
reasonably low leverage and portfo ios in high-quo ity and secondary markets; and 3)
80 ,4pr;/07, 200P

REITs
highly levered REITs that face near-term debt maturities. For the past year, we hove favored
the first group. We felt they were the best-positioned to weather the downturn based on
business model and asset quality as well as balance sheet strength. We continue to
recommend this segment. As debt markets improve, however, our investment strategy may
shift to incorporate the reatively less defensive names farther out on the risk spectrum. We
think that this "middle bucket" may begin to offer better risk-adjusted returns. Nevertheless,
on average, we believe that current levels represent compelling entry points for most REITs.
Liquidity Remains Key
We continue to stress the importance of financial flexibility and access to liquidity when it
comes to stock picking. Whether the capita environment improves somewhat or not during
2009, those companies with balance sheet and liquidity advantages should outperform, in
our view. Our 1-Overweight ratings are largely liquidity driven; we continue to recommend
names such as Simon Properly Group |SPG], Boston Properties (BXP], Vornado Realty Trust
(VNO), Kimco Realty (KIM), and AvalonBay Properties |AVB) on that basis.
Risks to the Call
The primary risk to this call is that the debt markets do not begin to normalize during 2009.
Our belief that government interaction will help fuel a return of lending and capital flows
throughout the broader economy—including commercia real estate—truly underpins our
entire investment thesis herein. If that does not occur, it is unlikely that the market will find
REIT equity securities attractive on a relative basis, minimizing the upside potential. Another
important risk is that ongoing economic weakness causes a deeper decline in operating
property fundamentals than we forecast. As we will discuss further, we believe most of the
companies we cover have the capacity to withstand deep NOI declines; however, falling
cash flows puts pressure on debt coverage, dividend coverage, and va uations—both in
terms of net asset values and earnings multiples. Moreover, as aforementioned, a negative
outcome for General Growth Properties would not bode well for valuations in the sector, in
our view. While the long-term performance of the sector should not be determined by
General Growth's issues, short-term performance likely will be. Most importantly, we stress
that this is not a near-term call; we expect ongoing volatility, and not necessarily relative
outperformance, from the group at least for the next several months. In that context, the
stocks could move lower in the short term. But we believe that investors with a 1 2- to 18-
month outlook should be rewarded.
The Technical Backdrop - Other Trends to Watch
Without doubt, 2008 was the most volatile year REITs have had. Figure 49 displays the
daily returns of the RMZ Index since 1 995, which tended to remain between -2% and 2%
up until late 2007; since then, the returns spread far beyond those levels. There were
several reasons this year for the significant voatility, including lower liquidity than other
sectors, but the two factors that stood at the fore during 2008, and which we believe will
continue to impact REITs for at least the next few months, were 1 ] hedge fund redemptions
and other forced sellers; and 2) leveraged ETFs. The forced selling, largely caused by
redemptions and margin calls, exacerbated the steep selloff this fall. In addition to funds
Apr!! 01, 2009 81

?EITs
focused on REITs that saw redemptions and were forced to sell, some real estate funds that
invested more broadly saw REITs as their most liquid investment and thus sold them to meet
redemptions. The leveraged ETF factor stems from requirements that leveraged long and
short ETFs keep a steady margin ratio at the close of each day's trading; if REITs gained or
lost materially during the course of the day, a leveraged ETF whose margin levels were
affected [long ETFs on down days, short ETFs on up days] would be forced to trade in the
same direction as the market in order to fix its leverage ratio for the close of trading. Often
during 2008, when REITs had already made a large move in one direction, the last half
hour of trading saw another leg in the same direction, which significantly aggravated
existing voatiliry. Leveraged ETF volume may subside, and fund redemptions and forced
selling may s ow, but in the near term we expect continued volatility.
Broader Trends Expected to Continue
Despite the current uncertainty in the financial markets, we expect three broader REIT trends
to continue over the long term.
Migration of Corporate Real Estate Assets to the Public Markets
The real estate industry has been irrevocably transformed over the past 10 years by the
migration of assets and talent into the public markets. In that time, we think REITs have
become an important repository of value creation and operating talent. In our opinion, the
institutional credibility of REITs will drive industry change—and sector growth—going
forward. Real estate, which by some estimates comprises 25%-30% of corporate assets in
the United States, will continue to migrate into the public domain; but in contrast to the past
10 years when those properties essentially came out of the private real estate companies,
increasingly they will likely come from Corporate America.
Greater Acceptance of REITs as an Asset Class
Over the past severa years, many studies have been conducted regarding REIT historical
performance and correlation of that performance to broader market indices and other
investment alternatives. The genera concusion has been that REITs provide not only a
diversification benefit, but also return enhancement to a diversified portfolio. Perhaps due
to this realization (in addition to the strong performance of REITs over the past several
years], REITs have become more accepted as an asset class and, as such, are held by a
broader investor constituency. In that vein, there has been an increase in the number of
REIT mutual funds, in addition to increased allocations to real estate by pension funds.
Having said that, many non-dedicated ong only funds have since left the group. As the
credit markets begin to stabilize, however, that trend will likely reverse.
Global Proliferation of REIT and RE IT-Like Structures
Over the past several years, there has been a vast proliferation of REIT and REIT-like
structures globally. Figure 50 highlights the countries that have enacted REIT or REIT-like
structures prior to 2000, from 2000 to 2005, and where enactment of REIT-like structures
is currently under consideration.
8Q April 01,2009

REITs
Figure 50: Global Proliferation of REIT and REIT-Like Structures
Enacted before2000
AustraliaBrazil
CanadaGreeceSpain
The NetherlandsTurkey
United States
Source. Ems! & Young, EPRA
Enacted from2000 to 2008
FranceGermany
Hong KongItaly
JapanMalaysiaMexico
SingaporeSouth Korea
TaiwanThailand
United Kingdom
Under ConsiderationChina
FinlandIndia
Philipines
Long-Term Upside Potential
Ultimately, we believe that commercia real estate markels wil stabilize. We do not think
lhat the capital markets are shut permanently to real estate. The anticipatory nature of the
equity markets is one reason we think REITs will lead that real estate recovery. Another is
our view that REITs are among the better-capitalized and more liquid participants in the real
estate markets, which should lead to attractive investment opportunities in the face of
declining private market asset values. At their lows, we believed thai REITs were pricing in
scenarios where capital markets would be shut for years, where large numbers of tenants
would file for bankruptcy protection, and where cap rates would rise materially and asset
values decline. Even taking into account the subsequent December rebound, we believe
thai those downside scenarios remain essentially priced in. Given our fundamental view
thai rents and occupancies will decline manageably and thai the capita markets are not
completely shut, we think that the expectations priced into the stocks are more dire than will
prove to be the case over the next year to two. As a result, we think that the stocks should
move higher by the end of the year.
An important imperative, in our view, is to differentiate between REITs and rea estate more
broadly in terms of both fundamentals and valuation. We acknowledge that the market is
challenging for commercial properly owners, both in terms of property operations and
capital availability; real estate generally will likely be in a world of challenge for the next
two to three years. On the other hand, REITs generally operate with lower everage than
privately held rea estate, and on average own higher-quality properties. Unlike public
REITs, where the stock price can be used to effectively mark the assets and liabilities to
market, that cannot happen in the private market unless or until assets are sold, or debt
comes due. In other words, those properties with higher leverage and weaker cash flows,
on average, have not yet been re-priced, whereas public REITs already have. As such,
private market asset values are likely to fall going forward, when transaction volume
accelerates. REIT securities led the asset class lower, due to their inherent liquidity
advantage relative to direct real estate; similarly, we believe REIT securities should lead the
asset class higher upon a recovery.
April 01, 2009 83

REITs
For more detail on our current view, please see our publication, "Real Estate - The Year
Ahead: Our View", dated January 22, 2009.
Figure 51 : REIT Stocks Under Coverage
Company
RES1DEHT1M.
Apartments
Apartment Investment and Mgmt
AvalonBay Communities, Inc.
Camden Property Trust
Colonial Properties Trust
Equity Residential
Essex Property Trust, Inc.
Home Properties, Inc.
Post Properties Inc.
UDR, Inc.
COMMERCIAL
Office
Alexandria Real Estate Equities
Boston Properties Inc.
Brandywine Realty Trust
Mack Cali Realty Corp.
SL Green Realty Corp.
Vomado Realty Trust
Industrial
AMB Property Corp,
ProLogis
RETAIL
Shopping Centers
Equity One, Inc.
Kimco Realty Corp.
Regency Centers Corp.
Regional Malls
CBL & Associates
Simon Property Group
OTHER SECTORS
CB Richard Ellis, Inc. RE Services
Lexington Realty Trust Net Lease
Winthrop Realty Trust Diversified
Ticker
AIV
AVB
CPT
CLP
EQR
ESS
HME
PPS
UDR
ARE
BXP
BDN
CLI
SLG
VNO
AMB
PLD
EQY
KIM
REG
CBL
SPG
CBG
LXP
FUR
Rating
3-UW
1-OW
2-EW
3-UW
2-EW
2-EW
2-EW
2-EW
2-EW
2-EW
1-OW
3-UW
2-EW
2-EW
1-OW
1-OW
1-OW
3-UW
1-OW
1-OW
3-UW
1-OW
2-EW
2-EW
2-EW
Price
3/31/2009
$5.48
$47.06
$21.58
$3.81
$18.35
$57.34
$30.65
$10.14
$S.61
$36.40
$35.03
$2.85
$19.81
$10.80
$33.24
$14.40
$6.50
$12.19
$7.62
$26.57
$2.36
$34.64
$4.03
$2.38
$6.91
Source- 80 re lay 5 Capita!
(54 April 0!, 2009

REITs
Part Seven; Glossary of REIT Terms
April 01,2009 85

REITs
Part Seven: Glossary of REIT Terms
The following is o glossary of terms often referenced in REIT literature. Many of the
definitions are courtesy of NAREIT. More information on REITs can be found at
www.reit.com.
Cash Available for Distribution (CAD)
We calculate CAD by subtracting from Funds from Operations (FFO) both 1] normalized
recurring expenditures that are capitalized by the REIT and then amortized, but that are
necessary to maintain a REIT's properties and its revenue stream (e.g., new carpeting and
drapes in apartment units, leasing expenses and tenant improvement allowances); and 2)
"straight-lining" of rents. This calculation also is called Adjusted Funds from Operations
(AFFO) or Funds Available for Distribution (FAD).
Capitalization Rate
Capitalization rate (or "cap" rate) for a property, determined by dividing the property's net
operating income by its purchase price. Generally, high cap rates indicate higher returns
and greater perceived risk.
Cost of Capital
Cost to a company, such as a REIT, of raising capital in the form of equity (common or
preferred stock) or debt. The cost of equity capital generally is considered to include both
the dividend rate as well as the expected equity growth either by higher dividends or
growth in stock prices. The cost of debt capital is merely the interest expense on the debt
incurred.
Down REIT
Structured much like an UPREIT, but the REIT owns and operates properties other than its
interest in a controlled partnership that owns and operates separate properties,
EBITDA
Earnings before interest, taxes, depreciation, and amortization. This measure is sometimes
referred to as Net Operating Income (NO!].
Equitization
Process by which the economic benefits of ownership of a tangible asset, such as rea
estate, are divided among numerous investors and represented in the form of publicly
traded securities.
Equity Market Cap
Market value of all outstanding common stock of a company.
96 April 01, 2009

REITs
Equity REIT
REIT which owns, or has an "equity interest" in, rental real estate [rather than making loans
secured by real estate collateral).
Funds from Operations (FFO)
Most commonly accepted and reported measure of REIT operating performance. Equal to
a REIT's net income, excluding gains or losses from sales of property, and adding back
rea estate depreciation. [See page 62 [check] for a discussion of FFO.)
Hybrid REIT
REIT that combines the investment strategies of both equity REITs and mortgage REITs.
Implied Equity Market Cap
Market value of all outstanding common stock of a company plus the va ue of all LJPREIT
partnership units as if they were converted into the REIT's stock. It excludes convertible
preferred stock, convertible debentures, and warrants even though these securities have
simiar conversion features.
Leverage
Amount of debt in relation to either equity capital or total capital-
Mortgage REIT
REIT that makes or owns loans and other obligations that are secured by real estate
collateral.
Net Asset Value (NAV)
Net "market value" of all of a company's assets, including but not limited to its properties,
after subtracting all of its liabilities and obligations.
Positive Spread Investing (PSI)
Ability to raise funds (both equity and debt) at a cost substantially less than the initial returns
that can be obtained on real estate transactions.
Real Estate Investment Trust Act of 1960
Federal law that authorized REITs. Its purpose was to allow small investors to pool their
investments in rea estate in order to get the same benefits as might be obtained by direct
ownership, while also diversifying their risks and obtaining professional management.
Real Estate Investment Trust (REIT)
Company dedicated to owning, and in most cases, operating income-producing real
estate, such as apartments, shopping centers, offices, and warehouses. Some REITs also
engage in financing real estate.
April 01, 2009 87

REITs
REIT Modernization Act of 1999
Federal tax law change whose provisions allow a REIT to own up to 100% of stock of a
taxable REIT subsidiary that can provide services to REIT tenants and others. The law also
changed the minimum distribution requirement to 90% from 95% of a REIT's taxable
income—consistent with the rules for REITs from 1960 to 1 980.
Securitization
Process of financing a poo of similar but unrelated financial assets (usually loans or other
debt instruments) by issuing to investors security interests representing claims against the
cash flow and other economic benefits generated by the poo of assets.
Straight-Lining
Real estate companies such as REiTs "straight line" rents because generally accepted
accounting principles require it. Straight-lining averages the tenant's rent payments over the
life of the lease.
Tax Reform Act of 1986
Federal law that substantially altered the rea estate investment landscape by permitting
REITs not only to own, but a so to operate and manage, most types of income-producing
commercia properties. It also stopped real estate "tax shelters" that had attracted capita
from investors based on the amount of losses that could be created.
Total Market Cap
Total market value of a REIT's [or other company's) outstanding common stock and
indebtedness.
Total Return
A stock's dividend income plus capital appreciation, before taxes and commissions.
UPREIT
In the typical UPREIT, the partners of the Existing Partnerships and a newly formed REIT
become partners in a new partnership termed the Operating Partnership (OP). For their
respective interests in the OP ("units"), the partners contribute the properties from the Existing
Partnership and the REIT contributes the cash proceeds from its public offering. The REIT
typically is the general partner and the majority owner of the OP Units.
After a period of time (often one year), the partners may enjoy the same liquidity of the REIT
shareholders by tendering their units for either cash or REIT shares (at the option of the REIT
or OP). This conversion may result in the partners incurring the tax deferred at the UPREIT's
formation. The unirholders may tender their units over a period of time, thereby spreading
out such tax. In addition, when a partner holds the units until death, the estate tax rules
operate in such a way as to provide that the beneficiaries may tender the units for cash or
REIT shares without paying income taxes.
April 01, 2009

REITs
On September 20, 2008, Borcloys Capitol acquired Lehman Brothers' North American investment banking, capital markets, and private investment management businesses. Duringmis transition period, we hove endeavored to provide out respedivB conflicts of interest disclosures on o combined basis. All ratings and price targets prior to trie acquisition date•elate to coverage under Lehman Brothers Inc.
Important Disclosures:
Avalonbay Communities Inc. (AVB)Rating and Price Target Chart:
U5$ 43.83 (30-Mar-2009)
AVALONBAY COMMUNITIES INC.
1-Overweight / 1-Positive
As 012<V-Mar-2009Currency = USD
3-06 6-06 12-06 3-07 6-07 9-07 12-07 3-OB 6-08 9-08 12-08 3-09
— Closing Price 4• Recommendation Change X
Price TargetDrop Coverage
Source: Fact Set
Currency=U$$Date ' Closing PriceOWebW13-ian-09
22-Dec-08
19-Nov-OB
26-Sep-08
08-AuoX)8
23-JUI-08
23-Jul-08
19-Jun-08
02-Mav08
18-Dec-07
51.01
53.68
61.80
45.75
99.26
104.53
100.69
100.69
96.42
105.3792.58
Rating
] -OverweightDropped
Price Target55.00
59.00
72.00
74.00
105.00
109.00
108.00
105.00
103.00
Date31-May4731-Mciy0716-Apr-0702-Feb-07Ol-Feb-0709-Jarr0714-0ec-0627-OcM)619-$ep-0626-Apr-06
Closing Price130.39
130.39
128.19145.59146.88
129.38131.45
129.49
123.74
107.41
Rating2 -Equal weight
Price Target
128.00118.00125.00117.00117.00115.00110.00105.0090.00
FOR EXPLANATIONS OF RATINGS REFER TO THE STOCK RATING KEYS LOCATED ON THE BACK PAGE.
Barclays Capital and/or on affiliate makes a market or provides liquidity in the securities of Avolonbay Communities Inc..Barclays Capital and/or an affiliate hade regularly in the shares of Avalonbay Communities Inc..
Risks Which May Impede the Achievement of the Price Target Near-term risks to our forget price include the ability to finish and lease developments, a prolonged economic slowdown, an increasein job losses, and migration of fund flows away from REITs generally.
Other Material Conflicts: Barclays Capital Inc. is associated witfi specialist firm Barclays Capital Market Makers who makes a market in Avalonbay Communities stock. At any given time, the associatedspecialist may hove "long" or "short" inventory position in the stock; and the associated specialist may be on the opposite side of orders executed on the Floor of the Exchange in the stock. BarclaysCapital Inc. and/or an affiliate makes a market in the securities of this company.
April 01, 2009 89

REITs
Important Disclosures Continued:
Boston Properties Inc. (BXP)Rating and Price Target Chart:
US$ 31.92 (30-Mar-2009)
BOSTON PROPERTIES INC.
1-Overweight / 1-Positive
Asol24-M3r-2009Currency = USD
6-06 9-06 12-06 3-07 6-07 9-07 12-07 3-08 6-08 9-08 12-08 3-09
— Closing Price i Price Target• Recommendation Change X Drop Coverage
Source: FactSet
Cinreiicy=US$
Date
20-Jan-09
03-Nov-OB
26-Sep-OS
23-Jur08
Closing Price
40.96
66.49
94.71
100.00
23-JuW8 i 100.00
19-Jun-OB ; 98.89
01-Maf08
3Han4B
18-Dec-O?
105.04
91.71
93.70
Rating
1 -Overweight
Dropped
Price Target
65.00
80.00
100.00
107.00
105.00
102.00
105.00
Date
2l-AucH]7
ll-)uH)7
Ol-Feb-07
!4-Dec-06
!9-$e|>06
l9-Sep-06
28-Jul-06
26-6pi-06
Closing Price
101.01
103.41
126.09
116.30
104.98
104.98
97.91
85.90
Rating
1 -Overweight
_F_n«I(!f9^^_120.00
125.00
130.00
125.00
115.00
90.00
85.00
FOR EXPLANATIONS OF RATINGS REFER TO THE STOCK RATING KEYS LOCATED ON THE BACK PAGE.
Barclays Capital and/or an affiliate makes a market or provides liquidity in the securities of Boston Properties Inc..Barclays Capital and/or an affiliate trade regularly in the shares of Boston Properties Inc..
Risb Which May Impede the Achievement of the Price Target. Near-term risks to our target price include more significant rental tote and asset value declines than expected in urban markets,potential future bankruptcy related lease vacancies, weaker than expected development yields, inability to access capital, and funds flow away from REITs generally.
90 April 01, 2009

REITs
Important Disclosures Continued:
Kimco Realty Corp. (KIM)
Rating and Price Target Chart:
USS 6.97 (30-Mar-2009)
KIMCO REALTY CORP.
1 -Overweight / 1 -Positive
56.00-,
Asof24-MBr-20Q9
Currency = USD
5200-
48.00-
44.00-
40.00-
36.00-
32.00-
28.00 -
24.00 -
20.00 -
16.00
1200
8.00
4.00
3-
Xl A
A / F*VXVV \
h V7 * T
'%/j T
06 6-06 9-06 12-06 3-07 6-07
—I ]• • • • ) ••• i9-07 12-07 3-08 6-08
— Closing Price 4 Price Target• Recommendation Change X Drop Coverage
9-08 12-08 3-09
Source FactSet
Currency=US$
Date
09-Feb09
17-Nov08
26-Sep-OB
ll-Sep-08
23-JurG8
23-JuK)8
19-Jun-08
02-May-Oo
07-Feb-08
18^)ec-07
21-Aug-O?
Closing Price
13.45
16.9938.38
38.29
36.97
36.97
37.24
41.24
36.35
35.93
40.54
Rating
1 -Overweight
Dropped
Price Target
20.00
25.00
42.00
40.00
38.00
40.00
39.00
40.00
45.00
Date ; Closing Price
ll-JuH)7
Q4-May-07
H-feb-07
14-Dec-06
Sl-Oct-06
19-Sep-06
26-JuK)6
ll-Jul-06
16-Jun-06
16-Jun-06
38.1548.28
52.1346.1644.43
41.7638.57
37.68
36.04
36.04
Rating Price Tatget
42.00
52.00
50.00
i 48.00
2 -Equal weight
42.00
40.00
37.00
36.00
35.00
FOR EXPLANATIONS OF RATINGS REFER TO THE STOCK RATING KEYS LOCATED ON THE BACK PAGE.
Barclays Capitol and/or an affiliate mokes a morket or provides liquidity in the securities of Kimco Realty Corp..Barclays Capitol and/or an affiliate trade regularly in tne shares of Kimco Realty Corp..
Risks Which May Impede the Achievement of the Price Target: Near-term risks to our target price include a slowdown consumer spending, tenant bankruptcy/store closings, inability to leasedevelopment projects, risk of financing development projects, and funds flow out of REITs generally.
Other Material Conflicts: Barclays Capitol is associated with specialist firm Barclays Capitol Market Makers who makes a market in Kimco Realty stock. At any given time, the associated specialist mayhave "long" or "short" inventory position in the stock; and the associated specialist may be on the opposite side of orders executed on the Floor of the Exchange in the stock. Barclays Capital and/or anaffiliate makes a market in the securities of this company.
April 01, 2009 91

REITs
Important Disclosures Continued:
Simon Property Group Inc. (SPG)Rating and Price Target Chart:
US$ 30.86 (30-Mar-2009)
SIMON PROPERTY GROUP INC.
1-Overweight / 1-Positive
Asof24-Mar-2009Currency = USD
3-06 6-06 9-06 12-06 3-07 6-07 9-07 12-07 3-08 6-08 9-08 12-08 3-09
— Closing Price A Price Target• Recommendation Change x Drop Coverage
Source: FactSet
Currency=US$Date24-Mar-09
20-Jan-09OS-Nov-0823-JuW8
23-JuK)819-Jun-OS
304pr-08
18-Dec-073(H)ct-07
Closing Price35.20
40.17
63.19
91.36
91.36
95.58
97.53
87.69
100.00
Rating Price Target> 60.00
1 -OverweightDropped
68.3783.0299.62
107.44
102.55107.44
Date31-JuK)7ll-JuK)730-ApK)705-Feb4714-Dec-OtOl-Nov-0619-$ep-06
Ol-Aug-06
28-Apr-06
Closing Price84.51
89.11
112.59113.56
98.4294.76
89.46
82.4279.97
Rating Price Target105.48
117.20122.09117.20112.32102.5597.6787.9085.95
FOR EXPLANATIONS OF RATINGS REFER TO THE STOCK RATING KEYS LOCATED ON THE BACK PAGE.
Barclays Capital and/or on affiliate makes a market or provides liquidity in trie securities of Simon Property Group Inc..Barclays Capital and/or an affiliate trade regularly in the shares of Simon Property Group Inc..
Risks Which May Impede the Achievement of the Price Target: Near-term risks to our target price include a slowdown consumer spending, tenant bankruptcy/store closings, inability to leasedevelopment projects, risk of financing development projects, and funds flow out of RElTs generally.
April 01,2009

REITs
Important Disclosures Continued:
Vornado Realty Trust (VNO)Rating and Price Target Chart:
US$31.21 (30-Mar-2009)
VORNADO REALTY TRUST
1-Overweight/ 1-Positive
As of 24-Mar-2009Currency - USD
6-07 9-07 12-07 3-08 6-08 9-08 12-08 3-09
— Closing Price A Price Targel• Recommendation Change x Drop Coverage
Source. FactSet
Cufrency=US$
Date
20-Jan-09
06^ov-08
26-SerH)8
06-Aug-OS
23-Jul-08
23-JuWo
19-Jun-08
07-Mar08
18-Dec-07
21-Aug-07
Closing Price
46.78
62.70
93.06
97.39
94.29
94.29
92.52
92.81
83.91
105.40
Rating Price Target
63.87
78.60
- 96.29
103.17
99.24
1 -Ovewjeight '
Dropped
98.25
96.29
117.90
Dote
Ol-Aug-0708-Feb-07
18-Jan-07
18-Jan-07
14-Dee06
01-No*06
19-$ep-06
16-Mar-06
Ol-Mar-06
Closing Price
106.07
132.30
117.81
117.81
121.83
117.01
108.89
95.83
88.22
Rating
1 -Overweight
R$ -Rating Suspended
Price Target
122.82
0.00132.64
12162112.99
98.25
91.38
FOR EXPLANATIONS OF RATINGS REFER TO THE STOCK RATING KEYS LOCATED ON THE BACK PAGE.
Barclays Capitol and/or an affiliate makes a market or provides liquidity in the securities of Vomado Realty Trust.Barclays Capital and/or an affiliate expects to receive or intends to seek compensation for investment banking services from Vornado Realty Trust within the next 3 months.Barclays Capital and/or an affiliate trade reguloriy in the shares of Vornado Realty Trust,Vornado Realty Trust is or during the past 12 months has been an investment banking client of Barclays Capital ond/or Lehman Brothers Inc. ond/or one of their affiliates.
Risks Which May Impede the Achievement of the Price Target: Near-term risks to our target price include a slowdown of the New York and Washington DC office markets, lower than expecteddevelopment yields, inability to raise ond/or invest incremental capital, ond funds flow away from REITs generally.
April 01, 2009 93

REITs __
Important Disclosures Continued:
Other Material Conflicts
Avalonbay Communities inc. (AVB): Barclays Capital Inc. is associated with specialist firm Barclays Capital Market Makers who makes a market in Avalonbay Communities stock. At any given time,the associated specialist may have "long" or "short" inventory position in the stock; and the associated specialist may be on the opposite side of orders executed on the Floor of the Exchange in thestock. Barclays Capitol Inc. and/or an affiliate makes o market in the securities of this company.
Kimco Realty Corp. (KIM): Barclays Capital is associated with specialist firm Barclays Capital Market Makers wfio makes a market in Kimco Realty stock. At any given time, the associated specialistmay have "long" or "short" inventory position in the stock; and the associated specialist may be on the opposite side of orders executed on the Floor of the Exchange in the stock. Barclays Capitaland/or an affiliate makes o market in the securities of this company.
Sector Coverage Universe
Below is the list of companies that constitute the sector coverage universe:
Alexandria Real Estate Equities Inc. (ARE) AMB Property Corp. (AMB)
Apartment Investment & Management Co. (AIV) Avalonfwy Communities Inc. (AVB)
Boston Properties Inc. (BXP) Brandywine Realty Trust (BDN)
Camden Property Trust (CPT) CB Richard Ellis Group, Inc. (CBG)
CBL & Associates Properties Inc. (CBL) Colonial Properties Trust (CLP)
Equity One Inc. (EOY) Equity Residential (EOR)
Essex Property Trust Inc. (ESS) Home Properties Inc. (HME)
Kimco Realty Corp. (KIM) Lexington Realty Trust (LXP)
Mack-Cali Realty Corp. (CLI) Post Properties Inc. (PPS)
ProLogis (PLD) Regency tenters Corp. (REG)
Simon Property Group Inc. (SPG) SL Green Realty Corp. (SLG)
UDR, Inc. (UDR) Vornado Realty Trust (VNO)
Winthrop Reafty Trust, Inc. (FUR)
Barclays Capital offices involved in the production of Equity Research:LondonBarclays Capitol, the investment banking division of Barclays Bonk Pic (Barclays Capital, London)
New YorkBarclays Capitol Inc. (BCI, New York)
TokyoBarclays Capitol Japan limited (BGL, lokyo)
Mentioned Company Ticker Price Price Date Stock / Sector Rating
Avalonbay Communities Inc. AVB USS 43.83 30 Mar 2009 1 -Overweight /1 -Positive
Boston Properties Inc. BXP USS 31.92 30 Mar 2009 1 -Overweight /1 -Positive
Kimco Realty Corp. KIM USS 6.97 30 Mar 2009 1 -Overweight /I -Positive
Simon Property Group Inc. SPG USS 30.86 30 Mar 2009 1 -Overweight /1 -Positive
Vornado Realty Trust VNO USS31.21 30Mar2009 1-Overweight/I-Positive
94 Apr',} 01, 2009

FOR CURRENT IMPORTANT DISCLOSURES REGARDING COMPANIES THAT ARETHE SUBJECT OF THIS RESEARCH REPORT, PLEASE SEND A WRITTEN REQUEST TO:
BARCLAYS CAPITAL RESEARCH COMPLIANCE745 SEVENTH AVENUE, 17TH FLOOR, NEW YORK, NY 10019
ORREFER TO THE FIRM'S DISCLOSURE WEBSITE AT www.lehman.com/disclosures
Important Disclosures Continued:The analysts responsible for preparing this report have received compensation based upon various factors including the firm's total revenues, a portion of which is generated by investment bonking activities.
Guide to me Barclays Capital Fundamental Equity Research Rating System:Our coverage analysis use a relative rating system in which they rate stocks as !-Overweight, 2-Equal weight or 3-Underweight (see definitions below) relative to other companies covered by the analyst ora foam of analysts that are deemed to be in the same industry sector ("the sector coverage universe"). To see a list of companies that comprise a particular sector coverage universe, please go towww.lehman.com/disclosures.In addition to the stock rating, we provide sector views which rate the outlook for the sector coverage universe as 1-Positive, 2-Neurrol or 3-Negatjve (see definitions below). A rating system using termssun as buy, hold and sell is not the equivalent of our rating system. Investors should carefully read the entire research report including the definitions of all ratings and not infer its contents from ratingsalone.
Stack Ratings:1 -Overweight - The stock is expected to outperform the unweighted expected total return of the sector coverage universe over a 12-month investment horizon.2-Equol weight • The stock is expected to perform in line with the unweighted expected total return of the sector coverage universe over a 12-month investment horizon.3-U nderweight - The stock is expected to underperform the unweighted expected total return of the sector coverage universe over a 12-month investment horizon.RS-Rating Suspended - The rating and target price have been suspended temporarily due to market events that made coverage impracticable or to comply with applicable regulations and/or firm policies incertain circumstances including when Barclays Capital is acting in an advisory capacity in a merger or strategic transaction involving the company.
Sector View:1 -f ositive - sector coverage universe fundamentals/valuations are improving.2-nieutral - sector coverage universe fundamentals/valuations are steady, neither improving nor deteriorating.
3-hiegative • sector coverage universe fundamentals/valuations are deteriorating.
IRS Order 230 Prepared Materials Disclaimer: Barclays Capital and its affiliates do not provide tax advice and nothing contained herein should be construed to be tax advice. Please be advised that any discussion of U.S. taxmatters contained herein (including any attachments) (i) is not intended or written to be used, and connot be used, by you for the purpose of avoiding U.S. tax-related penalties; and (ii) was written to support the promotion ormarketing of the transactions or other matters addressed herein. Accordingly, yoj should seek advice based on your particular circumstances from en independent tax advisor.This publication has been prepared by Barclays Capital, Inc., a US registered broker/dealer and member of FINRA. This publication is provided to you for information purposes only. Prices shown in this publication are indicative ondBan:lays Capital is not offering to buy or sell or soliciting offers to buy or sell any financial instrument Other thon disclosures relating to Barclays Capital, the information contained in this publication has been obtained from sourcesttial Barclays Capital knows to be reliable, but we do not represent or warrant that it is accurate or complete. The views in this publication are those of Barclays Capital ond are subject to change, and Barclays Capital has noobligation to update its opinions or the information in this publication.Neither Barclays Capital, nor any affiliate, nor any of their respective officers, directors, partners, or employees accepts any liability whatsoever for any direct or consequential loss arising from any use of this publication or itsconsents. The securities discussed in this publication may not be suitable for all investors. Barclays Capital recommends that investors independently evaluate each issuer, security or instrument discussed in this publication, andconsult any independent advisors they believe necessary. The value of and income from any investment may fluctuate from day to day as a result of changes in relevant economic markets (including changes in market liquidity).The information in this publication is not intended to predict actual results, which may differ substantially from those reflected.This communication is being made available in the UK ond Europe to persons who are investment professionals as that term is defined in Article 19 of the Financial Services ond Markets Act 2000 (Financial Promotion Order)2005. It is directed at persons who have professional experience in matters relating to investments. The investments to which it relates are available only to such persons and will be entered into only witfi such persons. BarclaysCap tal - the investment banking division of Barclays Bank PIC, authorised and regulated by the Financial Services Authority CFSA') and member of the London Stock Exchange.Sub'ect to the conditions of this publication as set out above, ABSA CAPITAL, the Investment Banking Division of ABSA Bank Limited, an authorised financial services provider (Registration No.: 1986/004794/06), is distributingihis mnlenoi in Soulli Mrtcn. ftny South Mricon person or entity wishing to ettect a transaction 'in any security discussed herein should do so only by contacting a representative of ABSA Capitol in South Africa, ABSA TOWERS NORTH,180 COMMISSIONER STREET, JOHANNESBURG, 2001. ABSA CAPITAL IS AN AFFILIATE OF BARCLAVS CAPITAL.Non-U.S. persons should contact ond execute transactions through a Barclays Bank PLC branch or affiliate in their home jurisdiction unless local regulations permit otherwise.In bpan, this report is being distributed hy Barclays Capital Japan Limited to institutional investors only. Barclays Capital Japan limited is a joinhtock company incorporated in Japan with registered office of 2-2-2, Otemocfii,Chi^oda-ku, Tokyo 100-0004, Japan. It is o subsidiary of Barclays Bank PLC and c registered financial instruments firm regulated by the Financial Services Agency of Japan. Registered Number: Kanto Zoirnukyokucho (kinsho)No. 143.
Barclays Bank PLC Fmnkfi/rt Branch is distributing this material in Germany under the supervision of Bundesanstalt f jer Finanzdienstleistungsaufsicht.© Copyright Barclays Bank PLC (2009). All rights reserved. No part of this publication may be reproduced in any manner without the prior written permission of Barclays Capital or any of its affiliates. Barclays Bank PLC istitered in England No. 1026167. Registered office 1 Churchill Plocs, London, El 4 5HP.
Affitfioral information regoiding tfts oubJicoion will be furnished upon request.