The Determinants of Non-Farm Income Diversification in...
23
The Determinants of Non-Farm Income Diversification in Rural Ethiopia Prowse, Martin Published in: Journal of Poverty Alleviation and International Development 2015 Document Version: Publisher's PDF, also known as Version of record Link to publication Citation for published version (APA): Prowse, M. (2015). The Determinants of Non-Farm Income Diversification in Rural Ethiopia. Journal of Poverty Alleviation and International Development, 6(1), 109-130. General rights Copyright and moral rights for the publications made accessible in the public portal are retained by the authors and/or other copyright owners and it is a condition of accessing publications that users recognise and abide by the legal requirements associated with these rights. • Users may download and print one copy of any publication from the public portal for the purpose of private study or research. • You may not further distribute the material or use it for any profit-making activity or commercial gain • You may freely distribute the URL identifying the publication in the public portal Take down policy If you believe that this document breaches copyright please contact us providing details, and we will remove access to the work immediately and investigate your claim.
Transcript of The Determinants of Non-Farm Income Diversification in...
LUND UNIVERSITY
PO Box 117221 00 Lund+46 46-222 00 00
The Determinants of Non-Farm Income Diversification in Rural Ethiopia
Prowse, Martin
Published in:Journal of Poverty Alleviation and International Development
2015
Document Version:Publisher's PDF, also known as Version of record
Link to publication
Citation for published version (APA):Prowse, M. (2015). The Determinants of Non-Farm Income Diversification in Rural Ethiopia. Journal of PovertyAlleviation and International Development, 6(1), 109-130.
General rightsCopyright and moral rights for the publications made accessible in the public portal are retained by the authorsand/or other copyright owners and it is a condition of accessing publications that users recognise and abide by thelegal requirements associated with these rights.
• Users may download and print one copy of any publication from the public portal for the purpose of private studyor research. • You may not further distribute the material or use it for any profit-making activity or commercial gain • You may freely distribute the URL identifying the publication in the public portalTake down policyIf you believe that this document breaches copyright please contact us providing details, and we will removeaccess to the work immediately and investigate your claim.
Journal of Poverty Alleviation and International Development, 6(1)
©2015 The Authors. Published by the Institute for Poverty Alleviation and International Development under open access license CC BY-NC-ND 3.0.
jpaid.yonsei.ac.kr
The Determinants of Non-Farm Income Diversification in Rural Ethiopia
1
Zerihun Berhane WELDEGEBRIEL, Giuseppe FOLLONI & Martin PROWSE*
Abstract: Diversification has long been viewed as a risk minimization strategy in the face of increasing climatic and economic risks in developing countries. This paper examines the determinants of non-farm income diversification in rural Ethiopia for a four-wave panel of 1240 households from the Ethiopian Rural Household Survey over the period 1994–2009. The paper makes a conceptual distinction between non-farm and off-farm income and uses fixed and random-effects models to control for unobserved characteristics. The results suggest that the variables that determine non-farm diversification—consumption per capita and livestock holdings—belong to pull factors and reflect a strategy by wealthier households. Coupled with instrumental variable estimations to ascertain the direction of causality, these findings lend support to the argument that the main motivation for increasing non-farm diversification is likely to be accumulation.Keywords: Non-farm diversification, Fixed and Random-effects, Rural Ethiopia
* This is an open-access article distributed under the terms of the Creative Commons license Attribution-Noncommercial-NoDerivs 3.0 Unported. Distribution and reproduction are permitted, provided that the original authors and JPAID as the source are credited.** Zerihun Weldegebriel (corresponding author) is a Ph.D. candidate at the University of Trento (Local Development and Global Dynamics). Email: [email protected]. Address: Via Malpensada 140, 38123 Trento, Italy. Giuseppe Folloni is Professor of Economics at the Department of Economics and Management, University of Trento, Italy. Email: giuseppe. [email protected]. Martin Prowse is an Associate Senior Lecturer at the Department of Human Geography, Lund University, Sweden. Email: martin. [email protected] received 24.11.2014; revised 27.04.2015; accepted 02.05.2015
110 Journal of Poverty Alleviation and International Development
Diversification can be defined as the maintenance and continuous alteration of a highly-varied range of activities and occupations to minimize household income variability, reduce the adverse impacts of seasonality, and provide employment or additional income (Ellis 2000; Barrett et al. 2001; Lanjouw & Lanjouw 2001; Davis & Bezemer 2004; Haggblade et al. 2010). Diversification may occur either as a deliberate household strategy or as an involuntary response to a crisis (Ellis 1998). The motivation for diversification strategies therefore varies in terms of household characteristics, location, assets, income level, opportunities, institutions and social relations (Ellis 2000).
A simple push–distress vs. pull–accumulation dichotomy offers a useful way of grouping these motivations (Barrett et al. 2001; Möllers & Buchenrieder 2005). Push factors include limited risk-bearing capacity in the presence of an incomplete or weak financial system, constraints in labor and land markets, and climatic uncertainty that create strong incentives to select a portfolio of activities in order to stabilize income flows (Barrett et al. 2001; Deshingkar 2004). Pull factors include local opportunities such as commercial agriculture, proximity to an urban area, and/or major transport links (Barrett et al. 2001: 316). Rural households are pulled into non-farm activities when the returns to labor and capital are greater than for farming.
Diversification in fact can have positive or negative consequences for rural households (Hart 1994). For instance, certain types of diversification strategies may provide short-term security but trap households in low-return activities that make poverty persistent (such as poorly-paid piecework that leads to the neglect of farm production) or can degrade the natural-resource base (such as unsustainable charcoal production) (Barrett et al. 2001; Ellis & Freeman 2005).
This hints to the existence of an important conceptual distinction between two types of diversification strategies: off-farm and non-farm. Following Ellis (1998; 2000), we define off-farm diversification as temporary “wage or exchange labor on other farms within agriculture” (Ellis 1998: 5). Moreover, as discussed by Ellis (2000), we consider local
The Determinants of Non-Farm Income Diversification in Rural Ethiopia 111
environmental resource extraction such as firewood collection, charcoal production and gathering wild fruits as an off-farm diversification strategy. Non-farm diversification refers to activities that are not directly related to agricultural production and can be wage or self-employment/ own-business based (see also Weldegebriel & Prowse 2013). The focus of this paper is on non-farm diversification due to the contribution it can make in transforming the rural economy (Reardon 1997; Lanjouw & Lanjouw 2001; Haggblade et al. 2010).
There is an extensive literature that deals with the determinants of non-farm diversification in rural parts of the developing world (Ellis 2000; Woldenhanna & Oskam 2001; Barrett et al. 2001; Corral & Reardon 2001; Escobal 2001; Yúnez-Naude & Taylor 2001; Lanjouw et al. 2007; Lemi 2010). This literature indicates that the rural non-farm sector is gaining importance in most developing countries, even if agriculture remains the main source of income and employment. Table 1 below provides a summary of some of these studies.
In regard specifically to rural Ethiopia, households have been found to diversify their income sources due to both push and pull factors. Push factors such as rural population growth, farm fragmentation and declining agricultural productivity are commonly-cited causes for diversifying (Degefa 2005). Moreover, studies show that pull factors, such as urban or local demand, can lead to non-farm activities that enhance the household’s economic standing (Yared 1999). Thus, rural households tend to engage in a variety of non-farm activities including food-for-work schemes, grain trading, petty trading, migration, liquor sales and the sale of handicrafts (Yared 1999; Degefa 2005).
Previous studies suggest that the determinants of diversification in rural Ethiopia vary according to wealth status. For example, Demisse and Workneh (2004) in their study of diversification in south Ethiopia, indicate that asset ownership, especially livestock, plays a major role in influencing households’ decisions to diversify into non-farm activities. Moreover, they show that labor, both in terms of its quantity and quality, determines the choice of diversification as this overcomes entry barriers
112 Journal of Poverty Alleviation and International Development
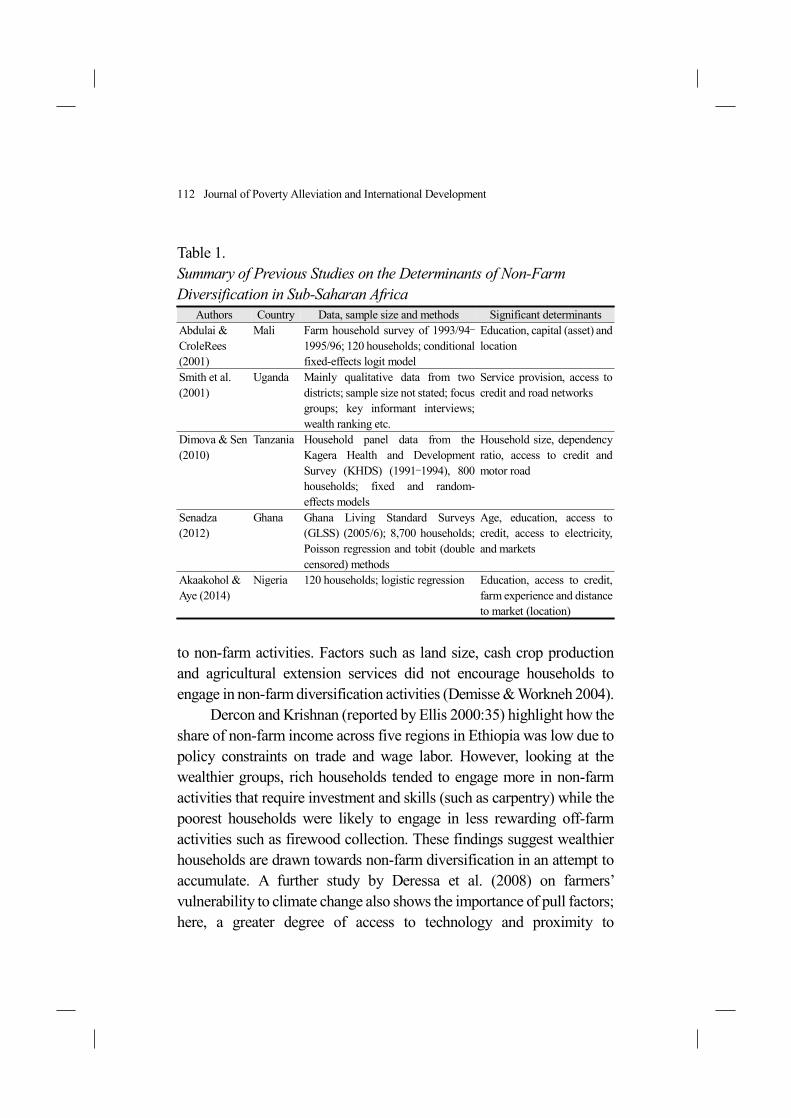
Table 1. Summary of Previous Studies on the Determinants of Non-Farm Diversification in Sub-Saharan Africa
Authors Country Data, sample size and methods Significant determinantsAbdulai & CroleRees(2001)
Mali Farm household survey of 1993/94–1995/96; 120 households; conditional fixed-effects logit model
Education, capital (asset) and location
Smith et al. (2001)
Uganda Mainly qualitative data from two districts; sample size not stated; focus groups; key informant interviews; wealth ranking etc.
Service provision, access to credit and road networks
Dimova & Sen (2010)
Tanzania Household panel data from the Kagera Health and Development Survey (KHDS) (1991–1994), 800 households; fixed and random- effects models
Household size, dependency ratio, access to credit and motor road
Senadza (2012)
Ghana Ghana Living Standard Surveys (GLSS) (2005/6); 8,700 households; Poisson regression and tobit (double censored) methods
Age, education, access to credit, access to electricity, and markets
Akaakohol & Aye (2014)
Nigeria 120 households; logistic regression Education, access to credit, farm experience and distance to market (location)
to non-farm activities. Factors such as land size, cash crop production and agricultural extension services did not encourage households to engage in non-farm diversification activities (Demisse & Workneh 2004).
Dercon and Krishnan (reported by Ellis 2000:35) highlight how the share of non-farm income across five regions in Ethiopia was low due to policy constraints on trade and wage labor. However, looking at the wealthier groups, rich households tended to engage more in non-farm activities that require investment and skills (such as carpentry) while the poorest households were likely to engage in less rewarding off-farm activities such as firewood collection. These findings suggest wealthier households are drawn towards non-farm diversification in an attempt to accumulate. A further study by Deressa et al. (2008) on farmers’ vulnerability to climate change also shows the importance of pull factors; here, a greater degree of access to technology and proximity to
The Determinants of Non-Farm Income Diversification in Rural Ethiopia 113
infrastructure were found to be critical for engaging in non-farm diversification.
However, the literature is not in full agreement on this matter. A study by Tegenge (2000) in two districts in the south of Ethiopia found two push factors (low crop yields and high density of rural population) but also one pull factor (proximity to urban centers) as the most important factors influencing diversification. More importantly, a study by Sosina et al. (2012) finds that non-farm income positively correlates with household’s consumption expenditure growth across all wealth groups in Ethiopia.
Pulling the studies together, two main positions are advanced in the literature. First, non-farm diversification is caused by pull–accumulation factors and mainly conducted by wealthier households. And second, it is caused by both pull–accumulation and push–distress factors and is income-neutral.
This study complements existing studies on non-farm diversification in three ways. First, as outlined above, it makes use of a rigorous operational definition that clearly distinguishes between non-farm and off-farm activities. Second, the study uses four rounds of the Ethiopian Rural Household Survey (ERHS) and adopts fixed and random-effects estimations to control for unobserved household characteristics that may correlate with household diversification decisions. Third, it implements an instrumental variable approach to check the direction of causality between non-farm diversification and significant variables in order to find out the underlying motivations for non-farm diversification.1
1 According to Barrett et al. (2001), diversification is mostly measured by the shares of income earned from different activities or by assets employed in different activities. In this study, income is employed as an indicator of the level of livelihood diversification, since individual or household income at a given point in time is the most direct and measurable outcome of the livelihood process (Barrett et al. 2001). The components of income include both cash and in-kind income from crops and livestock, wages, rents and remittances, deriving from the set of activities in which household members
114 Journal of Poverty Alleviation and International Development
The results suggest that the variables that determine non-farm diversification belong to pull factors and reflect a strategy by wealthier households. This, coupled with instrumental variable estimations, lend support to the argument that the main motivation for increasing non-farm diversification is likely to be accumulation.
The rest of the paper is organized as follows. The following section describes the data and methodology used. Then, we present the econometric models we will use. Next, there is presentation and discussion of the results. The final section concludes.
Data and Methodology
This study uses data from the Ethiopian Rural Household Survey (ERHS) for the period 1994–2009.2 It is a panel household survey that includes 1,477 households in 15 districts of rural Ethiopia. The surveys cover four major regions (Amhara, Tigray, Oromya and South) where the country’s largest proportion of settled farmers are found. The ERHS surveys are of high quality with low attrition rates and have been used by numerous studies.3 According to Dercon and Hoddinott (2011), the ERHS surveys can be considered as broadly representative of households in non-pastoralist farming systems, though not nationally representative. In this paper, data from the four rounds of surveys (from the years 1994, 1997, 2004 and 2009) are used, consisting of a total of 1,240 households.
are engaged. The in-kind income refers to the consumption of own-farm produce, in-kind payments (e.g. food) and transfers or exchange of consumption items that occur between households within rural communities or between urban and rural households (Ellis 2000).
2 The data were collected by the Economics Department of Addis Ababa University (AAU), the Centre for the Study of African Economies (CSAE), University of Oxford and the International Food Policy Research Institute (IFPRI).
3 As of 2010, the number of publications that have used the ERHS data in their analysis has reached 303, with 77 journal articles, 4 books and 26 book chapters with more than 3,000 citations (Renkow & Slade 2013).
The Determinants of Non-Farm Income Diversification in Rural Ethiopia 115
Although the information contained in these surveys is fairly consistent, there are modules present in the 2004 and 2009 rounds that were not included in previous surveys. These modules mainly include questions about shocks and public works. The four rounds of the surveys cover an extensive period between 1994 and 2009 and this allows for a robust estimation of the effects of variables that are constant over these time intervals (time-invariant factors) as well as those fixed between households.
In all survey years, households were asked about their participation in a range of activities and the income obtained from these activities in the past four months. Data on income are both in monetary values and in-kind quantities. To obtain comparable in-kind quantities, conversion factors—constructed at Peasant Association (PA) levels and provided by IFPRI along with the official version of ERHS data—were used to convert local units to standard (metric) units. For missing units, the median conversion unit at the next aggregate level (i.e. district or region) was used. After converting the in-kind amounts to standard units, nominal prices collected at PA level for each round of survey were used to obtain the monetary value of the items. Similarly, items with missing prices have been estimated using the median prices at the next aggregate level.
Since food represents around 80 percent of the consumption basket for the surveyed households, consumption was deflated by a food price index, based on PA prices and using average shares in 1994 as weights. The same food price indices are also used to deflate the value of farm and non-farm income of households. Thus, all incomes are expressed in real terms using 1994 prices.
Based on a review of the theoretical4 and empirical literature (see
4 There are different theoretical models that apply to the analysis of non-farm diversification. These models or frameworks are based on the rational choice approach and include: (1) the basic welfare model that focuses on monetary incentives and most often explained in terms of the demand–pull and distress–push factors; and (2) the Sustainable Livelihoods Framework (SLF), which stresses on access to capital and institutional environment (see Mollers & Buchenrieder 2005).
116 Journal of Poverty Alleviation and International Development
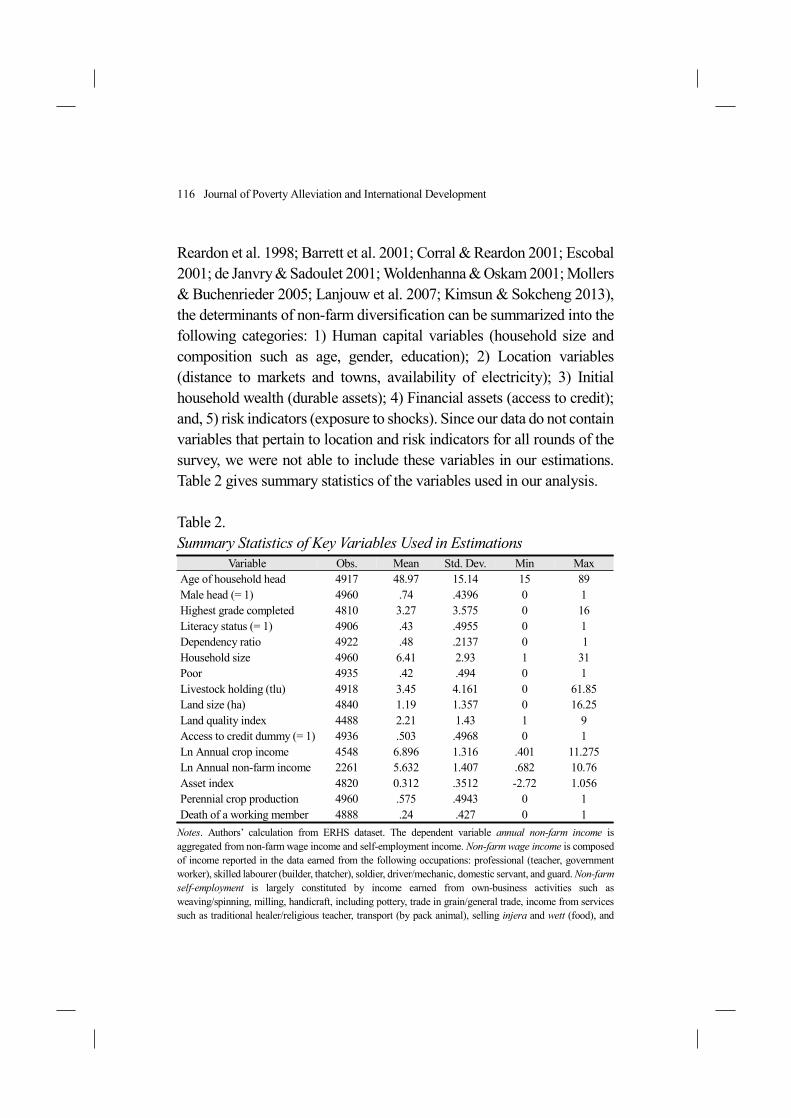
Reardon et al. 1998; Barrett et al. 2001; Corral & Reardon 2001; Escobal 2001; de Janvry & Sadoulet 2001; Woldenhanna & Oskam 2001; Mollers & Buchenrieder 2005; Lanjouw et al. 2007; Kimsun & Sokcheng 2013), the determinants of non-farm diversification can be summarized into the following categories: 1) Human capital variables (household size and composition such as age, gender, education); 2) Location variables (distance to markets and towns, availability of electricity); 3) Initial household wealth (durable assets); 4) Financial assets (access to credit); and, 5) risk indicators (exposure to shocks). Since our data do not contain variables that pertain to location and risk indicators for all rounds of the survey, we were not able to include these variables in our estimations. Table 2 gives summary statistics of the variables used in our analysis.
Table 2. Summary Statistics of Key Variables Used in Estimations
Variable Obs. Mean Std. Dev. Min MaxAge of household head 4917 48.97 15.14 15 89Male head (= 1) 4960 .74 .4396 0 1Highest grade completed 4810 3.27 3.575 0 16Literacy status (= 1) 4906 .43 .4955 0 1Dependency ratio 4922 .48 .2137 0 1Household size 4960 6.41 2.93 1 31Poor 4935 .42 .494 0 1Livestock holding (tlu) 4918 3.45 4.161 0 61.85Land size (ha) 4840 1.19 1.357 0 16.25Land quality index 4488 2.21 1.43 1 9Access to credit dummy (= 1) 4936 .503 .4968 0 1Ln Annual crop income 4548 6.896 1.316 .401 11.275Ln Annual non-farm income 2261 5.632 1.407 .682 10.76Asset index 4820 0.312 .3512 -2.72 1.056Perennial crop production 4960 .575 .4943 0 1Death of a working member 4888 .24 .427 0 1
Notes. Authors’ calculation from ERHS dataset. The dependent variable annual non-farm income is aggregated from non-farm wage income and self-employment income. Non-farm wage income is composed of income reported in the data earned from the following occupations: professional (teacher, government worker), skilled labourer (builder, thatcher), soldier, driver/mechanic, domestic servant, and guard. Non-farm self-employment is largely constituted by income earned from own-business activities such as weaving/spinning, milling, handicraft, including pottery, trade in grain/general trade, income from services such as traditional healer/religious teacher, transport (by pack animal), selling injera and wett (food), and
The Determinants of Non-Farm Income Diversification in Rural Ethiopia 117
tailoring. It also includes the making and selling of local drinks, carrying goods, builder (masonry), making roof for houses, rock splitting, and fruit and vegetable vending. Dependency ratio is defined as ratio of family members below age 15 and above age 60 to total family size. Poor is a dummy variable determined by using the Poverty line of 50 Birr/adult equivalents per month in 1994 prices. This poverty line has been used by various authors and calculated from a food poverty line (constructed using a bundle of food items that would provide 2300 Kcal per adult per day) and a non-food bundle using the method employed by Ravallion and Bidani (1994) (cited in Dercon & Hoddinott 2011). Average Land Quality Index is a composite variable that takes both slope and nutrient content of the soil into consideration. It is calculated by multiplying the two indicators. Thus, for example if a land has a flat slope, it is assigned a value of 1 and if it is rich in its mineral content it is given similar value of 1. Similarly, land with high slope and poor nutrients gets 3*3=9. Access to credit refers to a yes or no response to the survey question “have you ever taken out a loan of at least 20 Birr?” This may not necessarily indicate access to formal credit. Asset index is constructed using the principal component approach similar to the one adopted by Filmer and Pritchett (2001). The variables used to construct the index include the quality of housing (including the construction material, roof quality and number of rooms), ownership of household goods and valuables such as horse/mule/ox cart, weaving equipment, mill, hoe, plough, hammer, saw, saddle, axe, beds wooden/metal, table, chairs/bench, gas stove, radio/tape recorder, bicycle, jewellery/gold/wrist watches, guns, and cell phone. The first principal component captures most of the variance or information common to all and offers a measure of the asset richness of a household without the need for price information on each asset (Filmer & Pritchett 2001; Dimova & Sen 2010).
Econometric Models
If yit is non-farm income for household i at time t, we can define yit
as a function of explanatory variables, identified in the literature as the major determinants of non-farm diversification. Thus, the model that deals with the determinants of non-farm diversification can be written as:
yit = Xitβ + αi + εit , t = 1,2,...,T (1)
Where β are the parameters to be estimated,Xit represents “observable variables that change across t
but not i, variables that change across i but not t, and variables that change across i and t” (Wooldridge 2002: 251). These variables include household size and composition (age and gender of household head, education); location variables (availability of electricity); initial household wealth (durable assets); and financial assets (access to credit) (see Table 2).
αi stands for the unobserved component or unobserved individual heterogeneity, which is considered constant over
118 Journal of Poverty Alleviation and International Development
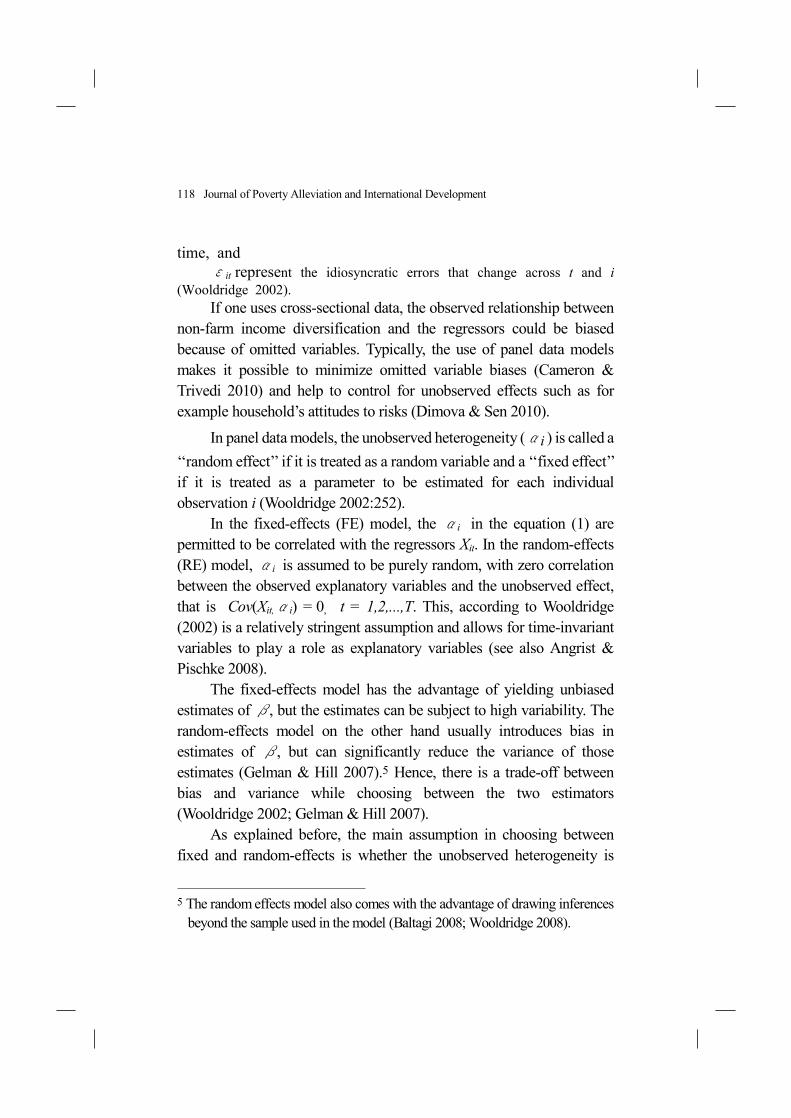
time, and εit represent the idiosyncratic errors that change across t and i
(Wooldridge 2002). If one uses cross-sectional data, the observed relationship between
non-farm income diversification and the regressors could be biased because of omitted variables. Typically, the use of panel data models makes it possible to minimize omitted variable biases (Cameron & Trivedi 2010) and help to control for unobserved effects such as for example household’s attitudes to risks (Dimova & Sen 2010).
In panel data models, the unobserved heterogeneity (αi ) is called a ‘‘random effect’’ if it is treated as a random variable and a ‘‘fixed effect’’ if it is treated as a parameter to be estimated for each individual observation i (Wooldridge 2002:252).
In the fixed-effects (FE) model, the αi in the equation (1) are permitted to be correlated with the regressors Xit. In the random-effects (RE) model, αi is assumed to be purely random, with zero correlation between the observed explanatory variables and the unobserved effect, that is Cov(Xit,αi) = 0, t = 1,2,...,T. This, according to Wooldridge (2002) is a relatively stringent assumption and allows for time-invariant variables to play a role as explanatory variables (see also Angrist & Pischke 2008).
The fixed-effects model has the advantage of yielding unbiased estimates of β, but the estimates can be subject to high variability. The random-effects model on the other hand usually introduces bias in estimates of β, but can significantly reduce the variance of those estimates (Gelman & Hill 2007).5 Hence, there is a trade-off between bias and variance while choosing between the two estimators (Wooldridge 2002; Gelman & Hill 2007).
As explained before, the main assumption in choosing between fixed and random-effects is whether the unobserved heterogeneity is
5 The random effects model also comes with the advantage of drawing inferences beyond the sample used in the model (Baltagi 2008; Wooldridge 2008).
The Determinants of Non-Farm Income Diversification in Rural Ethiopia 119
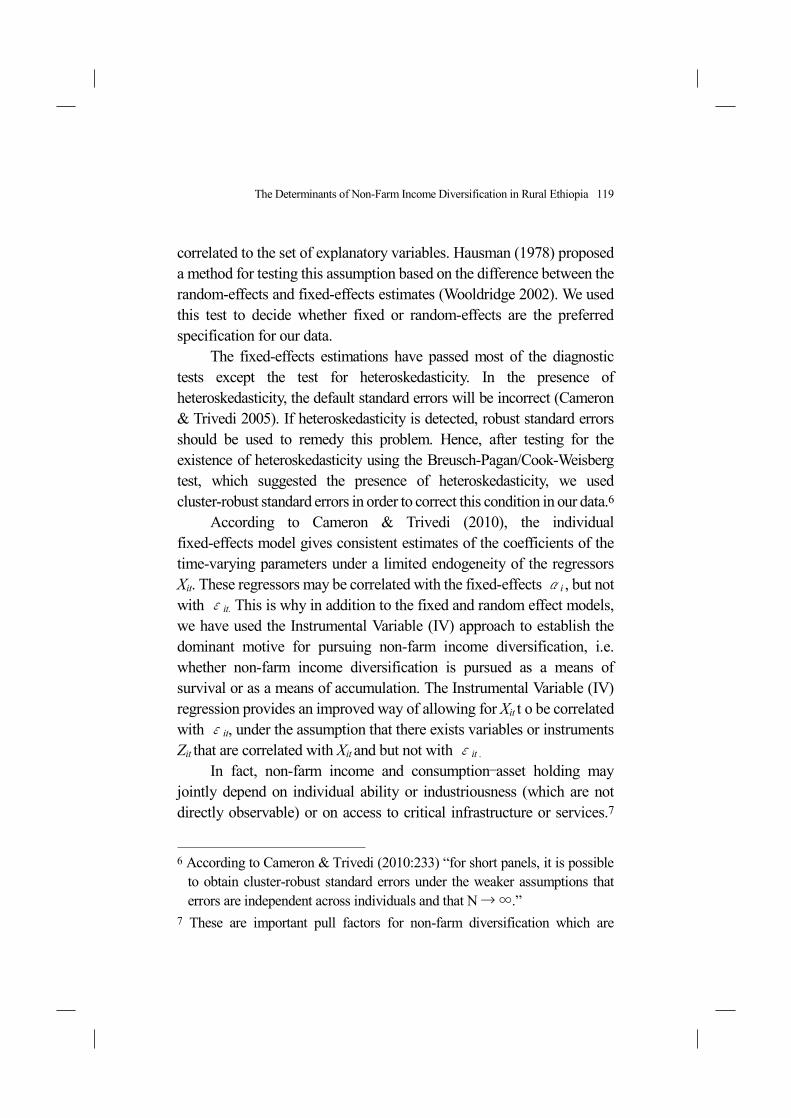
correlated to the set of explanatory variables. Hausman (1978) proposed a method for testing this assumption based on the difference between the random-effects and fixed-effects estimates (Wooldridge 2002). We used this test to decide whether fixed or random-effects are the preferred specification for our data.
The fixed-effects estimations have passed most of the diagnostic tests except the test for heteroskedasticity. In the presence of heteroskedasticity, the default standard errors will be incorrect (Cameron & Trivedi 2005). If heteroskedasticity is detected, robust standard errors should be used to remedy this problem. Hence, after testing for the existence of heteroskedasticity using the Breusch-Pagan/Cook-Weisberg test, which suggested the presence of heteroskedasticity, we used cluster-robust standard errors in order to correct this condition in our data.6
According to Cameron & Trivedi (2010), the individual fixed-effects model gives consistent estimates of the coefficients of the time-varying parameters under a limited endogeneity of the regressors Xit. These regressors may be correlated with the fixed-effects αi , but not with εit. This is why in addition to the fixed and random effect models, we have used the Instrumental Variable (IV) approach to establish the dominant motive for pursuing non-farm income diversification, i.e. whether non-farm income diversification is pursued as a means of survival or as a means of accumulation. The Instrumental Variable (IV) regression provides an improved way of allowing for Xit t o be correlated with εit, under the assumption that there exists variables or instruments Zit that are correlated with Xit and but not with εit .
In fact, non-farm income and consumption–asset holding may jointly depend on individual ability or industriousness (which are not directly observable) or on access to critical infrastructure or services.7
6 According to Cameron & Trivedi (2010:233) “for short panels, it is possible to obtain cluster-robust standard errors under the weaker assumptions that errors are independent across individuals and that N → ∞.”
7 These are important pull factors for non-farm diversification which are
120 Journal of Poverty Alleviation and International Development
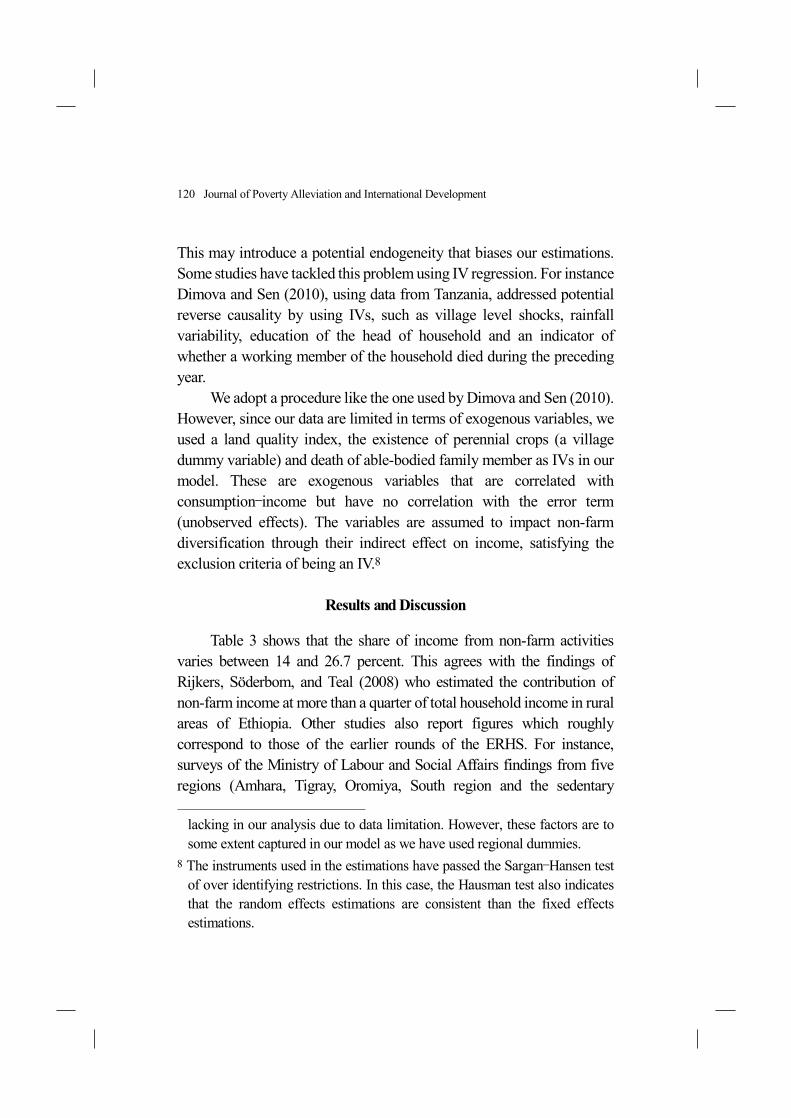
This may introduce a potential endogeneity that biases our estimations. Some studies have tackled this problem using IV regression. For instance Dimova and Sen (2010), using data from Tanzania, addressed potential reverse causality by using IVs, such as village level shocks, rainfall variability, education of the head of household and an indicator of whether a working member of the household died during the preceding year.
We adopt a procedure like the one used by Dimova and Sen (2010). However, since our data are limited in terms of exogenous variables, we used a land quality index, the existence of perennial crops (a village dummy variable) and death of able-bodied family member as IVs in our model. These are exogenous variables that are correlated with consumption–income but have no correlation with the error term (unobserved effects). The variables are assumed to impact non-farm diversification through their indirect effect on income, satisfying the exclusion criteria of being an IV.8
Results and Discussion
Table 3 shows that the share of income from non-farm activities varies between 14 and 26.7 percent. This agrees with the findings of Rijkers, Söderbom, and Teal (2008) who estimated the contribution of non-farm income at more than a quarter of total household income in rural areas of Ethiopia. Other studies also report figures which roughly correspond to those of the earlier rounds of the ERHS. For instance, surveys of the Ministry of Labour and Social Affairs findings from five regions (Amhara, Tigray, Oromiya, South region and the sedentary
lacking in our analysis due to data limitation. However, these factors are to some extent captured in our model as we have used regional dummies.
8 The instruments used in the estimations have passed the Sargan–Hansen test of over identifying restrictions. In this case, the Hausman test also indicates that the random effects estimations are consistent than the fixed effects estimations.
The Determinants of Non-Farm Income Diversification in Rural Ethiopia 121
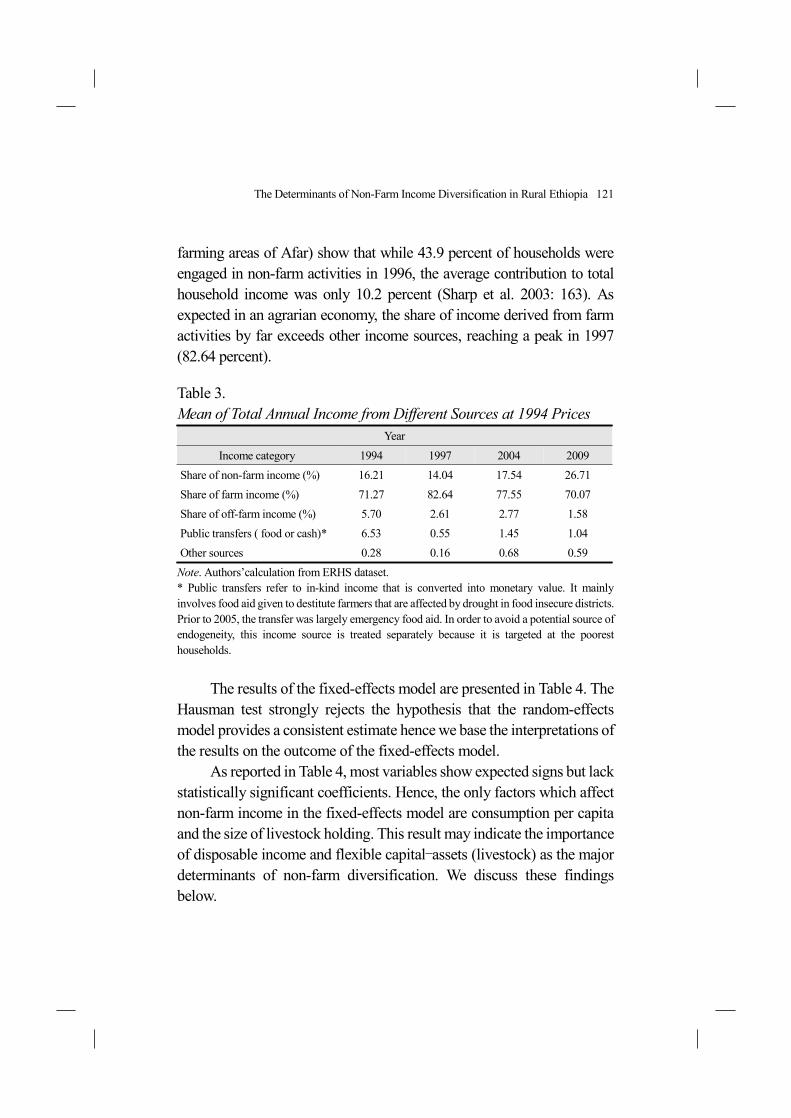
farming areas of Afar) show that while 43.9 percent of households were engaged in non-farm activities in 1996, the average contribution to total household income was only 10.2 percent (Sharp et al. 2003: 163). As expected in an agrarian economy, the share of income derived from farm activities by far exceeds other income sources, reaching a peak in 1997 (82.64 percent).
Table 3. Mean of Total Annual Income from Different Sources at 1994 Prices
YearIncome category 1994 1997 2004 2009
Share of non-farm income (%) 16.21 14.04 17.54 26.71Share of farm income (%) 71.27 82.64 77.55 70.07Share of off-farm income (%) 5.70 2.61 2.77 1.58Public transfers ( food or cash)* 6.53 0.55 1.45 1.04Other sources 0.28 0.16 0.68 0.59
Note. Authors’calculation from ERHS dataset.* Public transfers refer to in-kind income that is converted into monetary value. It mainly involves food aid given to destitute farmers that are affected by drought in food insecure districts. Prior to 2005, the transfer was largely emergency food aid. In order to avoid a potential source of endogeneity, this income source is treated separately because it is targeted at the poorest households.
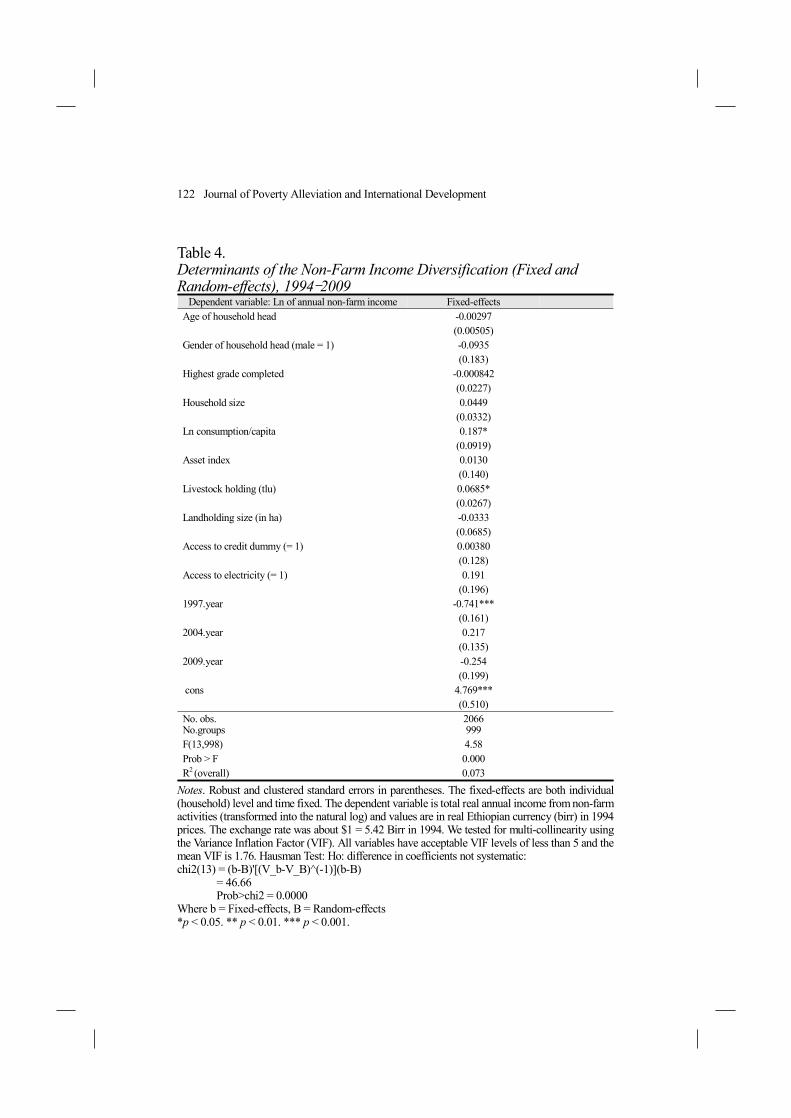
The results of the fixed-effects model are presented in Table 4. The Hausman test strongly rejects the hypothesis that the random-effects model provides a consistent estimate hence we base the interpretations of the results on the outcome of the fixed-effects model.
As reported in Table 4, most variables show expected signs but lack statistically significant coefficients. Hence, the only factors which affect non-farm income in the fixed-effects model are consumption per capita and the size of livestock holding. This result may indicate the importance of disposable income and flexible capital–assets (livestock) as the major determinants of non-farm diversification. We discuss these findings below.
122 Journal of Poverty Alleviation and International Development
Table 4. Determinants of the Non-Farm Income Diversification (Fixed and Random-effects), 1994–2009
Notes. Robust and clustered standard errors in parentheses. The fixed-effects are both individual (household) level and time fixed. The dependent variable is total real annual income from non-farm activities (transformed into the natural log) and values are in real Ethiopian currency (birr) in 1994 prices. The exchange rate was about $1 = 5.42 Birr in 1994. We tested for multi-collinearity using the Variance Inflation Factor (VIF). All variables have acceptable VIF levels of less than 5 and the mean VIF is 1.76. Hausman Test: Ho: difference in coefficients not systematic: chi2(13) = (b-B)'[(V_b-V_B)^(-1)](b-B) = 46.66 Prob>chi2 = 0.0000Where b = Fixed-effects, B = Random-effects*p < 0.05. ** p < 0.01. *** p < 0.001.
Dependent variable: Ln of annual non-farm income Fixed-effects Age of household head -0.00297
(0.00505)Gender of household head (male = 1) -0.0935
(0.183)Highest grade completed -0.000842
(0.0227)Household size 0.0449
(0.0332)Ln consumption/capita 0.187*
(0.0919)Asset index 0.0130
(0.140)Livestock holding (tlu) 0.0685*
(0.0267)Landholding size (in ha) -0.0333
(0.0685)Access to credit dummy (= 1) 0.00380
(0.128)Access to electricity (= 1) 0.191
(0.196)1997.year -0.741***
(0.161)2004.year 0.217
(0.135)2009.year -0.254
(0.199) cons 4.769***
(0.510)No. obs.No.groups
2066999
F(13,998) 4.58Prob > F 0.000R2 (overall) 0.073
The Determinants of Non-Farm Income Diversification in Rural Ethiopia 123
The coefficient of logged consumption per capita (elasticity of non-farm income to consumption) indicates that a 10 percent increase in consumption per capita is likely to increase non-farm income by up to 1.8 percent (significant at the 5 percent level).9 These findings on income partly support the argument that non-farm diversification might be driven by accumulation motives. Similar findings are also reported elsewhere in rural Tanzania (Dimova & Sen 2010) in Tigray region in Ethiopia (Woldehanna & Oskam 2001), in Western Kenya (Olale & Henson 2012) and in Nigeria (Idowu, Ojiako, & Ambali 2013).
A further important indicator of household assets (store of wealth) in rural Ethiopia is livestock holding (Mogues 2004), which in our analysis positively impacts on non-farm diversification. Additional livestock (given in Tropical Livestock Units) increases non-farm income by up to 6.8 percent. This result for livestock holding, coupled with the positive impact of consumption suggests that asset-rich households are more likely to engage in non-farm activities.
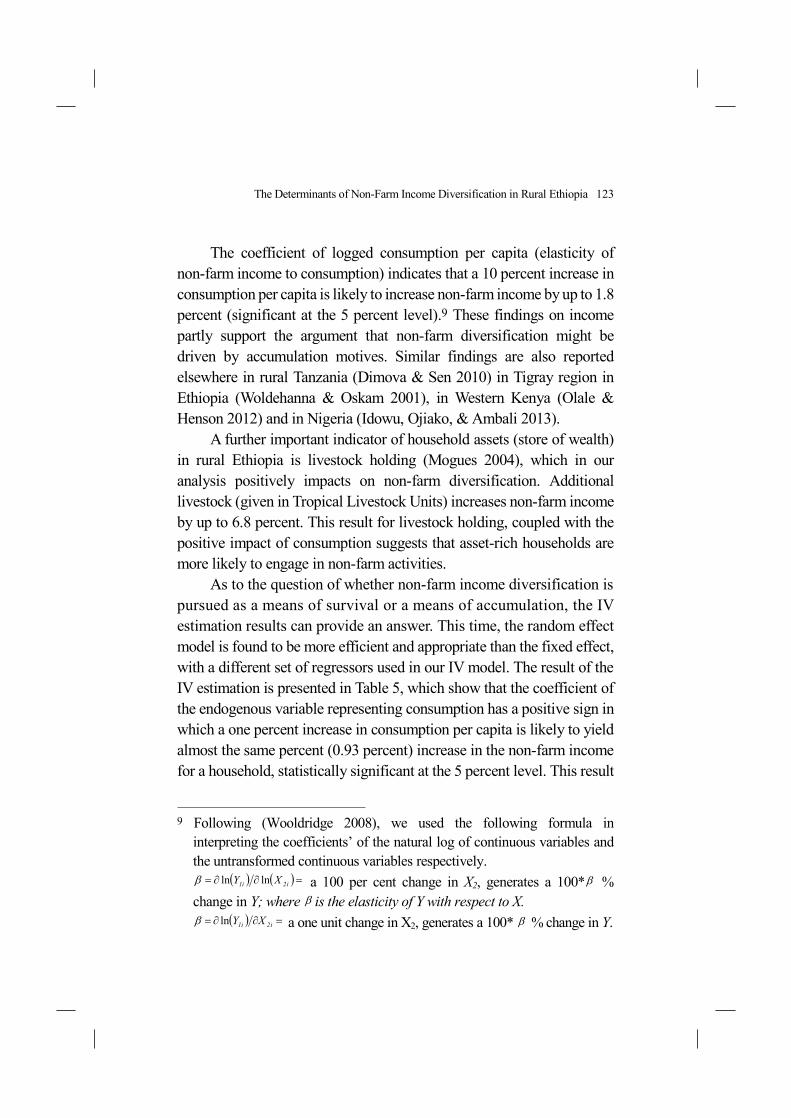
As to the question of whether non-farm income diversification is pursued as a means of survival or a means of accumulation, the IV estimation results can provide an answer. This time, the random effect model is found to be more efficient and appropriate than the fixed effect, with a different set of regressors used in our IV model. The result of the IV estimation is presented in Table 5, which show that the coefficient of the endogenous variable representing consumption has a positive sign in which a one percent increase in consumption per capita is likely to yield almost the same percent (0.93 percent) increase in the non-farm income for a household, statistically significant at the 5 percent level. This result
9 Following (Wooldridge 2008), we used the following formula in interpreting the coefficients’ of the natural log of continuous variables and the untransformed continuous variables respectively.
( ) ( ) =¶¶= i2i1 XY lnlnb a 100 per cent change in X2, generates a 100*b % change in Y; where b is the elasticity of Y with respect to X.
( ) =¶¶= i2i1 XYlnb a one unit change in X2, generates a 100* b % change in Y.
124 Journal of Poverty Alleviation and International Development
Table 5. Impact of Consumption on Non-Farm Income, 1994-2009
Dependent variable: Ln non-farm income (RE+IV)Ln consumption/capita 0.928*
(0.388)Age of household head -0.00562*
(0.00234)Male household head (=1) 0.0166
(0.0811)Highest grade completed 0.0442**
(0.0170)Household size 0.0814**
(0.0302)Illness dummy (=1) -0.0543
(0.0655)Asset index -0.0662
(0.0965)Livestock holding (tlu) -0.000464
(0.0173)Landholding (in ha) -0.104***
(0.0292)_cons 2.185
(1.475)No. observations 1868No. groups 978R2 0.10chi2 217.1Prob > chi2 0.000
Notes. Standard errors in parentheses. Test: Ho: difference in coefficients not systematic chi2(12) = (b-B)'[(V_b-V_B)^(-1)](b-B) = 1.24 Prob>chi2 = 1.0000Test of over identifying restrictions: Cross-section time-series model: xtivreg g2sls Sargan-Hansen statistic 0.103 Chi-sq(1) P-value = 0.7488The Sargan-Hansen test of over identification tells that the estimation is consistent and that the instruments are valid: p-value is > 5% therefore we accept the Ho- that the instruments are valid. Land quality and perennial crop dummy are used as instruments in the log of consumption per capita estimation. Regional dummies and year coefficients were estimated but not reported. p < 0.05. ** p < 0.01. *** p < 0.001.
The Determinants of Non-Farm Income Diversification in Rural Ethiopia 125
supports the argument that non-farm diversification is mainly pursued as an accumulation rather than a survival strategy. This result is also similar to the one reported by Block and Webb (2001) who find that greater income diversification (diversification out of cropping) was positively associated with high per capita income levels.
Such findings may hint at accumulation driven non-farm activities having less of an impact on reducing poverty in the short-run since the activities are mostly pursued by the non-poor. However, in the long-run, the potential contributions of the non-farm sector to poverty reduction through its effects on creating local employment and promoting local growth (see Lanjouw & Lanjouw 2001; Davis & Bezemer 2004; Haggblade et al. 2010) can be realized if the right policy instruments are put in place such as expanding access to infrastructure and communication services to rural areas to promote the benefits of the rural non-farm economy to trickle-down to the poor mainly through alternative employment and income opportunities.
Conclusion
This paper has examined the determinants of non-farm income diversification for a panel of rural households in Ethiopia for the period 1994–2009. The analysis indicates that though smallholders are trying to diversify their income sources, the contribution of non-farm income to total household income is very low. This partly reflects the extreme poverty prevalent in the smallholder agricultural system in the four regions we studied. The fixed, random and instrumental variable estimations used in our analysis also indicate that non-farm diversification seems to be pursued by wealthier households rather than by poorer households. This result supports the increasingly strong empirical evidence that income diversification is being used as a means of accumulation in Sub-Saharan Africa (see Block & Webb 2001; Barrett et al. 2001; De Weerdt 2010; Dimova & Sen 2010).
This finding of accumulation being the main motive for pursuing
126 Journal of Poverty Alleviation and International Development
non-farm diversification implies increasing income inequality in rural settings. This may further accentuate poverty and asset traps that keep the rural poor in a vicious cycle of destitution. Thus, investigating the effect of non-farm income on overall income inequality and welfare is an important future research avenue to help inform the adoption of appropriate policy measures that promote the trickling down of the benefits of the non-farm sector.
References
Abdulai, A., & CroleRees, A. (2001). Determinants of income diversification amongst rural households in Southern Mali. Food Policy, 26(4), 437–452. doi:10.1016/S0306-9192(01)00013-6
Akaakohol, M. A., & Aye, G. C. (2014). Diversification and farm household welfare in Makurdi, Benue State, Nigeria. Development Studies Research, 1(1), 168–175. doi:10.1080/21665095.2014.919232
Angrist, J. D., & Pischke, J.-S. (2008). Mostly harmless econometrics: An empiricist’s companion. Princeton, NJ: Princeton University Press.
Baltagi, B. (2008). Econometric analysis of panel data. New York: John Wiley & Sons.
Barrett, C. B., Reardon, T., & Webb, P. (2001). Nonfarm income diversification and household livelihood strategies in rural Africa: Concepts, dynamics, and policy implications. Food Policy, 26(4), 315–331.
Block, S., & Webb, P. (2001). The dynamics of livelihood diversification in post-famine Ethiopia. Food Policy, 26(4), 333–350. doi:10.1016/ S0306-9192(01)00015-X
Cameron, A. C., & Trivedi, P. K. (2005). Microeconometrics: Methods and applications. New York: Cambridge University Press.
Cameron, A. C., & Trivedi, P. K. (2010). Microeconometrics using Stata (revised edition). College Station, USA: Stata Press.
Corral, L., & Reardon, T. (2001). Rural nonfarm incomes in Nicaragua. World Development, 29(3), 427–442. doi:10.1016/S0305-750X(00)00109-1
Crole-Rees, A. (2002) Rural household strategies: Determinants and contribution of income diversification to income level and distribution: The case of Southern Mali (Unpublished doctoral thesis). ETH-Zurich, Switzerland.
The Determinants of Non-Farm Income Diversification in Rural Ethiopia 127
Davis, J. R., & Bezemer, D. (2004). The development of the rural non-farm economy in developing countries and transition economies: Key emerging and conceptual issues. Chatham, UK: Natural Resources Institute. Retrieved from: http://projects.nri.org/rnfe/pub/papers/keyissues.pdf
Deshingkar, P.(2004). Livelihood diversification in developing countries. London: Organization for Economic Cooperation and Development.
Degefa, T. (2005). Rural livelihoods, poverty and food insecurity in Ethiopia: A case study at Erenssa and Garbi communities in Oromiya Zone, Amhara National Regional State (PhD Thesis series 2005:106), Norwegian University of Science and Technology, NTNU, Trondheim.
Demissie, D., & Workneh, N. (2004). Determinants of rural livelihood diversification: Evidence from south Ethiopia. Quarterly Journal of International Agriculture, 43(3), 267–288.
Dercon, S., & Hoddinott, J. (2011). The Ethiopian rural household surveys 1989-2009: Introduction. Oxford: University of Oxford and International Food Policy Research Institute (IFPRI).
Deressa, T., Hassan, R. M., & Ringler, C. (2008). Measuring Ethiopian farmers’vulnerability to climate change across regional states (Research briefs No. 15(5)). Washington, DC: International Food Policy Research Institute (IFPRI). Retrieved from http://ideas.repec.org/p/fpr/resbrf/15 (5).html
de Janvry, A. , & Sadoulet, E. (2001). Income strategies among rural households in Mexico: The role of off-farm activities. World Development, 29(3), 467–480.
De Weerdt, J. (2010). Moving out of poverty in Tanzania: Evidence from Kagera. Journal of Development Studies, 46(2), 331–349.
Dimova, R., & Sen, K. (2010). Is household income diversification a means of survival or a means of accumulation? Panel data evidence from Tanzania (BWPI Working Paper Series No. 12210). Manchester, UK: Brooks World Poverty Institute (BWPI), The University of Manchester. Retrieved from http://ideas.repec.org/p/bwp/bwppap/12210. html
Ellis, F. (1998). Household strategies and rural livelihood diversification. Journal of Development Studies, 35(1), 1–38. doi:10.1080/00220389 808422553
Ellis, F. (2000). Rural livelihoods and diversity in developing countries. Oxford: Oxford University Press.

128 Journal of Poverty Alleviation and International Development
Ellis, F., & Freeman, H. A. (Eds.). (2005). Rural Livelihoods and poverty reduction policies. London & New York: Routledge.
Escobal, J. (2001). The determinants of nonfarm income diversification in rural Peru. World Development, 29(3), 497–508. doi:10.1016/S0305- 750X(00)00104-2
Filmer, D., & Pritchett, L. (2001). Estimating wealth effects without expenditure data—or tears: An application to educational enrollments in states of India. Demography, 38(1), 115–132.
Gelman, A., & Hill, J. (2007). Data analysis using regression and multi- level/hierarchical models. Cambridge: Cambridge University Press.
Haggblade, S., Hazell, P., & Reardon, T. (2010). The rural non-farm economy: Prospects for growth and poverty reduction. World Development, 38(10), 1429–1441. doi:10.1016/j.worlddev.2009.06.008
Hart, G. (1994). The dynamics of diversification in an Asian rice region. In B. Koppel, J. Hawkins, & W. James, (Eds.), Development or deterioration? Work in rural Asia (pp. 47–71). Boulder, Colorado: Lynne Reinner.
Hausman, J. (1978). Specification tests in econometrics. Econometrica, 46, 1251–1271.
Idowu, A. O., Ojiako, I. A., & Ambali, O. I. (2013). Participation and wage of rural female headed households in Nigeria’s non-farm employment. European Scientific Journal, 9(13), 194–219.
Kimsun, T., & Sokcheng, P. (2013). The role of income diversification during the global financial crisis: Evidence from nine villages in Cambodia (CDRI Working Paper Series No. 78). Phnom Penh: CDRI. Retrieved from http://www.cdri.org.kh/webdata/download/wp/wp78e.pdf
Lanjouw, J. O., & Lanjouw, P. (2001). The rural non‐farm sector: Issues and evidence from developing countries. Agricultural Economics, 26(1), 1–23.
Lanjouw, P., Shariff, A., & Rahut, D. B. (2007). Rural non-farm employment in India: Access, income, farm, poverty impact (Working Paper No. 81). New Delhi: National Council of Applied Economic Research (NCAER). Retrieved from http://ideas.repec.org/p/ess/wpaper/id913.html
Lemi, A. (2010). Determinants of income diversification in rural Ethiopia: Evidence from panel data. Ethiopian Journal of Economics, 18(1). doi:10.4314/eje.v18i1.59930
Minot, N., Epperecht, M., Ahn, T., T., & Trung, L. Q. (2006). Income
The Determinants of Non-Farm Income Diversification in Rural Ethiopia 129
diversification and poverty in the northern uplands of Vietnam (Research Report 145). Washington, DC: International Food Policy Research Institution. doi:10.2499/0896291480
Mogues, T. (2004). Shocks, livestock asset dynamics and social capital in Ethiopia. University of Wisconsin-Madison, Mimeo.
Mollers, J., & Buchenrieder, G. (2005). Theoretical concepts for the analysis of non-farm rural employment. Quarterly Journal of International Agriculture, 44(1), 19–36.
Olale, E., & Henson, S. (2012). Determinants of income diversification among fishing communities in Western Kenya. Fisheries Research, 125, 235–242.
Reardon, T. (1997). Using evidence of household income diversification to inform study of the rural nonfarm labor market in Africa. World Development, 25(5), 735–747. doi:10.1016/S0305-750X(96)00137-4
Reardon, T., Stamoulis, K., Balisacan, A., Cruz, M., Berdegué, J., & Banks, B. (1998). Rural non-farm income in developing countries. The State of Food and Agriculture, 1998, 283–356.
Renkow, M., & Slade, R. (2013). An assessment of IFPRI’S work in Ethiopia 1995–2010: Ideology, influence, and idiosyncrasy. Washington, DC: International Food Policy Research Institute.
Rijkers, B., Söderbom, M., & Teal, F. (2008). Rural non-farm enterprises in Ethiopia: Challenges and prospects (Briefing note prepared for the DFID funded study “Understanding the constraints to continued rapid growth in Ethiopia: the role of agriculture”). Retrieved from: http://users.ox.ac.uk/~econstd/Brief_Rijkers%20_rev_.pdf
Senadza, B. (2012). Non-farm income diversification in rural Ghana: Patterns and determinants. African Development Review, 24(3), 233–244. doi:10.1111/j.1467-8268.2012.00322.x
Sharp, K., Devereux, S., & Amare, Y. (2003). Destitution in Ethiopia’s north eastern highlands (Amhara National Regional State). Sussex, UK: Institute of Development Studies at the University of Sussex.
Smith, D. R., Gordon, A., Meadows, K., & Zwick, K. (2001). Livelihood diversification in Uganda: Patterns and determinants of change across two rural districts. Food Policy, 26(4), 421–435. doi:10.1016/S0306- 9192(01)00012-4
Sosina, B., Barrett, C. B., & Holden, S. T. (2012). Does the nonfarm economy
130 Journal of Poverty Alleviation and International Development
offer pathways for upward mobility? Evidence from a panel data study in Ethiopia. World Development, 40(8), 1634–1646.
Sosina, B., & Holden, S. (2014). Are rural youth in ethiopia abandoning agriculture? World Development, 64, 259–272. doi:10.1016/j.worlddev. 2014.06.013
Tegegne, G. (2000). Non-farm activities and production decisions of farmers: The cases of Damotgale and Kachabira weredas in southern region of Ethiopia (Social Science Research Report Series No. 15). Addis Ababa, Ethiopia: Organization for Social Science Research in Eastern and Southern Africa.
Weldegebriel, Z. B., & Prowse, M. (2013). Climate-change adaptation in Ethiopia: To what extent does social protection influence livelihood diversification? Development Policy Review, 31, o35–o56. doi: 10. 1111/dpr.12038
Woldenhanna, T., & Oskam, A. (2001). Income diversification and entry barriers: Evidence from the Tigray region of northern Ethiopia. Food Policy, 26(4), 351–365. doi:10.1016/S0306-9192(01)00009-4
Wooldridge, J. (2002). Econometric analysis of cross section and panel data. Cambridge, MA: MIT Press.
Wooldridge, J. (2008). Introductory econometrics: A modern approach. Mason, OH: Cengage Learning.
Yared, A. (1999). Household resources, strategies and food security in Ethiopia: a study of Amhara households in Wogda, Northern Shewa. Addis Ababa: Addis Ababa University Press.
Yúnez-Naude, A., & Taylor, J. E. (2001). The determinants of nonfarm activities and incomes of rural households in Mexico, with emphasis on education. World Development, 29(3), 561–572. doi:10.1016/ S0305-750X(00)00108-X