The Determinants of Corporate Risk in Emerging … · Empirical Strategy ... A. Option Adjusted...
26
WP/07/228 The Determinants of Corporate Risk in Emerging Markets: An Option-Adjusted Spread Analysis Eduardo Cavallo and Patricio Valenzuela
Transcript of The Determinants of Corporate Risk in Emerging … · Empirical Strategy ... A. Option Adjusted...

WP/07/228
The Determinants of Corporate Risk in Emerging Markets: An Option-Adjusted
Spread Analysis
Eduardo Cavallo and Patricio Valenzuela


© 2007 International Monetary Fund WP/07/228 IMF Working Paper Research Department The Determinants of Corporate Risk in Emerging Markets: An Option-Adjusted Spread
Analysis
Prepared by Eduardo Cavallo and Patricio Valenzuela1
Authorized for distribution by Alessandro Prati
September 2007
Abstract
This Working Paper should not be reported as representing the views of the IMF. The views expressed in this Working Paper are those of the author(s) and do not necessarily represent those of the IMF or IMF policy. Working Papers describe research in progress by the author(s) and are published to elicit comments and to further debate.
This study explores the determinants of corporate bond spreads in emerging markets economies. Using a largely unexploited dataset, the paper finds that corporate bond spreads are determined by firm-specific variables, bond characteristics, macroeconomic conditions, sovereign risk, and global factors. A variance decomposition analysis shows that firm-level characteristics account for the larger share of the variance. In addition, the paper finds two asymmetries. The first is in line with the sovereign ceiling “lite” hypothesis which states that the transfer of risk from the sovereign to the private sector is less than 1 to 1. The second is consistent with the popular notion that panics are common in emerging markets where investors are less informed and more prone to herding. JEL Classification Numbers: E43, F30, F34, G15 Keywords: Corporate bond spreads, sovereign ceiling, default risk, emerging market Author’s E-Mail Addresses: [email protected]; [email protected]
1 Eduardo Cavallo is with the Inter-American Development Bank. We thank Martin Grandes and Diego Vilán for valuable comments and suggestions.

2
Contents Page
I. Introduction ............................................................................................................................3
II. Empirical Strategy.................................................................................................................6
III. Data Description ..................................................................................................................9 A. Option Adjusted Spread (OAS) Analysis Computation .........................................10
IV. Regression Results.............................................................................................................10
V. Extensions and Robustness Checks ....................................................................................15
VI. Conclusions........................................................................................................................18 References................................................................................................................................23 Tables 1. Determinants of Corporate OAS..........................................................................................12 2. Country Risks by Sectors.....................................................................................................15 3. Asymmetries ........................................................................................................................17 4. Determinants of Corporate OAS, Robustness Checks.........................................................19 5. Determinants of Corporate OAS, Robustness Checks.........................................................20 Figure 1. Variance Descomposition: Corporate OAS.........................................................................14 Appendix Tables 6. Correlation Matrix ...............................................................................................................21 7. Description of Variables ......................................................................................................21 8. Descriptive Statistic .............................................................................................................22 9. Wald Test to test Sovereign Ceiling ....................................................................................22

3
I. INTRODUCTION
What are the main determinants of corporate bonds spreads in emerging market economies (EMEs)? This is the question that we seek to address in this paper. Our contribution is to disentangle the role of firm-specific variables, bond characteristics, observable macroeconomic conditions, sovereign risk, industry specific effects and country-specific effects, using a largely unexploited panel dataset from Bloomberg with comparable corporate bond spreads.
Corporate bond yields are the manifestation of the cost of financing for private firms. Higher spreads signal that the cost of capital is higher and, consequently, that the profitability of investment opportunities is lower. Given that investment in physical capital is a key motor of economic growth,2 it is very important to find out what are the drivers of the cost of financing for private firms in order to identify the impediments to productive investment.
Why EMEs? These are countries that are relatively capital scarce compared to the industrialized economies.3 As such, there are many potentially profitable investment opportunities. But the mere existence of these opportunities does not guarantee that they will materialize. They need to be matched with appropriate funding that could come from either domestic or international sources. A defining characteristic of EMEs is that they have sought, in recent years, to tap the latter in order to expand financing opportunities.4
Experience suggests that when these new opportunities arise, the private sector is not the only one eager to tap them. Governments themselves have also increased foreign borrowing to finance their own investment and spending needs (IDB, 2006). This borrowing creates, among other things, sovereign default risk, or “country risk,” which could increase the cost of borrowing faced by domestic firms. The main reason is the so-called “transfer risk,” that is, the risk that if the government encounters difficulties in servicing its debts, it will transfer those problems to the local private sector. As Durbin and Ng (2005) explain, “a country’s government has the power to tax firms, impose foreign exchange controls, or seize firm assets. If the government’s repayment capacity falls, the government is more likely to exercise one or more of these rights, which in turn will lower the firm’s repayment capacity” (p. 633). Therefore, EMEs are a particularly interesting unit of analysis because sovereign risk plays an important role in determining the cost of financing of firms. It is precisely this linkage between sovereign and corporate risk that has provided the rationale for all major rating agencies to justify the application of the so-called “sovereign ceiling policy,” which
2 See discussion and citations in Bandeira et al., (2000).
3 According to the World Bank’s definition, an EME is a country with low/middle income for two consecutive years. Such countries represent approximately 80 percent of the global population, representing about 20 percent of the world's economies.
4 To be deemed an emerging market by JPMorgan in its EMBI+ Index, a country must have sovereign debt rated Baa1/BBB+ or below by Moody’s/S&P rating agencies.

4
means that the debt of a company in a given country cannot be rated higher than the debt of its government.5
The problem is that measuring the impact of sovereign risk on corporate spreads is particularly difficult. To do so, we need to compare the yield spread of corporate bonds to those of government bonds of similar characteristics (i.e., maturity and cash flows). Usually, the “yield to maturity” of a corporate bond is compared to that of a government bond of similar maturity, and a value assessment of the incremental risk is made based upon the yield spread. The limitations of this approach are twofold. On the one hand, it is typically very difficult to find pairs of bonds that match well on all dimensions. On the other hand, determining a definite maturity date for a bond oftentimes becomes impossible.6 To circumvent this problem, we use option-adjusted spread (OAS) analysis from Bloomberg, a method of comparing bonds with different cash flow characteristics on a more equal basis. It simultaneously considers credit risk and contingent cash flow risk, and it is a useful tool for determining an investor’s compensation conditional on the structure of the bond.
OAS is essentially a method of making the spreads from different bonds comparable. It is basically the spread that must be added to the current short-term interest rate to make the “theoretical” price of the corporate bond, as calculated by the pricing model, identical to the observed market price (Choudhry, 2004). We use OAS instead of standard yield to maturity spreads for two reasons: first, since bonds with embedded options contain cash flows dependent upon the future level of interest rates, determining a definite maturity date becomes impossible. Second, standard yield to maturity calculations provide no information regarding how much of a bond’s spread is due to its credit risk and how much is due to its option risk. OAS analysis provides an alternative means of assessing the incremental return of a bond by measuring it against the risk-free “term structure of interest rates” or the “benchmark spot curve.”
As such, the adjusted corporate bond spreads are not only comparable among themselves but also with the EMBI spread, the benchmark measure of sovereign risk in EMEs. The EMBI plus is the most liquid U.S. dollar- emerging market debt standard, and it tracks total returns for actively traded external instruments in EMEs. Included in the EMBI plus are U.S. dollar- denominated Brady bonds, Eurobonds, and traded loans issued by sovereign entities.7 JPMorgan computes individual country’s spreads as a weighted average of all spreads from
5 The policy was amended and relaxed in 1997 by Standard & Poor’s and in 2001 by Moody’s.
6 For example, bonds with embedded options contain cash flows dependent upon the future level of interest rates. Therefore determining a definite maturity date becomes impossible.
7 For our sample we use mostly EMBIplus. For those few cases when EMBIplus is not available, we use EMBIglobal. This does not affect the results as we checked that for those countries for which both measures exist, the differences are never statistically significant.

5
bonds that meet certain size and liquidity requirements. These spreads are the proxy for sovereign risk that we use in the estimation.8
We focus on the determinants of the corporate spreads for 139 bonds issued by 65 corporations in 10 EMEs, six in Latin America and four in the East Asian region, with available data in Bloomberg. Our main finding is that firm-specific variables, bond characteristics, macroeconomic conditions, sovereign risk and global factors are all determinants of corporate risk. Furthermore, a variance decomposition analysis indicates that firm-level characteristics account for the largest share of the variance. All in all, these results underscore the importance of good management and other firm-specific characteristics as the main determinants corporate risks in EME’s. The factors that are outside the direct control of the firm management, such as macroeconomic conditions, sovereign risk and global factors, also matter, but these effects are relatively less important.
In addition, we find two asymmetries: the first is in line with a sort of sovereign ceiling “lite” in emerging markets bonds spreads (Borensztein et al., 2006). It suggests that the so-called “transfer risk” between sovereign spreads and corporate risk is positive and significant, but less than one to one (i.e., a 1 percent increase in the default risk of the sovereign translates into a less than 1 percent increase in the default risk of the corporate sector). The second asymmetry is consistent with the notion that panics are common in emerging markets where investors are less informed and more prone to herding (Calvo, 1999; and Calvo and Mendoza, 2000). The manifestation of this phenomenon in our model is that corporate spreads respond more acutely to increases in risk.
We contribute to the existing literature in at least two fronts: we are, to the best of our knowledge, among the first to employ OAS to explore the determinants of corporate bond spreads in a large cross-country and multi-bond setting. Secondly, we propose an empirical methodology based on panel data techniques aimed at disentangling the roles of firm-specific variables, bond characteristics, macroeconomic conditions, sovereign risk, industry-specific effects and country-specific effects.
Our work is closely related to the growing literature on the determinants of corporate risk in various settings. For example, Huang and Kong (2003) use both weekly and monthly OAS to examine the determinants of corporate bond credit risk in the United States. The main difference with our paper is that we use a multiplicity of bond spreads in EME’s. Durbin and Ng (2005) analyze the relationship between corporate and sovereign spreads on foreign currency bonds in EMEs using a broad cross-section of over 100 firms from various countries. Their paper differs from ours in that they do not use OAS analysis and focus only on the effect of sovereign risk. Closer to our methodology is the work of Peter and Grandes (2005), who study the impact of sovereign risk on corporate default premia controlling for
8 JP Morgan also computes the aggregate EMBI spread index of all emerging market countries with international bond debt, an index that is closely monitored by financial markets as a measure of overall EME risk.

6
firm-specific determinants of corporate risk. The differences with our paper are that their sample is limited to bonds of publicly traded firms in South Africa issued in local currency and that they do not use OAS.
Durbin and Ng (2005) and Peter and Grandes (2005) analyze the extent to which the practice by credit risk agencies of not rating companies higher than their sovereign (“sovereign ceiling”) is reflected in the yields of corporate bonds. In that sense, they are also related to work by Borensztein et al., (2006a, 2006b), who investigate the sovereign ceiling effect but focus on credit ratings rather than bond spreads. All these papers conclude that there is a statistically and economically significant spillover effect from sovereign to corporate risk, although investors do not always apply a strict sovereign ceiling, particularly for firms that operate in the tradable sector (i.e., there is a sovereign ceiling “lite”). The focus of our paper is different in that, although we have something to say about the “sovereign ceiling,” we are interested in exploring the overall determinants of corporate risk, of which sovereign risk is just one.9
The rest of the paper is organized as follows. In the next section we present the empirical strategy and the choice of variables, and in Section III we discuss data and sample issues. In Section IV we present our regression results, along with a variance decomposition analysis to investigate the quantitative significance of each set of determinants in explaining the variance of corporate spreads. Also, we briefly discuss some of the robustness checks. The paper ends with conclusions and discussion.
II. EMPIRICAL STRATEGY
The central question of this study is to asses the determinants of corporate risk using OAS for corporate bonds issued in EMEs.
We propose that the natural logarithm of the spread (Sit ) of a bond i during quarter t is given by
0 1 2 3 4 5 6it C s it it ct ct t itS P D F B CR C Gβ β β β β β β μ= + + + + + + + (1)
where PC are country fixed effects, Ds are industry-dummies, Fit are firm-level determinants of idiosyncratic corporate risk, Bit are bond-structure characteristics, CRct is the sovereign risk, Cct are country-level time-varying variables that affect the risk level of all firms in the economy (i.e., macroeconomic variables), Gt are the global factors, and μit is the error term.
9 This study is also different from Borensztein et al., (2006a and 2006b) in that, by focusing on corporate spreads, we measure the market’s reaction to different sources of corporate risk. Instead, Borensztein et al., by focusing on credit ratings, identify credit agencies’ reaction function.

7
The dependent variable is the OAS (in natural logarithm). As described in Huang and Kong (2003), this credit spread on corporate bonds is the extra yield offered to compensate investors for a variety of risks, such as: 1) expected default loss, 2) credit risk premium due to the uncertainty of default losses, and 3) liquidity and tax premiums. It is precisely the origin of this “extra-yield” that we seek to investigate in this paper. In addition, we choose OAS because many bonds—in our sample, almost half—contain contingent cash flows due to call, put or sink features, sometimes referred to as embedded options. As such, the standard yield to maturity spreads on these bonds are meaningless because the exact maturity date is unknown. Below we will explain the computation of OAS which is used to strip off the embedded option risk component of a bond’s total spread. The OAS is computed by Bloomberg for most of the bonds in the market, even for those without embedded options (where the option value is zero).
The country fixed effects control for unobservable effects, for example some possible heterogeneity in the local bond markets (i.e., in terms of size, liquidity and financial development). The industry fixed effects control for the unobservable heterogeneity in industry risk.
The firm level determinants of idiosyncratic corporate risk (mainly, financial risk factors) are primarily those derived from the model of Altman (2000). These are: return on assets (EBIT/Assets),10 stability of earnings, cumulative profitability (retained earnings before interest and taxes/Assets), liquidity (Working Capital/Assets), capitalization (Equity/Capital), leverage (Debt/Assets) and size (Total Assets). For concreteness, in the reported regressions we focus only on EBIT/Assets, Equity/Assets, Debt/Assets and size, but the reader should rest assured that our results are robust to the inclusion of the full set of determinants.11 We also expand the set of firm-level variables to include “volatility of equity” because in the framework of Merton (1974) a firm with more volatile equity is more likely to reach the boundary condition for default. Thus, investors should require additional compensation in the form of a higher spreads. In fact, Campbell and Taksler (2003), in a study of U.S. corporations, find that equity volatility and credit ratings each explain about a third of the variation in corporate bond yield spreads. In our study, one reason to use equity volatility over, for example, credit ratings or assets volatility as alternative measures of risk, is that equity markets reflect up-to-date information. Credit ratings and assets may be updated infrequently. According to Ederington et al., (1987) rating changes almost never affect bond returns because investors fully anticipate these changes based on the most recent information available.
The main bond structure characteristic included in the analysis is the time-to-maturity (in natural logarithm). Presumably, at least for corporations with low overall levels of debt, the longer the time for maturity, the greater is the uncertainty about the future, so the higher is
10 EBIT: Earnings before interest and taxes.
11 Although the other determinants, are typically statistically insignificant. Details available from the authors upon request.

8
the associated risk of holding that debt. On the other hand, for corporations with high levels of debt, having a debt structure with longer time to maturity might reduce liquidity risk. Therefore, the term structure of credit spreads could vary with the leverage of the firm (Merton, 1974). To account for this possible nonlinearity, we also include the interaction term between time-to-maturity and Debt/Assets. There are also other bond characteristics that could have an incidence on the riskiness of the bond, such as whether the bond has embedded options or a state-contingent payment stream.12 But, as these are accounted for in the OAS reported by Bloomberg, we abstract from them in our empirical model.
The country-level variables included are those related to the macroeconomic environment which conceivably has an incidence on corporate risk. We experimented with several macroeconomic variables, including inflation, external balance and the volatility of economic growth. The drawback is that some of these are not available for all countries on a quarterly frequency. For concreteness, in our preferred specification, we report results for only two such variables: GDP growth and the level of GDP per capita. The other control variables are not statistically significant and their inclusion does not change the results.
The global factors accounted for in our regressions include “High Yield,” which measures the yield of U.S. low-rated (i.e., “junk”) bonds. The inclusion of this variable is motivated by the fact that if, for example, investors consider EMEs’ corporate bonds to be part of the same risky assets class as U.S. high-yield bonds, then an increase in the yield of the latter could have an effect on the spread of the former. Another global factor accounted for is the yield on 10-year U.S. treasury bonds. An increase in the spreads of these essentially risk-free bonds could have an effect on corporate bond spreads in EMEs if, for example, that increase reflects an increase in investors’ appetite for riskier assets in general. Finally, we also account for “VIX,” which is constructed using the implied volatilities of a wide range of S&P 500 index options. This volatility is meant to be forward-looking and is calculated from both calls and puts. The VIX is a widely used measure of market risk.13
As discussed in the introduction, our measure of “sovereign risk” is the widely used JPMorgan EMBI spread for each of the 10 countries in our sample. These results should be interpreted with caution, however, s to be cautious because some of these measures of global risk are highly multi-collinear. Table 6 in the Appendix shows the correlation matrix of all these variables and also the OAS corporate spreads. Note, in particular, the high correlation coefficient between “high yield” and “VIX.” A list of all variables, definitions and sources is included in the Appendix (Table 7).
The proposed empirical specification has the advantage of enabling us to exploit both the cross-section and time-series variation of our dataset, while reducing the risk of omitted variable bias with the inclusion of country and industry level fixed-effects. In our preferred
12 For example, Catastrophic Bonds (also known as “Cat” Bonds).
13 See, example, Financial Times, November 30, 2006, Global Equity Valuations. Lex Column.

9
specification, we do not include time-specific effects because we do not foresee any possible unobserved-period effects that are not captured by our measures of sovereign risk, global factors or country-level variables. Nevertheless, our results are also robust to the inclusion of time-dummies.14
Following Petersen (2005), all standard errors are clustered by “country x time.” We perform a variance decomposition analysis to quantify the importance of each set of determinants in explaining the variation in OAS. We also perform a battery of sensitivity tests, including running the model in differences and allowing for additional interaction effects.
III. DATA DESCRIPTION
We use a panel dataset containing quarterly data from 139 bonds listed in Bloomberg issued by 65 corporations over 10 EME’s between 1999 and 2006. The countries are split between Latin America (six) and Asia (four): Argentina, Brazil, Chile, Colombia, Indonesia, Malaysia, Mexico, Philippines, Panama, and Thailand. Our constraint for sample selection is data availability.15 While firm-specific variables are typically reported on a quarterly basis, bond spreads and the EMBI are reported daily. The latter are transformed into quarterly frequency by computing the corresponding period average. Our main source of information is the Bloomberg database on publicly traded firms. Our choice of source hinges on the availability of accounting data for the firms issuers of bonds. The resulting sample comprises an unbalanced panel of 139 corporate bonds from 10 countries over 29 consecutive quarters.
Regarding our choice of dependent variable, we focus on the OAS of corporate bonds issued in foreign currencies only. This choice is driven by the availability of data. Nevertheless, the sample is representative of EME bond issues, as it is a well-established fact in the literature that most EMEs issue bonds only in foreign currencies (Eichengreen, Hausmann and Panizza, 2001).
Our explanatory variables are split into the six sets described in the previous section. These are: 1) industry-specific effects, 2) firm-specific variables, 3) bond characteristics, 4) country-specific effects, 5) sovereign risk, and 6) global factors. All the data are derived from Bloomberg, except for countries’ macroeconomic variables, which are taken from the World Bank’s World Development Indicators. Table 8 in the Appendix provides descriptive statistics for the main variables.
14 Regressions available from the authors upon request.
15 In choosing the starting and end dates we are restricted by data availability. Although there are some corporate bonds issued prior 1999, our data start in that year due to the availability of OAS analysis in Bloomberg.

10
A. Option Adjusted Spread (OAS) Analysis Computation16
Conventional bond price calculations utilize a constant “yield to maturity” rate to discount all future coupon and principal cash flows to their respective present values. However, a sloped yield curve demonstrates that short maturity cash flows are discounted differently than long maturity flows. A “benchmark spot curve” captures this by describing the appropriate discount rate for each cash flow. Bloomberg Professional Analysis generates a “benchmark spot curve” in the following steps: 1) the six-month spot rate is defined as being equivalent to the benchmark six-month rate; 2) a one-year benchmark bond containing a six-month coupon payment and a one-year coupon and principal payment is considered; 3) the six-month coupon payment of the one-year benchmark issue is discounted to present value using the six-month spot rate from (1); 4) the present value of the six-month coupon payment in (3) is then subtracted from the market price of the one-year cash flow to solve for the appropriate discount rate, which becomes the one-year spot rate; and 5) spot rates for successive terms are solved for in a similar way, generating a spot curve based on the underlying benchmark yield curve. The result of these successive calculations is a series of discount factors unique to each term of a bond’s cash flows.
The OAS analysis for noncallable bonds utilizes the “benchmark spot curve” to value a bond by breaking up its component cash flows and valuing them using the appropriate discount factor for each cash flow’s term. Once the spot rates for the benchmark curve are established, the OAS of a given bond is determined. Thus, rather than simply comparing a bond’s yield to maturity to a benchmark issue, OAS measures the constant spread that must be added to the current short-term interest rate to make the price of the risk-free bond, as calculated by the pricing model, identical to the observed market price of the corporate bond.
The OAS spread analysis for callable bonds—with cash flows contingent upon the future level of interest rates—is somewhat more complex. Specifically, the Bloomberg OAS model uses a one-factor, arbitrage-free binomial tree of normally distributed short-rates in order to establish a distribution of millions of different interest rate scenarios which are driven by the volatility input for the interest rate. OAS then examines the bond’s call schedule to establish the evolution of rates over time. Once these cash flows are modeled, the present value of the callable bond is determined by using the discount rates found in the tree, together with an OAS.
IV. REGRESSION RESULTS
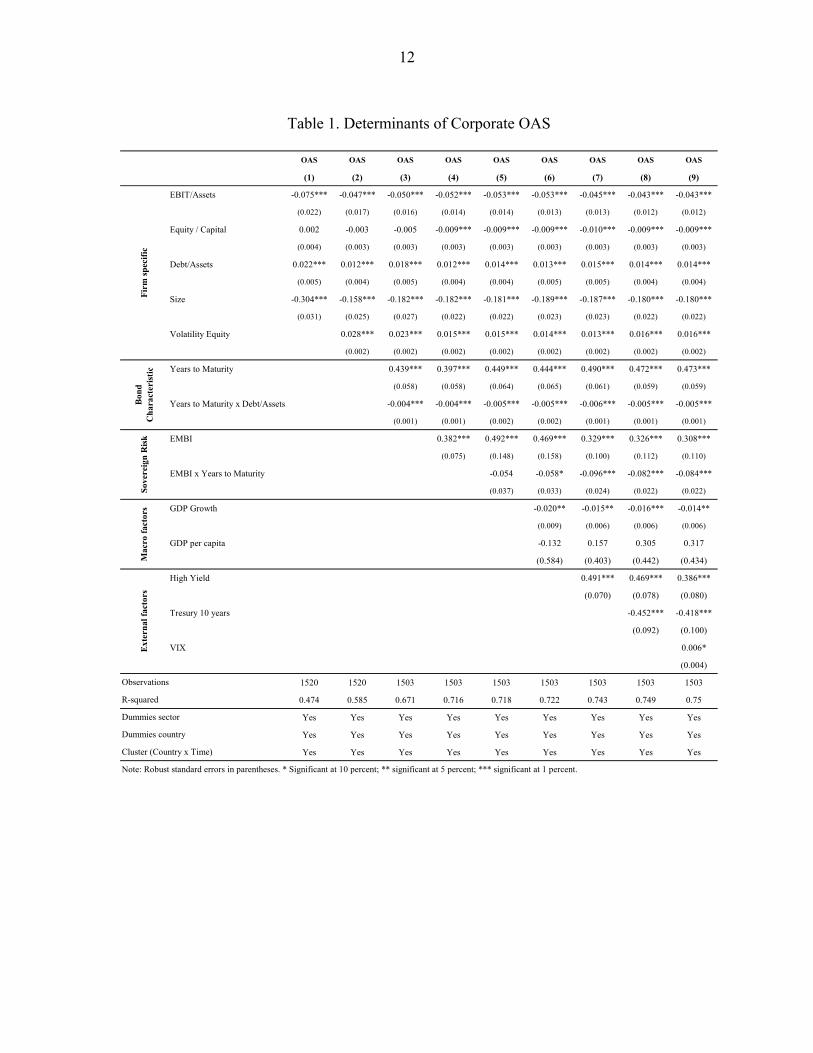
Table 1 reports the main results from the sequential estimation of different variants of equation (1). Column (1) includes only firm-level financial variables, along with (unreported) country fixed effects and industry (sector) dummies. The coefficients on the proxies for firm profitability (EBIT/Assets), capitalization (Equity/Capital), and asset size are negative and
16 This section draws heavily on the Bloomberg Professional Analysis.

11
statistically significant. In addition, the coefficient on the proxy for firm leverage (Debt/Assets) is positive and statistically significant. The results are intuitive and in line with our a priori expectations: on the one hand, firms with higher profitability, higher ratios of equity over capital, and more assets, are (all else equal) less risky. On the other hand, firms with high levels of debt are more risky.
In column (2) we augment the basic regression to incorporate the “volatility of the equity.”17 In line with the findings of Campbell and Taksler (2003), the point estimate for this variable is positive and statistically significant, suggesting that higher levels of volatility (a proxy for idiosyncratic risk) raise corporate bond spreads. Note that when the volatility of the equity is included, there is a sizable increase in R2, a measure of the goodness of the fit of the regression. This is in line with our variance decomposition results (to be discussed below), where we find that this variable in and of itself accounts for a large share of the overall contribution of firm- specific effects to the variance of the dependent variable.
Column (3) includes the “years to maturity” and “years to maturity x debt to assets” in order to account for the term structure of corporate bonds, as well as for the possible nonlinear incidence of the term structure at different levels of leverage. Both coefficients enter the regression with the expected sign. On the one hand, longer time to maturity is associated with more risk, but this effect is somewhat mitigated at higher levels of debt, where more time to pay reduces the risk of facing liquidity problems. Note that while there are small quantitative changes in the point estimates of the other variables as we augment the regressions, there are no changes in either the signs or the statistical significance of the different coefficients.
In column (4), we include the EMBI spread to account for sovereign risk. The point estimate is positive and statistically significant at standard confidence levels, suggesting that, as expected, sovereign risk increases corporate risk. Given that this effect has been the subject of considerable interest in the related literature, we explore the significance of our results in detail. As discussed in the introduction, until 2001 it was the common practice of risk credit agencies not to rate the debt of private corporations higher than the corresponding sovereign debt. The main reason was the so-called “transfer risk,” that is, the risk that if the government encounters difficulties in servicing its debts, it will transfer those problems to the domestic private sector. In other words, credit agencies used to impose a “sovereign ceiling” on corporate ratings. Durbin and Ng (2005) and Peter and Grandes (2005) argue that the existence of a strict sovereign ceiling in yield data would imply that a 1 percent increase in the spread on government bonds should be associated with an increase of at least 1 percent in firms’ spreads. This is because, under a strict sovereign ceiling, whenever there is an increase in the risk of government default, there has to be a corresponding increase in the risk of corporate default. We find that while sovereign risk increases corporate risk, there is no
17 Volatility is the standard deviation of day-to-day logarithmic price changes. A 360-day price volatility equals the annualized standard deviation of relative price change of the 360 most recent trading days’ closing price, expressed in a percentage for the day prior to the current.
12
Table 1. Determinants of Corporate OAS
OAS OAS OAS OAS OAS OAS OAS OAS OAS
(1) (2) (3) (4) (5) (6) (7) (8) (9)
EBIT/Assets -0.075*** -0.047*** -0.050*** -0.052*** -0.053*** -0.053*** -0.045*** -0.043*** -0.043***
(0.022) (0.017) (0.016) (0.014) (0.014) (0.013) (0.013) (0.012) (0.012)
Equity / Capital 0.002 -0.003 -0.005 -0.009*** -0.009*** -0.009*** -0.010*** -0.009*** -0.009***
(0.004) (0.003) (0.003) (0.003) (0.003) (0.003) (0.003) (0.003) (0.003)
Debt/Assets 0.022*** 0.012*** 0.018*** 0.012*** 0.014*** 0.013*** 0.015*** 0.014*** 0.014***
(0.005) (0.004) (0.005) (0.004) (0.004) (0.005) (0.005) (0.004) (0.004)
Size -0.304*** -0.158*** -0.182*** -0.182*** -0.181*** -0.189*** -0.187*** -0.180*** -0.180***
(0.031) (0.025) (0.027) (0.022) (0.022) (0.023) (0.023) (0.022) (0.022)
Volatility Equity 0.028*** 0.023*** 0.015*** 0.015*** 0.014*** 0.013*** 0.016*** 0.016***
(0.002) (0.002) (0.002) (0.002) (0.002) (0.002) (0.002) (0.002)
Years to Maturity 0.439*** 0.397*** 0.449*** 0.444*** 0.490*** 0.472*** 0.473***
(0.058) (0.058) (0.064) (0.065) (0.061) (0.059) (0.059)
Years to Maturity x Debt/Assets -0.004*** -0.004*** -0.005*** -0.005*** -0.006*** -0.005*** -0.005***
(0.001) (0.001) (0.002) (0.002) (0.001) (0.001) (0.001)
EMBI 0.382*** 0.492*** 0.469*** 0.329*** 0.326*** 0.308***
(0.075) (0.148) (0.158) (0.100) (0.112) (0.110)
EMBI x Years to Maturity -0.054 -0.058* -0.096*** -0.082*** -0.084***
(0.037) (0.033) (0.024) (0.022) (0.022)
GDP Growth -0.020** -0.015** -0.016*** -0.014**
(0.009) (0.006) (0.006) (0.006)
GDP per capita -0.132 0.157 0.305 0.317
(0.584) (0.403) (0.442) (0.434)
High Yield 0.491*** 0.469*** 0.386***
(0.070) (0.078) (0.080)
Tresury 10 years -0.452*** -0.418***
(0.092) (0.100)
VIX 0.006*
(0.004)
1520 1520 1503 1503 1503 1503 1503 1503 1503
0.474 0.585 0.671 0.716 0.718 0.722 0.743 0.749 0.75
Yes Yes Yes Yes Yes Yes Yes Yes Yes
Yes Yes Yes Yes Yes Yes Yes Yes Yes
Yes Yes Yes Yes Yes Yes Yes Yes Yes
Observations
Bon
d C
hara
cter
istic
Sove
reig
n R
isk
Ext
erna
l fac
tors
Dummies sector
Dummies country
Cluster (Country x Time)
Note: Robust standard errors in parentheses. * Significant at 10 percent; ** significant at 5 percent; *** significant at 1 percent.
Mac
ro fa
ctor
sFi
rm sp
ecifi
c
R-squared

13
support for a strict sovereign ceiling hypothesis. The point estimate that measures the elasticity of sovereign risk to corporate spreads is 0.382, which is significantly different from 1.18 In other words, we find that while there is a positive spillover from sovereign risk to corporate risk, the spillover is not one-to-one. This is consistent with the sovereign ceiling “lite” hypothesis of Borensztein et al. (2006a, 2006b) and further suggests that the decision of credit agencies to stop imposing a sovereign ceiling on corporate ratings is warranted by the yield data.
In column (5) we include an interaction term between EMBI and “years to maturity” of the corporate bond. The intuition is that this proxy of sovereign risk could have different effects on corporate spreads at different levels of maturity.19 The results suggest that while the overall effect of EMBI on corporate spreads persists, the impact of the former on the latter is higher when the maturity of the bond is shorter. In other words, while sovereign risk increases corporate spreads for all bonds, it has an even stronger effect on the spreads of corporate bonds with shorter maturities.
In column (6) we incorporate two macroeconomic variables: GDP growth and GDP per capita to account for the time-variant country specific effects. Both coefficients have the expected negative sign, but only the first one is significant at standard levels.20 This suggests that in countries with higher GDP growth, the private sector benefits from lower spreads.
Finally, in columns (7), (8) and (9) we included the U.S. High Yield, the 10-years U.S. Treasury rate and the VIX index in order to account for additional global factors. We find that an increase in U.S. High Yield increases corporate spreads in EMEs. This is consistent with the view that investors consider these bonds to be part of the same assets class, so that when the perceived risk of one increases, so does the other. On the other hand, we find that an increase in the yield of U.S. risk-free bonds is a corresponding decrease in EME’s corporate spreads. This could be signaling a substitution effect between the risk-less bonds and the risky asset class. The coefficient of VIX, a widely used measure of market risk, has the right sign (i.e., higher market volatility is associated with higher corporate bond spreads), and is marginally statistically significant. When these additional explanatory variables are included in the regression, the point estimate of the effect of sovereign risk on corporate spread, while still statistically significant, drops in size. This is likely to be the result of some collinearity between the EMBI spread and the other global factor variables. Indeed, Table 6 in the Appendix shows that some of these variables are highly correlated.
18 Wald test result reported in Table 9 in the Appendix
19 Ideally, one would want to match the 139 corporate bonds with the same number of sovereign bonds of identical maturities. While this is manageable for a small number of bonds (see Peter and Grandes, 2005), it becomes impractical for so many bonds across so many jurisdictions.
20 We also tried some additional macroeconomic controls variables, but the results do not change. Details are available from the authors upon request.

14
In summary, the evidence presented in Table 1 suggests that firm-specific variables, bond characteristics, sovereign risk, macroeconomic conditions and global factors are all determinants of corporate risk. The next step is to quantify the relative contribution of each of them, along with unobserved country and industry fixed effects, in explaining the variance of corporate spreads. To do so, we perform a variance decomposition exercise based on the regression reported in column (9) of Table 1 (without the interaction terms).21 The results are reported in Figure 1. They indicate that firm-specific factors account for the greatest share of corporate risk (i.e., approximately 33 percent of the total variance). Among these, volatility of equity (firm’s idiosyncratic risk measure) and asset size account for the bulk of the variation (approximately 20 percent altogether) The second most important factor is fixed effects, both industry-level and country-level. These unobserved time-invariant effects account for approximately 12 percent of total variance. Global factors and sovereign risk are the next most important determinants, each accounting for approximately 9 percent of variance each. Bond characteristics and macro factors are relatively less important determinants, respectively explaining 6 percent and 4 percent of variance. All in all, these results underscore the importance of good management and other firm-specific characteristics as the main drivers of corporate risk in EMEs. While sovereign risk and global factors—which are outside the control of firm management—also play a role, these effects are quantitatively less important.
Figure 1. Variance Descomposition: Corporate OAS
0
5
10
15
20
25
30
35
Firm specific Fixed Effects External factors Sovereign Risk Bond characteristic Macro-variables
Debt to Assets
Equity to assets
Equity to capital
Size
Volatility Sector fixed effects
Country fixed effects
VIX
High Yield
EMBIMaturity GDP per
capitar
GDP growth
Treasurry 10y
21 Where the variance decomposition of the equation (1) is given by
0 1 2 3 4 5 6( , ) ( , ) ( , ) ( , ) ( , ) ( , ) ( , ) ( )1( ) ( ) ( ) ( ) ( ) ( ) ( ) ( )
it C it s it it it it it ct it ct it t it it
it it it it it it it it
Cov S P Cov S D Cov S F Cov S B Cov S CR Cov S C Cov S G Cov SVar S Var S Var S Var S Var S Var S Var S Var S
β β β β β β β μ= + + + + + + +

15
V. EXTENSIONS AND ROBUSTNESS CHECKS
In Table 2 we incorporate some additional nonlinearities to test the robustness of our results and to explore some interesting hypotheses. In Column (1) we expand the regression in Column (9) of Table 1 (regression with the full set of controls) to include an interaction term between sovereign risk and a dummy for industries in the tradable sector.22 Firms that operate in the tradable sector generate their own foreign exchange and are presumably less exposed to the “transfer risk” (see Borensztein et al., 2006a). For concreteness, we do not report all the coefficients again, but instead focus on sovereign risk and on the new interaction effect. We find a negative coefficient for the interaction term, which is consistent with the aforementioned hypothesis that operating in the tradable sector mitigates the effects of
Table 2. Country Risks by Sectors
OAS OAS 1/
(1) (2)
EMBI 0.196** 0.168**
(0.090) (0.081)
EMBI x 1(Tradable) -0.024
(0.038)
EMBI x 1(Mining) 0.060
(0.087)
EMBI x 1(Utilities) 0.026
(0.078)
EMBI x 1(Agriculture) -0.043
(0.088)
EMBI x 1(Construction) -0.290*
(0.164)
EMBI x 1(Tourism) -0.285***
(0.079)
EMBI x 1(Telecommunication) -0.473***
(0.117)
Observations 1503 1503
R-squared 0.703 0.755Dummies sector Yes Yes
Dummies country Yes Yes
Control variables Yes Yes
Cluster (Country x Time) Yes Yes
Note: Robust standard errors in parentheses. * Significant at 10 percent; ** significant at 5 percent; *** significant at 1 percent.
1/ The ommited sector is manufacturing. 22 Our industries considered as in the tradable sector are Agriculture, Mining, and Tourism.

16
sovereign risk on corporate spreads, but the coefficient is not statistically significant.23 In order to explore whether there are other industry characteristics that determine a differential impact of sovereign risk on corporate spreads, we aggregate firms by industries and compute sector-level interaction effects (the omitted industry is Manufacturing). The results are reported in Column (2) of Table 2. There are no noticeable differences across sectors except for Tourism (a very “tradable” activity) and Telecommunications (a sector with a great deal of foreign ownership in EMEs), where the negative and statistically significant coefficients for the corresponding interaction terms indicate that operating in these sectors mitigates the effect of sovereign risk on corporate spreads.24
Table 3 reports the results from the estimation of our baseline specification (i.e., column (9) in Table 1)25 for the model in first-differences. Two set of regressions are reported: columns (1) to (4) in Table 3 do not include either industry or country fixed effects, while columns (5) to (8) include all dummies (for compactness, we omit reporting all the coefficients and concentrate on a subset of particularly interesting ones).26 The specification in first differences serves two purposes: on the one hand it constitutes a robustness check for our main results,27 but on the other hand it allows us to explore whether there is a differential impact of certain variables as they increase compared to when they decrease. This helps to shed light on some interesting hypotheses.
Consider, for example, the aforementioned sovereign ceiling hypothesis that suggests that there is an impact of sovereign risk on corporate spreads. We have already shown some evidence consistent with the “lite” version of this supposition (the transfer is less than 1 to 1). With the model in differences we can provide complementary evidence as, if there is a sovereign ceiling (“lite” or “strict”), then there should be a differential impact as EMBI spreads increase compared to when they decrease. The reason is that a sovereign “ceiling” by definition implies that when sovereign risk goes up, corporate risk should also increase, but the reverse is not necessarily true.28 Columns (2) and (6) in Table 3 provide evidence of a
23 Although the coefficient is not statically significant in the specification reported , which includes all the control variables, this could be due to problems of multi-collineality. Indeed, the coefficient is statistically significant in all the other specifications where we exclude the variables strongly correlated with the EMBI (i.e., macroeconomic conditions and global factors variables). Details available upon request.
24 We also find a negative coefficient for construction, although this is only weakly statistically significant.
25 For a better interpretation of the coefficients we exclude the nonlinearities from this specification.
26 Full results are available from the authors upon request.
27 See, in particular, columns (1) and (5), which report the results of the regressions that include the same variables as our benchmark specification.
28 The concept of sovereign ceiling was developed in the context of credit ratings, not spreads. Thus, for bond spreads, the analog to the sovereign ceiling is the sovereign floor.

17
differential effect: the interaction term of changes in the EMBI spread with a dummy that take a value of 1 when those changes are positive appears in the regressions with a positive sign and is statistically significant. This is also consistent with another interesting hypothesis advanced in the work of Calvo (1999) and Calvo and Mendoza (2000), that episodes of panic are more common in EMEs, where investors are less informed and more prone to herding. As panics are usually triggered when risks increase rather than decrease, the existence of a differential effect of the EMBI when it increases provides empirical evidence consistent with herding behavior. In order to probe this hypothesis further, we test whether we obtain similar results when we use a dummy that marks increases in the yield of U.S. junk bonds. The results reported in columns (3) and (7) of Table 3 are also in line with this hypothesis: the interaction term of changes in U.S. High Yield with a dummy that takes a value of 1 when those changes denote an increase and are positive and statistically significant. Finally, columns (4) and (8) of Table 3 include the two previous nonlinearities together, and the results do not change.29 All in all, we find that the relationships between changes in sovereign and corporate spreads and the relationship between changes in corporate spreads in EMEs and the high yield of U.S. junk bonds are nonlinear. These results are consistent with certain features of EMEs that have been previously identified in the literature.
Table 3. Asymmetries In Differences OAS OAS OAS OAS OAS OAS OAS OAS
(1) (2) (3) (4) (5) (6) (7) (8)
dEMBI 0.167** 0.135** 0.171*** 0.149** 0.184*** 0.134** 0.179*** 0.147***
(0.071) (0.059) (0.063) (0.062) (0.060) (0.053) (0.053) (0.052)
dHigh Yield 0.457*** 0.421*** 0.369*** 0.379*** 0.413*** 0.392*** 0.323*** 0.332***
(0.097) (0.090) (0.092) (0.091) (0.095) (0.091) (0.092) (0.092)
dEMBI x 1(dEMBI>0) 0.046*** 0.029 0.054*** 0.036**
(0.017) (0.019) (0.020) (0.018)
dHigh Yield x 1(dHigh Yield>0) 0.049** 0.031 0.061*** 0.046**
(0.020) (0.022) (0.020) (0.019)
Observations 1292 1292 1292 1292 1292 1292 1292 1292
R-squared 0.196 0.205 0.205 0.207 0.211 0.219 0.22 0.223
Dummies sector No No No No Yes Yes Yes Yes
Dummies country No No No No Yes Yes Yes Yes
Control variables Yes Yes Yes Yes Yes Yes Yes Yes
Cluster (Country x Time) Yes Yes Yes Yes Yes Yes Yes Yes
Note: Robust standard errors in parentheses. * Significant at 10 percent; ** significant at 5 percent; *** significant at 1 percent.
29 Although the statistical significance of one of the interaction terms in the regressions without fixed-effects disappears.

18
Finally, we carried out some additional robustness checks. We replicate the results of Table 1 (columns 4 to 9) using two new specifications. First, we excluded Argentina from the sample to ensure that the Argentine sovereign default episode (2002-2005) does not bias the results. These regressions are reported in Table 4. The results remain largely unchanged, with the main difference being a slight increase, from 0.382 to 0.452, in the impact of the EMBI on corporate spreads.30 Second, in Table 5, we replace the EMBI with sovereign credit ratings as an alternative measure of country risk. The results are qualitatively similar, but credit ratings are less informative than spreads.31
VI. CONCLUSIONS
What are the main determinants of corporate bonds spreads in emerging market economies (EMEs)? We have presented evidence that suggests that firm-specific variables (profitability, size, etc.), country and industry fixed effects, sovereign risk, bond characteristics and global factors all account for a share of those spreads.
Our proposed empirical methodology, based on OAS analysis from Bloomberg, enables us to deal with spread comparability issues which are pervasive in this literature. Panel data techniques allow us to take full advantage of the cross-sectional and time-series dimensions of our dataset while reducing the risk of bias arising from omitted variables or unobserved fixed effects.
A variance decomposition analysis indicates that firm-level characteristics account for the largest share of variance. All in all, these results underscore the importance of good management and other firm-specific characteristics as the main determinants of corporate risk in EMEs. While sovereign risk and global factors, which are outside the control of the firm management, also play a role, these effects appear to be relatively less important. In addition, we find two asymmetries. The first is consistent with a sort of sovereign ceiling “lite” in emerging bond spreads (Borensztein et al., 2006a and 2006b). The second is consistent with the notion that panics are common in emerging markets, where investors are less informed and more prone to herding (Calvo, 1999; and Calvo and Mendoza, 2000).
30 We find results in the same direction when we replicate Tables 2 and 3 excluding Argentina.
31 Finally we also estimate a model where we allow for a different point-estimate of the EMBI spread on each corporate bond. We find that in the 73 percent of the cases the elasticities of OAS spread to EMBI spread are between 0 and 1. In addition, the mean and median of the distribution are 0.39 and 0.36 respectively, which are very close to the point estimate reported for the benchmark regression.

19
Table 4. Determinants of Corporate OAS, Robustness Checks
OAS OAS OAS OAS OAS OAS
(1) (2) (3) (4) (5) (6)
EBIT/Assets -0.051*** -0.051*** -0.053*** -0.047*** -0.044*** -0.044***
(0.015) (0.015) (0.015) (0.014) (0.014) (0.013)
Equity / Capital -0.009*** -0.009*** -0.008*** -0.009*** -0.008** -0.008**
(0.003) (0.003) (0.003) (0.003) (0.003) (0.003)
Debt/Assets 0.013*** 0.016*** 0.016*** 0.017*** 0.016*** 0.016***
(0.005) (0.005) (0.005) (0.005) (0.005) (0.005)
Size -0.214*** -0.208*** -0.207*** -0.212*** -0.204*** -0.204***
(0.024) (0.025) (0.025) (0.024) (0.024) (0.024)
Volatility Equity 0.013*** 0.013*** 0.013*** 0.014*** 0.016*** 0.016***
(0.002) (0.002) (0.002) (0.002) (0.002) (0.002)
Years to Maturity 0.389*** 0.467*** 0.462*** 0.492*** 0.470*** 0.471***
(0.068) (0.067) (0.068) (0.067) (0.066) (0.066)
Years to Maturity x Debt/Assets -0.004** -0.005*** -0.005*** -0.006*** -0.005*** -0.005***
(0.002) (0.002) (0.002) (0.002) (0.002) (0.002)
EMBI 0.452*** 0.685*** 0.706*** 0.455*** 0.495*** 0.468***
(0.036) (0.050) (0.059) (0.065) (0.064) (0.071)
EMBI x Years to Maturity -0.105*** -0.105*** -0.117*** -0.105*** -0.105***
(0.018) (0.018) (0.018) (0.018) (0.018)
GDP Growth -0.013 -0.016** -0.013* -0.011
(0.009) (0.008) (0.007) (0.007)
GDP per capita 0.577 0.662 0.634 0.637
(0.502) (0.418) (0.435) (0.434)
High Yield 0.427*** 0.356*** 0.309***
(0.072) (0.066) (0.076)
Tresury 10 years -0.498*** -0.467***
(0.095) (0.106)
VIX 0.005
(0.004)
1424 1424 1424 1424 1424 1424
0.732 0.736 0.737 0.748 0.755 0.755
Note: Robust standard errors in parentheses. * Significant at 10 percent; ** significant at 5 percent; *** significant at 1 percent.
Ext
erna
l fac
tors
Observations
R-squared
Firm
spec
ific
Sove
reig
n R
isk
Mac
ro fa
ctor
sWithout Argentina
Bon
d C
hara
cter
istic

20
Table 5. Determinants of Corporate OAS, Robustness Checks
OAS OAS OAS OAS OAS OAS
(1) (2) (3) (4) (5) (6)
EBIT/Assets -0.050*** -0.049*** -0.049*** -0.043*** -0.041*** -0.041***
(0.015) (0.015) (0.013) (0.012) (0.012) (0.012)
Equity / Capital -0.007** -0.007** -0.009*** -0.010*** -0.010*** -0.010***
(0.003) (0.003) (0.003) (0.003) (0.003) (0.003)
Debt/Assets 0.016*** 0.015*** 0.013*** 0.013*** 0.012*** 0.012***
(0.005) (0.005) (0.005) (0.005) (0.005) (0.005)
Size -0.172*** -0.173*** -0.187*** -0.186*** -0.179*** -0.179***
(0.025) (0.026) (0.025) (0.023) (0.022) (0.022)
Volatility Equity 0.022*** 0.022*** 0.017*** 0.014*** 0.016*** 0.016***
(0.002) (0.002) (0.002) (0.002) (0.002) (0.002)
Years to Maturity 0.446*** 0.500*** 0.448*** 0.371*** 0.375*** 0.365***
(0.057) (0.074) (0.074) (0.071) (0.069) (0.068)
Years to Maturity x Debt/Assets -0.005*** -0.004** -0.004*** -0.005*** -0.005*** -0.005***
(0.001) (0.002) (0.002) (0.002) (0.002) (0.002)
Rating -0.064** -0.054* -0.031 -0.030 -0.026 -0.024
(0.029) (0.032) (0.030) (0.024) (0.023) (0.023)
Rating x Years to Maturity -0.005 -0.003 0.004 0.003 0.004
(0.006) (0.005) (0.006) (0.006) (0.005)
GDP Growth -0.022** -0.017** -0.017*** -0.013**
(0.011) (0.007) (0.006) (0.006)
GDP per capita -1.841*** -0.122 -0.108 -0.005
(0.608) (0.473) (0.506) (0.486)
High Yield 0.555*** 0.554*** 0.415***
(0.048) (0.045) (0.073)
Tresury 10 years -0.445*** -0.406***
(0.098) (0.103)
VIX 0.009***
(0.003)
1503 1503 1503 1503 1503 1503
0.677 0.677 0.698 0.736 0.742 0.744R-squared
Note: Robust standard errors in parentheses. * Significant at 10 percent; ** significant at 5 percent; *** significant at 1 percent.
Sove
reig
n R
isk
Mac
ro fa
ctor
sE
xter
nal f
acto
rs
Observations
Sovereign Rating as Sovereign RiskFi
rm sp
ecifi
cB
ond
Cha
ract
eris
tic

21 APPENDIX
Table 6. Correlation Matrix
OAS EMBI High Yield Treasury 10y VIX
OAS 1.00
EMBI 0.46 1.00
High Yield 0.42 0.36 1.00
Treasury 10y 0.06 0.16 0.16 1.00
VIX 0.43 0.37 0.87 0.09 1.00
Table 7. Description of Variables Variable Definition Unit of Measurement Data Source
OAS spread Option adjusted spread Percent (in natural logarithms) Bloomberg
EBIT/Assets EBIT to assets Percent Bloomberg
Equity / Capital Equity to capital Percent Bloomberg
Debt / Assets Debt to assets Percent Bloomberg
Size Assets Millions of US$ (in natural logarithms) Bloomberg
Volatility EquityStandard deviation of day to day logarithmic price changes. A previous 360-day price volatility equals the annualized standard deviation of relative price change of the 360 most recent trading day’s closing price.
Percent Bloomberg
Years to Maturity Years to Maturity Years (in natural logarithms) Bloomberg
GDP Growth Annual real GDP growth Percent WDI
GDP per capita GDP per capita US$ thousands (in natural logarithms) WDI
EMBI Emerging Markets Bond Index Spread Percent (in natural logarithms) Bloomberg
Rating Sovereign rating (1=Default, …, 21=AAA) S&P
High Yield US High Yield Master II Percent (in natural logarithms) Bloomberg
Treasury 10 years Treasury 10 years Percent (in natural logarithms) Bloomberg
VIX CBOE Volatility Index Percent Bloomberg

22 APPENDIX
Table 8. Descriptive Statistic
Variable Obs Mean Std. Dev.
OAS spread 1529 2.85 2.48
EBIT to assets 1529 2.28 1.40Equity to capital 1529 48.58 18.47Debt to assets 1529 37.22 12.32Assets 1529 10,508 9,953Volatility Equity 1529 30.98 11.41Years to Maturity 1529 9.68 18.22GDP Growth 1529 4.01 2.62GDP per capita 1529 4,733 1,408EMBI 1529 2.65 4.53
High Yield 1529 9.50 2.06
Treasury 10 years 1529 4.54 0.62
VIX 1529 17.55 6.76 Table 9. Wald Test to test Sovereign Ceiling Null hypothesis: EMBI=1 Level Equation
(1)EMBI 0.382***
Std. Err. 0.074
Wald Chi-square 68.2
Prob. 0.000
Note: * Significant at 10 percent; ** significant at 5 percent; *** significant at 1 percent.

23
References Altman, E., 2000, “Predicting Financial Distress of Companies: Revisiting the Z-score and
Zeta® Models,” Working Paper, (New York: New York University, Stern School of Business), http://pages.stern.nyu.edu/~ealtman/Zscores.pdf
Bandeira, O., et al., 2000, “Does Financial Reform Raise or Reduce Savings?” Review of
Economics and Statistics, No. 82, pp. 239-63. Borensztein, E., K. Cowan, and P. Valenzuela, 2006a, “Sovereign Ceiling ‘Lite’? The Impact
of Sovereign Ratings on Corporate Ratings in Emerging Market Economies,” IMF Working Paper 07/75 (Washington: International Monetary Fund).
———, 2006b, “The ‘Sovereign Ceiling Lite’ and Bank Credit Ratings in Emerging Markets
Economies,” Mimeo, (Washington: Inter-American Development Bank). http://sechi.facea.uchile.cl/sechi/contributed_2/Valenzuela_patr.pdf
Calvo, G., 1999, “Contagion in Emerging Markets: When Wall Street is a Carrier,”
(Maryland: University of Maryland), http://www.bsos.umd.edu/econ/ciecrp8.pdf Calvo, G., and E. Mendoza, 2000, “Capital Markets Crises and Economic Collapse in
Emerging Markets: An Informational Frictions Approach,” American Economic Review, No. 90 Vol. 2, pp. 59-94.
Campbell, J., and G. Taksler, 2003, “Equity Volatility and Corporate Bond Yields,” Journal
of Finance, No. 58 Vol. 6, pp. 2321-50. Choudhry, M. 2004, Advanced Fixed Income Analysis, (Amsterdam, The Netherlands:
Elsevier Butterworth-Heinemann). Ederington, H.L., J.B. Yawitz, and B.E. Robert, “The Information Content of Bond Ratings,”
Journal of Financial Research, No. 10, pp. 211-26. Eichengreen, B., R. Hausmann, and U. Panizza, 2003, “Currency Mismatches, Debt
Intolerance and Original Sin: Why They Are Not the Same and Why it Matters,” NBER Working Papers 10036, (Cambridge, Massachusetts: National Bureau of Economic Research).
Durbin, E., and D. Ng, 2005, “The Sovereign Ceiling and Emerging Market Corporate Bond
Spreads,” Journal of International Money and Finance No. 24 pp. 631-49. Huang, J., and W. Kong, 2003, “Explaining Credit Spread Changes: New Evidence from
Option-Adjusted Bond Indexes,” Stern School of Business Finance Paper No. 03-013, (New York: New York University).

24
IDB, 2006, Living with Debt: How to Limit the Risk of Sovereign Finance, Economic and Social Progress in Latin America: 2007 Report, (Washington: Inter-American Development Bank).
Merton, R., 1974, “On the Pricing of Corporate Debt: The Risk Structure of Interest Rates,”
Journal of Finance No. 29 Vol. 2, pp. 449-70. Peter, M., and M. Grandes, 2005, “How Important Is Sovereign Risk in Determining
Corporate Default Premia? The Case of South Africa,” IMF Working Paper 05/217, (Washington: International Monetary Fund).
Petersen, M., 2005, “Estimating Standard Errors in Finance Panel Data Sets: Comparing
Approaches,” NBER Working Paper 11280, (Cambridge, Massachusetts: National Bureau of Economic Research).
Standard and Poor’s, 2001, “Rating Methodology: Evaluating the Issuer, Corporate Ratings
Criteria,” (New York: Standard and Poor’s).