
143A: Principles of Operating Systems Lecture 7: System boot
Prestige Worldwide 1 Prestige Place Boston, MA 02115 781.522.3000 http://myweb.wit.edu/brouillarde/ April 29, 2011
Richard L. Roberts Associate Professor Department of Mechanical Engineering and Technology Wentworth Institute of Technology 550 Huntington Ave. Boston, MA 02115
Dear Professor Roberts:
Enclosed is a copy of “The Design and Manufacturing of an Intercooler Assembly with R-134a integration.” This report summarizes the team’s findings from the work completed during the Spring of 2011. It will aid in the further improvement of the current intercooler setup in performance automobile applications.
As promised in our proposal, this report details the analysis and outcome of the implementation of this new intercooler system. Also, through modeling and calculations, it will show the improvement over the previous system.
If there are any questions and/or comments regarding the interpretation of this report please feel free to contact us at the above address or phone number.
Sincerely,
Eric Brouillard Brian Burns Naeem Khan John Zalaket
Enclosure: Final Report

Prestige Worldwide | The Design and Manufacturing of an Intercooler Assembly with R-143a Integration 1
The Design and Manufacturing of an Intercooler Assembly with R-134a Integration
Submitted to: Professor Richard L. Roberts
Eric Brouillard
Brian Burns
Naeem Khan
John Zalaket
4/29/2011
WENTWORTH INSTITUTE OF TECHNOLOGY
MECH578-01

Prestige Worldwide | The Design and Manufacturing of an Intercooler Assembly with R-143a Integration Abstract
2
1.0 Abstract
In this experiment, the objective was to find a viable solution to reducing the air temperature of the intake in a
turbocharged system for an internal combustion engine while making any major modifications to the existing system.
The proposed idea was to create an additional system integrated on the intercooler using the existing air conditioning
system. The purpose of copper tubing in front of the existing intercooler, while properly integrated into the air
conditioning system, is to add additional cooling to the intake air to increase performance of the engine. During this
experiment, a mockup of the proposed system was created utilizing real world conditions to get data for validating the
possibility of the proposed system. Through a number of different tests and conditions, it was concluded that the
concept is a viable solution to reducing the temperature of the intake air in a turbocharged system.

Prestige Worldwide | The Design and Manufacturing of an Intercooler Assembly with R-143a Integration Contents
3
2.0 Contents
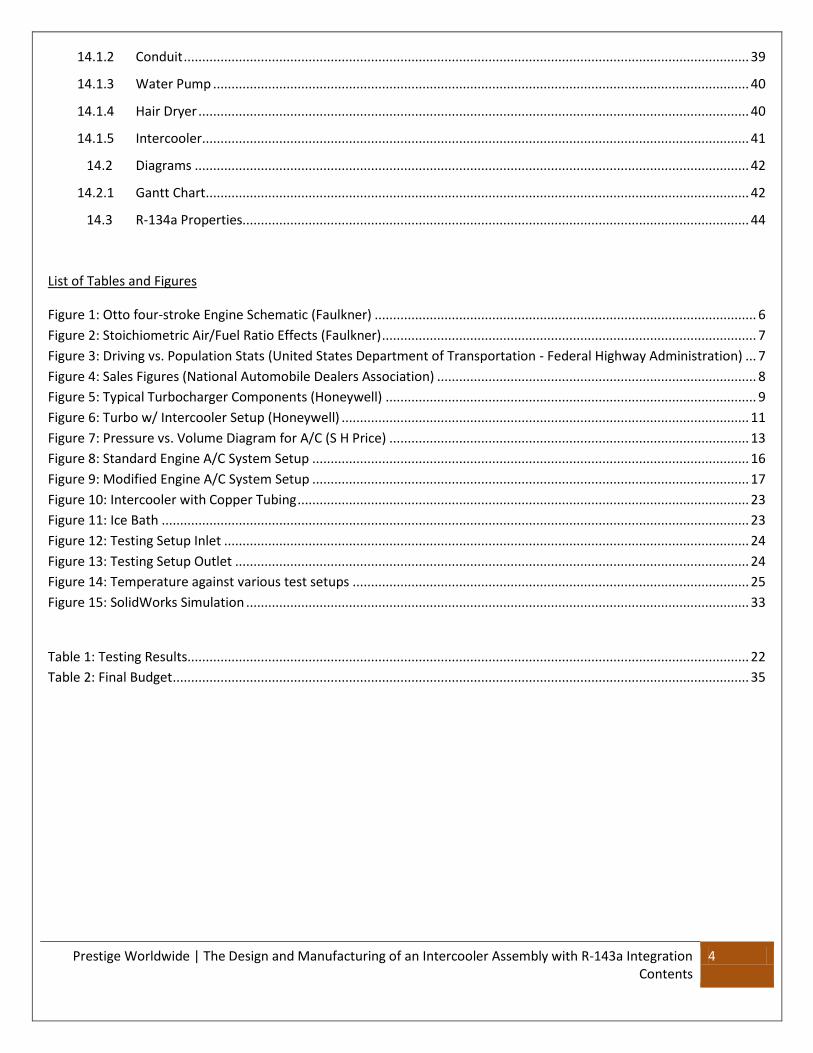
1.0 Abstract ...................................................................................................................................................................... 2
2.0 Contents ..................................................................................................................................................................... 3
3.0 Introduction ............................................................................................................................................................... 5
4.0 Background Information ............................................................................................................................................ 6
4.1 Modern Automotive Engines .............................................................................................................................. 6
4.2 Turbochargers ..................................................................................................................................................... 8
4.3 Intercooler ......................................................................................................................................................... 11
4.4 Automotive Passenger Air Conditioning ........................................................................................................... 12
5.0 Nomenclature .......................................................................................................................................................... 14
5.1 Greek Letters ..................................................................................................................................................... 14
5.2 Subscripts .......................................................................................................................................................... 14
6.0 Conceptual Design ................................................................................................................................................... 15
7.0 Assembly Design ...................................................................................................................................................... 18
8.0 Experimental Procedure .......................................................................................................................................... 19
8.1 Equipment and Materials .................................................................................................................................. 19
8.2 Procedure .......................................................................................................................................................... 20
9.0 Results ...................................................................................................................................................................... 22
9.1 Data ................................................................................................................................................................... 22
9.2 Illustration of setup ........................................................................................................................................... 23
9.4 Graphs/Diagrams .............................................................................................................................................. 25
9.5 Sample Calculations .......................................................................................................................................... 26
9.6 Simulation ......................................................................................................................................................... 33
9.7 Discussion of Results ......................................................................................................................................... 34
10.0 Final Budget ...................................................................................................................................................... 35
11.0 Recommendation for Future Work ................................................................................................................... 35
12.0 Conclusions ....................................................................................................................................................... 36
13.0 Works Cited ....................................................................................................................................................... 37
14.0 Appendix ........................................................................................................................................................... 38
14.1 Materials ....................................................................................................................................................... 39
14.1.1 Copper Tubing ............................................................................................................................................... 39
Prestige Worldwide | The Design and Manufacturing of an Intercooler Assembly with R-143a Integration Contents
4
14.1.2 Conduit .......................................................................................................................................................... 39
14.1.3 Water Pump .................................................................................................................................................. 40
14.1.4 Hair Dryer ...................................................................................................................................................... 40
14.1.5 Intercooler ..................................................................................................................................................... 41
14.2 Diagrams ....................................................................................................................................................... 42
14.2.1 Gantt Chart .................................................................................................................................................... 42
14.3 R-134a Properties.......................................................................................................................................... 44
List of Tables and Figures
Figure 1: Otto four-stroke Engine Schematic (Faulkner) ........................................................................................................ 6
Figure 2: Stoichiometric Air/Fuel Ratio Effects (Faulkner) ...................................................................................................... 7
Figure 3: Driving vs. Population Stats (United States Department of Transportation - Federal Highway Administration) ... 7
Figure 4: Sales Figures (National Automobile Dealers Association) ....................................................................................... 8
Figure 5: Typical Turbocharger Components (Honeywell) ..................................................................................................... 9
Figure 6: Turbo w/ Intercooler Setup (Honeywell) ............................................................................................................... 11
Figure 7: Pressure vs. Volume Diagram for A/C (S H Price) .................................................................................................. 13
Figure 8: Standard Engine A/C System Setup ....................................................................................................................... 16
Figure 9: Modified Engine A/C System Setup ....................................................................................................................... 17
Figure 10: Intercooler with Copper Tubing ........................................................................................................................... 23
Figure 11: Ice Bath ................................................................................................................................................................ 23
Figure 12: Testing Setup Inlet ............................................................................................................................................... 24
Figure 13: Testing Setup Outlet ............................................................................................................................................ 24
Figure 14: Temperature against various test setups ............................................................................................................ 25
Figure 15: SolidWorks Simulation ......................................................................................................................................... 33
Table 1: Testing Results......................................................................................................................................................... 22
Table 2: Final Budget ............................................................................................................................................................. 35

Prestige Worldwide | The Design and Manufacturing of an Intercooler Assembly with R-143a Integration Introduction
5
3.0 Introduction
The purpose of this project is to take a standard intercooler and reduce the outlet temperature by cooling it down
with the automobiles A/C system. For the conceptual design the plan is to add an addition system to the A/C system by
adding an evaporator to the front of a prefabricated intercooler. In the experiment, ice water was used to achieve a
controllable temperature close to the operating temperature of R-134a from the A/C unit, which runs at 34°F. The inlet
and outlet temperatures were measured to record the temperature changes across the system. This experiment was
conducted in accordance with a literature review of previous publications to achieve the following:
Create a conceptual design using actual vehicle components
Construct a physical assembly for demonstration
Test assembly with real world conditions
Extract necessary data to satisfy objectives
Verify results through a simulation and calculations
Prestige Worldwide | The Design and Manufacturing of an Intercooler Assembly with R-143a Integration Background Information
6
4.0 Background Information
4.1 Modern Automotive Engines
The main mode of transporation in America today is the automobile. The modern automobile industry has
expanded to include small, medium, and large size cars and trucks. The beginings of modern automobile transportation
can be traced back to the development of the internal combustion spark-ignition engine. The first commercially
successful internal combustion engine is accredited to Jean Joseph Étienne Lenoir who developed the engine in 1860.
More specifically, the four-stroke spark-ignition gas engine, mostly commonly found in contemporary automobiles, was
actualized by Nicolaus Otto in 1876. Over the last 125 years the engine has gone through much technological
advancement but is still based upon the principles of the four-stroke process.
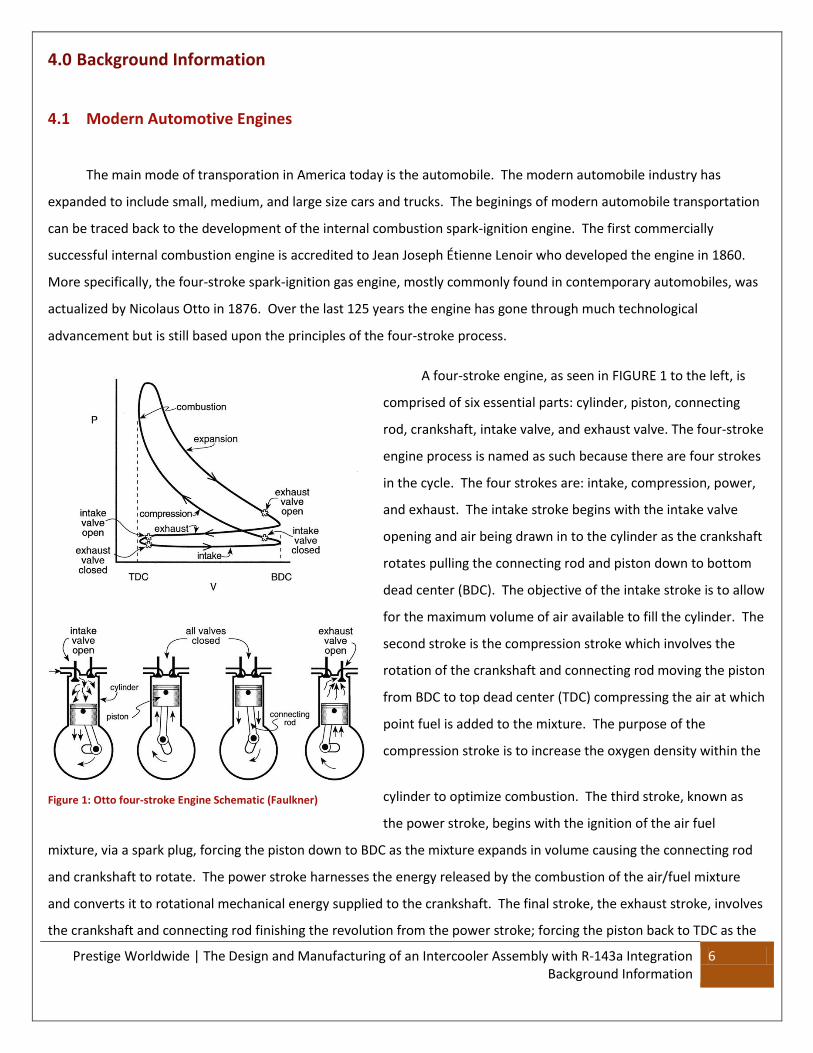
A four-stroke engine, as seen in FIGURE 1 to the left, is
comprised of six essential parts: cylinder, piston, connecting
rod, crankshaft, intake valve, and exhaust valve. The four-stroke
engine process is named as such because there are four strokes
in the cycle. The four strokes are: intake, compression, power,
and exhaust. The intake stroke begins with the intake valve
opening and air being drawn in to the cylinder as the crankshaft
rotates pulling the connecting rod and piston down to bottom
dead center (BDC). The objective of the intake stroke is to allow
for the maximum volume of air available to fill the cylinder. The
second stroke is the compression stroke which involves the
rotation of the crankshaft and connecting rod moving the piston
from BDC to top dead center (TDC) compressing the air at which
point fuel is added to the mixture. The purpose of the
compression stroke is to increase the oxygen density within the
cylinder to optimize combustion. The third stroke, known as
the power stroke, begins with the ignition of the air fuel
mixture, via a spark plug, forcing the piston down to BDC as the mixture expands in volume causing the connecting rod
and crankshaft to rotate. The power stroke harnesses the energy released by the combustion of the air/fuel mixture
and converts it to rotational mechanical energy supplied to the crankshaft. The final stroke, the exhaust stroke, involves
the crankshaft and connecting rod finishing the revolution from the power stroke; forcing the piston back to TDC as the
Figure 1: Otto four-stroke Engine Schematic (Faulkner)

Prestige Worldwide | The Design and Manufacturing of an Intercooler Assembly with R-143a Integration Background Information
7
exhaust valves open allowing spent gases to exit the cylinder. FIGURE 1 shows the relationship between pressure and
volume during the four-stroke engine cycle. This is particularly for a naturally aspirated engine meaning that there is
only uncompressed atmospheric air entering the engine. It is noted that the pressure increase during the compression
cycle is gradual as the piston reaches TDC at which point combustion occurs and the pressure peaks expanding and
forcing the piston back down as the power stroke completes and the exhaust stroke begins.
Combustion during the power stroke is dependent upon the fundamental thermodynamic properties of air and
gasoline. The basis of these properties comes down to the chemistry behind the air, fuel, and the ratio between the
two. For optimal full combustion the Stoichiometric ratio is approximately 14.75:1. This means that for optimal full
combustion within a cylinder there should be 14.75 air molecules for every 1 molecule of fuel. The air/fuel ratio is
constantly monitored and adjusted accordingly by the vehicles
electronic control unit (ECU). This measurement is performed by
the oxygen sensor located in the exhaust system of the vehicle. As
the engine goes through its four-stroke cycle the ECU is able to
determine if more air or fuel should be added to keep the engine
running at optimal conditions. If the air/fuel ratio is greater than
stoichiometric (e.g. 15.0:1) than it is considered to have a lean air
fuel ratio. Alternatively, if the air/fuel ratio is less than
stoichiometric (e.g. 13.5:1) than it is considered to have a rich air
fuel ratio. ECU will control this ratio based upon engine load,
operating speed, and throttle position among other parameters.
FIGURE 2 displays the relationship of operating at different air/fuel
ratio assuming a constant engine speed and wide open throttle
(WOT). If the engine is under heavy load than the ECU will
attempt to achieve maximum power which is a slightly rich
ratio. But if there is a low to medium load on the engine the
ECU will attempt to achieve the best economy which is a slightly
lean mixture.
Figure 3: Driving vs. Population Stats (United States Department of
Transportation - Federal Highway Administration)
Figure 2: Stoichiometric Air/Fuel Ratio Effects (Faulkner)
Prestige Worldwide | The Design and Manufacturing of an Intercooler Assembly with R-143a Integration Background Information
8
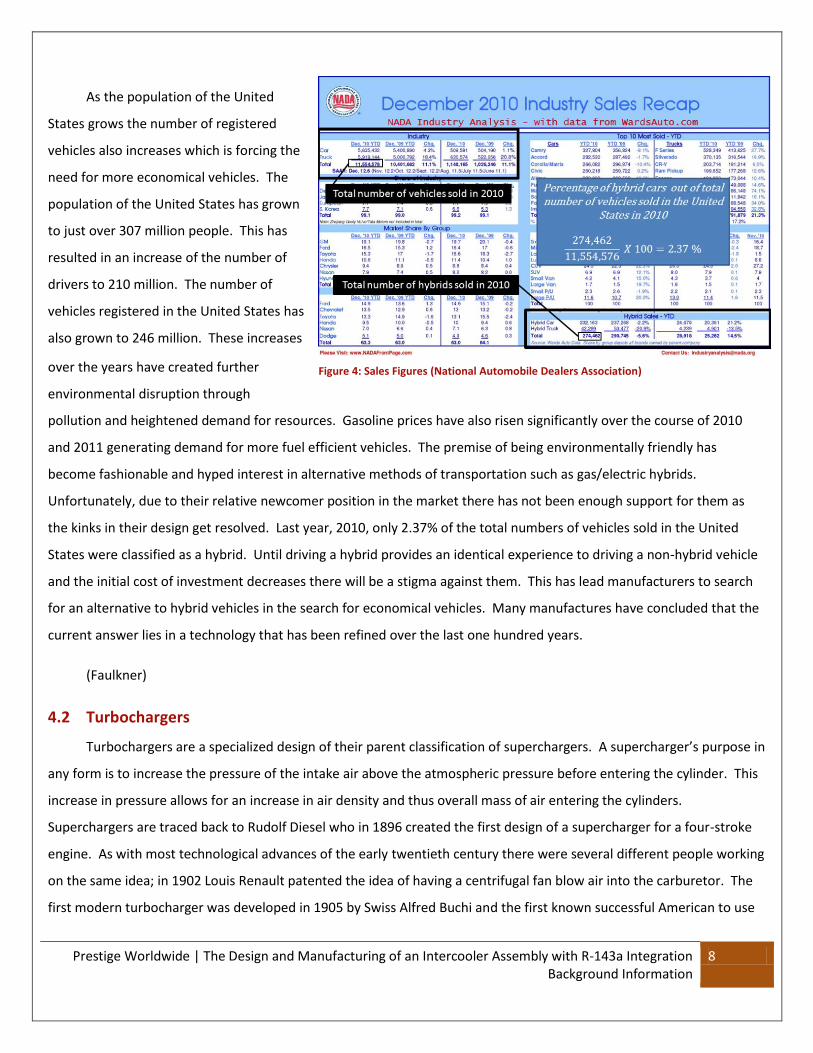
As the population of the United
States grows the number of registered
vehicles also increases which is forcing the
need for more economical vehicles. The
population of the United States has grown
to just over 307 million people. This has
resulted in an increase of the number of
drivers to 210 million. The number of
vehicles registered in the United States has
also grown to 246 million. These increases
over the years have created further
environmental disruption through
pollution and heightened demand for resources. Gasoline prices have also risen significantly over the course of 2010
and 2011 generating demand for more fuel efficient vehicles. The premise of being environmentally friendly has
become fashionable and hyped interest in alternative methods of transportation such as gas/electric hybrids.
Unfortunately, due to their relative newcomer position in the market there has not been enough support for them as
the kinks in their design get resolved. Last year, 2010, only 2.37% of the total numbers of vehicles sold in the United
States were classified as a hybrid. Until driving a hybrid provides an identical experience to driving a non-hybrid vehicle
and the initial cost of investment decreases there will be a stigma against them. This has lead manufacturers to search
for an alternative to hybrid vehicles in the search for economical vehicles. Many manufactures have concluded that the
current answer lies in a technology that has been refined over the last one hundred years.
(Faulkner)
4.2 Turbochargers
Turbochargers are a specialized design of their parent classification of superchargers. A supercharger’s purpose in
any form is to increase the pressure of the intake air above the atmospheric pressure before entering the cylinder. This
increase in pressure allows for an increase in air density and thus overall mass of air entering the cylinders.
Superchargers are traced back to Rudolf Diesel who in 1896 created the first design of a supercharger for a four-stroke
engine. As with most technological advances of the early twentieth century there were several different people working
on the same idea; in 1902 Louis Renault patented the idea of having a centrifugal fan blow air into the carburetor. The
first modern turbocharger was developed in 1905 by Swiss Alfred Buchi and the first known successful American to use
Figure 4: Sales Figures (National Automobile Dealers Association)

Prestige Worldwide | The Design and Manufacturing of an Intercooler Assembly with R-143a Integration Background Information
9
the centrifugal compressor on a carburetor was Lee Chadwick in 1907. As the application of superchargers grew to
include airplanes the development advanced quickly as it allowed fighters to fly at higher altitudes. The supercharger
compressed the thin high altitude air allowing the engines to run more smoothly. As aviation supercharging continued
to increase it was the trickle down to motorsports that drove the development of forced induction for vehicles. There
were several entries of supercharged vehicles in the major races of the early 1920’s such as the Grand Prix and
Indianapolis 500. It would take many years for the first production turbocharged car to be introduced which was the
1962-1963 Oldsmobile Jetfire. The engine in the Jetfire was the 215 V-8 which produced 215 horsepower in comparison
to the 155 horsepower produced by the natural aspirated version. Since the first developments of turbochargers in the
early 1900’s the applications have expanded to at least one turbocharged engine being utilized by most major
manufacturers in 2011.
List of manufacturers offering 2011 model year automobiles and trucks utilizing a turbocharged engine:
Acura Fiat Maybach Porsche
Audi Ford Mazda Saab
BMW GMC McLaren Subaru
Bentley Hyundai Mercedes-Benz Volkswagen
Bugatti Kia Mini Volvo
Buick Land Rover Mitsubishi
Chevrolet Lincoln Nissan
The foundation of turbochargers is supplying the engine with more air molecules than would normally be
available to that of a normally aspirated, or non-turbocharged, engine. All things being equal a larger displacement
engine will make more power, for example a 4.0 liter displacement engine will make more power than a 2.0 liter
displacement engine. Displacement is the volume of the cylinder that the piston travels as it moves from BDC to TDC.
Turbochargers force more air in the engine than would normally
be available increasing its effective displacement. With a larger
effective displacement a smaller displacement turbocharged
engine is able to produce the power of a larger displacement
engine. This gives a turbocharged vehicle an advantage for
several reasons. Since a smaller displacement engine is physically
Figure 5: Typical Turbocharger Components (Honeywell)

Prestige Worldwide | The Design and Manufacturing of an Intercooler Assembly with R-143a Integration Background Information
10
smaller in size it can thus be lighter in weight which allows for an increase in efficiency as there is less work for the
engine to overcome. Secondly, a smaller displacement turbocharged engine is able to consume less fuel when it is not
using the turbocharger but can also supply the same amount of power when needed. The application of turbocharging
can best be described as a larger displacement engine on demand.
Although the idea of turbocharging is simple there is an incredible amount of effort applied to produce a well-
designed marketable turbocharged engine. Turbochargers can be broke down in to several categories such as radial,
mixed, or axial flow, internal or external wastegate, water or oil cooled, among others. Turbochargers are most
commonly found in three different configurations radial, axial, and mixed flow. In axial flow turbines the flow of gasses
remains parallel to the axis of rotation. In radial and mixed flow turbines, the most common types, the flow of gasses
run parallel to the axis of rotation and at right angles with the perimeter of the turbine wheel for radial and less than
right angles for mixed flow. Internal and external wastegates refer to the design method used to release pressure in the
turbine, which will be explained later. Water or oil cooled refers to methods in which the turbocharger bearing housing
is cooled to prevent fatigue during high stress.
There are two major components each category of turbocharger has in common: the turbine and the
compressor. The turbine side, also known as the hot side, utilizes exhaust gasses to convert tangential flow to a rotating
shaft that is shared with the compressor side of the turbo. Exhaust gases exit the cylinder through the exhaust valves
during the exhaust stroke and enter the turbine housing which forces them to the turbine blades. The velocity of the
turbine and thus the compressor is dependent upon the temperature and velocity of the gases, as well as, the pressure
differential across the turbine. The means by which turbines are most commonly specified as is the area to radius or A/R
ratio. The A/R is measured by the smallest cross sectional area of the inlet over the radius from the center of the inlet to
the center of the turbine. The larger the A/R ratio the slower the rotational speed of the turbine, conversely, the smaller
the A/R ratio the faster the rotational speed of the turbine. The compressor side, also known as the cool side, is what is
responsible for the actual suction and compression of air to be fed in to the engine. Although there are several different
types of blades that can be used the most common are backward-curved blades because they offer the highest peak
efficiency. Each engine and vehicle purpose requires the alteration of turbine and compressor selection as they affect
the performance of the engine itself and how it behaves.
The most important contribution of a turbocharger is done by the compressor side and is known as boost or
boost pressure. The boost pressure is the pressure above atmospheric pressure that results from the compressor and is
fed in to the intake of the engine. The higher the pressure the denser the air meaning the more fuel that can be burned
and thus power made by the engine. The boost supplied by a turbocharger is limited by the specified compressor and
turbine wheels as well as the turbocharger housing itself but it can also be controlled by external means. Two of the
most common mechanical types of boost regulators are wastegates and blow-off valves. Wastegates provide pressure

Prestige Worldwide | The Design and Manufacturing of an Intercooler Assembly with R-143a Integration Background Information
11
relief on the turbine side of the turbocharger. The pressure in the turbine housing will spike during changes in load and
exhaust flow as such pressure must be mitigated away from the blades and routed back in to the exhaust. This process
helps control the speed of the turbine and thus the compressor. Blow off valves on the other hand operate on the
compressor/intake portion of the turbocharger system. Their duty is to regulate the pressure and prevent damage to
intake valves and compressor blades. When the throttle-body rapidly closes there is an excess amount of air and
pressure built up in the intake tract and that pressure needs to be released. This pressure release is what a blow-off
valve accomplishes by either dumping the pressure back in to the intake tract or vents it to the atmosphere. Each of
these components is adjustable to suit the design specifications.
One of the negative effects of turbocharged vehicles is the increased potentional for detonation also known as
knock. Knock is the uncontrolled pre-ignition of the air fuel mixture before the intended spark is provided. Knock is a
dangerous occurrence as it has the ability to explode cylinder walls and valves. There are several attributes that lend to
the tendency and prevention of knock. The first is the engine design itself the meaning the cylinder geometry, piston
design, valve and spark plug location,and compression ratio. The second attrbute is the fuel being used. Gasoline is
rated based upon its ablility to resist knock, known as the octane rating. The higher the octane rating the more resistant
to knock it is. Another attribute resulting in knock and is incorporated in to the design of a turbo system is the ambient
air conditions and the cylinder pressures of the engine. As the ambient air temperatures and cylinder pressures rise
engines will havea tendency to knock. This is prevented by the incorporation of a specialized heat exchanger in to the
system known as an intercooler.
(Logan)
4.3 Intercooler
Heat exchangers are inanimate mechanical pieces that
facilitate the transfer of heat energy from one medium to another
without mixing. The amount and rate of transfer of this heat energy
is determined by the variance in temperature between and the
characteristics of the mediums. The second law of thermodynamics
states that heat energy transfers from a medium of high energy
(temperature) to a lower energy (temperature). In order for there to
be a transfer of energy the two mediums must have a difference in
temperature. The transfer of energy in an intercooler occurs by the
processes of convection between the moving air and intercooler fins
and surface and conduction through the wall of the intercooler. Figure 6: Turbo w/ Intercooler Setup (Honeywell)
Prestige Worldwide | The Design and Manufacturing of an Intercooler Assembly with R-143a Integration Background Information
12
Heat exchangers come in several different types but for automotive intercoolers an unmixed cross-flow type is
used. Most intercoolers are simply air-to-air but there are some specialized cases where engine coolant is used as the
second medium to create a water-to-air setup. In an air-to-air setup, as shown in FIGURE 6, the compressed air coming
from the turbocharger flows through the intercooler as ambient air flows across the intercooler. This process is used to
cool the air after the turbocharger and feed the air into the engine. Reducing the temperature of the air from the
intercooler increases the density allowing for more mass to flow in to the engine. Other benefits of cooling the air
include the prevention of knock and pre-ignition which are detrimental to engines. The cooler the air coming in, the less
thermal load the engine internals have to endure thus increasing reliability and longevity of the engine. Due to the fact
that turbochargers are unnecessary while the vehicle is stationary there is no need for a fan to pull air across the fins.
The typical location for an intercooler is directly in front of the radiator or off to the sides. This means that space in the
engine compartment for the intercooler and associated piping must be made which is one disadvantage. Another
disadvantage is the pressure drop across the intercooler and through the piping which results in some loss of air density.
Overall, the intercooler is an important support piece to the purpose of the turbocharging system to get as much cool
dense air in to the engine as possible maximizing power and preventing unintended combustions from occurring.
(Logan)
4.4 Automotive Passenger Air Conditioning
Cabin temperature is an important aspect to vehicle transportation. Driver comfort is paramount to safely
operate a vehicle. Driver alertness is directly related to the environmental conditions within the cabin of a vehicle.
Without the air stream created by a vehicle in motion the cabin will become stale and begin to heat due to solar
radiation and convection and conduction from the ambient air. The need to cool the cabin leads to the development of
an air-conditioning system for vehicles. The first car company to offer such a system was Packard Motor Car Company in
1939 as an option for $274. (National Academy of Engineering)
After decades of refinement vehicle air-conditioning systems have been simplified to seven major components.
The seven major components- in order of the process –are: evaporator, compressor, condenser, receiver drier, dual high
and low pressure switch, expansion valve, and blower. The evaporator is constructed similarly to an engine radiator
with a number of tubing passes are separated by ribbon fins and adjoined together by end tanks. Compressors come in
two different types: vane-rotary-type and reciprocating-type. Swash-plate-type is a subcategory of reciprocating type
compressors and is the most commonly found in air conditioning systems. Swash-plate-type compressors operates
using three sets of two opposing single component cast pistons to oscillate back and forth drawing in refrigerant and
compressing it. A condenser is a type of heat exchanger that sits in front of the radiator and is constructed of tubes with
fins positioned in-between similar to a radiator. The receiver drier is a cylindrical casing filled with desiccant crystals
which absorb water mist or droplets and filters contamination in the refrigerant. The dual high and low pressure switch
Prestige Worldwide | The Design and Manufacturing of an Intercooler Assembly with R-143a Integration Background Information
13
acts as a control switch if the refrigerant pressure rises above or below the set pressures the switch will kill the
compressor. The expansion valve regulates the flow of refrigerant through the system and controls the amount of liquid
refrigerant that moves in to the evaporator. The blower moves air across the evaporating causing the air to cool and
forces the air in to the cabin.
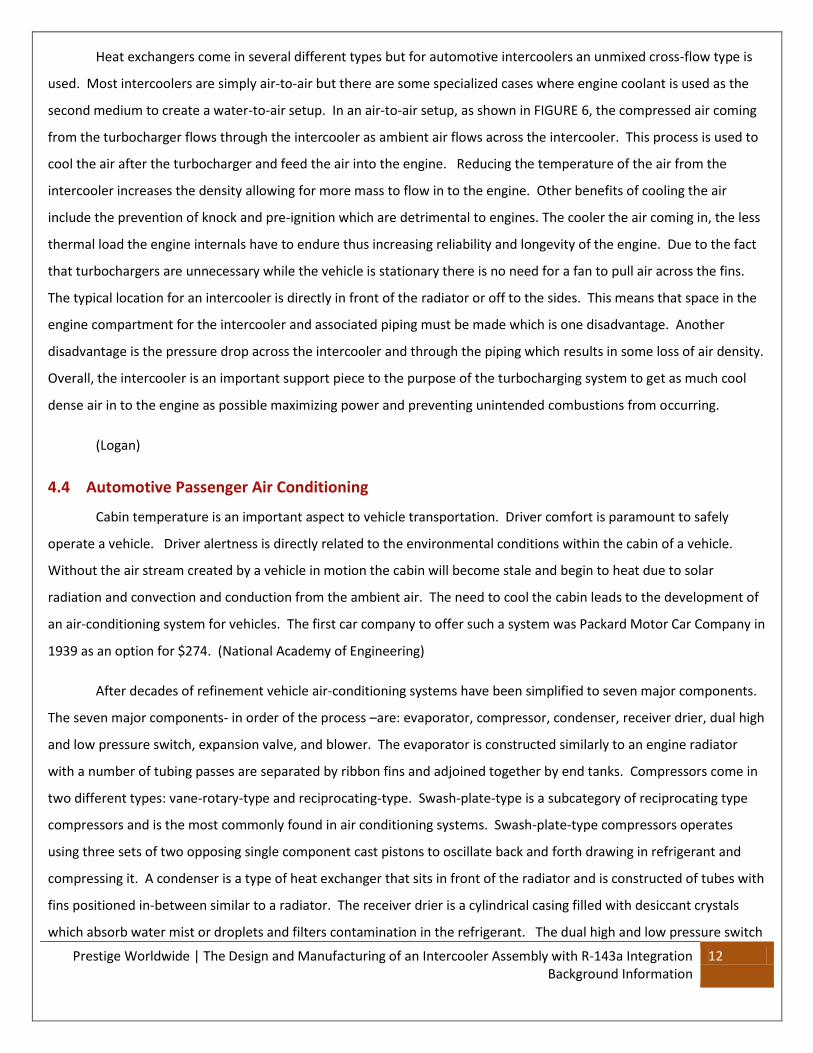
The operation of an air-conditioning system is similar to the
process required for a refrigerator. The evaporator has low pressure
and temperature vapor flowing through its tubing which is boiled from
the heat of the warm ambient air stream flowing across its tubing. This
superheated low pressure refrigerant exits the evaporator and is
drawn in to the compressor where the pressure of the vapor is
increased. The refrigerant then enters the condenser where heat is
extracted by air stream flowing over the condenser piping. This cooling
causes the refrigerant vapor to condense in to a high pressure liquid
that then proceeds to pass through the receiver-drier which removes any water moisture and debris from the
refrigerant stream. From the receiver drier refrigerant flows to the expansion valve which controls the flowing in to the
evaporator in a liquid-vapor state.
The refrigerant is one of the most important aspects of the air-conditioning system and requires select
properties. The properties required for a good refrigerant are the ability to absorb heat as it changes from liquid to a gas
and reject heat as it reverses the process. Many different refrigerants have been used over the years but the
refrigeration used in current automotive air-conditioning systems is tetrafluoroethane also known as R-134a. This has
been used as the standard refrigerant since the early 1990’s as the previous standard dichlorodifluoromethane, known
as R-12 was phased out because it was found to harm the environment.
See APPENDIX 14.3 for R-134 specs.
(Heisler)
Figure 7: Pressure vs. Volume Diagram for A/C (S H Price)

Prestige Worldwide | The Design and Manufacturing of an Intercooler Assembly with R-143a Integration Nomenclature
14
5.0 Nomenclature
Area [ ] OD Outer Diameter of tube [ ]
A/C Air Conditioning P Pressure [ ]
Specific Heat [ ] Pr Prandtl number
Copper Flow rate [ / s]
f Friction Factor Heat transfer rate [BTU/ s]
g Gravity [ ] Radius of the tube [ ]
Convection heat transfer coefficient [ / R] Re Reynolds number
Piezometric head [ ] Silicon
Head loss [ ] Temperature ]
ID Inner Diameter of tube [ ] Thickness [ ]
Thermal Conductivity [ ] Volume Flow Rate [ ]
L Length [ ] Velocity [ ]
Nu Nusselt number z Elevation [ft]
5.1 Greek Letters
Surface roughness [ ] Specific Weight [ ]
Dynamic viscosity Density [ ]
Kinematic viscosity [
5.2 Subscripts
bm Bulk Mean Outlet conditions
Film s Surface
Inlet conditions surr Surrounding

Prestige Worldwide | The Design and Manufacturing of an Intercooler Assembly with R-143a Integration Conceptual Design
15
6.0 Conceptual Design
The factory air conditioning system’s mode of cooling (typically R-134a) reaches temperatures significantly lower
than the intake air. Since turbocharged vehicles generally come equipped with a heat exchanger device such as an
intercooler to decrease intake air temperature, it was decided to experiment the possibility of further decreasing the
intake temperature by integrating the factory A/C system through the intercooler itself. If an air-to-air-to-liquid heat
exchanger was incorporated instead of a simple air-to-air intercooler, air intake temperatures would potentially
decrease greatly due to the R-134a’s low temperature and the heat transfer induced through conduction.
When R-134a passes through the expansion valve, it reaches a startling 34 degrees Fahrenheit merely through a
phase change. This expansion valve is what causes the change in relative pressure. For reference, it can be thought of as
a throttling valve, or an orifice plate. A splitter would be incorporated in place before reaching the factory expansion
valve, so that the R-134a can be routed to the separate intercooling system. After the splitter, a separate expansion
valve will be placed in line in order to lower the temperature. The reason for using two expansion valves mounted after
a splitter is so the each can have their own thermal bulb respectively. These thermal bulbs will regulate the orifice size of
the expansion valve, in order to prevent liquid R-134a from reaching the evaporator as well as the vehicles compressor
pump. Only after this point is the hose directly plumbed into the intercooler. This internal physical contact between the
R-134a and the aluminum intercooler housing is what will lend great conduction and heat transfer.
Due to the complexity of this intercooler design and lack of funds, an external copper tubing evaporator was
designed to take place of the internal R-134a routing design. Although the conduction through the direct contact in the
custom intercooler would have made it much more efficient, the abilities to manufacture this said intercooler were not
possible for this particular experiment.
While the air is channeled through the intercooler horizontally, flowing from turbocharger to intake plenum, it
will not only be cooled via the ambient air flowing through the fins, but vertical channels will be built into the intercooler
in order for the R-134a to cool the aluminum housing through conduction. Only after flowing through these channels
will the R-134a is plumbed back into the factory air conditioning system before the compressor pump.

Prestige Worldwide | The Design and Manufacturing of an Intercooler Assembly with R-143a Integration Conceptual Design
16
FIGURE 8, below, is a diagram depicting a typical automotive air conditioning system. This mechanical
configuration begins with the centrifugal power drawn from the serpentine belt powered from the crankshaft pulley.
After pressurizing the system from the compressor to a higher temp, the R-134a runs though the condenser which is
placed behind the radiator fan in order to cool the fluid temperature. The dryer is next in line in order to catch any
contaminates as well as liquid R-134a in the system. After reaching the dryer, the expansion valve regulates how much
R-134a is allowed through the system. The thermal bulb is what controls the amount of allowance the expansion valve
permits. This is what regulates the phase change.
Figure 8: Standard Engine A/C System Setup

Prestige Worldwide | The Design and Manufacturing of an Intercooler Assembly with R-143a Integration Conceptual Design
17
FIGURE 9, below, is the same as FIGURE 8 with a few additions. Once the phase change occurs, the R-134a
contacts the intercooler surfaces. After this point, the R-134a can be re-routed back to the AC system before the
compressor.
Figure 9: Modified Engine A/C System Setup

Prestige Worldwide | The Design and Manufacturing of an Intercooler Assembly with R-143a Integration Assembly Design
18
7.0 Assembly Design
While determining how to approach the design of the intercooler assembly the first conclusion that was made
was that it needed to be built around the intercooler. Initially, there was an available intercooler for the experiment but
it was decided that this was not a universal part and complications would arise while modeling and during hand
calculations. Once the decision of the intercooler type and size was made, the next step in deciding a viable and
reasonable way to add additional cooling to it was under way. The intercooler chosen was a Center to Center Front
Mount Intercooler. This was the most popular aftermarket intercooler and was much easier to model and evaluate.
Multiple designs were drawn up and evaluated. There were two main designs in consideration, one had copper
tubing being wrapped around the intercooler as if it were threaded between the top and bottom external fins, and the
second had copper tubing on the front face of the intercooler in U shape bends. There were pros and cons to both
designs. The drawback for the first design was that it would be difficult to manufacture and the risk of destroying the
intercooler was high, there was only enough money in the budget for one intercooler. The advantage to this design was
the heat transfer rate would have been significantly higher. The disadvantage to the second design was that the heat
transfer rate is considerably lower to the first one due to the fact that the conduction rate is nowhere near that of the
first design. The benefit of this second design was that the risk of damaging the intercooler was extremely low and the
bending of the copper tubing was substantially easier.
Now that the design was in place the next step was to purchase ¼” diameter copper tubing. The reason for using
copper tubing was because of its high thermal conductivity and malleability. A small hand pipe bender was used to bend
the copper into the U-shape bends. Because of the copper tubing’s small diameter and the tools available the radius of
the bends was much larger than the design called for. Now the task of securing the copper to the intercooler was
accomplished using thin metal wire.
The next step in the assembly was determining a heat source for replicating air intake temperatures in a turbo
charged vehicle. This simplest and most effective source was a generic 1500W hair dryer. The hair dryer exceeded
temperatures of 250°F which is more than sufficient enough for the experiment. Then a fluid needed to be selected that
could be run through the copper tubing. Ice water was an easy choice because its accessibility and thermal properties.
Once water was chosen as a fluid a pump was needed that would create the proper flow rate while allowing for
maximum heat transfer. The pump chosen had a maximum flow rate of 85 GPH @ 0’ elevation and 63 GPH @ 1’
elevation. This proved to be an adequate pump for the application. Clear silicon tubing was used to connect copper
tubing to the water pump and back to the water source.

Prestige Worldwide | The Design and Manufacturing of an Intercooler Assembly with R-143a Integration Experimental Procedure
19
The last piece of equipment needed was a wind source that could create a constant wind velocity and have the
ability to increase or decrease the wind velocity with precision. The only practical solution to this was the wind tunnel in
the Fluids Lab at Wentworth Institute of Technology. The wind tunnel had a variable belt drive controlling the fan and
was controlled with interactive computer software.
With all the pieces in place to conduct a replica of the system that was created the only thing left was to create a
procedure detailing the setup of the intercooler assembly. Within the report is a procedure listing in detail the materials,
equipment, and steps needed to conduct the experiment.
8.0 Experimental Procedure
8.1 Equipment and Materials
1500W Hair dryer
85 GPH Water pump
Anemometer
Barometer
Clear silicon tubing
Conduit with small hole 6” from end
HVAC tape
Ice
Intercooler assembly
Metal wire
Thermal couple
Water
Water bucket
Wind Tunnel

Prestige Worldwide | The Design and Manufacturing of an Intercooler Assembly with R-143a Integration Experimental Procedure
20
8.2 Procedure
1. Properly secure intercooler assembly onto the exhaust side of the wind tunnel using metal wiring to make sure
assembly will not fall off during experiment. Make sure intercooler assembly has ¼” gap between exhaust grille
and copper tubing. Position intercooler assembly so that it is either in the middle of the top half or the middle of
the bottom half of the exhaust grille (the center of the exhaust has a motor powering the fan and little to no air
will blow across the intercooler assembly).
2. Fill water bucket with water and ice to drop down water temperature to 33°F.
3. Place water pump on the bottom of the bucket and attach enough clear silicon tubing to the pump to reach the
inlet side of the copper tubing of the intercooler assembly.
4. Attach enough clear silicon tubing from the outlet side of the copper tubing of the intercooler assembly back to
the water bucket. Make sure you do not create additional head loss by having the return line of the chilled water
higher than the inlet of the copper tubing. This will affect the testing conditions and decrease the flow rate of
the pump.
5. Attach the hair dryer to the inlet side of the intercooler and seal any gaps by wrapping the connection with
HVAC tape until an air tight seal has been created.
6. Attach conduit to outlet side of the intercooler with the small hole closest to the intercooler assembly. Seal any
gaps by wrapping the connection with HVAC tape until and air tight seal has been created.
7. Take the thermal couple and insert it into the small hole in the conduit. Make sure the tip of the thermal couple
is in the center of the conduit. This will allow you to get the most accurate outlet temperature reading.
8. Turn on wind tunnel software and power to the wind tunnel. Power up wind tunnel and use the anemometer to
measure the wind speed and adjust to achieve approximately 15mph. Write down the percentage of power to
the fan associated with the 15mph reading. Turn down the power to the fan to 0%.
9. Take temperature reading of surrounding environment. Write down temperature.
10. Take pressure reading from barometer. Write down pressure.
11. Now that all preparations are in place turn on the hair dryer to “HIGH” and allow the intercooler temperature to
stabilize. This will take approx. 5 minutes. You will know when the temperature has stabilized by reading the
temperature off the thermal couple. The temperature should be approx. 250°F - 260°F.
12. Write down the max temperature that the outlet of the intercooler reaches.
13. Now run the intercooler has stabilized turn on the wind tunnel back to the percentage you determined to be
approx. 15mph.
14. Allow the wind tunnel to run for about 5 minutes while the temperature stabilizes. MUST SURE THE HAIR DRYER
IS STILL RUNNING OR YOU WILL GET INVALID RESULTS.

Prestige Worldwide | The Design and Manufacturing of an Intercooler Assembly with R-143a Integration Experimental Procedure
21
15. Once the temperature has stabilized write down the reading, turn down the wind tunnel to 0 power, and leave
the hair dryer running.
16. Repeat steps 11 – 15 in order to run multiple trials
17. Again allow the intercooler to stabilize in temperature.
18. After it has stabilized turn on power to the pump so that it is running chilled water through the copper tubing
and turn on the wind tunnel to the same percentage of power to achieve the 15mph wind speed.
19. Allow this to run for about 5 minutes while the temperature stabilizes. MUST SURE THE HAIR DRYER IS STILL
RUNNING OR YOU WILL GET INVALID RESULTS.
20. Once the temperature has stabilized write down the reading, turn down the wind tunnel to 0 power, and now
turn off the hair dryer.
21. Repeat steps 17 – 20 in order to run multiple trials.
22. Completely turn off the wind tunnel and log off the system.
23. Disconnect all connections made including the hair dryer, conduit, and clear silicon tubing.
24. Remove the intercooler assembly from the exhaust side of the wind tunnel and finish cleaning up so that
everything is back in its original place.
Prestige Worldwide | The Design and Manufacturing of an Intercooler Assembly with R-143a Integration Results
22
9.0 Results
9.1 Data
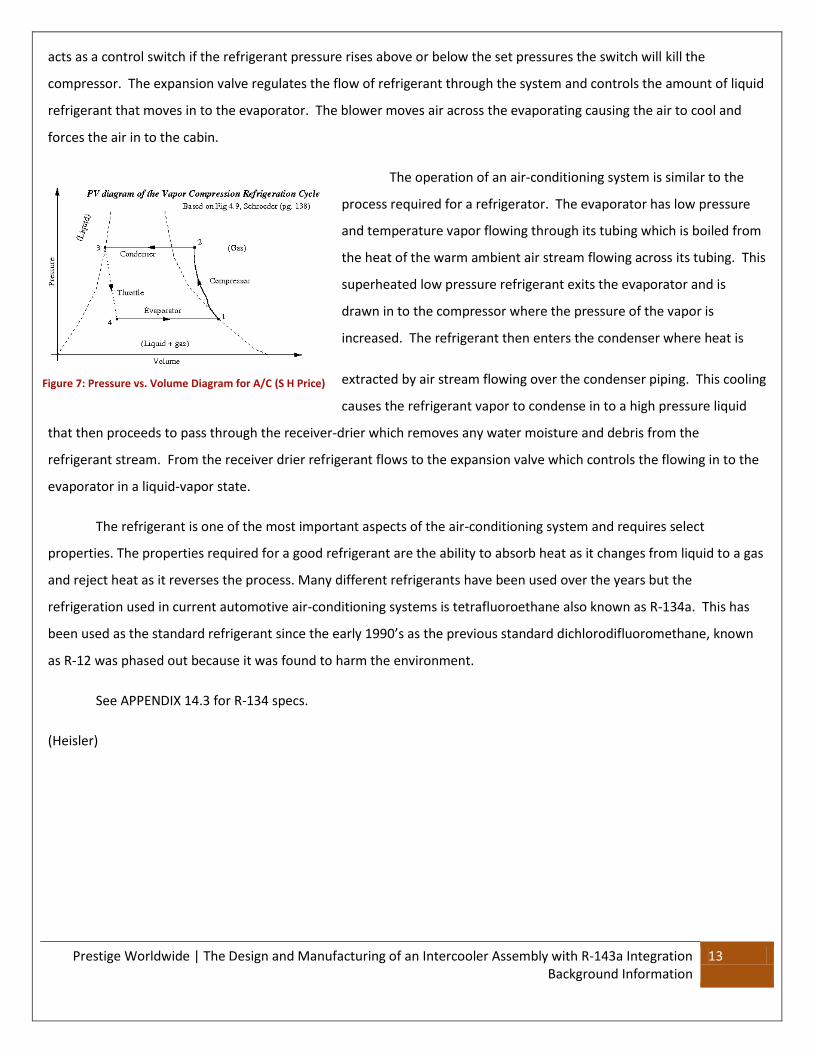
TABLE 1, below, shows the results from the various assembly setups. The exit velocity was measured at the exhaust of
the wind tunnel, which was simulating the wind moving through the intercooler at a certain speed. The exit velocity was
measured at the end of the exhaust pipe with a thermocouple after five minutes of running the experiment. All three
setups have one thing in common, which is the hair dryer blowing hot air through the intercooler. The first set of data
was taken with just the hot air from the hair dryer blowing through the intercooler, which simulates what the
temperatures would be with the car idling. The temperatures achieved here are the starting temperatures for the other
two test setups. The next data set, air and no water, was taken with the wind tunnel air been blown perpendicularly
through the intercooler, which simulates the standard intercooler setup that is available on the market. The last data
set was with both the wind tunnel air and the chilled water, simulating the R-134a. The last data set simulates the R-
134a by means of the chilled water, through the copper tubing, on the intercooler assembly.
Table 1: Testing Results
Variable Wind Speed Exit Temperature Exit Velocity
No air, no water
Trial 1 0 222 °F 7.68 ft/s
Trial 2 0 222 °F 7.74 ft/s
Trial 3 0 221 °F 7.72 ft/s
Air, no water
Trial 1 22 ft/s 136 °F 7.62 ft/s
Trial 2 22 ft/s 135 °F 7.67 ft/s
Trial 3 22 ft/s 137 °F 7.65 ft/s
Air, water
Trial 1 22 ft/s 121 °F 7.62 ft/s
Trial 2 22 ft/s 118 °F 7.66 ft/s
Trial 3 22 ft/s 120 °F 7.69 ft/s
Prestige Worldwide | The Design and Manufacturing of an Intercooler Assembly with R-143a Integration Results
23
9.2 Illustration of setup
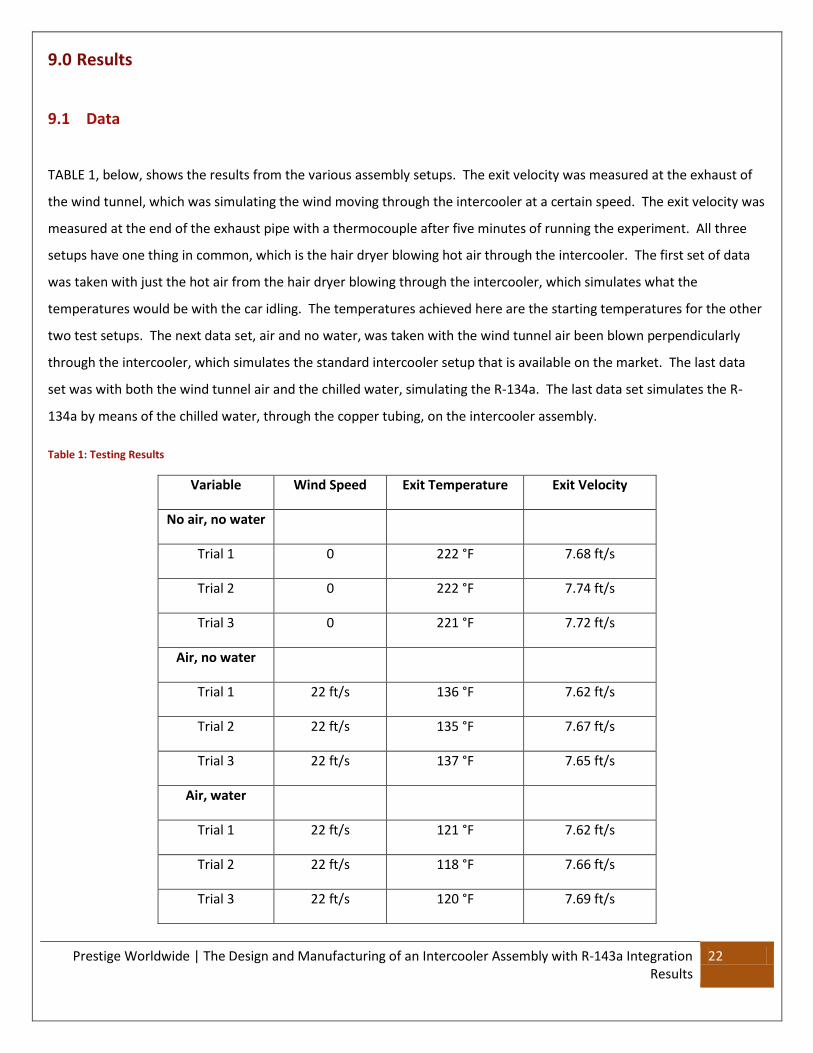
FIGURE 10, shown right, shows the
intercooler with the copper tubing mounted to it.
There are six U-bends going each way, spanning the
length of the intercooler.
FIGURE 11, pictured right, shows the ice bath used to chill the
water. The silicon tubing is attached to the pump, so push the chilled
water out of the bath. The silicon tubing is then attached to the copper
tubing, which spans the intercooler. The outlet of the copper tubing is
then attached to another line of silicon tubing, which allows the water to
return to the ice bath.
Figure 10: Intercooler with Copper Tubing
Figure 11: Ice Bath

Prestige Worldwide | The Design and Manufacturing of an Intercooler Assembly with R-143a Integration Results
24
FIGURE 12, right, shows the ice bath
feeding into the copper tubing. It also shows
the hair dryer attached to the inlet of the
intercooler. The intercooler is attached to the
exhaust side of a wind tunnel. Also, the
beginning to the exhaust tube can be seen,
which is attached to the outlet of the
intercooler.
FIGURE 13, right, shows the outlet side
of the testing setup. The exhaust tube is
attached to the outlet side of the intercooler.
A thermocouple is fed into the tube to
measure the outlet temperatures coming from
the intercooler.
Figure 12: Testing Setup Inlet
Figure 13: Testing Setup Outlet

Prestige Worldwide | The Design and Manufacturing of an Intercooler Assembly with R-143a Integration Results
25
9.4 Graphs/Diagrams
FIGURE 14, below, shows the three different test setups and their corresponding outlet temperatures. The three
trials for each are shown. In each consecutive test, the graph displays a decrease in temperature. The test with no air
and no water is used as the control. The second test is a mock of the setup in real world conditions. The third test
introduces the proposed assembly design in use.
Figure 14: Temperature against various test setups
50
70
90
110
130
150
170
190
210
230
250
No air and no water Air and no water Air and Cold Water
Tem
pe
ratu
re F
Trial 1
Trial 2
Trial 3

Prestige Worldwide | The Design and Manufacturing of an Intercooler Assembly with R-143a Integration Results
26
9.5 Sample Calculations
The decrease in air temperature is attributed to the constructed assembly and the heat transfer that
corresponds. The following calculations process through a series of steps that is necessary in order to manually calculate
the actual heat transfer through the addition of the copper tubing with flowing water.
1) To properly calculate actual heat transfer, an analysis of flow through the copper tubing was necessary. Using
pump specifications, a velocity was calculated to determine flow velocity through the system. This includes flow
through the silicon tubing, as well as copper. It is done in two parts. (Mott)
a. Theoretical values based on pump specifications with no head loss and 100% efficiency
Pump Specifications:
Silicon Tube:
Copper Tubing:
To convert the pump flow rate (Q) from
to
:
Prestige Worldwide | The Design and Manufacturing of an Intercooler Assembly with R-143a Integration Results
27
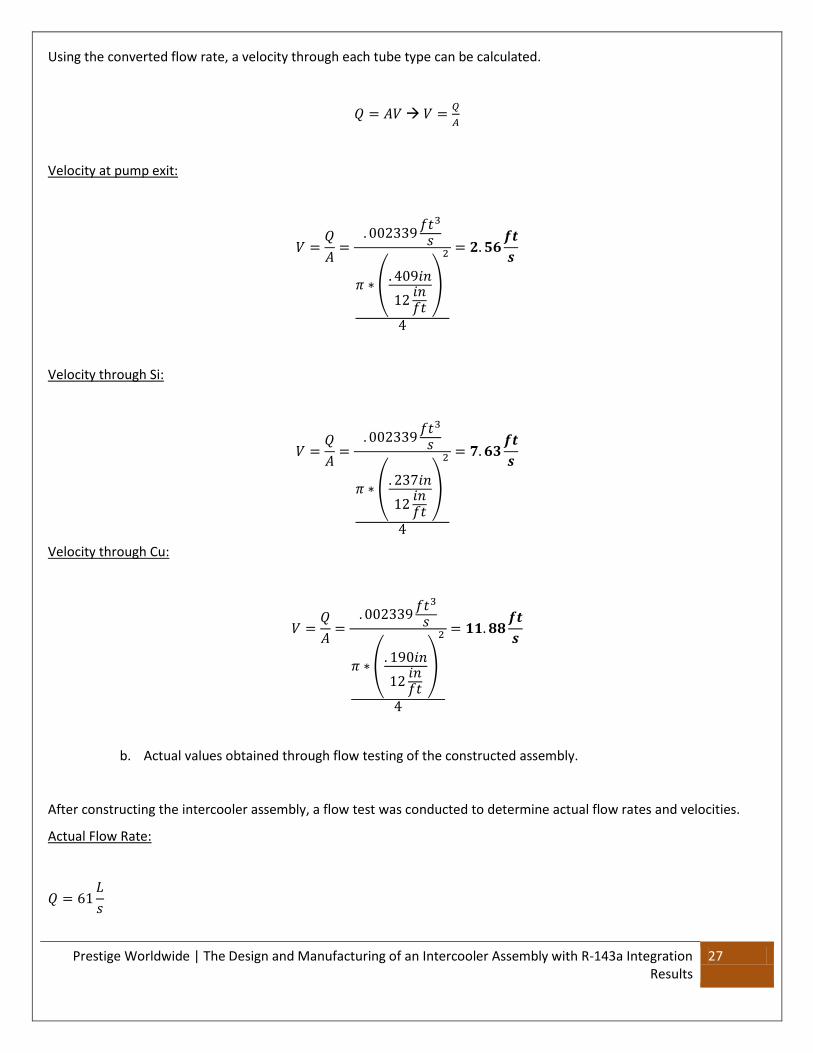
Using the converted flow rate, a velocity through each tube type can be calculated.
Velocity at pump exit:
(
)
Velocity through Si:
(
)
Velocity through Cu:
(
)
b. Actual values obtained through flow testing of the constructed assembly.
After constructing the intercooler assembly, a flow test was conducted to determine actual flow rates and velocities.
Actual Flow Rate:

Prestige Worldwide | The Design and Manufacturing of an Intercooler Assembly with R-143a Integration Results
28
To calculate actual velocities, a conversion to
is necessary.
With the flow rate, actual velocities were determined.
Velocity at pump exit:
(
)
Velocity through Si:
(
)
Velocity through Cu:
(
)
The difference in velocities can be attributed to a significant head loss which was calculated utilizing Bernoulli’s
equation. (Mott)

Prestige Worldwide | The Design and Manufacturing of an Intercooler Assembly with R-143a Integration Results
29
Assumptions:
Therefore can be determined by the following relation,
Since the piezometric head ( ) by the pump was not given, it had to be calculated by the following equation,
(
)
(
)
Substituted into the equation above, becomes
Finally, substituting these values into the above equation for head loss ( ),
( )
( )
(
)
( )

Prestige Worldwide | The Design and Manufacturing of an Intercooler Assembly with R-143a Integration Results
30
2) Once the correct internal flow velocity and temperatures were established, the desired heat transfer analysis
could be done. The following series of calculations display the process in determining the actual heat transfer
rate by conducting an analysis of internal forced convection within the copper tubing. (Cengel)
First, all known conditions and variables were established.
Copper Tube:
( )
Assume isothermal conditions and neglect thermal resistance
O.D.
Vin I.D.
L
Flow and temperature parameters:
Since the fluid exit temperature was not a known variable, an assumption was made to determine the bulk mean
temperature ( ) and its properties were used through the process in determining the heat transfer rate.

Prestige Worldwide | The Design and Manufacturing of an Intercooler Assembly with R-143a Integration Results
31
Using the calculated value, temperature properties were acquired.
Temperature 33.5°F
(
) 62.41
(
) 0.324
13.5
(
) 1.929E-05
(
) 1.01
(
) 1.204E-03
Next, to determine flow type, Reynold’s number (Re) was calculated.
( )
With a turbulent flow and non-smooth pipe, the following relation was used to determine Nusselt’s number (Nu) and
ultimately the convection heat transfer coefficient (h).
[( ) ( ) ]
* ( )
( )+
Being a non-smooth pipe, friction factor (f) is taken into account and had to be calculated prior to solving for Nusselt’s
number. This variable is represented as,
(
( )
)
Giving us,
(
( )
)
(
(
)
)
Prestige Worldwide | The Design and Manufacturing of an Intercooler Assembly with R-143a Integration Results
32
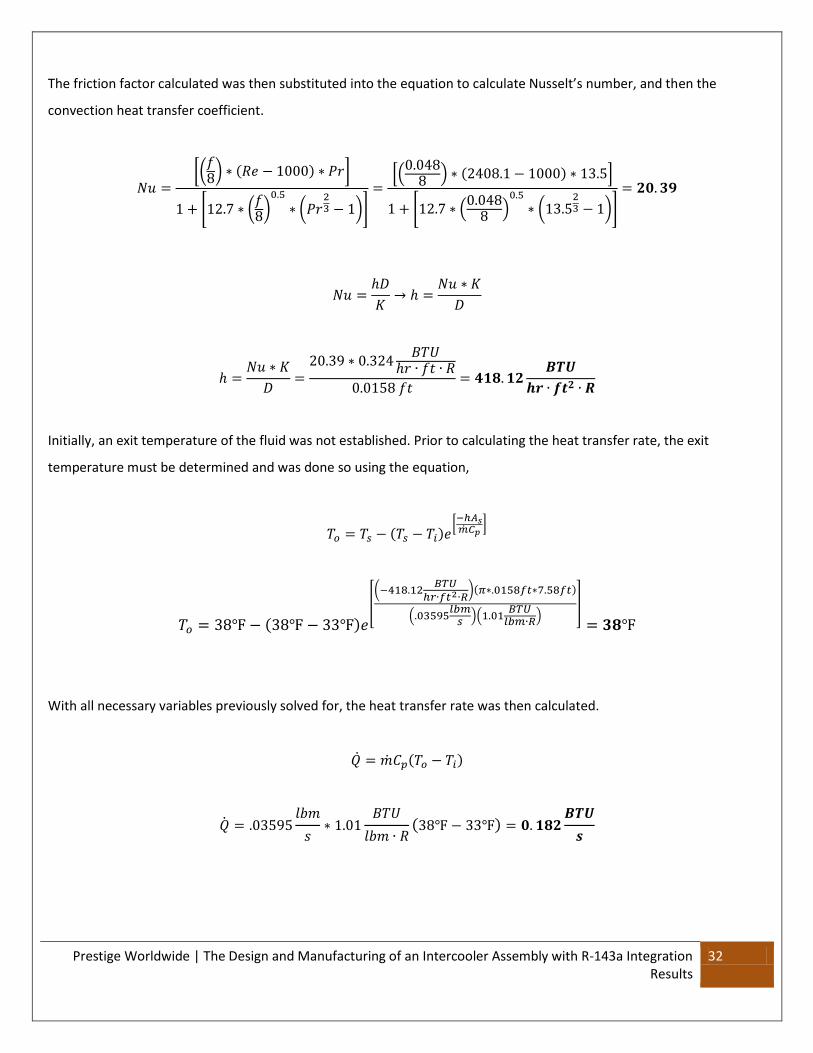
The friction factor calculated was then substituted into the equation to calculate Nusselt’s number, and then the
convection heat transfer coefficient.
[(
) ( ) ]
* ( )
( )+
*(
) ( ) +
* (
)
( )+
Initially, an exit temperature of the fluid was not established. Prior to calculating the heat transfer rate, the exit
temperature must be determined and was done so using the equation,
( ) [
]
( )
[(
)( )
(
)(
)
]
With all necessary variables previously solved for, the heat transfer rate was then calculated.
( )
( )

Prestige Worldwide | The Design and Manufacturing of an Intercooler Assembly with R-143a Integration Results
33
9.6 Simulation
Through numerous attempts and countless hours the goal of running a Flow Simulation was unsuccessful. The
issue with SolidWorks Flow Simulation is that it requires a fast processor and a substantially large amount of free RAM in
the computer system. Unfortunately with the resources available to the students at Wentworth Institute of Technology
there are currently no computer systems that have the necessary specifications to run this intensive simulation with
such a dense model. There are measurements being taken now to bring these necessary resources to the students who
truly and desperately need them. The screen shot below depicts some of the limitations that were encountered; this
was the most that could be accomplished. The print screen is the modeled intercooler with a significantly less amount of
external fins and an external flow with little to no internal flow due to the coarsest mesh in the computational domain.
Hopefully in the future this problem will not be an issue and the university will have more powerful systems available to
the students.
Figure 15: SolidWorks Simulation

Prestige Worldwide | The Design and Manufacturing of an Intercooler Assembly with R-143a Integration Results
34
9.7 Discussion of Results
After analyzing the data and determining the difference in intercooler’s outlet fluid temperature through testing,
the addition of heat transfer from the integrated copper tubing proves to be acceptable. From TABLE 1 the data
represented displays a trend of decreasing outlet temperature. In Trial 1, there was no addition of any external
convection or copper tubing to contribute to any temperature decrease, which explains the equilibrium state at a
temperature averaging 222°F. With the variable external convection simulating speeds in real world conditions in Trial 2,
there was about a 39% decrease in temperature, bringing the average to 136°F. The third trial includes the copper
tubing in addition to external convection, decreasing the outlet temperature by another 7% to 120°F. Though the
difference in Trial 3 is not as significant as Trial 2, this can be attributed to design issues through the intercooler system.
In various locations there was no contact inducing heat transfer due to limitations and resources to perfect the tubing
construction during the assembly process. Design reconsiderations were taken into account for this purpose to influence
a more significant heat transfer such as close packed U-bends and an internally integrated tubing but became
impractical due to time and resource limitations.
Calculations based upon actual results were utilized to validate observations and proved to be successful. After
determining flow rates through the copper tubing, the actual heat transfer rate calculated was
. This rate in
addition with externally induced air at ambient temperature attributed to a 46% decrease in air temperature from Trial
1. This parallels much of the data extracted during testing and assisted in determining final results. At the end of the
flow cycle where water exited the silicon tubing and flowed into the ice bucket, a temperature measurement of 38°F
was measured. This same temperature was calculated as the outlet temperature through the heat transfer analysis.
The data recorded corresponds to the expected results with a reduction in intercooler outlet temperature which
is verified through testing and calculations. Through optimization of the assembly, this could be reduced and becomes a
feasible concept design.

Prestige Worldwide | The Design and Manufacturing of an Intercooler Assembly with R-143a Integration Final Budget
35
10.0 Final Budget
Below is the final budget that was needed to accomplish the objectives of this experiment. Not listed in the budget
are the costs of the materials that were already available and did not have to be bought.
Table 2: Final Budget
Material Cost
Intercooler $80
Copper Tubing, 50 feet $50
Vinyl Tubing $10
Water Pump $48
Air Duct Fan $27
HVAC Foil $20
Misc. $120
TOTAL $335
11.0 Recommendation for Future Work
Further research should be conducted by taking more extensive data to compare to the current literature available.
More data would help to make clearer the separate correlations between the different intercooler assembly setups. In
addition, with the use of more advanced technology, a better data analysis could be established with verifying the
results.

Prestige Worldwide | The Design and Manufacturing of an Intercooler Assembly with R-143a Integration Conclusions
36
12.0 Conclusions
After conducting the multiple tests during the experiment, the data has shown that this method of cooling down
the air from the turbo charger to the intercooler will work. Through these experiments the data showed a 6% decrease
in temperature when compared to the normal operating conditions. While R-134a was not used in the experiment
chilled water was used at a temperature that is close to the normal operating conditions of R-134a in a car’s air A/C
system. The ice water used in the experiment was 33°F and the normal operating conditions of R-134a is 34°F,
depending on the pressure.
While there are benefits to this proposed system addition this will cause some addition stress on the A/C
compressor. The A/C compressors installed on modern cars today are sized to fit the need of the evaporator. More
research will need to be done in order to see if the added stress would significantly reduce the lifespan of the
components in the system. Although the results support the initial proposed idea that power can be increased by
lowering the intake air temperature via this cooling method, the drawback to this is that the compressor clutch would
need to be engaged much more frequently resulting in the power loss that it requires to run the compressor. The
amount of horsepower drawn from the engine required to run the A/C compressor pump by the serpentine belt negates
any gains that would be achieved by the minimal temperature decrease as seen in testing. More testing is necessary in
order to discover if routing the R-134a through a custom intercooler, instead of in front of the intercooler would
produce higher gains due to better heat transfer by conduction.
Although this theoretical configuration does not seem feasible as a power adder alone, the possibility of it being
integrated to increase horsepower-to-gas consumption efficiency is much more likely. The intake air temperature is
additionally cooled while flowing through the intercooler and it does not take any additional power from the vehicle to
do so. While driving with the A/C on, the compressor draws the same amount of horsepower no matter if it is routed
through two thermostatic valves or one. The same rate of R-134a ( ) is being pushed/pulled through the pump, yet the
only likely difference is that the A/C clutch will engage/disengage more frequently in order to keep the R-134a at the
constant low temperature. This system will help regain some of the power lost in operating the A/C compressor. Instead
of losing roughly 5 horsepower by running the standalone A/C, only roughly 3 horsepower will be lost due to the
resulting colder intake air temperature.
Overall the goal to decrease the intercooler outlet air temperature was successful. While the addition of a few
horsepower is a great addition the main benefit from this system is the increase in efficiency from the decreased air
temperature. Like it has already been stated, more research is needed to be conducted in order to see if this setup is
feasible.

Prestige Worldwide | The Design and Manufacturing of an Intercooler Assembly with R-143a Integration Works Cited
37
13.0 Works Cited
Cengel, Yunus A. Introduction to Thermodynamics and Heat Transfer Second Edition. New York: The McGraw-Hill
Companies, Inc., 2008.
Faulkner, L.L. Applied Combustion, Second Edition. Columbus, Ohio: Taylor & Francais Group, 2007.
Hansen Technologies Corporation. ZEIT4504_Refrigerants. n.d. 28 04 2011
<http://seit.unsw.adfa.edu.au/coursework/ZEIT4504/HVAC/ZEIT4504_Refrigerants.pdf>.
Heisler, Heinz. Vehicle and Engine Technology. London, England: Hodder Headline Group, 1999.
Honeywell. Turbo by Garrett. 2010. 28 04 2011 <http://www.turbobygarrett.com/turbobygarrett/>.
Logan, Earl Jr. Handbook of Turbomachinery, Second Edition. New York: Marcel Dekker, 2003.
Mott, Robert L. Applied Fluid Mechanics. Upper Saddle River, NJ: Pearson Education, Inc, 2006.
National Academy of Engineering. Air Conditioning and Refrigeration Timeline. 2011. 28 04 2011
<http://www.greatachievements.org/?id=3854>.
National Automobile Dealers Association. NADA Frontpage. 2010. 28 04 2011
<http://www.nadafrontpage.com/index.xml>.
S H Price. Vapor-Compression Refrigeration. 26 03 2007. 28 04 2011 <http://ffden-
2.phys.uaf.edu/212_spring2007.web.dir/sedona_price/phys_212_webproj_refrigerators.html>.
United States Department of Transportation - Federal Highway Administration. Policy Information. 2009. 28 04 2011
<http://www.fhwa.dot.gov/policyinformation/statistics/2009/dv1c.cfm>.
United States Department of Transportation. Summary of Fuel Economy Performance. 28 October 2010. 28 04 2011
<http://www.nhtsa.gov/staticfiles/rulemaking/pdf/cafe/Oct2010_Summary_Report.pdf>.

Prestige Worldwide | The Design and Manufacturing of an Intercooler Assembly with R-143a Integration Appendix
38
14.0 Appendix
Prestige Worldwide | The Design and Manufacturing of an Intercooler Assembly with R-143a Integration Appendix
39
14.1 Materials
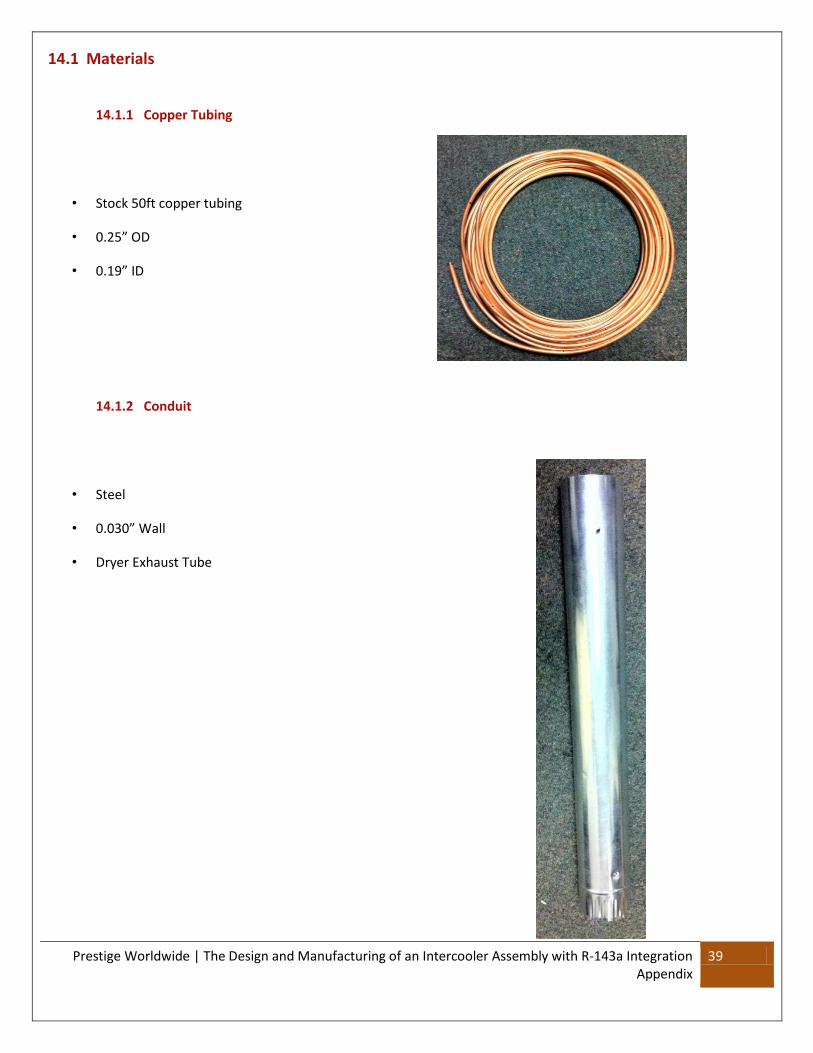
14.1.1 Copper Tubing
• Stock 50ft copper tubing
• 0.25” OD
• 0.19” ID
14.1.2 Conduit
• Steel
• 0.030” Wall
• Dryer Exhaust Tube

Prestige Worldwide | The Design and Manufacturing of an Intercooler Assembly with R-143a Integration Appendix
40
14.1.3 Water Pump
• Johnson Aqua Jet Pump
• 5 Watt power rating
• Max flow rate:
85 GPH @ 0’ elevation
• Max flow rate:
63 GPH @ 1’ elevation
14.1.4 Hair Dryer
• 1500W
• Exit Temp: 257 °F
• Exit Velocity: 17.22ft/s

Prestige Worldwide | The Design and Manufacturing of an Intercooler Assembly with R-143a Integration Appendix
41
14.1.5 Intercooler
• Universal FMIC Intercooler
• 28” Length
• 6.1” Height
• 2.6” Width
• 2.25” Intake/Outlet diameter
Prestige Worldwide | The Design and Manufacturing of an Intercooler Assembly with R-143a Integration Appendix
42
14.2 Diagrams
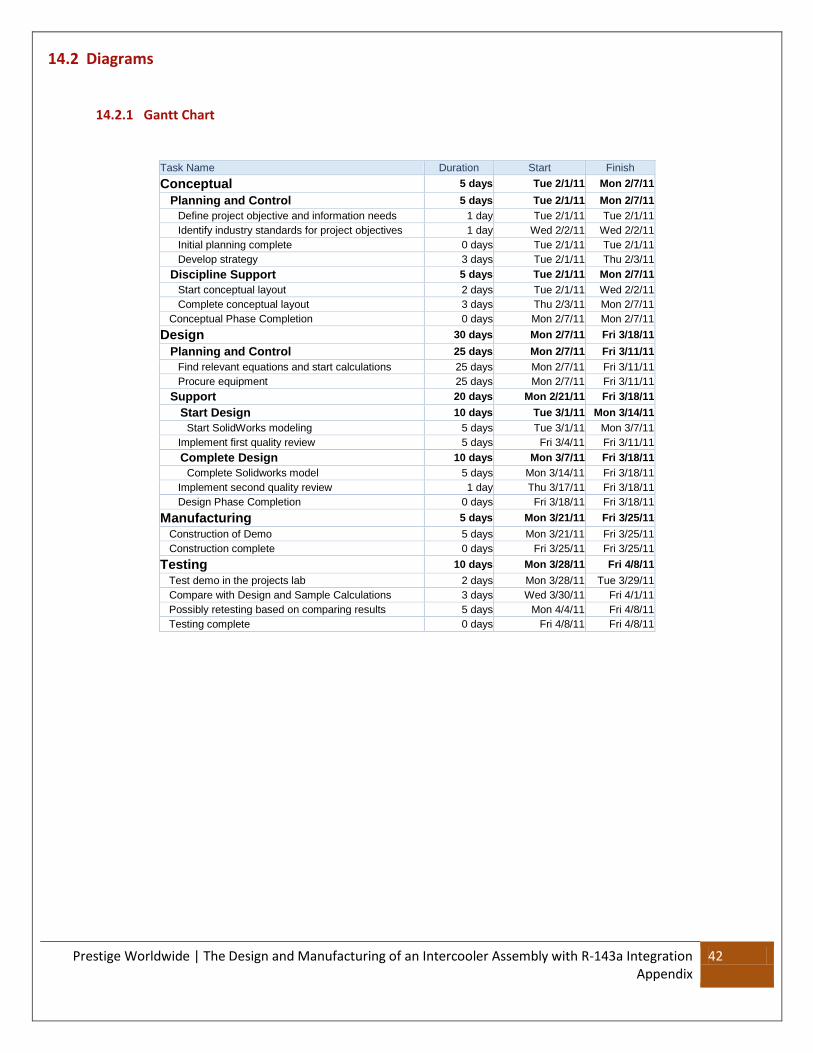
14.2.1 Gantt Chart
Task Name Duration Start Finish
Conceptual 5 days Tue 2/1/11 Mon 2/7/11
Planning and Control 5 days Tue 2/1/11 Mon 2/7/11
Define project objective and information needs 1 day Tue 2/1/11 Tue 2/1/11
Identify industry standards for project objectives 1 day Wed 2/2/11 Wed 2/2/11
Initial planning complete 0 days Tue 2/1/11 Tue 2/1/11
Develop strategy 3 days Tue 2/1/11 Thu 2/3/11
Discipline Support 5 days Tue 2/1/11 Mon 2/7/11
Start conceptual layout 2 days Tue 2/1/11 Wed 2/2/11
Complete conceptual layout 3 days Thu 2/3/11 Mon 2/7/11
Conceptual Phase Completion 0 days Mon 2/7/11 Mon 2/7/11
Design 30 days Mon 2/7/11 Fri 3/18/11
Planning and Control 25 days Mon 2/7/11 Fri 3/11/11
Find relevant equations and start calculations 25 days Mon 2/7/11 Fri 3/11/11
Procure equipment 25 days Mon 2/7/11 Fri 3/11/11
Support 20 days Mon 2/21/11 Fri 3/18/11
Start Design 10 days Tue 3/1/11 Mon 3/14/11
Start SolidWorks modeling 5 days Tue 3/1/11 Mon 3/7/11
Implement first quality review 5 days Fri 3/4/11 Fri 3/11/11
Complete Design 10 days Mon 3/7/11 Fri 3/18/11
Complete Solidworks model 5 days Mon 3/14/11 Fri 3/18/11
Implement second quality review 1 day Thu 3/17/11 Fri 3/18/11
Design Phase Completion 0 days Fri 3/18/11 Fri 3/18/11
Manufacturing 5 days Mon 3/21/11 Fri 3/25/11
Construction of Demo 5 days Mon 3/21/11 Fri 3/25/11
Construction complete 0 days Fri 3/25/11 Fri 3/25/11
Testing 10 days Mon 3/28/11 Fri 4/8/11
Test demo in the projects lab 2 days Mon 3/28/11 Tue 3/29/11
Compare with Design and Sample Calculations 3 days Wed 3/30/11 Fri 4/1/11
Possibly retesting based on comparing results 5 days Mon 4/4/11 Fri 4/8/11
Testing complete 0 days Fri 4/8/11 Fri 4/8/11

Prestige Worldwide | The Design and Manufacturing of an Intercooler Assembly with R-143a Integration Appendix
43

Prestige Worldwide | The Design and Manufacturing of an Intercooler Assembly with R-143a Integration Appendix
44
14.3 R-134a Properties
(Hansen Technologies Corporation)


![CSC 143A 1 CSC 143 Introduction to C++ [Appendix A]](https://static.fdocuments.in/doc/165x107/5a4d1ad07f8b9ab059971035/csc-143a-1-csc-143-introduction-to-c-appendix-a.jpg)

