The Dependence of Improvements in Health, Longevity and Productivity on Incentives for Medical...
47
The Dependence of Improvements in Health, Longevity and Productivity on Incentives for Medical Innovation Frank R. Lichtenberg Columbia University [email protected] u
-
Upload
delilah-lloyd -
Category
Documents
-
view
220 -
download
0
Transcript of The Dependence of Improvements in Health, Longevity and Productivity on Incentives for Medical...

The Dependence of Improvements in Health, Longevity and Productivity on
Incentives for Medical Innovation
Frank R. LichtenbergColumbia University
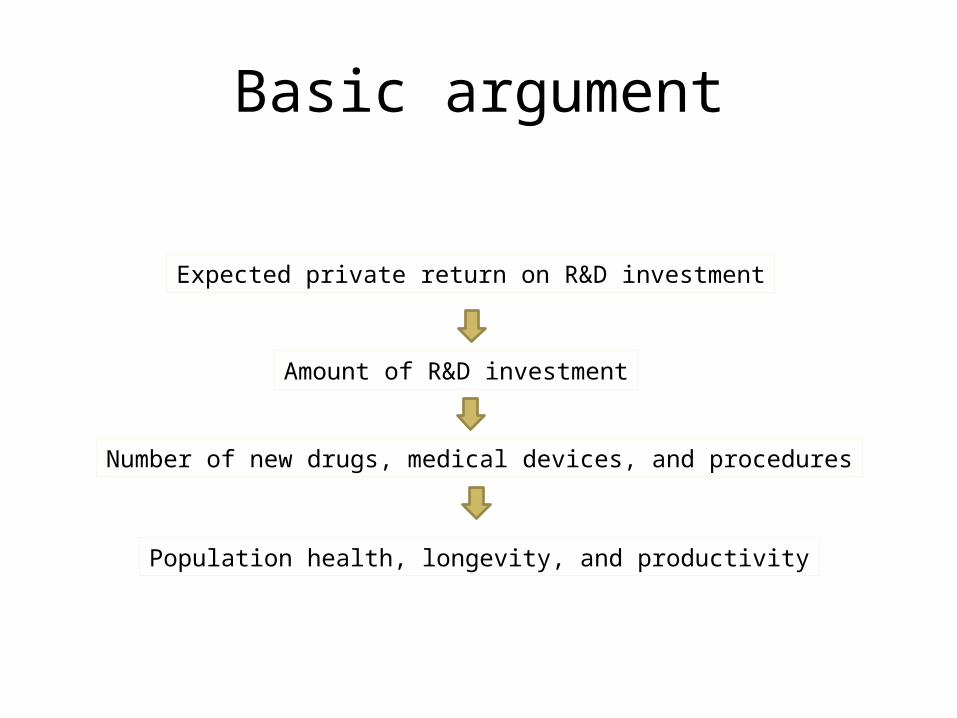
Basic argument
Expected private return on R&D investment
Amount of R&D investment
Number of new drugs, medical devices, and procedures
Population health, longevity, and productivity

Two illustrations
• Orphan drugs• Cancer drugs

DOES MISERY LOVE COMPANY?EVIDENCE FROM PHARMACEUTICAL
MARKETS BEFORE AND AFTERTHE ORPHAN DRUG ACT
Frank R. LichtenbergJoel Waldfogel
15 Mich. Telecomm. Tech. L. Rev. __ (2009), available athttp://www.mttlr.org/volfifteen/lichtenberg&waldfogel.pdf

1983 Orphan Drug ActProvided incentives to develop drugs for rare conditions (affecting <200,000 Americans)
• Higher Returns– 7 years of market exclusivity
• Lower Costs– Tax credit for research expense– Research grants

PolicyDrug
developmentDrug
utilizationHealth
outcomes
6

Rare
diseasesCommon diseases Rare - Common
Before ODA (1980) A B After ODA (1995) C D After - Before C - A D - B (C - A) - (D - B)
Difference-in differences research design
7

Cumulative number of drugs approved, as % of cumulative number of drugs approved in 1979:
orphan vs. other drugs
8

Examine three types of data
• Physician survey (pre & post ODA)• Household survey (post ODA only)• Mortality census (pre & post ODA)
9

Physician survey
• National Ambulatory Medical Care Survey (NAMCS), 1980-81 and 1997-98
• Representative samples of visits to physicians• Two facts recorded about each visit:
– Physician’s diagnosis (or diagnoses)– Whether physician ordered any medication
10

Physician survey• Aggregate data by diagnosis, i.e., compute:
– Total number of physician visits in which a diagnosis is recorded
– Rx visits as % of total visits in which a diagnosis is recorded
• Interpret total number of physician visits in which a diagnosis is recorded as a measure of market size
• Physicians are best qualified to determine diagnosis
11

Physician Survey Summary Statistics
12
Period 1980-1981 1997-1998Number of diseases 2454 1996Total no. of physician visits 627,701,627 981,751,220Mean no. of physician visits 255,787 491,859Minimum no. of physician visits 1,031 1,921Maximum no. of physician visits 44,162,054 54,396,942Rx visits/total visits 0.73 0.74

Hypothesis
13
Rx prob.
Market size
Pre ODA
Post ODA

14

Hypothesis
15
Rx prob.
Initial market size

16

Mortality Census
• Vital Statistics—Mortality Detail files, 1980 and 1995
• Complete census of U.S. deaths (approx. 2 million per year)
• Two facts recorded about each death:– Cause of death– Age at death
• We exclude infant deaths (age < 1)
17

Market size and longevity
• Aggregate data to most detailed published disease classification: CDC’s 282 causes of death classification
• For each of these 282 causes of death, compute– Number of deaths– Mean age at death
• Group these 282 diseases into 5 quintiles, ranked by number of deaths
18

Hypothesis
19
Mean age at death
Market size (no. of deaths)
Pre ODA
Post ODA

Hypothesis
20
Mean age at death
Initial market size (no. of deaths)

Disease Prevalence and Mean Age at Death
21
Prevalence quintile
No. of deaths
Mean age
No. of deaths
Mean age
Mean age t-statistic p-value
Lowest 1,586 49.4 1,839 56.9 7.6 14.6 <.00012 18,537 58.3 18,189 65.2 6.93 56,233 65.9 62,951 67.8 1.94 169,345 68.6 215,638 71 2.3
Highest 1,541,562 72.6 1,836,369 74.4 1.8 106.4 <.0001
Highest - lowest 23.2 17.4 -5.8 11.2 <.0001
1980 1995 1995 - 1980

Disease Prevalence and Mean Age at Death, 1980 & 1995
22
1995
1980

Disease Prevalence and Increase in Mean Age at Death, 1980-95
23

Discussion of Results
• ODA worked, softened “misery loves company” effect– Good policy? Does the rationale extend to other contexts?
• Market size results show that incentives matter for drug development
• With high FC markets deliver more products (and satisfaction) to larger groups– Markets vs. collective choice
24

Cancer drugs

Basic argument
Expected private return on R&D investment
Amount of R&D investment• Number of scientific articles published
Number of new drugs, medical devices, and procedures• Number of distinct chemotherapy regimens
Population health, longevity, and productivity
Market size(no. of cancer cases)
27
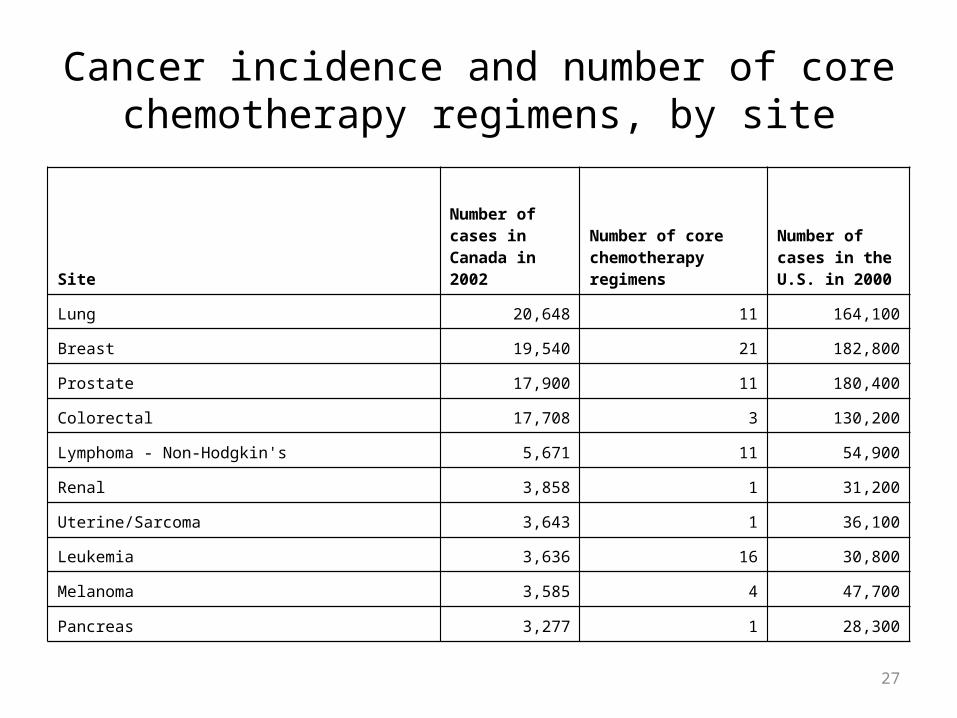
Cancer incidence and number of core chemotherapy regimens, by site
Site
Number of cases in Canada in 2002
Number of core chemotherapy regimens
Number of cases in the U.S. in 2000
Lung 20,648 11 164,100
Breast 19,540 21 182,800
Prostate 17,900 11 180,400
Colorectal 17,708 3 130,200
Lymphoma - Non-Hodgkin's 5,671 11 54,900
Renal 3,858 1 31,200
Uterine/Sarcoma 3,643 1 36,100
Leukemia 3,636 16 30,800
Melanoma 3,585 4 47,700
Pancreas 3,277 1 28,300

28
The relationship between incidence and innovation
0
0.5
1
1.5
2
2.5
3
3.5
6 7 8 9 10 11
log no. of cases in Canada in 2002
log
no
. o
f ch
emo
. re
gim
ens

29
Incidence in 2002, by region, and number of MEDLINE article citations,
for 25 cancer sites as defined in GLOBOCAN
Cancer site ICD10 codes
total number of MEDLINE articles pertaining to cancer site
number of MEDLINE articles pertaining to drug therapy for cancer site
incidence of cancer at site in the less developed region
incidence of cancer at site in the more developed region
Leukaemia C91-C95 138,971 30,529 175,898 124,202
Lung C33-C34 98,796 14,341 672,221 676,681
Non-Hodgkin lymphoma C82-C85,C96 52,485 9,064 149,191 151,096
Colon and rectum C18-C21 80,738 8,744 355,701 665,731
Ovary etc. C56,C57.0-4 38,142 7,636 107,541 96,769
Brain, nervous system C70-C72 106,896 7,435 114,630 74,549
Prostate C61 44,355 7,015 165,347 513,464
Liver C22 77,313 6,464 513,060 110,404
Melanoma of skin C43 46,321 5,039 29,352 130,815
Hodgkin lymphoma C81 22,973 4,628 34,264 28,033

30
Estimates of the relationship between cancer incidence and the number of drug and non-drug MEDLINE citations
Model 1 2 3 4
dep. Var. ln DRUG_CITESi ln NONDRUG_CITESi ln DRUG_CITESi ln NONDRUG_CITESi
ln INC_WORLDi 0.597 0.598
std. err. 0.210 0.138
t-stat 2.850 4.330
p-value 0.009 0.000
ln INC_MOREi 0.670 0.433
std. err. 0.209 0.145
t-stat 3.200 3.000
p-value 0.004 0.007
ln INC_LESSi -0.065 0.167
std. err. 0.222 0.154
t-stat -0.290 1.090
p-value 0.774 0.289

31
• Both analyses indicate that the amount of pharmaceutical innovation increases with disease incidence. – The elasticity of the number of chemotherapy regimens
with respect to the number of cases is 0.53. – The elasticity of MEDLINE drug cites with respect to cancer
incidence throughout the world is 0.60.
• In the long run, a 10% decline in drug prices would therefore be likely to cause at least a 5-6% decline in pharmaceutical innovation.

32
Comparison with previous studies
• Acemoglu and Linn (2003) investigated the response of entry of new drugs and pharmaceutical innovation to changes in potential market size of users, driven by U.S. (or OECD) demographic changes. Their results indicated that a 1 percent increase in the potential market size for a drug category leads to approximately 4-6 percent growth in the entry of new drugs approved by the FDA. However their estimated response reflected the entry of both generics and non-generics, and the effect on generics was larger and somewhat more robust.
• Giaccotto, Santerre and Vernon (2005) employed time series econometric techniques to explain R&D growth rates using industry-level data from 1952 to 2001. Their estimate of the elasticity of pharmaceutical industry R&D with respect to the real price of pharmaceuticals was 0.583.
• Abbott and Vernon (2005): the elasticity of innovation with respect to price is in the 0.67-1.33 range.

33
Physicians and other health care providers are also responsive to financial incentives
• Empirical evidence indicates that the supply behavior of physicians and other health care providers, not just drug companies, is affected by exogenous changes in financial incentives (including changes in reimbursement).
• Some of the best evidence about the physician supply response to variation in reimbursement comes from the Medicaid program.

34
Doctors Objecting to Planned Cut in Medicare Fees
NY Times, November 20, 2005
Dr. Duane M. Cady, chairman of the American Medical Association, said: "Physicians cannot absorb the pending draconian cuts. A recent A.M.A. survey indicates that if the cuts begin on Jan. 1, more than one-third of physicians would decrease the number of new Medicare patients they accept."

The effect of new cancer drug approvals on thelife expectancy of American cancer patients, 1978-2004
Frank R. Lichtenberg
Columbia Universityand
National Bureau of Economic Research

36
Age-adjusted mortality rates,1950-2006
1950 1960 1970 1980 1990 20000
100
200
300
400
500
600
700Diseases of heart
Cerebrovascular diseases
Malignant neoplasms
Source: Health, United States, 2009, Table 26

37
• Bailar and Gornik (1997): “The effect of new treatments for cancer on mortality has been largely disappointing.”Bailar JC 3rd, Gornik HL (1997). “Cancer undefeated,” N Engl J Med. 336 (22), 1569-74, May 29, http://content.nejm.org/cgi/content/full/336/22/1569
• Black and Welch (1993): “The increasing use of sophisticated diagnostic imaging promotes a cycle of increasing intervention that often confers little or no benefit.”Black, William C., and H. Gilbert Welch (1993), “Advances in Diagnostic Imaging and Overestimations of Disease Prevalence and the Benefits of Therapy,” N Engl J Med. 328 (17), 1237-1243, April 29.
• Welch, H. Gilbert, Lisa M. Schwartz, and Steven Woloshin (2000), “Are Increasing 5-Year Survival Rates Evidence of Success Against Cancer?,” JAMA 283(22): 2975-2978

Objective• Attempt to determine the extent to which
new cancer drugs introduced during the last 40 years have prolonged the lives of Americans diagnosed with cancer.
Methodology• A reliable estimate of the overall effect of new
cancer drugs on the longevity of cancer patients can’t be obtained by simply surveying previous clinical studies of specific drugs and cancer sites.
38

FDA approval years of chemotherapy agents with approved uses for 3 cancer sites
151 Malignant neoplasm of stomach
LEUCOVORIN CALCIUM 1952
METHOTREXATE SODIUM 1953
FLUOROURACIL 1962
DOXORUBICIN HYDROCHLORIDE
1974
CISPLATIN 1978
MITOMYCIN 1981
ETOPOSIDE 1983
DOCETAXEL 1996
EPIRUBICIN HYDROCHLORIDE
1999
174 Malignant neoplasm of female breast
METHOTREXATE SODIUM 1953
CYCLOPHOSPHAMIDE 1959
FLUOROURACIL 1962
DOXORUBICIN HYDROCHLORIDE
1974
CARBOPLATIN 1989
PACLITAXEL 1992
VINORELBINE TARTRATE 1994
DOCETAXEL 1996
GEMCITABINE HYDROCHLORIDE
1996
CAPECITABINE 1998
TRASTUZUMAB 1998
EPIRUBICIN HYDROCHLORIDE
1999
188 Malignant neoplasm of bladder
METHOTREXATE SODIUM 1953
CYCLOPHOSPHAMIDE 1959
VINBLASTINE SULFATE 1965
DOXORUBICIN HYDROCHLORIDE
1974
CISPLATIN 1978
GEMCITABINE HYDROCHLORIDE
1996
39
Sources: NCI Thesaurus; Drugs@FDA database

Cumulative number of chemotherapy agents approved by the FDA with accepted uses for six types of cancer, 1975-2005
3
5
7
9
11
13
151 Malignant neoplasm of stomach
162 Malignant neoplasm of trachea, bronchus, and lung
170 Malignant neoplasm of bone and articular cartilage
174 Malignant neoplasm of female breast
188 Malignant neoplasm of bladder
189 Malignant neoplasm of kidney and other andunspecified urinary organs
40
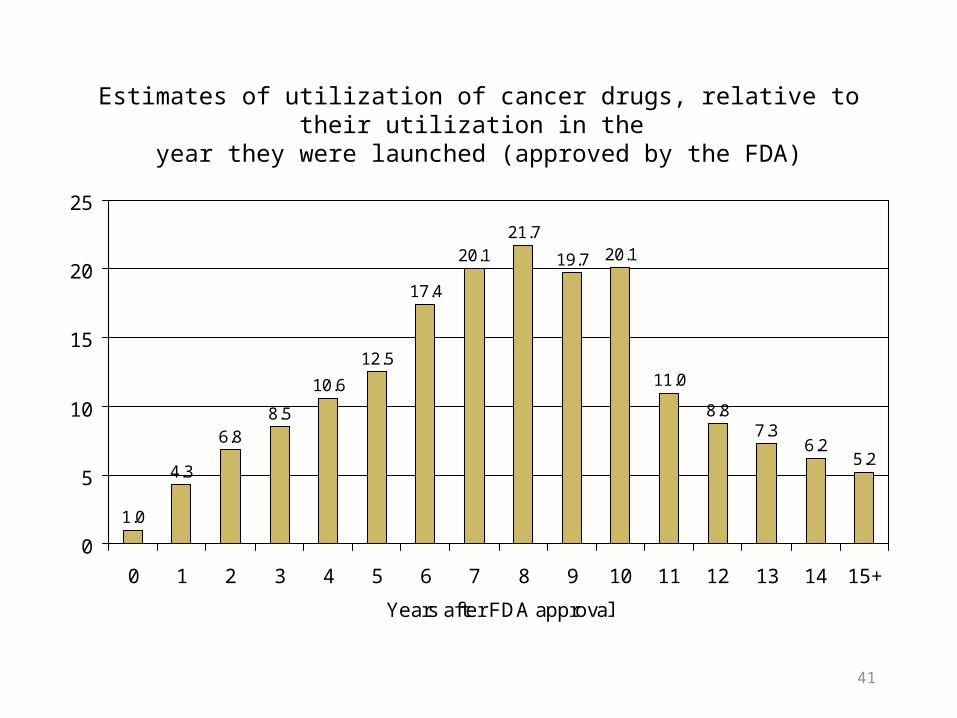
Estimates of utilization of cancer drugs, relative to their utilization in the year they were launched (approved by the FDA)
1.0
4.3
6.88.5
10.6
12.5
17.4
20.121.7
19.7 20.1
11.0
8.87.3
6.25.2
0
5
10
15
20
25
0 1 2 3 4 5 6 7 8 9 10 11 12 13 14 15+
Years after FDA approval
41

Methodology• I analyze the correlation across cancer sites (breast,
prostate, lung, etc.) between changes in the mortality rate of people previously diagnosed with that cancer and changes in the number of drugs that have been introduced to treat that cancer.
• I control for variables likely to reflect changes in diagnostic techniques– cancer stage distribution– age at diagnosis– number of people diagnosed (incidence)– use of surgery and radiation
42

Data sources
• Data on cancer-site-specific drug introductions were constructed using– the NCI Thesaurus– the Drugs@FDA database
• Data on all other variables were obtained from the NCI’s SEER 9 Registries Database, an authoritative source of information on cancer incidence and survival in the United States
43

Results• Cancer sites with larger increases in the lagged stock
of approved drugs had larger reductions in the mortality rate, ceteris paribus.
• The impact of the stock of FDA approvals on the mortality rate tends to increase steadily for a number of years, peak about 8-12 years after launch, and then decline.
• This finding is consistent with evidence about the product life-cycle of cancer drugs: utilization tends to increase steadily after FDA approval, peak about 6-10 years after launch, and then decline.
44
Results• New cancer drugs introduced during the period 1968-1994
were estimated to have increased the life expectancy of cancer patients by almost one year (0.94 years).
• Although the health of cancer patients is less than perfect, the increase in quality-adjusted life-years is not necessarily less than the increase in life expectancy.
• Since the lifetime risk of being diagnosed with cancer is about 40%, the 1978-2004 increase in the lagged stock of cancer drugs increased the life expectancy of the entire U.S. population by 0.38 years. This represents about 8.8% of the overall increase in U.S. life expectancy at birth.
• The cost per life-year gained does not exceed $6908, which is far below recent estimates of the value of a statistical life-year.
45

Extensions• Different country: Chemotherapy innovation
accounted for at least one-sixth of the decline in French cancer mortality rates during 2002-2006, and may have accounted for as much as half of the decline.
• Different technology: Diagnostic imaging innovation (CT scans and MRIs) has also prolonged the lives of American cancer patients
46

Summary
Expected private return on R&D investment
Amount of R&D investment
Number of new drugs, medical devices, and procedures
Population health, longevity, and productivity