The Demand for Food in BurIlla - AgEcon...
22
The Demand for Food in BurIlla T Soe, R L Batterhamand RO Drynan 371h Annual Conference Ausu'alinn AgIicultural Economics Society Univt.!rsity of Sydney 9-11 February 1993 Deprulment of Agricultural Economics, University of Sydney NSW 2006
Transcript of The Demand for Food in BurIlla - AgEcon...
The Demand for Food in BurIlla
T Soe, R L Batterhamand RO Drynan
371h Annual Conference
Ausu'alinn AgIicultural Economics Society
Univt.!rsity of Sydney
9-11 February 1993
Deprulment of Agricultural Economics, University of Sydney NSW 2006
'TbeUemand ,for Fond innurma
T Soe, RLBaUerhtUn ,and R GDrynan*
The Bunnese economy is ,an agriculturalcconomy where production, consumplionand export ate essentiaHy of basic foods. Food production occupies about 80 per cent of the total work force. Rice production alone occupies abouthalf of the total,cultivated areaal1d employs about
70 per cent of the work force. Until theeady 1960s, Bunna had a relatively pl'osperous economy. It was a leading rice producer and exporter, but has now become harelyselfsufficient in the f"oduction of rice and other major foodstuffs. A majorgoverJ111lent policy was
the procurement of rice and other foodstuffs. Consumer subsidies were applied to some
foodstuffs, especially low grade rice and export taxes were applied t() rice. Thrivingintemal
and external black markets in foodstuffs emerged.
In attempting to fonnulatc policies promoting economic recovery in BUlma, it is important for
policy makers to know something of the magnitudes of the demand for various foodstuffs. The
central objective of this study is to estimate the demand functions for a range of impOitant
foodstuffs in BUffila. These estimates can be used to sugge~l appropriate food policies given a
set of economic growth and welfare objectives for Bunna.
The Specif1cation of the Demand l\1odels
Most empirical demand studies use either cross-sectional (household budget) datu or time-series
data. If cross-sectional data are used. many variables in addition to price and income can be
included in tJ1C model. Time-[~eries analyse, usually based on aggregate data, have more
limitations. Aggregate data cannot show the different preferences of consumers. Thus, the use
of aggregate data in a utility context implies that all consumers are represented by a single
consumer with a given utility function.
In practice, demand analysL~ have few options. It is impraclical to include all asp(!cts of theory
in a model due to data limitations, constraints on modelling. the complexities of theory, and
computational difficulties in the estimation procedures. Thus, some simplifying assumptions
have to be made. Two assumptions arc common. First, consumption per person is assumed for
a 'representative' consumer whose behaviour is described by theory. Secondly, only the
quantity variables .are assumed to be endogenous. with the prices at retail assumed
predetcnnined (Tomek and Robinson 1972). Both assumptions apply to the present study.
In addition, two more assumptions arc made with regard to, 11rst. income distribution, and
.. TIlis work was conduclCd at the University of Sydney. Soc is now employed in the Institute of Economics. Ynngon, Myanmar. '111c autJlOrs express their appreciation to Stephen \VhcIall and David Godden for helpful comments on thispapcr.
'2
secondly, savings. Both tbe :incomedlstrlbutiollandsayjngsarc likely to affect food consumption (toooek:andRobinson 1972). 'Puc to data limitations. itisassumed 'here that there
is no change in incon1edistribuuOIl, and that COl1Sumers spent all their incornes durillgthe .study period. ThcseassumptiQns seem realistic ,in the Suonest} context, especially oVc.rtheperiod considered (1975 to 1987). The:availablc'evidencc$uggcsts thatreal income .levelsofiliclarge majority of consumers inJ,3~nna wereJowand stable. witbfe\v variations overtime (see Than and Tan 1990).
Quality variation of the food items under study waslargcly ignored. An exception i.s made for rice because it is the most importantstaple food and quality varlation is wcU .. recogniscd by Bunnese consumers. In order to address qucstionsconcemillg the impact ofquality variations
on the consumption of rice, three typcsoftice (low, high and average quality) are considered
by including them alternatively in the models specified for estimation.
Consumption of respective food items in this study is generally assumed to depend only on
three factors: prices. income and seasonal faclors proxied by quarterly intercept dummies.
Instead of a lime trend variable, quarterly dummies are used in this analysis 10 represent the
seasonal pattern of consumption because seasonal influence on food consumption in temlS of
seasonal festivals and events arc obvious in BUlma. It is also reasonable to assume that there
have been no major shifts in demand for the food items during the study period. 1
Data
Aggregate quarterly lime-sclies duta cunsisting of 51 observnlions from 1975(1) to 1987(3)
were used. The data on non-meat basic foods were for Bunnn as a whole, \\thile the meat dala
were for 70 townships as specified by the Central Statistical Organisation. TIle basic data were
compiled from variolls primary sources.2
1110 main sources of data arc the publications and records of the Central Statistical
Organisation. the ?vtinistry of National Planning and Finance. the Aglicultural Corporation, and
the Agriculture and Falln Produce Trade CorpOl:..iion. In the regression analysis, all data were
tr'd.J1sformcd into logarithmic fOlm and expressed in per person and/or per unit per quarter
basis. The consumer price index (CPI) at 1969w70 pIices was used as deflator. Further data
transformations as required were made during estimation of the regression equations.
: I .. m· :1':: detailed outline oftllcdcmnnd model is found in Soc (1991). 2 Most Uunncse d:ltn are disorgnnisedand .scattered, Wld data collection for Dunna is a fomlitL."lble (.'Isk. It wasinilially intended to undertake a household expenditure survcyin Bunnu. l'owevcr, the prevniling problems in Ole country made such ntm;k very dimeu}t. l1JUS it was decided to use lime-series data. The tu .. ",k of ~un coHcctioll. compilation and prO<.'Cssillg took approxhnulcly one year.
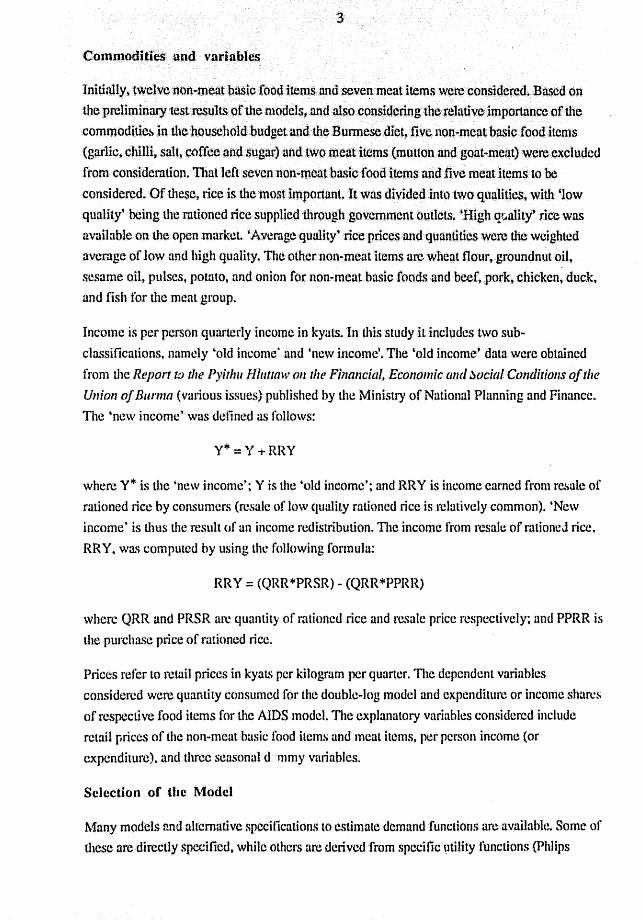
COIun.oditlesand variables
Inithuly ~ twelvenotl~m¢tlt ·basic to04 :item$;mdseve~lmeat Itt;;:ms were considered. Based on the preliminary 'tcstresults pC the nl()dels~Jmda1so :conSiqering the relu.tlve ,importance.ofthe
commoditia~in the 'bouschold.budgenmd.the.13 Ullllese diet,·flve non-meat basic .tood ,items (garlic. chilli, sall!c('}ffee an(isqgar)nnd (wOllleatlt.ems (muuonandgQat-meaO were.excludcd
from consideration. Thalleftsevennon.-meatbasic fOod· items and five meat items to be considered. Of these, rice is the lllOstimpottunt. It was divided into two qUAlities. with 'low quality' being the T'Jtioncd rice suppliedthr,oughgovemment outIele;, JHigh(r~a1itY'r.icewas availuble on lheopenmarket.iA~t'erage'quulity' ·ricepnces alldquanutics were the weighted average of low and high quality. The other non-meat items arcwhcl,lt tlour,groundnutoil, sc:snme oil, pulses, potato, and onion fol' non-meutbnsic foods ·and bceftpork,chicken. duck, and fish for the meal group.
Income is per person quarterly income in kyats. In this study it includes 1wo sub
classifications, namely 'old income' and ·ncwincome'. The 'old income' dUla were obtained
from t11e Report tf) the Pyithu Hlmunv 011 rhl' Financial, Economic ami ~oci(ll Conditions of the Union of Burma (various issues) published by the Ministry of Nutional Planning and Finance.
The 'new income' was det1ned as follows:
y*:y +RRY
where y* is the ~new income'; Y is the ·old income"; and RRY is income earned from r~\ule of
rationed rice by consumers (resale of low quality rationed rice is relatively common). 'New
income' is thus 111e result of an income redistribution. The income from resale of mtioneJ rice. RRY. was computed by using the following formula:
RR Y = (QRR *PRSR) - (QRR *PPRH)
where QRR and PRSR an!qunntity of rationed rice and resale price respectively; and PPRR is
the purchase price of rationed rice.
Prices refer to retail prices in kyats per kilogram per quarter. The dependent variables
considered were quantity consumed for the double-Jog model and expenditure Of income shuR's
of respective fO(ld items for the AIDS model. The explanatory variables considered include
retail prices of the non~meatbasic food items and ment items. per person income (or
expenditure). and three scnsonal d 'mmy vnriables.
Selection of the Model
!\'1uny models nndultemutive specifications to estimate demand functions are available. Some of
these aredircclly specified, while others are derived from speciJic 'ltHity functions {Fhlips
4
1914;.R.auuil;urand Iiuung 19S7}~thC' problem Qf'modelpboicclS further ·compOlmded by the requircmellll)ofSQ1tistic·al jn(¢m~ce: the rnodel.beS,P¢¢i.fied, 'the sample data collected. the estimate ,mad~, :an.(i :the hypoth~$' tested (Tomek-and, Robinson 1974JP~ :g36).
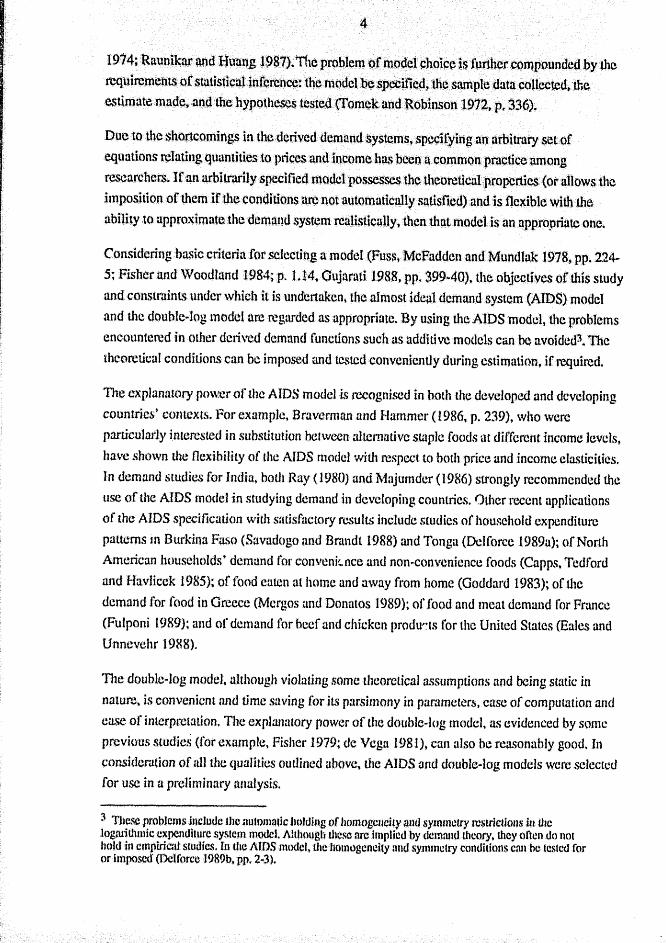
Due to the shortcomings inthededveddemandsystcms, specifying an arbitrary set.of equations reIatin~qnnn.tjtiesto pncesand .incomehu.-; beena,commonpracticeamong researchers. Itun arbIlranlyspecifiedtllodclpo~~c;the theoreticalptoperlies (or' aUowslhe imposition of them iflhe conditionsarenotautomaticw1y satisfied) and is flexible with the ability .to approximatethcde.mulld system rcnlistlc;dly,thenthall1lodellsannpPfopriute one.
Considering basic criteria for sefectinga model (Fuss. 'McFudden and MundIuk' 1978, pp. 224-5; Fisher and Woodland 1984;}1. :tJ41" Gujarali 1988, pp. 399 .. 40), the objectives Qfthisstudy and constrJint~ under which it is undertaken, the, aIrnost ideul demand system (AIDS)rnodcl and the double-log model are rcgurded as appropriate. By using the AIDS model, the problems encountered in other derived demand functions such as additive models can be avoidcd3~ The theoretical conditions can be imposed and tested conveniently during estimation, if required.
The explanatory power of the AIDS model is recognised in both the developed and developing countries' cmltcxts. For example, Braverman and Hammer (1986, p. 239), who were particularly interested in substitution between altemnti·ve sutple foods at different income levels. have shown the flexihility of the AIDS model ·.Jlith respect to both price and income elasticities.
In demand studies for India, both Ray (1980) and Mtljumder (1986) strongly recommended the use of the AIDS model in studying demand in developing countries. Other recent applications (')f the AIDS specification with stttisfuctory results include studies of household expenditure
patterns In Burkina raso (Savadogo .md Brandt 1988) and Tonga (Del force 1989a); of North American households' demand foJ' convenkoce and non-convenience foods (Capps. Tedford and Havlicek 1985); of food eaten at home and away from home (Goddard 1983); of lhe
demand for food in Greece (Mergos and Donutos 1989); of food and meat demund for France (Fulponi 1989); and of demand for beef and chicken prodU'~ts for the United Stales (Eales and UnnevehrI988).
The double-log modeJ, although violuting some theoretical assumptions and being SCHlie in nature, is convenient nnd time saving for its parsimony in parameters, ease of computation and ease of interpretation. The explantltory power of the double-log model, as evidenced by some previous studies (f()c exmnple, Fisher 1979; de Vega 1981), can also be reasonably good. In considerJtion of .d} the qualities outlined ubove, the AIDS and double-log models were selected for use in a preliminary unalysis.
3 '111esc problems include Uu~automnUc Jl(.)] ding of hom()gcucity ;lutl symmetry restrictions in Ole logruilJuniccxpendhure system model, Ahhough mcsc nre implied by demand theory, they often do nOI hold in cmpirlC:1I stUdies. In the AIDS model. tllC flomogcncity and .symmetry conditions can be tested for or imposed (Dclforcc 1989b., pp. 2 .. 3).
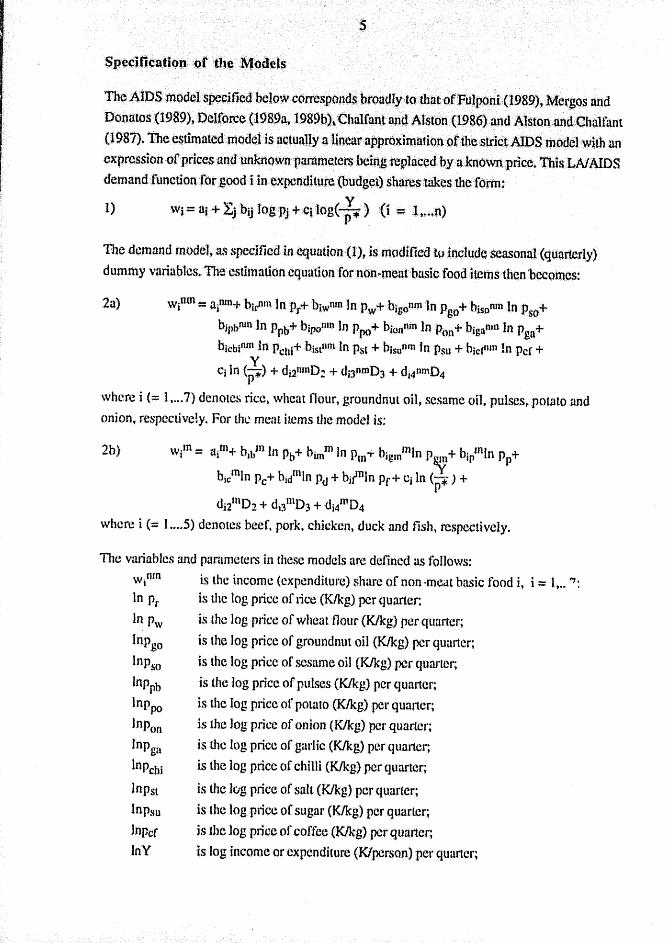
The AIDS :rnodel spc~jfiedbelowcorre$ponds broadly :{othntQtFulponi (1989), Mergos and
Domnos (1989), Detforce (198941. 1989b).'Chalfant and Alston (1986) and Al$ton.nnd.,Chulfanl (1987). The estimated .modelis .aotuuUy a :lin~ .approximationoftbestrict AlDSmQdclwith an expression ;of prices und 'unkrtownpararoetets:bcingreplacedQyaknown.prlce. This LA! AIDS demand function (or good 1 in expenditure (budget) shares takesthefottn:
1) wi = Ui + }:jbij logPj +01 109(;*) :(i= l".~n)
l1le demand .model. as spcclfiedincquution 0), is. modified tv:includeseasonal(quarterly) dummy vmiublcs. Theestimat.ion equation for'non-meat:busic (ooditemslhenbecomcs:
2a) Wiom = uinm-s. birmnlnPr+ biWnmlnPw+blgontn In Pgp+hisoom In Pso+
hJpbOlIl1n Ppb+ bipomn InpJ;'K)+ bionnm 1nPon+ bigantn1n Pga+
bkbinm In PChi+ hbanrt1 In PSl + hisunm In Psu + bicttun In pef + y
cJ 1n (pitt) + ddunD:! + di3nmD3 + d,4nmD4
where i (= 1 .... 7) denotes rice, wheat nour, groundn\ll oil, sesame oil, pulses~potato and
onion, respectively. For lhe mC~lt items the model is:
2b) Wim =ailIl+ h,bJl1 In Pb+ hilum In PlOT bigmm1n Psy+ bipmln Pp+
bicmln Pc+ bjdlllin Pd + hirUln Pr+ Cj In (p* ) +
dj2JllD2 + ddllD3 + dil"04 where i (= J .. u5) denotes beef. pOl'k~ chicken, duck and fish, respectively.
The variables and parameters in these models are det1ncd as follows:
Wiom is the inc·ome (expenditure) share of non ·meat basic food i, i:;:: I, .. "': In Pr is the log price of dce (Klkg) per quarter. In Pw is the log price of wheat flour (Klkg) per quarter;
InpgO is the log price of ground nut oil <K/kg)pcr quarter;
lnpso is the log pdce of sesame oil (K/kg) per quarter;
Inppb is the Jog price of pulses (K/kg) per quarter;
lnppo is IheJog price of potato (Klkg) per quarter; JnPon is the log price of onion (K/kg) per quarter;
Inpgn is the log price of garlic (K/kg) per qUUl1cr;
InPchi is the log price of chilli (K/kg) per quarter;
Inpst is thclCig price of salt (Klkg) pCI' quarter; Inpsu is thclogprlcc of sugar (Klkg) per quarter;
Inpcf ist1)e Jog price of coffee (Klkg) per quancr, InY is log income or expenditure (Klperson) per quarter;

Hnd
birnm
'btwnn1
bi$()mn
bi$~mn
bit>bnm
bjpollltl
bit)Dllnt
biganm
bichiUJU
hlstntn
bisul1U\
bid-tUU
di2f,m
lSo, cPlllposi~iprlceinde",StQne;spdceli1de,,)~ arid i$the(;oeffiQienti)rd¢e;pnnQh~rneafbasic :toodi,!;:: 1, •.. ~.7;
bthe, coefficient of wheatflourou nort-mca.tbMlc food ,i, 1:; Ih •.• 7; iSlheooerncientQ(groundfiut:olloll non-meafbasicrQodi, i~ It .. ,,.7; is the '~oefficlent orsesnmeoiJQnnon-meat 'busic food ;i, '1.;:: '1,., •• 1,; is thecoeffich.;mt()rptil$CSon.n(jn~m¢atba$ic food 11 I:; 1" .•. 7; is the coefficient of p()~nto .onJl()Jl~meat basic fOOd: it 1 = },.,. .. 7;
is the coefficient of onion on. non-meat basic food :i, i:::·lt •••• 7; is the ¢{)f~rt1cientor garlic on rion-tneatbasic (Qodi, i = 1j •••• 7;
is thccoefficicncofchiUi onnon-rtlcarbasic: food i, i;:' 1, ..•. 7; is the coefficient of suIt on non-meatbaslc foodi;; i = 1 •.•.• 7; is the coefficientofsugaton nan-meat food i, .i = 1,., • .7~ is Ihecoefficicnt of coffee OIl non~meat foodi,} = 1 ...... 7. is d,e coefficient for seasonal dummy variable D2 ropresentingthe second qtull1er for non-meat bar;ic food i, .i = It •••• 7;
is the coefficient for seasonal dummy variable D3 representing the thi.rd
quarter for non-meat basic food i, i == 1, .... 7; di4nm is the coefficient for seasonal dummy variable D4 representing the fourth
quarter for non .. me/lt basic food it i = It •.•. ?;
a1tlUl, hj_ml, C1 arc the other parameters to be estimated for non-meat basic food i,
i = 1. .... 7;
Witll
lnp!)
InPm
lnpgm
lnp" InPe InPd lnpr
bibm
b. In 1m
bigm m
bipm b. In Ie
bidJn
bit·1ll
di2m
is the income (expenditure) share of meat i, i = 1, .. .5; is the log plice of beef (K/kg) pcr qml11cr;
is the log price of mutton (K/kg) per quartel';
is the log price of go~1t~meat (K/kg) per quarter; is the log plicc of pork (Klkg) per qunrter;
is the log price of' chicken (Klkg) per quurter;
is the log price of duck (K/kg) per quulter;
i.s the log pdcc of fish (Klkg) per quarter;
is the coefficit.mt of beef on meat i, j = 1, ... .5;
is the coefficient of mutton on meat i, i = 1, .... .5;
is the coefficient of gout-meut on meal i, i = 1, .... 5; is Ole coefficient of pork on meat i, i = 1. .... 5; is thc coefficient of chicken on meat i, i = 1, .... 5; is the coefficient of duck on meat i, i = 1, .•. .5;
is the coefficient of fish on meat i, i= 1, .... 5;
.is the coefficient for seasonal dummy vadahle D2 representing the second
quarter for meat i. i = 1, .... 5;
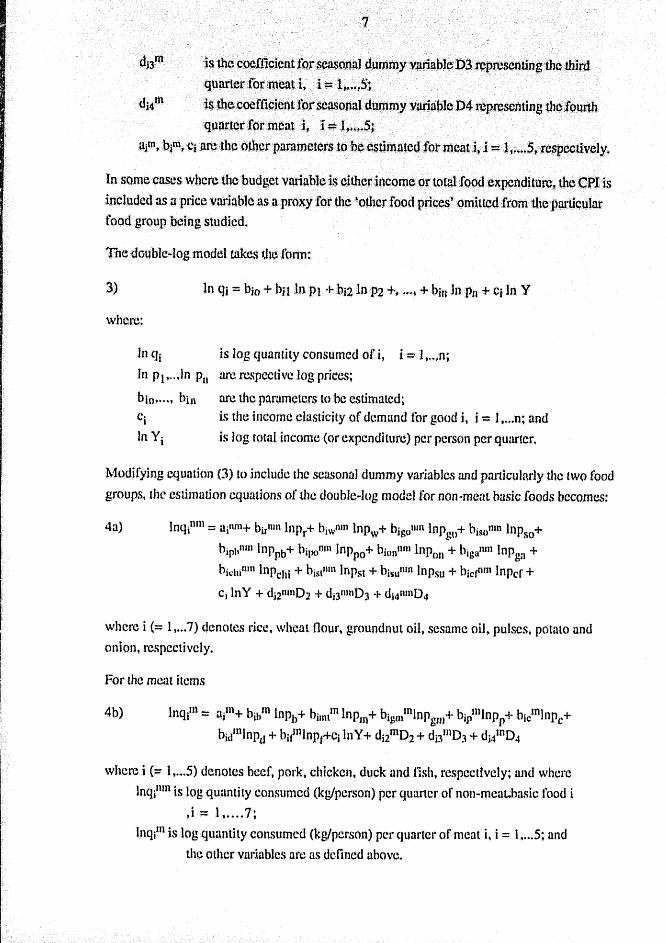
d13m is ·U1ec~rfi9ie.nt tQr~()uhl4.umm;y'v~riRbl~D3~presenting~tbQthird qU~toer.ror. ;meat i" 0 i::, lt~';'t5:;
d14nl iisth~.coe(ficient fOf$C$On::.l d.wmny vill"iablc D4.rep.resentingtb(}:IQurlh qll;lrtcr rpr:mca~lf Oo'i;;: Iti~~ .. 5;.
tllm, blm~Ci.are ;thcplhcr 'puI1lmetets t()hecstlma.~ed fot.meat )i .. i ::;: :lH~ • .5, !re$'pcctively~
In :some 'caseS wllcre the 'budget vlUi~bleis cither:income or lotalfoodexpcnditure, thedPlis
includcdas u price vntiable as nproxy for the ·otherfood ,plices'omitted from 'dlCJ)At'tiClllar t"ood group being studied.
Thedcuble .. log.model takes dle fonn:
3)
where:
1n qi is log quantity consumed of i, i =: l, ... n;
l'n PI, .. ,ln Pu arc respective ,log prices;
bi(), .... , bin are the parameters to be estimated; ci i.~ the income elasticity of demand for good i, j =1 , ... n; and In Y i is Jog total income (0 .. expenditure) per person per quarter.
1\.1odifying equation (3) to include the scasonlll dummy variables und panicularly the two food
groups, IhL' esti.mntion cquOlions of the double-log model for non-meat basic foods becomes:
4a) Inqimll = ajllm+ birllln hlPr+ biwnm 1npw+ blgomn lnpgn+ bis()nm Inpso+
bipbnm Inppb+ b'rx)tlm Inppo+ bjonum lnron + bisaum lnpgn + bichinm InPchi + bistllm lnpst + hisunm Inpsu + bid.fltn lnper + Cj In Y + dj2nmD2 + dj3mnD3 ... dj41l111D4
where i (= 1" .. 7) denotes rice. whoat. Oour. groundnut oil, sesame oil, pulses, potato nnd
onion, respectively.
For the meat items
4b) InqiUl ::::: aiIn+ hibIU Inpj)+ bil1lltn InPm+ bigmlD1nPgm+ birlnlnpp+ bicUl1llPc+
bidlUlnpu + bilJJl1npr+cj InY+ diltnDz + dj3mD3 + dj4tn04
where i (= 1, ... 5) denotes beef. pork. chickcll t duck nnd C;sh, respectively; and where
Inqimn is log quantity consumed (kg/person) per quarter of non-meaW1asic food i
,i ;: 1.'.H7~ InqjIn is logqunntity consumed (kg/person) per quarter of meal i, i = 1 •... 5; and
the other variables arc as ddil1ed above.

I
The .double~lQg '~od~t.specified"above ,corresP{)t1d$broadlyt~.lbat ,of Main, :ReynOlds 'and \Vhite(1976)andMartin4nd ,P6rt¢r(198S)~ ,As~ wlththe.AtDS .rood~ls'Jh~, double-Iogmodets with .income ,()r;tQt~l food expenditutens th~hudg¢t van~bl~.a1sQln.t!lud~dthe variable CPlas a proxy for 40ther food prices' Jmtjn¢l\lded,illthegroUp·.lX!jllg$LUdied~
The demand equations wel~ estimated simulta:neously ina system otequattonsby using SHAZAM (White, Wong, Whis(lerandHnun 1990,pp. lS2~8)~ SilAZAl\1 provides a procedure for estimating s),stems ()f:simull4neops equations Q(Scts of seemIngly unrelated regressions. iterative Zcl.lncr estimation, ormuluvuriate mgressi(m. SHAZAM estimates a set of equations und does a joint gencf'J,lisedlcast squarcsprocedurc by usin~a covatianccm;.urlx of residuals across equations.
\Vhile a systems cSlimationappronch is less robust to misspecification CO'orsthan single. equation estimation. it hus advantages in that it provides information to test hypotheses about rcstJi.ctions directly obtainable fl'Om theory (Ph lips 1974; Johnson. Hassan and Green 1984). The system approach not only allows the imposition of restrictions but also has the ability to improve the efficiency ()f the overall set of parameter estimates (Beggs 1987~ pp. 14~5).
hnposing J{cstrictions
Nominal pdce versions of the systems of equations speci11cd in (2) and (4) were c.slimated in both unconstrained and constrained forms to Lest for homogeneity and symmetry properties. Rc,al price models automatically satisfy homogeneity. Tests were made of symmetry in these
cases.
The estimated resuJlc; of the unconstrained estimation and homogeneity constrained estimation were not significantly different in any equation suggesting that the homogeneity property applies. Symmetry was found to apply in most but not all equations in both the non .. mcal
system and the meat sy::;tcm.
Computation of Elasticities of Demand for the AIDS Model
The fonnulae and procedure used for calculutlon of elasticities and related statistics of the AIDS
model in this study followed Beggs (1988), Delforce (l989b), and Green and Alston (1990).
Income elasticities:
5) Own-price elasticities:
6)
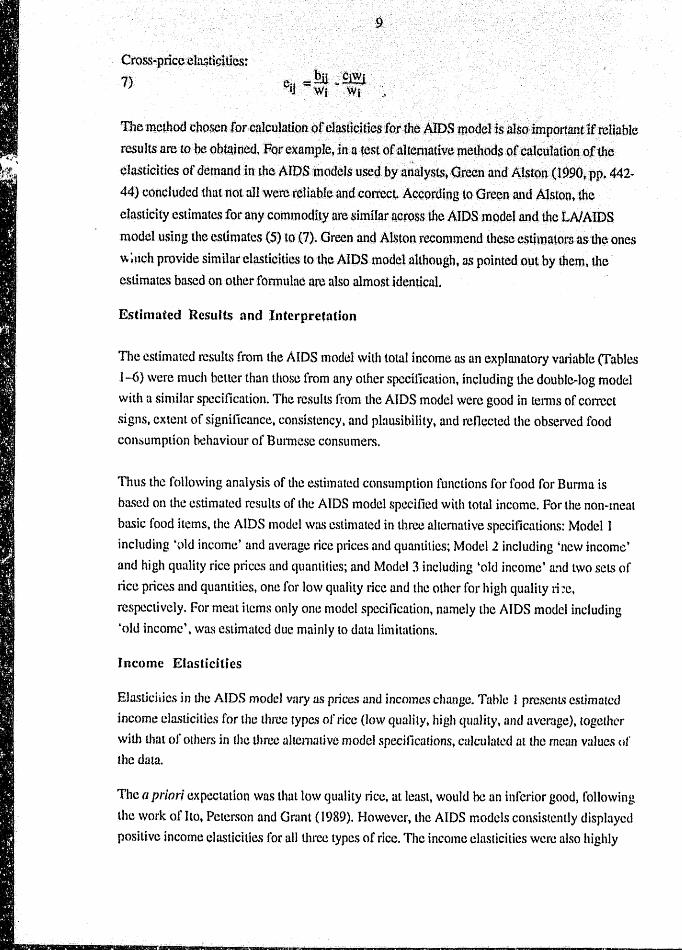
Cross.:pnccelU!1ticities:
7) bi;C·W· e .. ·;:; . .:;..t,J· .. ~ IJ W.i ; Wi
The method chosen fOf{;alcu}ation of elasticities (off-he AlDSmodelisalso.impQrtantif reliable
results are to be obtained, For example, in a rest ot' altemative methods of calc til ad OIl of the
c'Iasdcities of demand in the AIDS models used by analystst Orecn and A.Iston(1990p Pl". 442-44) concluded that not all were reHableandcorrcct. According to Oreenal)d Alston, the
elasticity l~Slimates for any commodity ate similar nO,ross the AIDS model and the LNAIOS model using the estimates (5) to (7). Green and Alston recommend these estimators as the ones
\\ ~nch provide si.milar elm;ticities lothe AIDS model although, DS pointed out by them, the
estimates based on other fonnttlae nrealso almost ldenticnl.
Estimated Results and Interpretation
The estimated results from the AIDS model with total income as an ex.planatory variable (Tables
J -6) were much better than those from any other specification, including the double-Jog model
with u similar specification. The resuIL~ from the AIDS model were good in tenns of correct
signs, extent of Significance. consistency. and plausibility, and reflected the observed food
con~umpljon behaviour of 13utnlCsC consumers.
Thus the following analysis of the estimated consumption functions for food for BUl1l1tl is
ba.~cd on the estimated results of the AIDS model specified with total income. For the non~rneat
basic food items. the AIDS model wns estimated in three alternative specifications: Model I
including ',lId income' and average rice plices and quantities; Model 2 including 'new income' and high quality rice prices and quantities; and Model 3 including 401d income' and two seL" of
rice prices and quantities, one for Jow quality rice and the other for high quality 1; :C. respectively. For meat items only one model specification, namely lhe AIDS model including
'old income'. was estimated due mainly to datu limitations.
Income Elasticities
Elasticities in U1C AIDS model Vilry as plices and incomes change. Table I present.., estimated
income elasticities for the thrcc types of rice (low quality, high qunJity, and nvcl':.lge), together
with that of others in the three alternative model specifications, calculated at the mean values of
the data.
The a priori expectution WUB that low quality rice. at least, would he an inferior good, following
the work onto, Peterson and Grant (1989). However, the AIDS models consistently displayed
positive income elasticities for an three types of rice. The income elasticities wero also highly

'.10.
significantslutistically. The,ma~llitudf!SVarif!d from 0;2 (or low qunlity rlce.tp 0.9 for high quality rice. Sioce theincome.elasdchje,.~ fOtall three :dce qualities were positive. tbeyate
clussifiedas nonnal goods. Increased income will be (oUowe<i by increased cOllsumptionof all rice qualities, and the incren..c;c muy be .quit¢ large fot avcrpgerice ,and highqunlity rice. This
resuh was more obvious when t.heesdmntedresults of thethrccalternative models were compared. Model .1 (lower income) and Modf.!l 2 (higherincomv) recorded 0.6 nnd 0..9 for averoge and highqunlity ~ce1 respectively t while the-figures estimated by Model 3 were 0..2 for the low quulHy rice nnd 0.7 for high quality ricc. respectively. The changing mugnitudes of income elasticities willl the chunges in incotn!? nnd riccpnc~'ialsQindicated that both income
nnd rice prices were impC)llunt fuctors in determin:ng rice consumption.
Positive correlation of income and consumption of lice was reasonable in Burma, especially duling the study period. Real incomes were low and the majority of households were
characterised by under-consumption of even basic foods. A policy implication is that incl'ca.'ied supplies of all rice qualities arc needed in the short run. rt also seems likely that greater supplies of nvel"Jge nnd high quality rice will also be needed in the long lenni as incomes presumably
will rise.
TIle second cereal item considered was wheat flour. Wheat produCL,) arc 'festive' or 'semiluxury' foods for the majotilY in Burma. Il seems, howevcrt that they have recently become an
incre.asingIy importnnt substitute for ricc. As expected, the income elasticities for wheat flour
were positive in all models. the magnitude was about 0.8, and the estimated cocft1cients were
also signiJicant.4
The non-cereals considered include groundnut oil, sesame oil, pulsl!~. potato and onion, and
the income elasticities arc also reported in Table 1. The two most widely used cooking oils in Bunnu are groundnut oj} und sesame oil. The BUnnesc food preparation system is such that
dishes without oil arc regarded as incomplete. Thus household food expenditure always
include.1I) these oils. although the quantity and type may be limited by the budget constraint.
Sesame oil is the more expensive. so grollndnut oil is morc widely consumed than sesame oil.
Pulses are important for both dOmc.'ilic consumption and for-export. Domestically, they are a major complement to the main dishes either as soup. or as a mix in the main dish, or in various kinds of snacks. Thus, the quantity demanded domestically is generally high. Recently pulses
have become an increasingly important export item. In summary, the estimated results show
that the income elusticities for all non-cereals arc positive. ~U1d income inelastic,S
4 111C coefficients were signit1ccnl n~ the 1 % level in model 1. 5% in model 2, and 10% level in model 3. 5 Note however UHlt not nil of 1110 estimates for the vnriablcs arc stnlis!ic~LlJy significant.

11
Theestimatedown-pdce elasticities for ricea,ngo(her basic ;foods arc reported in Table 2. All rice types are price in~lustlc hut the magnitudes vary from -.{}.2 to ...().8 for low quality rice and higb quality ricef l"e$pecUvely. All the elasticity estimates arestatisticaUy significant; In contrast, the own ... ,price elasticity of wheat flour is high wlth the rnasnitude?f the coeft1Cientsbcing about
1.0 in ull models. All elasticities for wheat flour were also highly significant With large t'"vulues.
TIle estimated own-pdcc elasticities ()f all non-cereals were consistent in all models, Normally, u high own .. price elasticity characterises a food item as luxury or semi-Iuxl,.lry (Tomek and Robinson 1977),but the unavailabUityof the item in question due to sUiJply shortage may also
cause the own ... price elasticity to be high (de Vega 1981). Supply shortages in Burma nla.y have contributed to the high own.,pnce elasticIties of non-cereal basic food ite.ms. Supply shortages
led to increased domestic prices for these items, at I 1St during the study pedod. rThjs was partly caused by the high priority given to rice (and a few other controlled crops) by
government policy which allocated resources to the controlled crops. This severely constrained
the production of the crops which were not conttoHed. In audition. the diversion of a
considerable portion of the limited production from domestic consumption to export (both IcgoJ
and illegal) further compounded the problem of domestic shortage. Thus, domestic prices remained high and as 11 consequence the expenditure shares remained relatively high over the
~umple period.
The generally high own-price c.lm;ticitics of' the non-cereal foods suggest that expansjon of their
cultivation may he profitable for producers. Consumers could (11so gain from plicc falls if the
supply of the non·ccreal foods were expanded. The income effect of such a price faIl may increac;e the quantity of non-cereals consumed to some extent. The income effect will be greater
for other major items such as high quality lice or wheat flour, or other quality goods such us
meat. llws the importance of basic items in either pl'Oduction or consumption should be
assessed in tenus of their impact on the package of foodstuffs. This is important in analysing
the impact of alternative government policies. In recent years government policy in Bunna has
focused on one or a few foodstuffs, rather than the package of foodstuffs that make up the
Burmese diet.
Cross-price Elasticities
The cross-pdce elasticity estimates of the non-meat basic food items are reported in Table 3. The rice to rice relation (model 3 in TabJe 3) showed that the high quality rice is a substitute for
the low quality rice hut the low quality rice is a complement to high quality rice. AU cross-price
elasticities for lice were signi11cant. This showed aguin that the demand for high quality lice is quite responsive to its own price. nnd the price of other rices.
,",
12
Despite the difrerencein 'I'nagnit\ldes, the inelastic ,ot]ow own"price elasticity for lice recorded
in this study was consistent with theoftehobservedphenomenon 1hata staple food with no Close substitutes, .and which also 'accourtt~ for·a large share 'of theconsumertsbudget, has' a
low price elasticity. The predominantly complementary nature of other basic food items torlce,
as indicated by the cross"'priceelasticities, was also consistent with the observed food consumption bnbitSof the Bllouese.
Among other basic rood items. only wheat flour und pulses werecobserved to 'be substitutes for rice in model 3. The cross .. price parameters were statistically significant (except for the low
quality rice and wheat flour relurionship) but their magnitudes were quite small being less than
0.1. To summarise, there is no close, important, substitute .rorrice, and most basic food items are complementary to rice.
\Vhen higher income and high quality rice prices were considered, some of the items previously
complementary to rice changed either to being independent or substitutes commodities. This
might be duc to income changes having no influence on the cross-plice relationships between
rice and related basic food items, or the "new income' considered in the regressions was not h.igh enough to affect the prevailing cross-price relations of the basic foods.
The characteristics of cross-pJice relutj~'ls of rice to ricc, and ricc to other basic foods observed
in this study have impOltant economic meanings and significant poHcy implications flow from
them. The result.;; support the obsClvation thm food consumption in Bl1lma is heavily centred on
rice and a few basic foods which (ifC consumed in a package. The price of rice, in pru1icular,
detennines the pattern of food consumption. If the price of lice were changed the mix of food
items included in the package is likely 10 change, mtller than the quantity consumed. The
implication is that. as long as rice remains as the major staple, the demand for rice and other
related basic food items will Hkely move in the same direction as the risc and faU of rice prices.
Continuing increases in the price of lice mean that the quantity of lice, and other foods in the
packagei' consumed will decline. A decrease in rice prices would lead to greater consumption of
rieet' and an increase in consumer welfare.
The result') for wheat 110ur showed the existence of lice as a substitute as well as many
complement\). Among the factors that intluenccd the consumption of wheat flour, rice prices
seemed more important than its own ptice and income. When new income alone was
considered in the regression (model 2), only a slight decline in the magnitude of Lhe cross .. pricr..·
eial)ticity of wheat flour to rice was noted hut when new income and average quality rice prices
were considered together, the decline was considerable. This suggests that incfCascd expenditure was allocated to rice rather than wheat Oour when lice pdces increased.
TIle estimated cross· price elasticities of the non-cereal items are reported in Table 4. Among the non~cereaIs, groundnut oil and sesame oil were substitutes as expected. Each of pulses, potato.

· 13
andonionconsistertUy exhibited .compleriu:mtary relations wiihaUothermnjorbasic items. TIle cross..;pricerclatiOi1"Sofpulses were:statisticallysignificant With rice and ground nut oit,.while most of thecross~price coefiicientsof.pOlA-lOand oni~)n to others were small in magnitude and varied in statistical significance. Tiiisoutcome was inconfotmitywith that-of thecross..;pnce relation of rlceand wheat flour toolher 'itcl11sasalreadyconsidered above.
Estimated Results fo.rMeat
IncomeElastici ties
The income and own.;price elasticities lor meat items are reported in Tables Sand 6. Contrary to expectation, the income elasticities for ldl meat items were generally low. Further, all meat items were classified as normal goods. Beef, pork and chicken have income elasdciticsof 0.7 to 0.8, while duck and fish have magnitudes around 0.6. All of the income elasticity estimates were highly ~ ignificant
Own-price Elasticities
Surprisingly, beef has the lowest own-price elasticity in absolute terms (-0.2), while chicken
and duck have the highest. It was noted that lhe own-ptice elasticity estimates of chicken and
duck were similar in magnitudes (about -1.5) in the homogeneity and symmetry constrained
estimation. The magnitudes diffcl'ec considerably from -1.7 for chicken to -0.8 for duck in the
homogeneity alone constrained estimation as reported in Table 5. For all other meat items. both
forms of estimation produc~d consistent and more or less similar results. Among other items,
the own-price elasticities fol' pork were l~bout -0.9 nnd fish about -0.65. Consumption of
chicken, duck, and pork were thereft'):c relatively more responsive to plice changes than other
meat items. Most of t"Il! own-price elasticities for meat items were signit1cant statistically.6
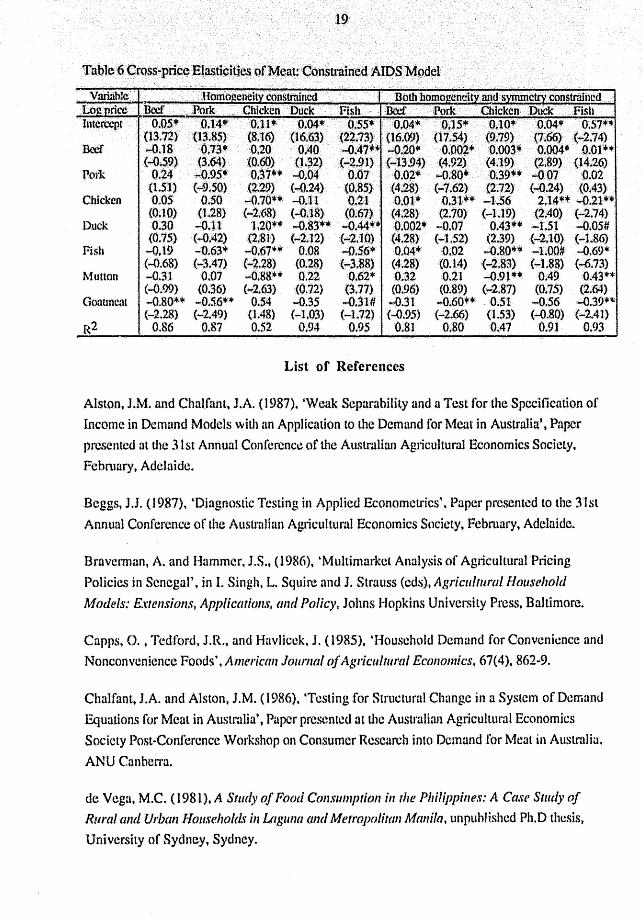
Cross-price Eln~ticities
The cross-price elasticitic s of ~ncal items are reported in Table 6. Results for the homogeneity
and symmetry model are emphasised. All major meat items were indicat.ed as being substitutes
for one another with varying magnitudes of Ole cross-price elasticities. The cross-price
elasticities of beef for pork, chicken, duck and !ish were highly significant but the magnitudes
were small. This indicates thatlhe extent of substitution for olhcr mcat items by beef was sma]}.
By contrast, the magnitudes of the cross-price elasticities of chicken as a substitute for pork,
and pork as a substitute for chicken, were considerably larger. Fish was found to he a
substitute for beef but compiemcntary to chicken and duck. Most cross-price estimates were
significant and the magnitudes of the estimates, especially for complements. were large.
6 Exceptions arc. beef ill tlle homogeneity constfllincd woUct, and chicken in the homogeneity and symmetry constrruncd model

Chicken and duck~asexpected, were the major ;substitutes With ,sjgnificant.and larg~ .ctossprice ptlramet.¢rs~
lnsumt the cross .. pdceelasUcities fer meat 'a5.providedby the models were reasonable and consistent., andreali$tica11yreUe<;tedthemeutconsurnptionhnbitand food: preparation system of Bunnese consumers. 'The characterlstics of .thecross~priceelasticities of meat indicated that the mostlmpormnt meat items ill. BUrma werepork,chicken.duck,andfisb.
However, it is unlikely thatlhe supply of meat in Burma will increase in the near future. The
livestock industry ~ exccpt forfishingt is primitive andtraditiona1.1n view ·of the capital intensive nature of modern livestock iodustry,and the inelastic nature ofthedcIlland formeat~ it is unlikely that it would be economic to expand it. However, from a nutritional point of view.
the prevailing traditional livestock :industry needs to he encouragcd t.o increase supply of meat
Esthnated Coefficients of the Seasonal Dummy Variables
As un agricultural countJy charncterised by diverse beliefs and values with various festivals and
fe·asL<) that are traditional or religious in origin but socio-economic in content~ it is it be expected
that the influence of these factors on food consumption in Bunna might be considerable~ The
seasonality of food consumption was thus proxied by three dummy vruiables; D2 for the
second quarter. D3 the third quaJter~ and D4 the foulth quarter, respectively. The detailed results arc given in Soe (1991).
A notable feuture in the estimated coefficicnt.1j for the dummic:s was It'lut the extent and number
of significant coefficients for both non-meat and meat generally were for the same season. In
the non-meat items. D2 and D4 were significant for rice, D3 and D4 for sesame oil, D2 for pulses and D4 for poUtIo. For meat, the coefficients of D2 and 04 were significant for beef and
chicken. D2 and D3 for pork, and D3 and D4 for fish. The most obvious and consistent ones were D2 and D4 for both metU and non-meat items. This feature hU'gely corresponds with the seasonal pattern of the festivals and the fanning activitics,as well as tbe use of foods ~in a
package'.
The importance of economic factors in food consumption was also indicated by the dummy
coefficients in that the significanllcvcIs in lelms Qf the magnitudes of t-values chunged considerably with the change in income levels and rice prices. For example, tl)C cocfJ1cicnt of
D2 for rice was significant only at 0.10 level in Modell but changed to 0.01 level in Model 2. suggesting that rice consumption is related more to changes in income levels and rice prices
(economic factors) than to changes in seasonal or socia-cultural factors.
In sum, the estimated coefficients for dummies were consistent~ reasonable, and realistic in the
context of the Burmese food system. food consumption habits, and other socio-cultural Md

15
traditional features. Thec~)Jnplelllelltaryatldsub$titutiortnntureofthe iJ,ems were: also t'ealistic~lIy id~ntitied1t:anp tnt} se.1Sonal shift,ofexpenditlJIU between, iood.items was also reflected. .
Condudi,llg Rf!marks
This study has shown that it is 'pOssible to estimate·,the demand for foodstufCs in. Burma. The estimates lor income elusticityof demand. ownprlce elasticity of denUlnd ;und cross price elnsticity of demand were consistent wilhgcnerallyacceptcdecollomicthl!Ory.applied to the case of avery l()w income country. One obvious rcsultof the study is to demonstrate thc necessity of collectingbusic economic statistics. ·evenin ve~y poor countries. Clenrly, the study could not havebcen conductcdiflhe d:nuon food c()nsumption~nd income had not been available in Bunna.
TIle study ~lso demonstrates the need for dedication to the task of preliminary data SCl'cening~
and to econometric model spedficuUon. As in many previous studic.Ci t tho AIDS model gave
estimates for the demand systems that are consistent with economic uleory.
Finally. it is reasonahle to use the estimates forincome elasticity of Jemund, own price
elasticity of demand and cross ptice elasticity of demand to make policy recommendations for goveOlmCnL(). Few such recommendat.ions arc made in the part of the demand study rep011ed in this papet'. Interested readers are referred to Soc (1991)1 for a more complete view of policy recommendutions based on the econometric e~timules of tile demand for food in Burma.
i

Table 1 IncomeElastlcities:forN()n-rneut~13asicFoodS: ijomogeneityand Symmetry ,Constr ~ned AIDS Modela
VruinblCs Rice Oow qunli~y) -
Rice (higllquality)
Rice (avcra2cquality)
Wheat flour
GrowldnUloil
Ses.unc "n Pulses
POtato
Onion
.M()(!ell
0.57* (14.99) O~82*
(4.44) 0:39* (4~80) O.QO·
(5.79) 0.49*
(5.51) 0.34
(0.99) 0.26
(0.96)
.. Mo.dcl.2
0.88'" (52.40)
0.77+* (2.19) 0.29* (3.45) 0.75* (S~84) 0 .. 68*
(7.62) -0.35 (-0.95)
0.32# (1.75)
311m figure." iu parentheses arc t-vnJues. Significance levels: '" 0.0 J; ** 0.05; nnd # 0.10.
MOdel 3 0.23*
'(4.28) 0:73*
(12.13)
0.80# n.84) 0.29*
(3.68) 0.65* (5.45) 0.87*
(1O.67) ...0.52 (--1.27)
0.28# 0.92)
Table 2 Own-price Elasticities for Non .. meut Basic Foods; Homogeneity and Symmetry Constrained AIDS Model
V.uiables Rice now qutllily)
Rice (high qualilY)
Rice (nvernge quality)
Wheatflouf
Groundnut oil
Sesame oil
Pulses
POlHlO
Onion
Model 1
-0.65* (-27.34)
-1,00· (-54.23)
-0.97* (-25.47)
-1.00* (-37.46)
-0.98* (-33.17)
-0.79* (-78.79)
-0.99* (-57.61)
Model 2
-0.84* (-159.4)
-O.9c)~
(-47.18) -0.97*
(-26J)6) -1.00*
(-47.98) -0.99*
(-3~.64) -0.69*
(-7858) -!.OO'"
(-90.28)
Modc13 -0.15*
(-3.12) -0.74*
(-lO.40)
-0.99* (-42.59)
-0.97* (";26.03)
-0 .. 99* (48.85) -1.00'-
(-36.79) -0.59*
(-65.29) -0.98*
(-69.02)

Mod~l:l 'Modc12 ;MOdcl' 3 \r"iiablcs o .Avemg~ \VhC4t HiSb.qu:il 'Wllclll Low qual, Uigbqual W,heat (Logpnce) rire tlPltt nee: Hoor ',nee rl~ flour Ri~ (llvcmse qlmUly) ~37*· 'l.U' - .... ~ ...... ..., -( .... 2.63) (4.76) \Vbeat flour 0.10· ..,.1 •. 00·
~ - .... ... -(4.94) (~5f,23)
Rice (hIgh quality) - - -0.60* 1.72* - - .... I (-l4.4S) (6.32)
\\'heat flour .- - O~04*. 4,t9.9* - ~ -. (6.49) (-41.18)
Rice (low quality) - - - - -().lS* ....().O2# 0.3S (..,.3:1.2) (-1.92) (1.52)
Rice (high qU.1Iity) - - - - 0.33# ..,0.74* 1.92* (l,gO) {-lO.40} (6.27)
\Vbl."at non!' - - - - 0,33 O.titS·· -0.99* (1.52) (6.32) (-42.59)
GrounJnUl oU -0.21* 0.71** 0.04* -1.11* -1.00* 0.07· -1.07** (-5.71) (2.l5) (3.09) (-3~O2) (-3.74) (4.34) (-2.79)
Scs.:'Une (lit -0.08** 0.29 -0 .. 01 0.70** -0.33# 0.01 0.37 (-2.64) (0.96) -0.76) (2.35) (-1.79) (0.84) (1.30)
Pulses OJ }¥ -1.07* "{).OI -0.46 0.73* -0.06* -0.64"''' (3.53) (-3,86) (...().86) (-1.58) (3.11) (-3.86) (-2.28)
POlato O.OS'" ..;().02 0.02* -0.'16 -0.12 0.U5* -0.20 (4.48) (-0.12) (5.43) (-0.98) (-0.88) (1.\ 44) (-1.07)
Onion 0.10'" -0.21 0.02* -0.23# -0.05 0.06** -0.66* (8.66) (-1.46) (5.22) (-1.91) (-{).38) (2.02) (-3.16)
Garlic -0.08** -0.16 0.03** -0.39** - - -(-2.93) (-1.02) (2.60 (",,2,46)
ChUh -0.04# 0.14 -0.02** O.()C) -0.03 -0.03** ROg (-1.83) (1.31) (-2.00) (0.76) (-o.2() (-2.29) (058)
Salt -0.04 -0.00 -0.15* 0.75* 0.70* -0.13* O.5~u
(-1.3j) (-{).03) (··1'3.05) (4.60) (3.S9) (-9.15) (2.66) Sugar 0.03 0.37 0.11* -0.76 0.23 0.11* -0.60
(0.75) (0.13) (6.73) (OAO) (1.07) (4.80) (-0.79) Coffee 0.12* -0.39* -0.07* 0.26# 0.31** -0.08* 0.29
(5.52) (-3.53) (-5,46) (1.69) (2.48) (-5.04) (1.58) R2 0.89 0.50 0.99 0.36 0.96 0.996 0.37

Vark1ble Log price Groulldnilt oil SeSU1nc oU ~ Pulses POtilio Onion Rice ..:(J.SS*' ~,59,·* ;O,42~ 1~76* l.94~
( ... ,sA3) (~~~S<!) (3.63) (4,7P) (8.69,) \Vheat 'flour 0.16** Q.17 -.();3~* -4J,04 ..;()~32
(2.20) (0.95) (..:3.83) (-OJ t) (~1.43) GrotmdnUlOU ...Q.97* 1.02* (t3Z· O~2g 0.42
(-:25.47) (6;77) {S.21) . (O.39) £1.2.1) Sesame oil 0.3.8* -1.00* -0.11# 0.26 -0.27
(6..90) (37~64), ( .. 1.76) (0.38) (-0.97) Pulses 0,23* ...0.34# ~,98* .... 0.55' -0.53
(3;2.~) (-1.83) (-33;17) ("';l.'lQ) (..,.t34) Potnto 0.02 O,OS"· -().OG -1.00* "";{}.32*
(0.39) (2.46) (-i.It) (...;78.85) (-6.09) Onion 0.06 -0.11 -0.09 -0.56** "':l.OO
(1..18) (-l.0t) (-1.31) (-2.18) (..-57.69) Garlic -0,04 -0.31** 0.11 0.34 0.38**
(-OJO) (~2.47) (l.S1) (1.25) (2.04) CbiIti 0.08 0.20** -.0.01 0~02 0.13
(1.66) (2.41) (-0,28) (0,13) (O.S7) Salt -O.ll** 0.37* 0.09 . ..0. IS -OJ 6
(-2.06) (3.15) (1.28) (-0,56) (-0.82) Sugur 0.09# -0.09 -0.13 -0.52 -0.97*
0.74) (-0.51) (-1.28) (-1 .. ';1) (-3.21) Coffee -0.20· -0.39· -0.05 -0.70* -0.21
(-3.87) (-~.98) (-1.00) (-3.27) (-1.35) R2 O,S8 0.81 0.86 0.70 0,53
(Since Ole cross-price Cbl,sticities of nOIH .. 'Creals ali disphlYOO by Ole three nltcrnatlvc model spec.mcatioJ1s are more or less siJ.nil,lt, the resulls nfModel J nlone (including old income find aven:tge rice) are reported).
Table 5 Own-price and lncome Ela<;ticities of Metl1~ Homogeneity and Symmetry Constrained AIDS Model
I Own·Pricc Elnsticitics (ucomeElasticitv Homogeneity Homogeneity and Homogeneity Homogeneity and
Vnriahte-Log price Symmetl)' Symmettv ~ -{US -0.20'- 0.67* 0.77*
(-0.59) t-lJ.94) (12.26) (J4.l7) Pork -0.95* -0.80* 0.82* 0.82'"
(-9.50) (-7.62) (23.03) (21.61) Chi~kcn -1.70** -1.56 0.75· 0.78'"
(~2.68) (-1.19) (12.95) (14.85) Duck -0.83** -1's1** 0.61* 0.67*
( .... 2.12) (-2.10) (l1.62) (5.98) Fish -o.56~ -0.69* O.6S*' 0.62*
(-3.88) (-673) (22.89) (22.83)
Variable' .. Utltrio~eneitv constmincdBothhomoJ!eneitymtdsynuncttYcOnSttrutlcd Log.yuire;Beer Pork .Chicken Duck Fish ,nrer· :Pork Chicken Duck Fish Intercept . 0.05*.0.14*'· ·,Q.}.1*' O~04* OSS* 0.04* O.lSI!< 0.10*'0.04* 0.57**
(l3,7Z) :03;85) (8,16). (16,63) (2Z.7~l· (l6;(}<) (ltS4) (9;79) . (1.~· .(~2.74) . .,..Q.18 (l;73.0,20 O,i40-O~47:·i4c -Q.20* 0.002* 'O.OQ3, lk O.OO4* ,Q;Ol·· (-0.59) (3.()4). (0.60) (li~2). (~Z.91),(~13.94,) (4.92) (4;19) . (2,89)' (14~26)
0.14 ·...0.95+ 0.37** ·-0.04 0.070.02* ,;.;Q;80. 'O~39** ~,070.02 0.51) (-9.50) (2.29) ·(..;():24) (0.85) :(4.28) ( .... 7.62) '2.7~) (-'0.24)(0.43) O;OS 0.50 ..;0.70** -0.110.21 ,0.Ol* 0.31** -1;56 2.14** .,.(l.21** (0.10) 0.,28) (-2;(,s) (4).18) (0.67) (4.28) (2.70) (-I.l9) (2.40) (-2.74)
Chicken
Duck 0.30 ~.11 ll20" -o.8~l*. "'{)A4**Q.002* ~O.07 0.43+· .... 1.5J -0,05# (0.7S) (...0.42) (2iS]) (~2.12) .(...;2.10) (4.28) ("':1.52) (2.39) (-2.10) (-)..86)
Fish -0.19 -0.63* -0.67** O.OS-o.56l1i O,()4+0.02 ,..;();80** ,-'1.00# ...,(),69 * (-0.68) ( ... 3.47) ( ... '2,28) (0,28) (",;3.88) (4.28) (O.14) ,(",:2.83). <,",1.88) (-:6.73) -().3l 0.07 .... 0;88.*" 0.12 0.62* 0.'32 0.21 "'{},91** 0.49 0.43** Mutton (-0.99) (O~3(j) ( ... 2.6.1) (0.72) (3.71) (0.96) (O~89) (~2.87) (O.75) (2.64) -0.80** -0.56"· 0.54 -0.35 ..:()$l# ... ,().31 ... 0.60" ost .-o.s6...().39** ( ... 2.28) (-2,49) (lA8) ("':1.03) (-1.7.2), (..().95) (~2.66) (t53)(~.80) (-2.4))
0.86 0.87 0.52 O~94 0.95 0.81 0.800047 0.91 0.93
List of References
Alston, I.M. and Chalfant, J.A. (l987)~ 'Weak Separability and a Test for the Specification of Income in Demand .Models with an Application to the Demand for lvfeat in Australia't PnrA!r
presented at tile 31st Annual Contercncd of the Australian Agricultural Economics Society,
Fcbnlury, Adelaide.
Beggs, J.J. (1987), 'Diagnostic Testing in Applied Econometrics'. Paper presented to the 31st
Annual Conferenc:e of the Australian Agricultural Economics Socicly.Febmary, Adelaide.
Braverman, A. and Hammer, J.S., (1986), 'I\1ultimarket Analysis of Agricultural Pricing
Policies in Senegal' , in I. Singh, L, Squire and J. Strauss (cds), Agricultural f/tJllseholtl
Mociels: K,.'rensions, AppliclI1/olls. (JIu/ Policy, Johns Hopkins University Press, Baltimore.
Capps, O. , Tedford, J.R., and Havlicek, J. (1985). 'Household Demand for Convenience and Nonconvcnience Foods', American Journal of Agricultural Economics. 67(4). 862-9.
Chalfant, J .A. and Alston, J .M. (1986), 'Testing for Structural Chungc in a System of Demand Equations for Meat in Australia', Paper presented at the Australhm Agricultural Economics Sr,cicty Post-Conference Workshop on Consumer Research into Demand for :Meat in Australia.
ANU CanbclTa.
de Vega. M.e. (1981). A SllIdy of Food Consumption in The Philippines: A Case SllIdyof
Rural anti Urban I-Jouseholrlv in Laguna (lnd.Merropo/itall A1anilll, unpuhlished Ph.D thesis,
University of Sydney, Sydney_

Oelforc.e, 1. (1989a), ~E"pen~UtQ¢J?auem& of;$tna.Ilbol~et~atm"H()usebold&JnTongtl:. tl.." Application Qfthe ,Almost Tdeal.Demaod System\ Paper pr¢$eTltep totJte 33td, Annual ConferenccQf:the A\l$tralHm AgncuUuralEco»om1cs.Society? Christchurch, New Zealand.
_, _' (1~89b),lJ~~ing'theAlmostldeal DemamlS:ystf!mto M(JdeIIlo14seholdExpenditure, South Pacific SmnllholderProject,Universityof New England, Annirlalc .•
Eales, I.S. and Unnevchr, L.J . .(1988), 'Demand for Beef and ChickenPmducts: Separability
and Structural Change', American Journal of Agricultural Economics:, 70(3), 521-31.
Fishcrf B.S. (1979), 'The Demand fQI'Meat', Australi(ln Journal of Agricultural Economics,
23(3), 220·229.
Fisher~ B.S. and \Voodland, A.D. (1984), l.ectures ill Econometrics. Department of Agricultural Economics and Dcpmtmcnl of Econometrics. University of Sydney.
Fulp('lni, L. (1989)~ 'The Almost IdeuJ Demand System: An Application to Food and Meat
GroJps for France't Journal oj'Agricultural Economics, 40(1),82-92.
Fuss, M" McFadden. D., and Muudlak, Y. (1978). ~ A Survey of Functional Forms in the
Economic Analysis of Production'. in M. Fuss and D. IvfcFadden (cds.). Production
Economics: A Dual Approach to TheOl)' (Jl1dApplications. Vol. 1. North-Holland. Amsterdam. pp.219 .. 68
Ooddard, D. (1983), 'An Analysis of Cnnadian Aggregate Demand for Food at Home and
Away trom Bonlt!', C(tnadian Journal of Agricultural Economics, 31 (3), 289~318.
Green. R. and Alston, 1.M. (1990), 'Elasticities in AIDS Models', American Journal of
Agricultural Ecollomics, 72(2), 442-45.
Gujarati, D.N. (1988). Basic Econometrics, Second Edition, McGraw-Hill Book Company,
New York.
Ito. S., Peterson. F., and Grant, W.R. (1989), 'Rice in Asia: Is It Becoming an Inferior
Good?'. American Journal Of Agricultural Economics. 71(1), 32-42.
Johnson, S,R., Hassan, Z.A., and Green, R.D. (1984), Demand Systems Estimation:
Methodfi lind Applications, Iowa State University Press, Ames.
Main, G.W., Reynolds, R.G., nnd White, G.M. (1976). 'Quantity-price Relationships in the
Australian Retail Meal Market', Quarter!,), Review of Agricultural Economics, 29(3), 193-211.

, ,
Majumder,A.(t9S\ )~ ~Cons~mer ExpenditurePattem inlndi.ll:A. CompArisPQof UleAlmost Jdeall)eman.dSY$~e n and ,theLine~'Exp~hdituteSys~m', 8ankya: IniIianJ'Ol{171alof Statistics. 488(1), 115-43.
Martin,WandPonet, D. (1985). 'Testing for Changes in IheStructure ofth~Dernand for. Meat't Allstralitm Jmirna/of AgriculfuralEconomics, 29(1), 16"3L
Mergos, OJ. and Donatos, G~S. (1989), 'Demandfo. Food in Greece: An Almost IdeAl Demand System Analysis1
t Journal of Agricultural Economics, 40(2), 178 .. ,184.
Ministry of Nntional Planning and Finance, Report to the 'P.yitlHl Hlutlaw on the Financiql, Economic and Social Conditions Qfthe Soci(llisl Republic o/the Union of Bur nUl, Rangoon (various iSSllCS from 197410 1988),
Phlips'l L. (1974). Applied ConsumptioN Analysis, North-Holland, Amsterdam.
Raunikar. R. and Huang, C.L. (cds.) (1987), Food Dl'mand Analysis: Problems, Issues, and
Empirical Evid(.lllce~ Iowa State University Press, Ames.
Ray, R. (1980), l Anulysis of a Time Series of Household Expenditure Surveys for India',
Review of Ecollom ic.v and Stalisr;cs\ 62, 595-602.
Suvadogo, K. and Brandt, J.A. (1988). iHousehold Food Demand in Burkina Paso!
Implications for Food Policy't Agricultural Economics, 2, 345-64.
Soc, T. (1991) An Econometric Study of Food Demand in Burm(J~ unpublished Ph.D thesis,
University of Sydnl!Y.
Tomek, W.O. and Robinson, K.L. (1972), Agricultural Product Prices, Cornell University
Press, Ithaca.
Than, M. and T~In. 1.L.H. (1990), 4Introduction: Optimism fOl'Myanmar's Economic
Transition in the 19905 r in .M. Than and I.L.H.Tan (cds).~ A1yallf11ar Dilemmas and Optio1ls:
The Challenges of Economic Trallsition ill the 1990s, ASEAN Economic Research Unit,
InstitUte of South East Asinn Studies. Singnpc)J'c. pp. 1-17.
Whitc t K.J., Wong, S.D., Whist.lef, D., Huun, S.A. (1990). SHAZAM: EC()lwmetrlc
Computer Ptogrmn; User's Reference Manual Version 6.2, McGraw-Hill. New York.