Definitive guide-to-marketing-metrics-marketing-analytics-130310111551-phpapp02

www.sisense.com
Whitepaper
The Definitive Guide to Marketing Dashboards

www.sisense.com
Big data should be a marketer’s best friend. We now know more
about our prospects, customers, campaigns and marketplace than
ever before. Think about the customer data collected today – online
browsing data, click through rates, social media behavior, mobile
device usage, location data, and these are just the tip of the iceberg.
Having more data doesn’t necessarily mean we are getting better at
using that data. The raw material is there but what we do with it is the
challenge.
This document walks marketers through the importance of metrics
and KPIs and then goes through the five secrets to creating powerful
and effective marketing dashboards.
Selecting the scope of the data covers your first two tips and explains
the difference between breadth and depth of data and the power of
the data source mash-up. Having independence to adapt and evolve
your reports without IT intervention will give you the flexibility and
agility you need to be responsive to market and organizational need.
Using presentation tips and accessibility and interactivity will keep
your dashboards alive long after they are taken out of the conference
room.

www.sisense.com
Here are the 5 secrets to help you craft an elegant, effective
marketing dashboard:
The Importance of Metrics and KPIs The field of marketing has shifted from a feel-good field of branding
and awareness where success was measured by vague
measurements like how favorably someone thought of your brand, to
a scientific field based on precise metrics and optimizations where
measurements and insight are now mandatory tactics. To keep your
executives calm and your marketing team focused, you need a
marketing dashboard based on key marketing metrics that is used as
the foundation for all decision making.
Regardless of what field of marketing you find yourself dealing with,
whether it be digital marketing, marketing communication, PR or
corporate marketing, marketing metrics, or KPIs (Key Performance
Indicators) generally fall into one of four categories:
1. Consumption metrics –
This is simply how many
people have seen your
campaign or content.
This is the most basic
metric and often as far
as metrics go. In the
online world, this can be measured relatively easily by using free
www.sisense.com
tools such as Google Analytics. Common metrics would be page
views, time on page, click through rate or downloads. This can be
slightly more challenging for offline campaigns but can be
measured by in-store visits, in-bound phone calls etc.
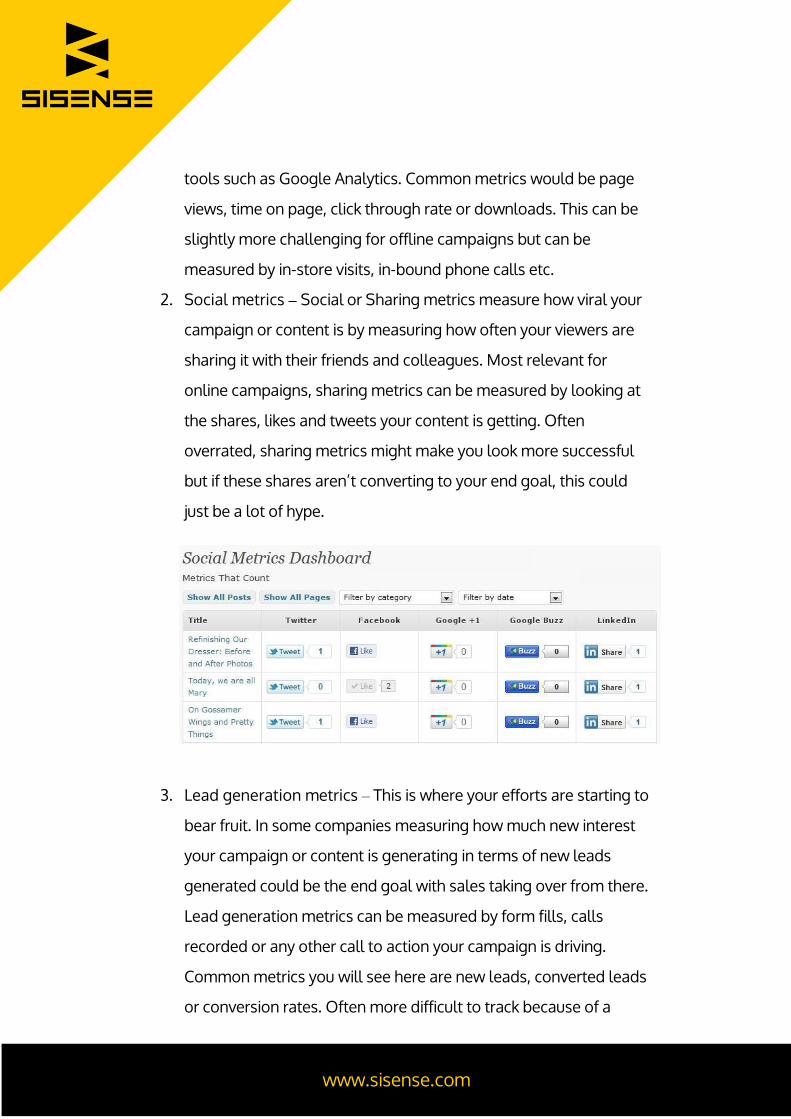
2. Social metrics – Social or Sharing metrics measure how viral your
campaign or content is by measuring how often your viewers are
sharing it with their friends and colleagues. Most relevant for
online campaigns, sharing metrics can be measured by looking at
the shares, likes and tweets your content is getting. Often
overrated, sharing metrics might make you look more successful
but if these shares aren’t converting to your end goal, this could
just be a lot of hype.
3. Lead generation metrics – This is where your efforts are starting to
bear fruit. In some companies measuring how much new interest
your campaign or content is generating in terms of new leads
generated could be the end goal with sales taking over from there.
Lead generation metrics can be measured by form fills, calls
recorded or any other call to action your campaign is driving.
Common metrics you will see here are new leads, converted leads
or conversion rates. Often more difficult to track because of a

www.sisense.com
user’s meandering, exact source is the only way to attribute
revenue to a specific campaign and this is where tracking
parameters and cookies come into play.
4. Sales metrics – In
many traditional
organizations,
marketing’s impact
is measured up
until new lead is
created at which
point the sales team takes responsibility. In today’s cutting edge
organizations, the entire revenue cycle is measured in one set of
funnel conversions where the team is responsible for the entire
cycle from lead generation to deal closed. Organizations with this
priority are using integrated lead collection, marketing automation
and Customer Relationship Management (CRM) tools such as
Marketo and Salesforce.com and are continuously measuring and
optimizing the entire cycle. Common metrics measured in these
organizations include conversion rate, lead to close ratio, cost per
lead and lifetime lead value.
Agreeing to and measuring a relevant set of metrics is fundamental to
understanding the success and failure of a campaign and an entire
marketing team. Dashboards that are accessible to all team
members, as well as to management, become the lifeblood of the
marketing team.

www.sisense.com
But how often have you presented an agreed upon dashboard only to
be asked for additional data points or for a dissection of the data in
ways you hadn’t anticipated?
The true power of metrics and dashboards is the confidence of having
a single source of truth and the ability to drill down or step back to
view a big picture perspective of the data. Marketers need to develop
a more valuable and insightful dashboard that can be used to
optimize performance and make actionable decisions. This kind of
dashboard needs to provide an accurate summary of the key metrics
and KPIs that quantify the overall impact marketing is having on the
business.
Our team of experienced designers and data scientists have teamed
up to focus on what they believe to be the 5 laws of creating effective
actionable marketing dashboards.
1. Go Deep – In Marketing, History is Everything Marketers are collecting more data than ever and reporting on it,
which is good. Less positive is the way marketers are often forced to
look at the end metrics rather than the velocity or time based metrics.
www.sisense.com
According to Denis Pombriant of Social Methods, over two thirds of
marketers do not have the data on hand to be able to measure trends.
Due to storage space limitations most marketers are forced to store a
single point in time for a lead or campaign rather than tracking change
over time. Instead of saving an additional data point for each update,
most marketers overwrite old data losing the precious ability to
measure velocity and change.
The issue is that as data sets get larger and more complex, many
tools start slowing down or failing completely. If you are part of the
one third of marketers who are actually saving all these data points,
you don’t want to be limited by the strength of your analytics tool
when it comes time to crunch those numbers and view trends at
decision time.
2. Go Wide – Mash-up as Many Data Sources as Relevant In today’s marketing environment, where everything can and is being
measured, marketers need to be able to juggle multiple tools to
collect the relevant campaign data they need to run their day-to-day
business. According to Kelton Research as reported by eMarketer, the
average marketers uses 5-6 marketing tool to execute and measure a
typical marketing campaign. This is no easy task considering most of
these tools come from different vendors and integration of the data
across platforms can be complicated or often impossible.

www.sisense.com
Think about the types and masses of data you are collecting on a daily
basis. If you have a website and web analytics software like Google
Analytics, you are collecting website traffic data. More and more
marketers are using marketing automation tools like Marketo or
Eloqua to collect data about leads and campaigns. Many marketers
today depend on CRM (Customer Relationship Management) tools
like Salesforce.com to measure what happens to campaigns after
they are passed on to the sales team. The list goes on and on.
The real strength in analyzing these data sources is the ability to
aggregate this data into a single dashboard. How many organic leads
responded to a specific campaign and converted to a qualified lead?
With this much data available it would be virtually impossible to
define in advance all the angles you will want to investigate. You need
an analytics tool that will give you the flexibility to look at the data
from every perspective without needing to recompile the data.

www.sisense.com
3. Stay Independent – Don’t Depend on IT Resources Marketing is a dynamic and fast paced field. When a marketing
opportunity arises it often needs to be acted on immediately to be
effective. Any delay in immediate action can be the difference
between success and failure.
Let’s say you want to create a new marketing dashboard that proves
to management that attending weekly webinars has a positive effect
on the sales cycle. First, figure out a way to get your webinar
attendance data to mash-up with your lead and sales CRM database.
If the two platforms aren’t already integrated you’d have to go to the
IT department and request development time, get added to the task
queue and wait…
What if you could just click and drag a new data source and mash it up
with your current database with no IT interference? This would give
you the flexibility and agility to respond quickly to marketing needs
and stay a step ahead of your competitors. Being dependent on an IT
department will cripple your ability to execute.

www.sisense.com
Diagram 3.1: Adding new data sources in Sisense is as easy as click and drag without
requiring IT resources
4. Be Sexy – Focus on Powerful and Meaningful Design A dashboard’s function is to display a dense array of information in a
small amount of space in a manner that communicates clearly and
immediately. To achieve this, a dashboard must leverage the power of
visual perception and the ability for people to sense and process
information quickly. Dashboards can only be successful when the
visual design is central to the development process.
People tend to believe that dashboards must look flashy, filled with
pretty colors and graphics. Only those who cut through the hype and
learn practical dashboard design concepts will produce dashboards
that actually work.

www.sisense.com
A few pointers about beautiful and inviting dashboards.
A picture is worth a thousand words – Rather than trying to
convince with words or a lot of numbers and charts, use graphics,
colors, images or illustrations to demonstrate what you mean.
Priorities must stand out at first glance – Don’t show 5 metrics
that all point to the same conclusion when you can use one metric
to make your point.
Don’t confuse good and bad – Make sure to use visualization keys
to demonstrate the good and bad news you are presenting.
Trends or KPIs - Be frugal about the amount of information you are
presenting. Determine when it makes sense to use a trend report
versus a single KPIs.
Diagram 4.1: A SIsense graphical dashboard allows you to represent large quantities of data in a way that is easy to digest and understand.

www.sisense.com
5. Be Engaging – Design for Interactivity Marketing is an integrated effort that requires consolidating many
moving pieces to get a clear view of your company’s performance.
Any successful marketer knows that to be successful, you need to
constantly measure, assess, and refine your campaigns. To do that,
you need to be equipped with the latest and most relevant marketing
KPIs.
Agreeing in advance on a base set of KPIs is good practice, but how
often have you presented a dashboard only to be faced with
additional questions you may not have answers to at the tip of your
fingers? After your meeting, everyone will go back to their desks and if
you’re lucky, some might go back to your dashboards to delve deeper
into what you presented. At that point they will have their own
questions and areas they want to investigate more thoroughly.
Customizable dashboards allow viewers the ability to tweak your
dashboards to get the information they need. By filtering and drilling
down, viewers can go from big picture to details and get the
information they need to get their jobs done.

www.sisense.com
Diagram 5.1: Dashboard that can be manipulated by date, region and adgroup allows users to deepen their perspective on the data at their convenience.
Final Thoughts While there is no single solution for all the challenges in measuring
marketing campaigns, there is overwhelming agreement that metrics
and KPIs must be used to measure day-to-day marketing activities to
improve performance. Marketing Dashboards provide a holistic
framework to organize and measure the increasing number of
complex marketing activities while providing management with the
data, metrics and KPIs they need to measure performance.
Keeping these 5 guidelines in mind will help ensure you are
presenting the most effective marketing dashboards.

www.sisense.com
Next Steps
Try Sisense for FREE
Join a Sisense Analytics Expert for a Weekly Live Demo
Contact us