The Deep Impact crater on 9P/Tempel-1 from Stardust-NExT · 2013-07-25 · The Deep Impact crater...
14
The Deep Impact crater on 9P/Tempel-1 from Stardust-NExT Peter H. Schultz a,⇑ , Brendan Hermalyn a , Joe Veverka b a Department of Geological Sciences, Box 1846, Brown University, Providence, RI 02912, USA b Center for Radiophysics and Space Research, Cornell University, Ithaca, NY 14853, USA article info Article history: Available online 19 June 2012 Keywords: Impact processes Comet Tempel-1 Geological processes Comets abstract The Stardust-NExT (SdN) mission returned to Comet 9P/Tempel-1 and viewed the site of the Deep Impact (DI) collision just over one comet year later. Comparisons between pre-impact images from the ITS cam- era on the DI probe and SdN images reveal a 50 m-diameter crater surrounded by a low rim about 180 m in diameter. The removal of a small mound uprange (but offset from the trajectory) from the impact site can be related to changes in the evolution of ejecta. A narrow (6°) gap in the ejecta curtain downrange indicates that a ridge extending from the impact-facing scarp downrange interrupted the final stages of cratering in one small region. Together, these observations indicate that the DI excavation crater diam- eter was about 200 m (±20 m), a value consistent with the ejected mass derived from Earth- and space- based observations with the assumption that this mass represents only 10–20% of the total ejected mass. As a result, the DI crater visible today is consistent with either a larger transient crater, which collapsed, or a central crater of a nested crater resembling an inverted sombrero. The latter alternative would be expected from a layered target: a loose particulate surface about 1–2 m deep over a slightly more com- petent substrate. Ó 2012 Elsevier Inc. All rights reserved. 1. Introduction The Deep Impact (DI) mission guided a 370 kg probe into the nucleus of Comet 9P/Tempel-1. The cratering experiment exposed material from depth, allowing spectral observations of pristine, subsurface ices and dust from the nucleus of a comet for the first time (A’Hearn et al., 2005). Measurements of the distinctive evolu- tion of the ejecta from the cratering process itself (Schultz et al., 2007) and the gravity-controlled advance of the ejecta curtain (e.g., A’Hearn et al., 2005; Richardson et al., 2007) provided the first constraints on the bulk density of the nucleus. One of the secondary goals of the DI mission was to assess sur- face properties from the size of the final crater. Fine ballistic dust rising from the impact site, however, obscured the crater from view throughout the entire approach. While disappointing, this re- sult was not entirely unexpected. The formation of a high-angle plume matched a pre-encounter scenario: a nucleus covered by fine-grained, under-dense, and highly compressible particulates (Schultz et al., 2005). This scenario also predicted an initially faint impact flash followed by a delayed brightening, as was observed (Ernst and Schultz, 2007). The return to 9P/Tempel-1 by the Star- dust-NExT (SdN) mission (Veverka et al., 2013) was an unprece- dented opportunity to assess both the changes to the nucleus and the appearance of the crater 5.5 years after the Deep Impact encounter. Because of uncertainties in the rotation rate of the nu- cleus, observations of the crater were not raised to the level of a primary objective. In this contribution, we first review the location of the impact point on the surface. Second, we compare features before (DI) and after (SdN) the collision. Third, we consider the possible size and evolution of the DI impact crater from SdN images. For refer- ence, Fig. 1 provides two sets of stereo images covering the side of 9P Tempel-1 observed during the Deep Impact encounter in 2005. Several questions are to be addressed. 1. What is the nature of the DI crater and its surroundings and how has it changed? Here we directly compare pre-impact DI images from the High-Resolution Instrument (HRI) with images from the Impactor Targeting Sensor (ITS) and assess the maxi- mum size of the crater. 2. Where was the impact point? This discussion is necessary in order to understand the initial conditions and to place the evolving cratering process and the observed ejecta in context. A separate contribution (Wellnitz et al., 2012) sets quantitative limits on this determination. 3. Is there evidence for remaining ejecta from the DI crater? 4. Did the transient crater change immediately after formation? Or did the final crater change over one comet-year (just over one orbit around the Sun)? Since the DI imaging data set is essential for interpretation of some of the features imaged by SdN, we include discussion 0019-1035/$ - see front matter Ó 2012 Elsevier Inc. All rights reserved. http://dx.doi.org/10.1016/j.icarus.2012.06.018 ⇑ Corresponding author. Fax: +1 401 863 3978. E-mail address: [email protected] (P.H. Schultz). Icarus 222 (2013) 502–515 Contents lists available at SciVerse ScienceDirect Icarus journal homepage: www.elsevier.com/locate/icarus
-
Upload
vuongnguyet -
Category
Documents
-
view
212 -
download
0
Transcript of The Deep Impact crater on 9P/Tempel-1 from Stardust-NExT · 2013-07-25 · The Deep Impact crater...
Icarus 222 (2013) 502–515
Contents lists available at SciVerse ScienceDirect
Icarus
journal homepage: www.elsevier .com/ locate/ icarus
The Deep Impact crater on 9P/Tempel-1 from Stardust-NExT
Peter H. Schultz a,⇑, Brendan Hermalyn a, Joe Veverka b
a Department of Geological Sciences, Box 1846, Brown University, Providence, RI 02912, USAb Center for Radiophysics and Space Research, Cornell University, Ithaca, NY 14853, USA
a r t i c l e i n f o
Article history:Available online 19 June 2012
Keywords:Impact processesComet Tempel-1Geological processesComets
0019-1035/$ - see front matter � 2012 Elsevier Inc. Ahttp://dx.doi.org/10.1016/j.icarus.2012.06.018
⇑ Corresponding author. Fax: +1 401 863 3978.E-mail address: [email protected] (P.H. Sc
a b s t r a c t
The Stardust-NExT (SdN) mission returned to Comet 9P/Tempel-1 and viewed the site of the Deep Impact(DI) collision just over one comet year later. Comparisons between pre-impact images from the ITS cam-era on the DI probe and SdN images reveal a 50 m-diameter crater surrounded by a low rim about 180 min diameter. The removal of a small mound uprange (but offset from the trajectory) from the impact sitecan be related to changes in the evolution of ejecta. A narrow (6�) gap in the ejecta curtain downrangeindicates that a ridge extending from the impact-facing scarp downrange interrupted the final stagesof cratering in one small region. Together, these observations indicate that the DI excavation crater diam-eter was about 200 m (±20 m), a value consistent with the ejected mass derived from Earth- and space-based observations with the assumption that this mass represents only 10–20% of the total ejected mass.As a result, the DI crater visible today is consistent with either a larger transient crater, which collapsed,or a central crater of a nested crater resembling an inverted sombrero. The latter alternative would beexpected from a layered target: a loose particulate surface about 1–2 m deep over a slightly more com-petent substrate.
� 2012 Elsevier Inc. All rights reserved.
1. Introduction encounter. Because of uncertainties in the rotation rate of the nu-
The Deep Impact (DI) mission guided a �370 kg probe into thenucleus of Comet 9P/Tempel-1. The cratering experiment exposedmaterial from depth, allowing spectral observations of pristine,subsurface ices and dust from the nucleus of a comet for the firsttime (A’Hearn et al., 2005). Measurements of the distinctive evolu-tion of the ejecta from the cratering process itself (Schultz et al.,2007) and the gravity-controlled advance of the ejecta curtain(e.g., A’Hearn et al., 2005; Richardson et al., 2007) provided the firstconstraints on the bulk density of the nucleus.
One of the secondary goals of the DI mission was to assess sur-face properties from the size of the final crater. Fine ballistic dustrising from the impact site, however, obscured the crater fromview throughout the entire approach. While disappointing, this re-sult was not entirely unexpected. The formation of a high-angleplume matched a pre-encounter scenario: a nucleus covered byfine-grained, under-dense, and highly compressible particulates(Schultz et al., 2005). This scenario also predicted an initially faintimpact flash followed by a delayed brightening, as was observed(Ernst and Schultz, 2007). The return to 9P/Tempel-1 by the Star-dust-NExT (SdN) mission (Veverka et al., 2013) was an unprece-dented opportunity to assess both the changes to the nucleusand the appearance of the crater 5.5 years after the Deep Impact
ll rights reserved.
hultz).
cleus, observations of the crater were not raised to the level of aprimary objective.
In this contribution, we first review the location of the impactpoint on the surface. Second, we compare features before (DI)and after (SdN) the collision. Third, we consider the possible sizeand evolution of the DI impact crater from SdN images. For refer-ence, Fig. 1 provides two sets of stereo images covering the sideof 9P Tempel-1 observed during the Deep Impact encounter in2005. Several questions are to be addressed.
1. What is the nature of the DI crater and its surroundings andhow has it changed? Here we directly compare pre-impact DIimages from the High-Resolution Instrument (HRI) with imagesfrom the Impactor Targeting Sensor (ITS) and assess the maxi-mum size of the crater.
2. Where was the impact point? This discussion is necessary inorder to understand the initial conditions and to place theevolving cratering process and the observed ejecta in context.A separate contribution (Wellnitz et al., 2012) sets quantitativelimits on this determination.
3. Is there evidence for remaining ejecta from the DI crater?4. Did the transient crater change immediately after formation?
Or did the final crater change over one comet-year (just overone orbit around the Sun)?
Since the DI imaging data set is essential for interpretation ofsome of the features imaged by SdN, we include discussion

Fig. 1. Stereo pairs (for stereo viewer) from Stardust-NExT showing the side of 9PTempel-1 viewed by the Deep Impact flyby spacecraft. (a) n30034te01 (L) andn30033te01 (R). (b) n30036te01 (L) and n30035te01 (R).
P.H. Schultz et al. / Icarus 222 (2013) 502–515 503
regarding the cratering process; for a full description of the DI cra-tering experiment see Schultz et al. (2007).
Fig. 2. Stereo pairs (for stereo viewer) of the region where the Deep Impact probeimpacted the surface. The larger crater-like feature near the center is 310 m indiameter. The DI impact occurred about halfway between the two large circularfeatures. (a) n30034te01 (L) and n30033te01 (R); (b) n30036te01 (L) andn30035te01 (R); (c) n30036te01 (L) and n30034te01 (R).
2. The DI impact point and crater feature
Trajectory reconstructions reveal that the DI-Probe struck thesurface at an oblique angle, about 30� from the local horizontal.Although the DI-Flyby spacecraft cameras did not capture the finalcrater in spacecraft images, they did capture successive stages ofcratering expressed by a downrange-moving (and expanding) va-por plume and ballistic ejecta (Schultz et al., 2007). Oblique im-pacts generate separate components in the sequence of ejection,each corresponding to different stages of cratering. These stagesare clearly resolved in both laboratory (Schultz, 1996; Schultzet al., 2005, 2007) and hydrocode experiments (Pierazzo and Me-losh, 1999). Understanding this evolution is important for inter-preting the location of the impact point.
Cratering has several observable stages of formation in additionto the three mechanical stages (compression, excavation, and mod-ification) introduced by Gault et al. (1968). First, the moment ofcontact for a hypervelocity impact generates a plasma travelingdownrange at speeds over three times the initial impact speed (jet-ting stage), as described by Gault and Heitowit (1963), Vickery(1993), Sugita and Schultz (1999). As the projectile (or what’s left)penetrates below the surface drives target material below ordownrange for oblique impacts (compression stage). This becomesa second vapor plume derived from upper surface layers thatmoves rapidly downrange at speeds ranging from 1 to 2 timesthe initial impact speed as observed experimentally (Schultz,1996; Schultz et al., 2006) or in numerical models (Pierazzo andMelosh, 1999). For highly porous targets, a third observable stagealso occurs: a reverse-angle plume that is initially directed uprangebut quickly evolves into a high-angle plume above the growingcrater (Schultz et al., 2005, 2007). The excavation stage comprisesthe fourth stage and represents the growth of the crater (expressedby ballistic ejecta) in response to the rarefaction behind the shockoff the free surface.
Each stage of excavation results in ejecta radiating from differ-ent portions within the final crater corresponding to differentstages of an evolving flow field (Anderson and Schultz, 2006a; Her-malyn et al., 2010). Oblique impacts produce a characteristic zoneof avoidance uprange (Gault and Wedekind, 1978), typically with acurved uprange boundary (Schultz et al., 2005, 2009; Anderson andSchultz, 2006b). The zone of avoidance depends on impact speed,
angle, and the porosity/compressibility of the target (e.g., Andersonand Schultz, 2006a; Wünnemann et al., 2006; Schultz et al., 2007;Elbehausen et al., 2009). Because this zone reflects the asymmetricflow field created during coupling (the transfer of momentum andenergy), it becomes more apparent when the coupling zone, whichis proportional to the projectile diameter (a), comprises a greaterfraction of crater excavation as defined by the final transient craterdiameter (Dc). Cratering efficiency is related to Dc/a and increaseswith decreasing scale, or decreasing gravity (or increasing speed)in loose particulate targets as the result of gravity-limited cratergrowth (e.g., Schmidt and Holsapple, 1980; Schultz, 1992). Crater-ing efficiency also decreases for highly porous targets where com-pression consumes a greater fraction of the excavation stage(Housen et al., 1999; Schultz et al., 2005). For high-angle impactsinto loose particulates, the coupling stage is expressed by evolvingejection angles (Hermalyn and Schultz, 2011) but is overprinted byeach successive stage of crater growth, therefore hidden in theresulting pattern of ejecta. For oblique impacts, however, the cou-pling stage maps across the surface as a zone of avoidance with acurved uprange boundary observed at all scales (Anderson andSchultz, 2006b; Schultz et al., 2007, 2009).

Fig. 3. View of the Deep Impact site from the view of the ITS instrument and likelyimpact site. This close-up composite from the ITS during final approach identifiesthe impact point (white cross), just to one side of a small mound. Because of theapproach trajectory, the image is highly foreshortened.
504 P.H. Schultz et al. / Icarus 222 (2013) 502–515
2.1. Impact point
Multiple image sets, coupled with an understanding the se-quence of cratering, allow pinpointing the impact site within20 m, which then can be compared with the imaging from SdNencounter. Six strategies are used: (1) bore sighting of the cameraon the impact probe (see Wellnitz et al., 2012); (2) impact flash; (3)evolution of the self-luminous vapor plume; (4) shadow of the ini-tial ejecta plume onto the surface; (5) the shadow of an emerginghigh-angle plume onto the interior of the ejecta curtain; and (6)projections of ejecta rays back to the surface. Although some ofthese strategies had been previously presented (Schultz et al.,2007; Ernst and Schultz, 2007), they are re-examined here in orderto demonstrate consistency in the identification of the impactpoint. Common features observed in both the Medium ResolutionImager (MRI) and High-Resolution Imager (HRI) then provide con-straints on crater size through their effects on crater excavation(considered later).
The ITS camera onboard the DI probe provides one of the firstkey observations. This camera was bore-sited along the spacecrafttrajectory, except during the final stages of approach when colli-sions on the spacecraft by dust in the inner coma induced slighttorques and misalignments (see Wellnitz et al., 2012). In between,nested ITS images allow pinpointing the impact site relative toother surface features: on a textured (but flat) surface, just toone side of a small, low relief dark plateau (Fig. 3). Based on thedispersion of center points, this strategy is accurate to within about10 m (cross trajectory), as discussed by Wellnitz et al. (2012). Thelow angle of approach results in considerable foreshortening anduncertainties along the trajectory line from the viewpoint of theITS camera, which contributes to greater uncertainty (20 m) alongthe trajectory.
A second strategy uses the position of ‘‘first light’’ (first appear-ance of the flash) created around the moment of impact (Ernst andSchultz, 2007). Wellnitz et al. (2012) provide additional error barsusing this approach. The identification of the impact point is basedon overlapping a pre-impact HRI image with the edge of the nu-cleus in MRI images. Features can be identified in both the MRIand HRI (Fig. 4). Multiple fiducial points across the nucleus (limb,features) collectively contribute to the location of the first light.The initial brightening is spread over 3 pixels (width and height)with the centroid from all 9 pixels slightly offset (by 50 m) uprangefrom the location based on ITS approach images.
Fig. 4. Location of ‘‘first light’’ superimposed on a pre-impact de-convolved HRI imagefeature, whereas other arrows identify the scarp. The brightest pixel is superimposed oFig. 3. The center of brightness is clearly slightly offset to the upper left, consistent with
A third strategy assesses the evolution of the expanding self-luminous vapor plume. A centroid fit to the plume brightness,however, will not be centered on the impact point due to the rapiddownrange motion of the plume as it expands outwards. Neverthe-less, the source region for the freely expanding vapor plume can beused to identify the first point of contact through comparison withexperiments (e.g., Schultz, 1996; Schultz et al., 2007) and modeling(e.g., Pierazzo and Melosh, 1999). As the vapor plume expands andtravels downrange, its outer boundary appears pinned to near theimpact point. Because the translational speed will be greater thanthe gas expansion speed, however, the plume becomes more elon-gate with time. This process describes the plume from the DI im-pact (Fig. 5a). Differenced images (one image subtracted from theprevious image) reveal this more clearly: the brightest part ofthe self-luminous component appears to cover the 320 m circularstructure uprange of the ITS-located impact point (middle,Fig. 5b). This offset can be understood if the initial plume doesnot correspond to the moment of contact at the surface; rather,it indicates a plume directed back along the trajectory. In labora-tory experiments, reverse plumes are most pronounced for impacts
(left, frame no. 9000910-005, left). Orthogonal arrows locate the 310 m crater-liken an ITS composite view for reference and is close to the projected impact point in
a reverse plume directed back up the trajectory.

Fig. 5. (a) First de-convolved HRI image (frame 9000910-007) showing the impact (left) with mapped features on pre-impact image on the right (frame 9000910-005). Theself-luminous vapor cloud expands above the surface but does not cast a shadow. Ejecta cast a shadow (SE) but is composed of two components: a dense uprange plumeinside a more transparent plume that bulges near the impact. The uprange edge of the densest portion of the high-angle ejecta plume (HAEP) extends back to near the ITSimpact point. (b) Differenced MRI images (MRI frames 900064-63 and 900070-69) superimposed on a pre-impact HRI frame positioned the visible edge. The first differenceimage (center, 64-63) demonstrates that the first light is slightly uprange from the impact point (black dot). The next differenced image (right) reveals brightening uprange(attributed to a reverse plume) along with the leading edge of the downrange vapor plume. These difference images illustrate the difficulty in identifying the impact pointfrom just the first light or expanding plume.
P.H. Schultz et al. / Icarus 222 (2013) 502–515 505
into under-dense and compressible targets and result from impactvapor redirected out of a deep penetration funnel during the initialstages of compression (discussed later). Subsequent differences(right, Fig. 5b) reveal a brightened extension uprange, along withthe expanding plume moving downrange, corresponding to themomentum-controlled vapor plume from the cavity. The vaporplume appears to move downward relative to the trajectory. Be-cause the plume travels along the local surface (while expandingabove), this displacement indicates that the impact occurred on arelatively flat surface. If the impact had first struck a facing slope,the plume would have been deflected from the trajectory line. Con-sequently, comparison between the first light and the evolution ofthe self-luminous component cannot determine the impact pointto better than about 50 m on the surface (between the two circularfeatures) but is consistent with determinations from bore sightingin the ITS camera.
Fourth, a shadow of the emerging high-angle plume on the sur-face can be traced back to the trajectory line within the first fewseconds of impact (Fig. 5a). The shadow cast across the surfaceconfirms the presence of optically thick, high-angle ejecta (notthe vapor plume). Conversely, the absence of a shadow during first5 frames after impact is consistent with optically thin vapor (orexpansion above/beyond the surface). The shadow has a dense up-range edge corresponding to a high-angle ejecta plume (HAEP)extending from the crater. Its extension back to the impact site alsoindicates an impact point consistent with the ITS approach imag-ing. Later (�135 s after impact), a high-angle plume emerges (orbecomes clearer during approach) and casts a long, straight sha-dow on the interior of the ejecta curtain (Fig. 6b), which representsa fifth strategy. This shadow intersects the trajectory and centerswithin ±30 m of the ITS impact point (Fig. 6c and d).
A sixth strategy extends rays back to the initial trajectory at thesurface. Intersections of multiple rays from an HRI deconvolvedimage yield multiple points of convergence (Fig. 7). The crateringflow field, however, evolves downrange for oblique impacts(Anderson et al., 2003); consequently, convergence on a singlepoint should not be expected. Tracing rays from the uprange com-ponent requires using only the ray segment closest to the surface(closest to the trajectory), where it is radial to the crater. Fartherfrom the impact, the evolving flow field results in a curved ray pat-tern. The uprange ray segment represents the best locator for theimpact point because the center of the ejecta curtain progressesdownrange throughout crater growth (Schultz et al., 2007). Wellafter crater formation (>150 s after impact), rays will not convergeon the crater but on the base of the ejecta curtain. For a vertical im-pact, the base of the advancing curtain maps as a widening concen-tric circle through time. For an oblique impact into particulatetargets, however, this circle centers migrates downrange fromthe crater but remains close to the uprange rim. An oblique impactinto an under-dense particulate target results in an impact pointlocated near the uprange wall of the final crater, whereas the wid-ening circle (corresponding to the base of the ejecta curtain) is pin-ned to the uprange wall (Schultz et al., 2007). Consequently,determining the impact point from the convergence of crater raysis not be useful, except at early times of crater formation or fromuprange-ray segments near the crater. Even then, the inferred im-pact point will be offset downrange.
In summary, these six different strategies yield very similar re-sults for the impact point within about 25 m with the best deter-mination from ITS imaging data and telemetry (Wellnitz et al.,2012). Simple geometric methods (e.g., centroid of brightness oraveraged ray convergence) will not yield an accurate location, even

Fig. 6. Deconvolved image (hv-9000943) about 135 s after impact revealing the emergence of a narrow shadow cast onto the inside of the ejecta curtain (a) and mapped ontothe surface using feature landmarks (b). Mapping onto a pre-impact HRI image (c) and correlated ITS image (d) reveals that the shadow corresponds to a plume extendingbetween the impact site and the downrange facing scarp.
506 P.H. Schultz et al. / Icarus 222 (2013) 502–515
though statistical uncertainties can be determined. Rather, pin-pointing the location of first contact requires a self-consistentmodel of crater excavation from an oblique impact.
2.2. DI crater and Its surroundings
At closest approach to the nucleus of 9P Tempel-1, the SdNimaging system achieved a resolution of �11 m/pxl, while a work-ing resolution 2.2 pixels is needed in order to resolve features.Fig. 8 allows direct comparison between the pre-impact ITS andSdN images. The ITS approach images have much higher spatialresolution just before impact; nevertheless, small features closeto the resolution limit can be readily identified in SdN images withappropriate image processing (logarithmic stretches and filtering).Certain regions appear to have changed, such as the disappearanceof two patches slightly offset and uprange from the impact point(A–C, Fig. 8a). A third bright patch now missing was on a facingscarp (D, Fig. 8b). While other bright patches of similar size canidentified in both SdN and DI images, these three patches nearthe impact site have disappeared. The disappearance of the featureD along the scarp in the SdN images may be due to a shift in thelocal phase angle. This scarp was in sunlight and viewed face onduring the DI encounter. During the SdN flyby, it was in shadowand viewed from above.
Based on the convergence of methods (discussed above), theimpact point was just to the right of a small, dark mound (crossin Fig. 8). Interestingly, this small mound now appears very muted,at best. This loss of expression is not attributed to differences inresolution since comparable-scale features can be identified else-
where in the two images. In addition, a feature extending fromthe scarp downrange appears less pronounced. The SdN missionprovided multiple viewing angles of the DI site. As a result, succes-sive images with changing phase angles and emission angles pro-vide much greater confidence in the identification of a subtle(but obvious) 50 m-diameter dimple at the location of impact(Fig. 9, also revealed by stereoscopic viewing in Fig. 2). Althoughthe best resolution for NExT images is only 11 m/pxl, the workingresolution is typically cited as 2.25 times imaging resolution (or�25 m/pxl) when applied to the identification of features. In prac-tice, however, the identification of craters depends on local slopevariations and reduces to 5–8 times the imaging resolution(Schultz, 1977). Even though the identified crater is close to thelimiting resolution, it is visible both in successive views of the re-gion and in stereo. Stereo images and different viewing angles alsoreveal a subtle arc consistent with a low-relief outer rim (about180 m in diameter) that overlaps the region with the missingmound labeled in Fig. 10. This feature was absent in the pre-impactITS imaging (Fig. 3). As pointed out by Minnaert (1954), linear fea-tures can be resolved well below the resolution limit (e.g., tele-phone wires); consequently, it is reasonable to assume that thisis a real feature. Further interpretations of these two features areincluded in the following section.
3. Discussion
Although SdN images did not reveal a large, deep crater, thereare four explanations. First, the crater was small due to unique
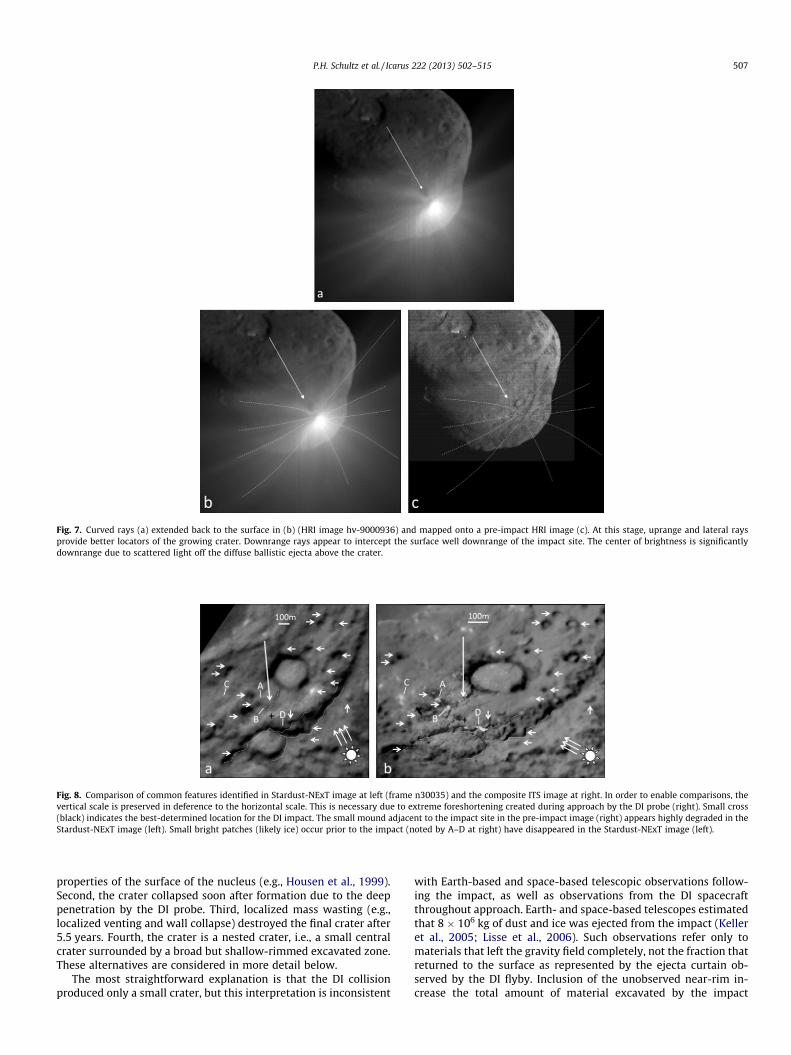
Fig. 7. Curved rays (a) extended back to the surface in (b) (HRI image hv-9000936) and mapped onto a pre-impact HRI image (c). At this stage, uprange and lateral raysprovide better locators of the growing crater. Downrange rays appear to intercept the surface well downrange of the impact site. The center of brightness is significantlydownrange due to scattered light off the diffuse ballistic ejecta above the crater.
Fig. 8. Comparison of common features identified in Stardust-NExT image at left (frame n30035) and the composite ITS image at right. In order to enable comparisons, thevertical scale is preserved in deference to the horizontal scale. This is necessary due to extreme foreshortening created during approach by the DI probe (right). Small cross(black) indicates the best-determined location for the DI impact. The small mound adjacent to the impact site in the pre-impact image (right) appears highly degraded in theStardust-NExT image (left). Small bright patches (likely ice) occur prior to the impact (noted by A–D at right) have disappeared in the Stardust-NExT image (left).
P.H. Schultz et al. / Icarus 222 (2013) 502–515 507
properties of the surface of the nucleus (e.g., Housen et al., 1999).Second, the crater collapsed soon after formation due to the deeppenetration by the DI probe. Third, localized mass wasting (e.g.,localized venting and wall collapse) destroyed the final crater after5.5 years. Fourth, the crater is a nested crater, i.e., a small centralcrater surrounded by a broad but shallow-rimmed excavated zone.These alternatives are considered in more detail below.
The most straightforward explanation is that the DI collisionproduced only a small crater, but this interpretation is inconsistent
with Earth-based and space-based telescopic observations follow-ing the impact, as well as observations from the DI spacecraftthroughout approach. Earth- and space-based telescopes estimatedthat 8 � 106 kg of dust and ice was ejected from the impact (Kelleret al., 2005; Lisse et al., 2006). Such observations refer only tomaterials that left the gravity field completely, not the fraction thatreturned to the surface as represented by the ejecta curtain ob-served by the DI flyby. Inclusion of the unobserved near-rim in-crease the total amount of material excavated by the impact
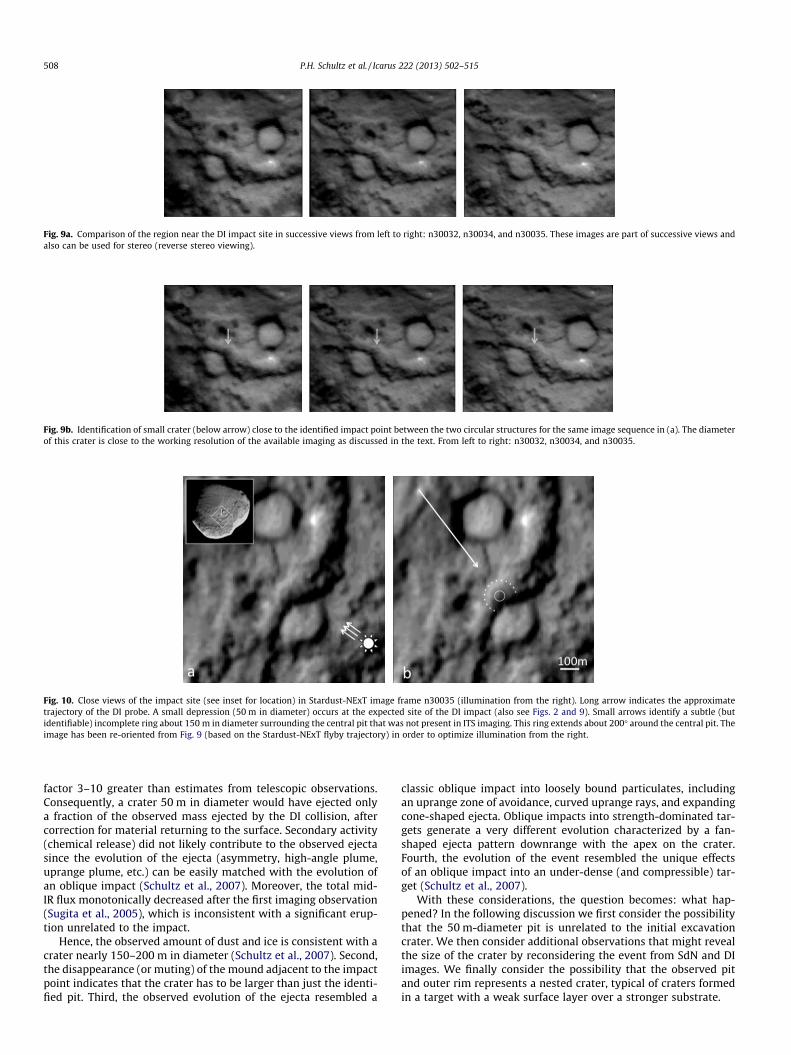
Fig. 9a. Comparison of the region near the DI impact site in successive views from left to right: n30032, n30034, and n30035. These images are part of successive views andalso can be used for stereo (reverse stereo viewing).
Fig. 9b. Identification of small crater (below arrow) close to the identified impact point between the two circular structures for the same image sequence in (a). The diameterof this crater is close to the working resolution of the available imaging as discussed in the text. From left to right: n30032, n30034, and n30035.
Fig. 10. Close views of the impact site (see inset for location) in Stardust-NExT image frame n30035 (illumination from the right). Long arrow indicates the approximatetrajectory of the DI probe. A small depression (50 m in diameter) occurs at the expected site of the DI impact (also see Figs. 2 and 9). Small arrows identify a subtle (butidentifiable) incomplete ring about 150 m in diameter surrounding the central pit that was not present in ITS imaging. This ring extends about 200� around the central pit. Theimage has been re-oriented from Fig. 9 (based on the Stardust-NExT flyby trajectory) in order to optimize illumination from the right.
508 P.H. Schultz et al. / Icarus 222 (2013) 502–515
factor 3–10 greater than estimates from telescopic observations.Consequently, a crater 50 m in diameter would have ejected onlya fraction of the observed mass ejected by the DI collision, aftercorrection for material returning to the surface. Secondary activity(chemical release) did not likely contribute to the observed ejectasince the evolution of the ejecta (asymmetry, high-angle plume,uprange plume, etc.) can be easily matched with the evolution ofan oblique impact (Schultz et al., 2007). Moreover, the total mid-IR flux monotonically decreased after the first imaging observation(Sugita et al., 2005), which is inconsistent with a significant erup-tion unrelated to the impact.
Hence, the observed amount of dust and ice is consistent with acrater nearly 150–200 m in diameter (Schultz et al., 2007). Second,the disappearance (or muting) of the mound adjacent to the impactpoint indicates that the crater has to be larger than just the identi-fied pit. Third, the observed evolution of the ejecta resembled a
classic oblique impact into loosely bound particulates, includingan uprange zone of avoidance, curved uprange rays, and expandingcone-shaped ejecta. Oblique impacts into strength-dominated tar-gets generate a very different evolution characterized by a fan-shaped ejecta pattern downrange with the apex on the crater.Fourth, the evolution of the event resembled the unique effectsof an oblique impact into an under-dense (and compressible) tar-get (Schultz et al., 2007).
With these considerations, the question becomes: what hap-pened? In the following discussion we first consider the possibilitythat the 50 m-diameter pit is unrelated to the initial excavationcrater. We then consider additional observations that might revealthe size of the crater by reconsidering the event from SdN and DIimages. We finally consider the possibility that the observed pitand outer rim represents a nested crater, typical of craters formedin a target with a weak surface layer over a stronger substrate.

Fig. 11a and b. MRI image of 9P/Tempel-1 during close approach (9001060) around 800 km from the nucleus processed to reveal surface features though the ejecta. At right,labels assist in identifying key features including: the trajectory mapped onto the surface (solid line); surface normal; ray trace reflected off the impact point (RT); and thesurface normal at the point of impact. Images have been logarithmically stretched in order to reveal underlying surface features.
P.H. Schultz et al. / Icarus 222 (2013) 502–515 509
3.1. Crater collapse
In very weakly bonded particulate targets, the crater profilemay be unstable and collapse immediately after formation (e.g.,Schultz et al., 2005, 2007). For oblique impacts, this instability re-sults from deep initial penetration by the projectile and a highlysteepened uprange wall, both resulting in wall collapse. Laboratoryexperiments using a target of fine microspheres, for example, com-pletely removed the evidence for the excavation crater, leaving be-hind a small central dimple. In these experiments, crater collapseengulfed near-rim ejecta and re-filled the initial cavity. Similarly,impacts into fine-grained, under-dense (sieved) perlite targets alsoresult in collapse immediately after formation (Schultz et al.,2005).
The observed high-angle ejecta plume (Fig. 5) indicates contin-ued upward flow, which would reduce wall support and triggersubsequent wall collapse. The high-angle plume could have re-sulted from either cavitation of gas within the initial penetrationfunnel or a sustained response by chemical and thermal reactionsassociated with heated relicts of the deeply embedded DI probe. Ineither case, wall collapse would have occurred, even if the tran-
Fig. 11c. Stereo pair (for stereo viewer) of MRI images just before going into shieldmode. There are two shadows extending from the impact point to the lower right,which creates the curved appearance. The shadow closest to the impact is cast ontothe interior of the ejecta curtain; farther away, the shadow on the surface emergesthrough the ejecta. Also note the narrow gap in the curtain downrange. MRI frames9001051 (left) and 9001063 (right).
sient crater exhibited a typical crater profile with a 3:1–5:1 diam-eter-to-depth ratio. With this interpretation, the final crater foundin SdN images places few constraints on the excavation crater,while the missing mound implicates a large transient cavity.
3.2. Constraints on initial crater size
The closest approach to the nucleus by the DI flyby providedclear evidence of a large crater because ballistic ejecta continuedto fill half of the field of view and obscured underlying topographymore than 700 s after impact (Fig. 11a). Fig. 11a provides an un-annotated view, whereas Fig. 11b identifies key features of theejecta curtain. Comparison between surface features before andafter the impact reveals that the ejecta are optically thick at least0.5 km above the surface if viewed face on and to much greater dis-tances from the surface if viewed down, along the curtain in theforeground (Fig. 12). The amount of obscuration 6–10 crater diam-eters above the surface is inconsistent for a small crater (only 50 min diameter); rather, this is consistent with a larger crater, two tothree crater diameters above the surface. The stereo view(Fig. 11c and d) early on reveals two shadows emerging from theimpact site from a high-angle ejecta plume: one cast on the interiorof the ejecta curtain, the other revealed below on the surface as thecurtain became transparent farther away.
Co-location of features in pre- and post-impact images appearsto constrain the impact point within 50 m (Fig. 13a). Ballistic ejectarays projected back to the surface converge on an elliptical foot-print at the surface but significantly downrange from the impactpoint, based on other strategies (discussed above). At this time,however, the ellipse corresponds to the base of the ejecta curtain,rather than the final crater. A high-angle plume casts a shadow onthe interior of the ejecta curtain (solid line) and hides the actualcontact between curtain and the surface. The darkened region tothe left of the trajectory, however, represents the shadowed baseextending beyond the edge of the high-angle plume and is takento be the approximate diameter (�370 m ± 50 m) of the ejecta cur-tain at this time. When projected onto feature-correlated SdNimages, the downrange offset of the ejecta curtain becomes obvi-ous (Fig. 13b).
This downrange offset of the ejecta-curtain base reflects an ex-pected evolution of the ejecta curtain in a loose, porous particulatetarget. For vertical impacts, the ejecta-curtain base (or slicethrough the curtain, e.g., Anderson et al., 2004) expands in concen-tric circles centered at the impact point. For oblique impacts, how-ever, the base of the ejecta curtain appears pinned to near the

Fig. 11d. Stereo MRI pair from (c) with dashed lines identifying discrete rays. Darkrays are actually gaps in the ejecta. These gaps disappear toward the surface wherethe ejecta curtain becomes optically thick.
Fig. 12. Comparison of features and terrains identified in the processed MRI image (Fig. 1regions where the ejecta are optically thick, which prevents features on the surface to b
510 P.H. Schultz et al. / Icarus 222 (2013) 502–515
impact point (Schultz et al., 2007). In under-dense (highly porousand compressible) targets, the impact point is just inside the up-range wall, rather than the crater center (Fig. 14a). Similarly, theshadow from the high-angle plume for the DI impact extends backto a point considerably downrange from the impact point(Fig. 13b). This migration reflects the downrange velocity compo-nent of individual particles within the late-stage high-angle ballis-tic plume, a motion also observed in laboratory experiments usinghighly porous and compressible targets (e.g., Fig. 18, Schultz et al.,2007).
Fig. 13b also clearly shows an opaque ray extending uprange.The persistence of this ray suggests that one component of flow re-lates to the initial penetration stage, in addition to both a cavity-di-rected high-angle plume and the inverted cone-shaped ejectacurtain, which widens with time. The initial stages of this processhave been captured in high-speed imaging at the NASA Ames Ver-tical Gun Range (Fig. 14b and c). Hypervelocity impacts (30� at5.3 km/s) into sand result in a brilliant self-luminous vapor plumethat rapidly travels downrange, transitioning to low-angle ejectainitially directed downrange (Fig. 14b). Ejection angles graduallysteepen and become more symmetrical. For a layered perlite target(Fig. 14c), the low-impedance of the surface layer initially results
1) and ITS composite (a, right) and Stardust-NExT (b, right). Mapped features reveale identified (black outline).
P.H. Schultz et al. / Icarus 222 (2013) 502–515 511
in a faint flash and downrange-moving self-luminous plume thatcompletely decouples from the rest of excavation. In this experi-ment, a self-luminous uprange plume emerges 100 ls later. Thisreverse plume continues to expand throughout crater growth(e.g., Schultz et al., 2007; Schultz, 2009). At the same time, theopening cavity results in a high-angle plume of ballistic particles.The later re-emergence of the uprange plume for the DI collision(350 s after impact) may indicate gas-driven release from the deeppenetration funnel initially created by the dense DI probe that re-opened after crater excavation had ceased. A separate contributionwill detail factors that control the evolution of the reverse andhigh-angle plume. Here, these experiments illustrate observationsfrom experiments that parallel observations from the DI flyby andprovide evidence that this was a response to the impact.
Two additional observations implicate an excavation cratermuch larger than the relict 50 m-diameter pit. First, the smallmound near the impact point altered the pattern of ballistic ejectauprange. Second, an extension from the scarp downrange from theimpact point created a gap in the ejecta curtain. These two obser-vations document the limit of crater excavation.
For background, Fig. 15 shows a sequence of de-convolved HRIimages during approach (from 8 to about 484 s after impact).
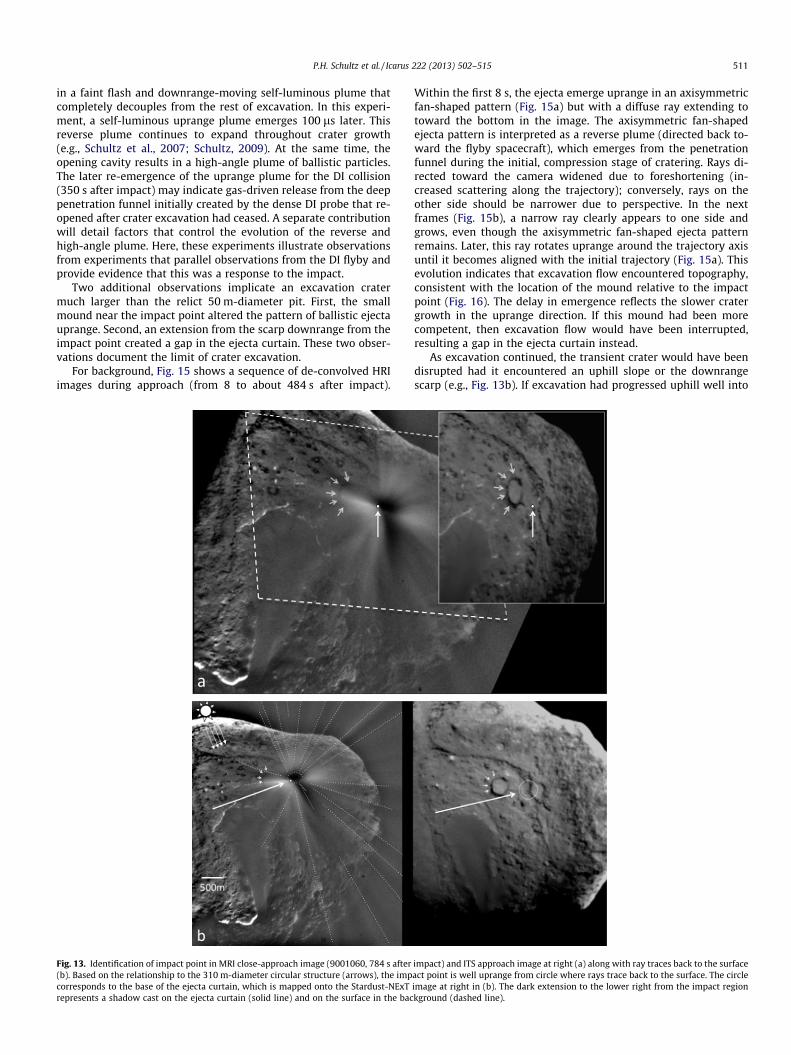
Fig. 13. Identification of impact point in MRI close-approach image (9001060, 784 s after(b). Based on the relationship to the 310 m-diameter circular structure (arrows), the impcorresponds to the base of the ejecta curtain, which is mapped onto the Stardust-NExTrepresents a shadow cast on the ejecta curtain (solid line) and on the surface in the bac
Within the first 8 s, the ejecta emerge uprange in an axisymmetricfan-shaped pattern (Fig. 15a) but with a diffuse ray extending totoward the bottom in the image. The axisymmetric fan-shapedejecta pattern is interpreted as a reverse plume (directed back to-ward the flyby spacecraft), which emerges from the penetrationfunnel during the initial, compression stage of cratering. Rays di-rected toward the camera widened due to foreshortening (in-creased scattering along the trajectory); conversely, rays on theother side should be narrower due to perspective. In the nextframes (Fig. 15b), a narrow ray clearly appears to one side andgrows, even though the axisymmetric fan-shaped ejecta patternremains. Later, this ray rotates uprange around the trajectory axisuntil it becomes aligned with the initial trajectory (Fig. 15a). Thisevolution indicates that excavation flow encountered topography,consistent with the location of the mound relative to the impactpoint (Fig. 16). The delay in emergence reflects the slower cratergrowth in the uprange direction. If this mound had been morecompetent, then excavation flow would have been interrupted,resulting a gap in the ejecta curtain instead.
As excavation continued, the transient crater would have beendisrupted had it encountered an uphill slope or the downrangescarp (e.g., Fig. 13b). If excavation had progressed uphill well into
impact) and ITS approach image at right (a) along with ray traces back to the surfaceact point is well uprange from circle where rays trace back to the surface. The circleimage at right in (b). The dark extension to the lower right from the impact regionkground (dashed line).

Fig. 14a. Evolving ejecta curtain illuminated by a laser-sheet. Image is a compositefrom three different times from a 30� impact into pumice. This illustrates how thebase curtain widens while pinned to near the impact point uprange, therebyresulting in the center of the curtain being offset downrange. A similar evolutioncan be applied to the base of the DI impact ejecta curtain (Fig. 13b).
Fig. 14b and c. High-speed sequence (125,000 frames per second) showing selected imalayer (1.2 cm) of finely sieved perlite (0.12 g/cm3) over the perlite/dolomite mix (c). The100 ls after impact. Double image in the first frame of (b) is an artifact of the imaging
512 P.H. Schultz et al. / Icarus 222 (2013) 502–515
the impact-facing scarp, then the ejecta curtain would have beenaffected. Rarefaction waves off the free surface control ejection an-gles in particulate targets (e.g., Gault et al., 1968). Crater excava-tion progressing into an uphill slope (loose particulates) resultsin the same ejection angles with respect to the local surface. As aresult, ejection angles would be higher with respect to a flat sur-face. From a distance, the ejecta curtain and rays would exhibit adistinct kink or bend. Instead, there is a clear (but narrow) gap inthe ejecta curtain without distorted rays (or curtain).
ITS images more clearly show the ridge-like extension of thescarp approximately in the direction of the impact (Fig. 8b). Be-cause ITS images are highly foreshortened, this feature should bemore pronounced in the post-impact image as viewed from above(Fig. 8a); instead, the extension is barely visible. Consequently,excavation likely reached this feature. A gap in the ejecta curtainwould develop if the transient crater had encountered a changein material properties (e.g., a competent structure): the wider thegap, the greater the interaction with the scarp. Fig. 16b reveals anarrow gap downrange (also see Fig. 11c, stereo; Fig. 12b, left). Be-cause this gap subtends less than 6�, the transient crater just barelygrew into (but was locally arrested by) a material contrast down-range. The interrupted growth correlates with the disappearance
ges of a 30� impact into dry no. 100–140 sand with a density 1.7 g/cm3 (b) and thinimpact into the perlite/dolomite mix resulted in a reverse plume emerging about
system.

Fig. 15. Evolution of the ejecta between 8 s and 484 s after impact. This sequence shows that uprange ejecta evolved from a symmetrical fan-shaped pattern (a–c) to anuprange (UR) arcuate ray (d–e). The UR fan is remains limited in extent due to foreshortening (heading back into the direction of the camera). While the UR rays are initiallysymmetrical (to either side of the trajectory axis in a through c), one UR ray (outward-directed arrow) extends farther to the right of the trajectory in (b through c). This ray isattributed to excavation of the small mound identified in the ITS approach images (e.g., Fig. 3b). HRI frames: 900910 at 8 s after impact (a); 900916 at 18 s (b); 900921at 22 s(c); 900936 at 65 s (d); 900945 at 114 s (e); and 900985 at 484 s (f).
Fig. 16. Connection between emerging uprange ray to one side (UR in a) and downrange gap (b) with surface features in the pre- (c) and post-impact images (c, inset). Thelonger ray to one side is consistent with the intersection of the expanding cavity with the small mound to the left of (and slightly up from) the impact point (IP) in (c) resultingin excavation of additional material in that direction (a, UR). This small mound is missing in the inset from Stardust-NExT. Disruption of the downrange ejecta curtain (b, DR)may be related to interruption of crater growth downrange by an extension of the facing scarp (c), which appears to be partly removed (inset, c).
P.H. Schultz et al. / Icarus 222 (2013) 502–515 513
of a portion of the ridge extending from the scarp downrange.Look-back images 15 min after close approach revealed that thegap widened as the ejecta curtain expanded, as would be expected.The asymmetry in the ejecta curtain at this time was interpreted asa combination of this gap, the rising high-angle plume (above thecrater), and lighting (Schultz et al., 2007). A different interpreta-tion, however, can be found in Richardson et al. (2007).
If these interpretations are correct, then the disrupted flowindicates that the scarp has greater strength than the rest ofthe DI target region, consistent with the resistant terraces and ex-humed terrains in the region. Conversely, the complete obscura-
tion of pre-impact features on the other side of the ejectacurtain is evidence that DI collision generally excavated veryloosely bonded, fine-grained materials. Future reconstructions ofthe event (and viewing positions) would help in refining thisinterpretation.
In summary, the combined modifications to excavation uprange(small mound) and downrange (ridge extending from the scarp) re-quires the excavation crater diameter to be 200 m ± 20 m. Such adiameter is consistent with estimates for telescopically observedejecta mass (>107 kg) lost to space (10–20%) and the estimatedamount of ejecta returning to the surface (80–90%).

514 P.H. Schultz et al. / Icarus 222 (2013) 502–515
3.3. Nested Crater
The faint outer rim (180 m in diameter) identified in differentlook directions (Fig. 9) and stereo images (Fig. 2) resembles nestedcraters found on the Moon (Fig. 17a and b). The detailed evolutionof ejecta captured in DI flyby images prompted the suggestion for a5 m deep layer (Schultz et al., 2007). Ground-based observations(mid-IR) of the evolving dust components also implicated a dustymantle of carbon-rich fine grain surface layer (10’s of cm) over asilicate-rich substrate (Kadono et al., 2007). These two layers, how-ever, likely represent two different processes. A thick (meters) sur-face deposit resulting in a nested crater is consistent withredistribution of materials (e.g., ejecta deposits from the nearbycrater-like features), whereas the dusty mantle developed in situin surface processes while in the trans-Neptunian region. Conse-quently, the stratigraphy at the DI impact site indicates multipleprocesses acting over a wide range of spatial and temporal scales.
On the Moon and in laboratory experiments, nested craters areproduced by impacts into a thin, loose layer of particulates cover-ing a competent substrate (Quaide and Oberbeck, 1968). In thiscase, the classical ejecta curtain still forms, but the width of thecurtain is significantly reduced due to the arrested flow field. Themuted appearance of topography and numerous layers inferredfrom close-up images by the ITS camera during approach indicatethat a similar layering occurs at the DI impact site. Even small con-trasts in target strength should limit downward displacement ofthe low-speed flow field due to the very weak gravity and weak
Fig. 17. Examples of nested craters on the impact melt downrange of King crater on theresults from penetration through a thin regolith into a competent substrate and refledominated more by gravity scaling. For vertical impacts (c), the diameter of the craterregolith) if the layer is less than �2.5 times the projectile diameter. For oblique impacts (hone projectile diameter.
shock conditions at large distances from the impact (porous tar-get). Rather than a solid competent subsurface (as on the Moon),the substrate at the DI impact site simply could be more stronglybonded than a loose surface layer yet still produce a nested crater.
The nested-crater model could account for several observationsof the DI impact crater from SdN. First, the faint narrow rim(Fig. 10) resembles lunar analogs (Fig. 17a). Second, the truncatedcratering flow field during an oblique impact preserves asymmetryin the ejecta throughout crater growth (based on laboratory exper-iments). Third, a layered target would enhance the formation ofarcuate uprange crater rays. Fourth, a slightly more competentsubstrate would ensure a deep penetration funnel by the DI probeand contribute to the late-stage emergence of the reverse plume.And fifth, the ejecta deposits would be thinner (e.g., Fig. 17).
Laboratory experiments reveal that a layer greater than aboutone projectile diameter retains the same diameter as a crater pro-duced completely in the upper layer (Fig. 17b). For the DI nestedcrater, the central pit corresponds to a relict strength-controlledcrater in the substrate, whereas the outer rim represents the grav-ity-limit for the ejecta flow field. Consequently, the diameter of theDI crater would have been about 130–150 m, had it formed inmaterial characterizing the upper layer. The total amount of ob-served ejecta (including unobservable dust returning to the sur-face) is conservatively more than 107 kg. Such observationswould be consistent with a target 1 m-thick layer (outer crater200 m in diameter) or 2 m-thick layer (outer crater 150 m indiameter).
Moon (a and b). Nested craters form by impacts into a layered target. The inner pitcts strength scaling. The outer rim forms by excavation of the overlying regolith,(D) in the regolith is significantly reduced (relative to a diameter, Do, into just theere 30�), the diameter remains the same until the thickness becomes less that about

P.H. Schultz et al. / Icarus 222 (2013) 502–515 515
3.4. Ejecta deposits
The absence of an obvious ejecta blanket or surface alterations(e.g., scouring) created by the downrange expanding vapor plumeor ejecta striking the surface could indicate a very thin ejecta de-posit. Even though small lunar craters exhibit bright or dark rays,the low surface contrast for the near-surface materials on the nu-cleus left little trace. There are hints in SdN images, however.The disappearance of at least three small white patches (Fig. 8a)may be related to the effects of the DI ejecta, whether covered ordisturbed.
This absence of an obvious ejecta deposit is attributed to boththe limits of resolution and the nature of the ejecta (impact-exca-vated ices), which should not persist after 5.5 years. The very lowspeed of ballistic ejecta returning to the surface near the crater(due to the low gravity) also resulted in minimal surface disrup-tion. If the DI collision produced a nested crater, then the ejectathickness should have been thinner than the thickness around anominal crater at the same scaled range due to cylindrical (ratherthan volumetric) crater growth of the transient crater and moredifficult to detect on the surface.
4. Conclusions
The Stardust-NExT was an unprecedented opportunity to assessthe consequences of a hypervelocity impact into an under-densetarget in space. Comparison between clear images of the pre-im-pact surface (ITS camera on the probe) and a record of the ejectionsequence over 15 min (DI flyby) allows inferring the size of the DIcrater and its fate. Four key observations constrain the DI crater:the 50 m pit at the projected impact site; the degradation of sur-face features identified in pre-impact images; the disruption ofthe ejecta curtain downrange; and published estimates for the to-tal amount of ejecta observed during the DI collision. These obser-vations result in two plausible scenarios for the DI crater observedin Stardust-NExT images. First, a large (�200 m in diameter) tran-sient crater collapsed leaving behind a small 50 m pit. Or second,the DI impact produced a nested crater with a small inner pit(�50 m in diameter) surrounded by a shallow excavation crater(�180 m in diameter).
References
A’Hearn, M.F. et al., 2005. Deep Impact: Excavating Comet Tempel-1. Science 310,258–264.
Anderson, J.L.B., Schultz, P.H., 2006a. Flow-field center migration during vertical andoblique impacts. Int. J. Impact Eng. 33, 35–44.
Anderson, J.L.B., Schultz, P.H., 2006b. Flow-field center migration during obliqueimpacts: Implications for curved uprange ejecta rays. Lunar Planet. Sci. 37.Abstract 1726.
Anderson, J.L.B., Schultz, P.H., Heineck, J.T., 2003. Asymmetry of ejecta flow duringoblique impacts using three-dimensional particle image velocimetry. J.Geophys. Res. 108 (E8), 5094, 10.1029/2003JE002075.
Anderson, J.L.B., Schultz, P.H., Heineck, J.T., 2004. Experimental ejection angles:Implications for the subsurface flow field during oblique impacts. Meteorit.Planet. Sci. 39, 303–320.
Elbehausen, D., Wunnemann, K., Collins, G.S., 2009. Scaling of oblique impact infrictional targets: Implication for crater size and formation mechanisms. Icarus204, 716–731.
Ernst, C.M., Schultz, P.H., 2007. Evolution of the Deep Impact flash: Implications forthe nucleus surface based on laboratory experiments. Icarus 190, 334–344.
Gault, D.E., Heitowit, E.D., 1963. The partition of energy for hypervelocity impactcraters formed in rock. In: Proceedings of 6th Symposium on HypervelocityImpact, Cleveland, OH, vol. 11, pp. 419–456.
Gault, D.E., Wedekind, J.A., 1978. Experimental studies of oblique impacts. Proc.Lunar Planet. Sci. Conf. 9, 3843–3875.
Gault, D.E., Quaide, W.L., Oberbeck, V.R., 1968. Impact cratering mechanics andstructures. In: French, B.M., Short, N.M. (Eds.), Shock Metamorphism of NaturalMaterials, Mono, Baltimore, MD, pp. 87–100.
Hermalyn, B., Schultz, P.H., 2011. Time-resolved studies of hypervelocity verticalimpacts into porous particulate targets: Effects of projectile density on early-time coupling. Icarus 216, 269–279.
Hermalyn, B., Schultz, P.H., Heineck, J.T., 2010. Early-stage coupling for obliqueimpacts into granular material. Lunar Planet. Sci. 41. Abstract 2565.
Housen, K.R., Holsapple, K.A., Voss, M.E., 1999. Compaction as the origin of theunusual craters on the Asteroid Mathilda. Nature 402, 155–157.
Kadono, T. et al., 2007. The thickness and formation age of the surface layer onComet 9P/Tempel 1. Astrophys. J. 661, L89–L92.
Keller, H.U. et al., 2005. Deep Impact observations by OSIRIS onboard the Rosettaspacecraft. Science 310, 281–283.
Lisse, C.M. et al., 2006. Detection of new cometary species in Spitzer spectralobservations of the Deep Impact ejecta. Science 313, 635–640.
Minnaert, M.G.J., 1954. The nature of light and colour in the open air. In: Brian Jay,K.E. (rev.), Dover Books on Earth Sciences. Dover, New York.
Pierazzo, E., Melosh, H.J., 1999. Hydrocode modeling of Chicxulub as an obliqueimpact event. Earth Planet. Sci. Lett. 165, 163–176.
Quaide, W.L., Oberbeck, V.R., 1968. Thickness determinations of the lunar surface. J.Geophys. Res. 73, 5247–5270.
Richardson, J.E., Melosh, H.J., Lisse, C.M., Carcich, B., 2007. A ballistics analysis of theDeep Impact ejecta plume: Determining comet Tempel-1’s gravity, mass, anddensity. Icarus 190, 357–390.
Schmidt, R.M., Holsapple, K.A., 1980. Theory and experiments on centrifugecratering. J. Geophys. Res. 85, 235–252.
Schultz, P.H., 1977. Endogenic modification of impact craters on Mercury. Phys.Earth Planet. Inter. 15, 202–219.
Schultz, P.H., 1992. Atmospheric effects on ejecta emplacement and craterformation on Venus from Magellan. J. Geophys. Res. 97 (E10), 16183–16248.
Schultz, P.H., 1996. Effect of impact angle on vaporization. J. Geophys. Res. 101,21117–21136.
Schultz, P.H., 2009. Uprange plumes and nature of the Comet 9P/Tempel-1. LunarPlanet. Sci. 40. Abstract 2386.
Schultz, P.H., Ernst, C.E., Anderson, J.L.B., 2005. Expectations for crater size andphotometric evolution from the Deep Impact collision. Space Sci. Rev. 117, 207–239.
Schultz, P.H., Sugita, S., Eberhardy, C.A., Ernst, C.M., 2006. The role of ricochetimpacts on impact vaporization. Int. J. Impact Eng. 33, 771–780.
Schultz, P.H., Eberhardy, C.A., Ernst, C.M., A’Hearn, M.F.A., Sunshine, J.M., Lisse, C.M.,2007. The DI oblique cratering experiment. Icarus 190, 295–333.
Schultz, P.H., Anderson, J.L.B., Hermalyn, B.H., 2009. Origin and significance ofuprange ray patterns. Lunar Planet. Sci. 40. Abstract 2496.
Sugita, S., Schultz, P.H., 1999. Spectroscopic characterization of hypervelocityjetting: Comparison with a standard theory. J. Geophys. Res. 104 (E12), 30825–30845.
Sugita, S. et al., 2005. Subaru telescope observation of Deep Impact. Science 310,274–278.
Veverka, J., Klaasan, K., A’Hearn, M., Belton, M., Brownlee, D., Chesley, S., Clark, B.,Economou, T., Farquhar, R., Green, S.F., Groussin, O., Harris, A., Kissel, J., Li, J.-Y.,Meech, K., Melosh, J., Richardson, J., Schultz, P., Silen, J., Sunshine, J., Thomas, P.,Bhaskaran, S., Bodewits, D., Carcich, B., Cheuvront, A., Farnham, T., Sackett, S.,Wellnitz, D., Wolf, A., 2013. Return to Comet Tempel 1: Overview of Stardust-NExT results. Icarus 222
Vickery, A.M., 1993. The theory of jetting: Applications to the origin of tektites.Icarus 105, 441–453.
Wellnitz, D.D., Collins, S., A’Hearn, M.F., Prager, B., and the Deep Impact MissionTeam and the Stardust-NExT Mission Team, 2012. The Location of the impactpoint of the Deep Impact Impactor on Comet 9P/Tempel, vol. 1.
Wünnemann, K., Collins, G.S., Melosh, H.J., 2006. A strain-based porosity model foruse in hydrocode simulations of impacts and implications for transient-cratergrowth in porous targets. Icarus 180, 514–527.