The Deep Chlorophyll Maximum in Lake Superior M.T. Auer, L.A. Bub and K.D. Elenbaas Department of...
19
The Deep Chlorophyll Maximum in Lake Superior M.T. Auer, L.A. Bub and K.D. Elenbaas Department of Civil and Environmental Engineering Michigan Technological University 2000 HN210 Chl
-
date post
19-Dec-2015 -
Category
Documents
-
view
218 -
download
1
Transcript of The Deep Chlorophyll Maximum in Lake Superior M.T. Auer, L.A. Bub and K.D. Elenbaas Department of...
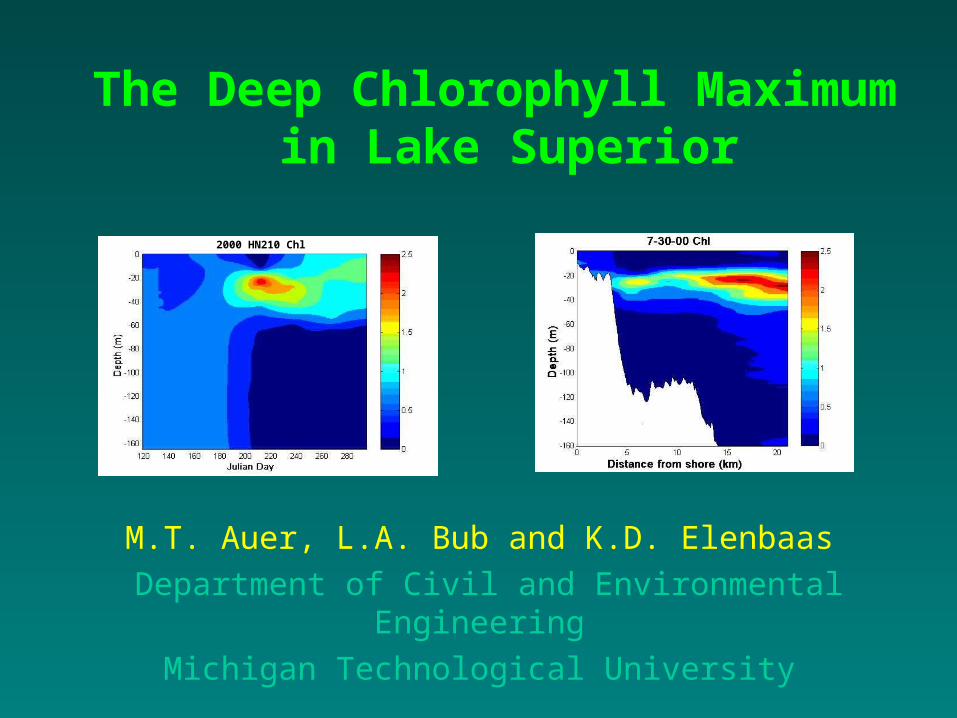
The Deep Chlorophyll Maximum in Lake Superior
M.T. Auer, L.A. Bub and K.D. Elenbaas Department of Civil and Environmental
EngineeringMichigan Technological University
2000 HN210 Chl
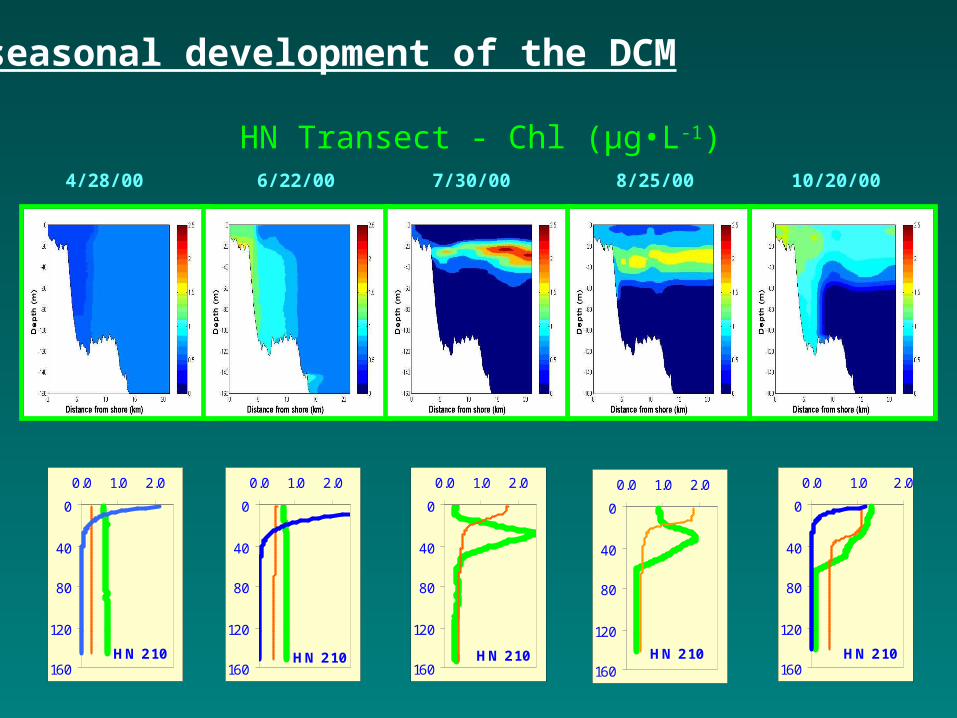
seasonal development of the DCM
HN Transect - Chl (µg•L-1)4/28/00 6/22/00 7/30/00 8/25/00 10/20/00
HN 210
0
40
80
120
160
0.0 1.0 2.0
HN 210
0
40
80
120
160
0.0 1.0 2.0
HN 210
0
40
80
120
160
0.0 1.0 2.0
HN 210
0
40
80
120
160
0.0 1.0 2.0
HN 210
0
40
80
120
160
0.0 1.0 2.0
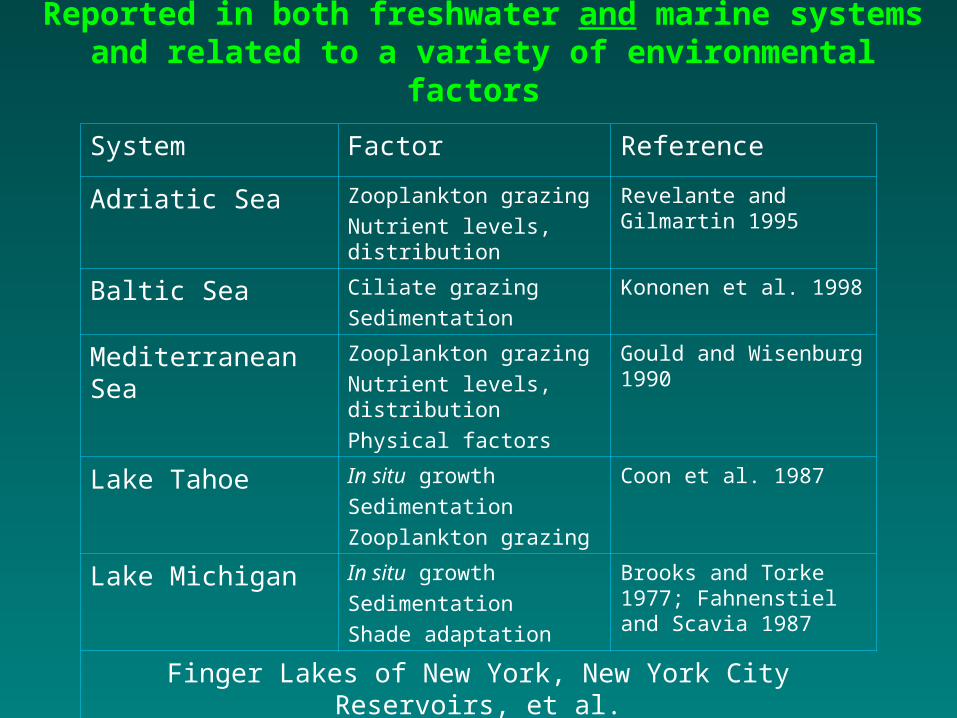
Reported in both freshwater and marine systems and related to a variety of environmental factors
System Factor Reference
Adriatic Sea Zooplankton grazingNutrient levels, distribution
Revelante and Gilmartin 1995
Baltic Sea Ciliate grazingSedimentation
Kononen et al. 1998
Mediterranean Sea
Zooplankton grazingNutrient levels, distributionPhysical factors
Gould and Wisenburg 1990
Lake Tahoe In situ growthSedimentationZooplankton grazing
Coon et al. 1987
Lake Michigan In situ growthSedimentationShade adaptation
Brooks and Torke 1977; Fahnenstiel and Scavia 1987
Finger Lakes of New York, New York City Reservoirs, et al.
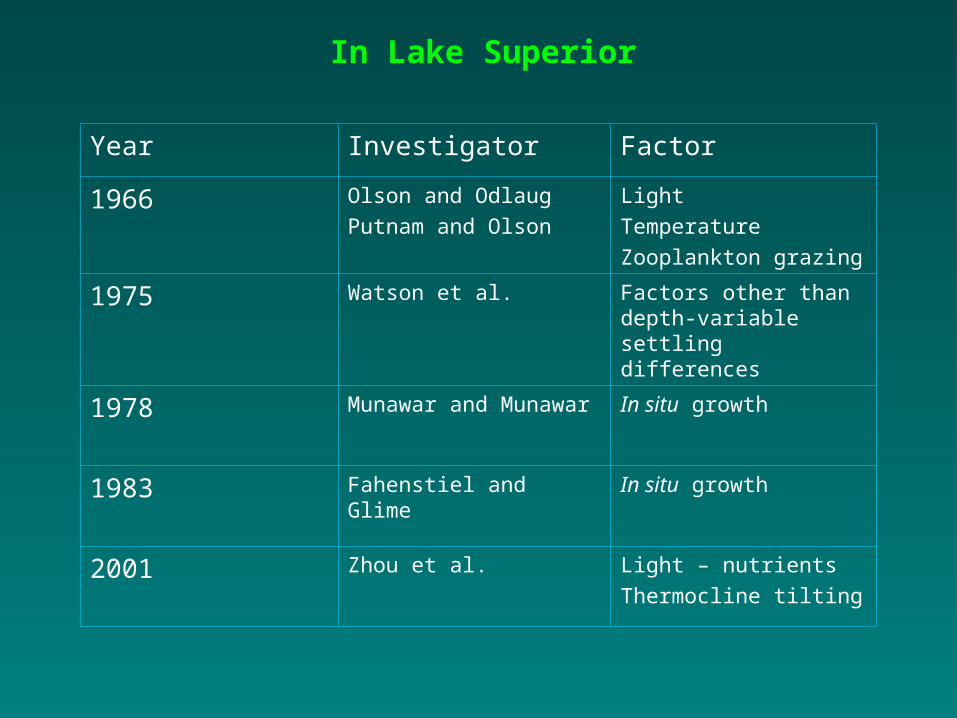
In Lake Superior
Year Investigator Factor
1966 Olson and OdlaugPutnam and Olson
LightTemperatureZooplankton grazing
1975 Watson et al. Factors other than depth-variable settling differences
1978 Munawar and Munawar In situ growth
1983 Fahenstiel and Glime In situ growth
2001 Zhou et al. Light – nutrientsThermocline tilting
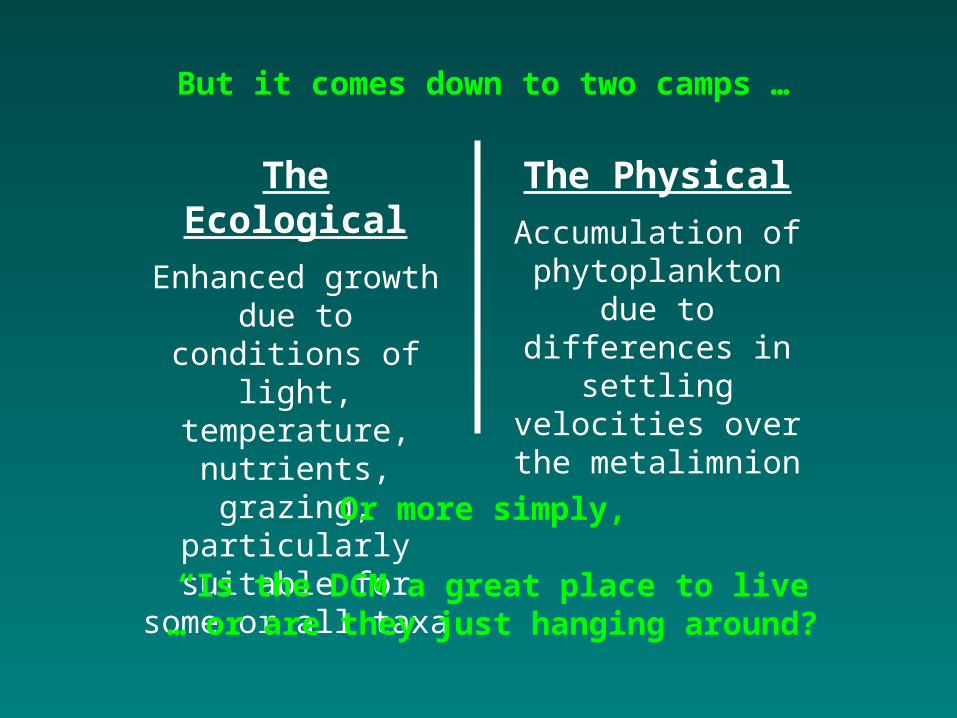
The Ecological
Enhanced growth due to conditions
of light, temperature,
nutrients, grazing, particularly
suitable for some or all taxa
The Physical
Accumulation of phytoplankton due
to differences in settling velocities
over the metalimnion
But it comes down to two camps …
Or more simply,
“Is the DCM a great place to live … or are they just hanging around?
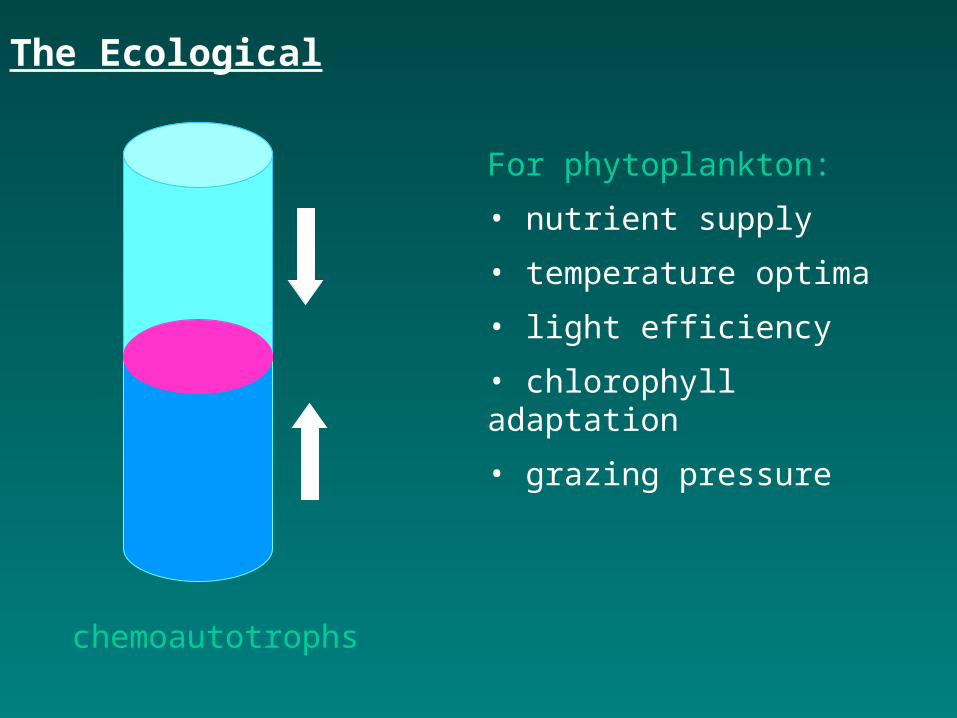
The Ecological
For phytoplankton:
• nutrient supply
• temperature optima
• light efficiency
• chlorophyll adaptation
• grazing pressure
chemoautotrophs
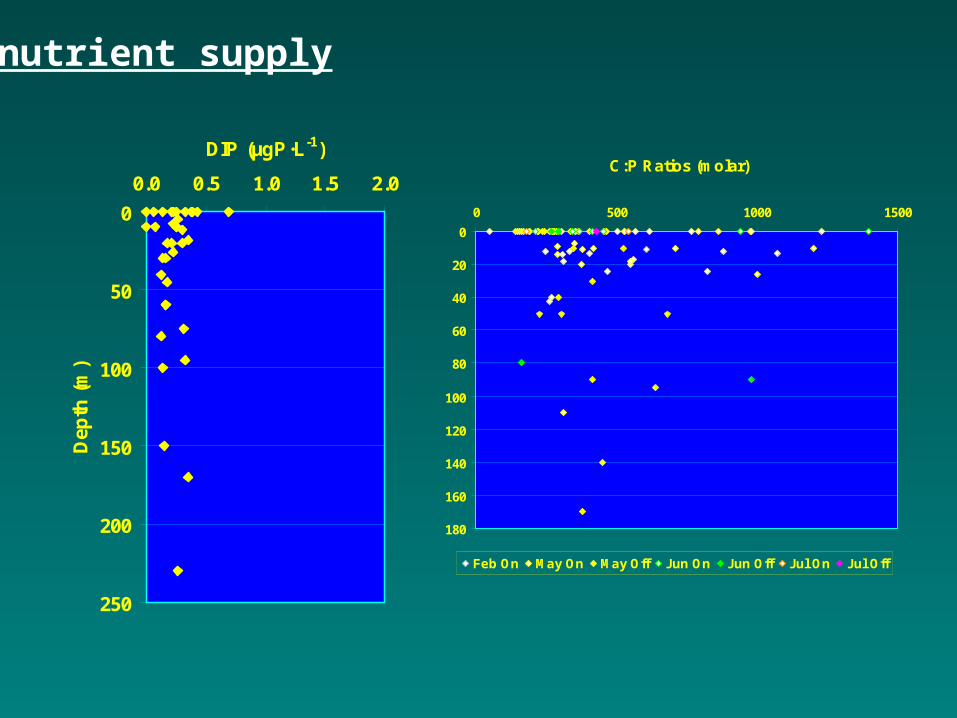
nutrient supply
0
50
100
150
200
250
0.0 0.5 1.0 1.5 2.0
DIP (µgP∙L-1)
Dep
th (
m)
C:P Ratios (molar)
0
20
40
60
80
100
120
140
160
180
0 500 1000 1500
Feb On May On May Off Jun On Jun Off Jul On Jul Off
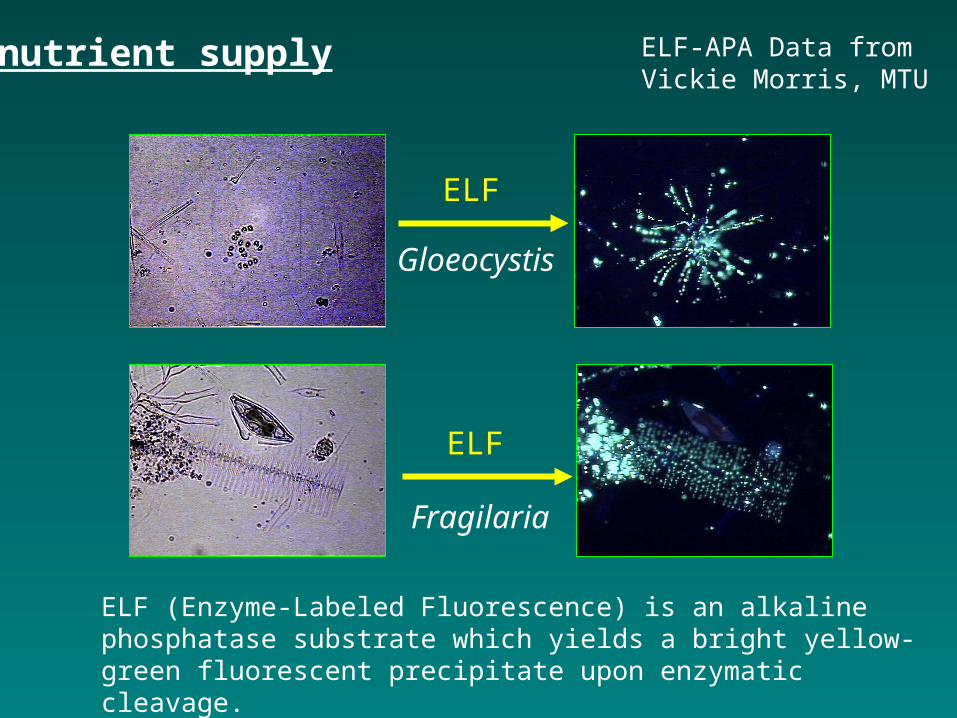
nutrient supply
ELF
Gloeocystis
ELF
Fragilaria
ELF (Enzyme-Labeled Fluorescence) is an alkaline phosphatase substrate which yields a bright yellow-green fluorescent precipitate upon enzymatic cleavage.
ELF-APA Data fromVickie Morris, MTU
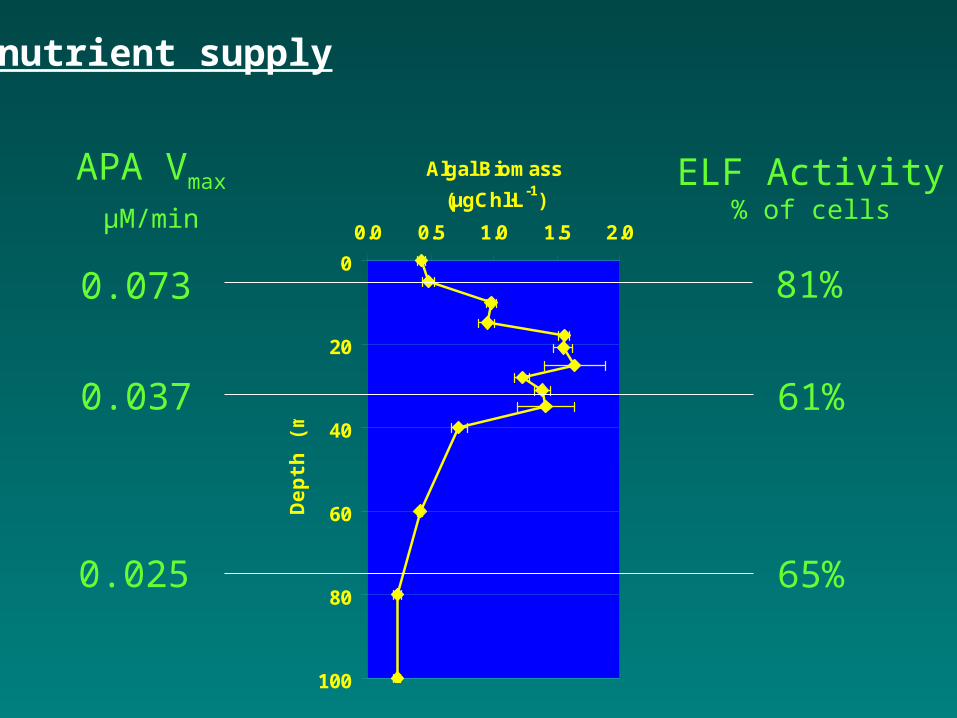
nutrient supply
0
20
40
60
80
100
0.0 0.5 1.0 1.5 2.0
Algal Biomass
(µgChl·L-1)
De
pth
(m
)
ELF Activity% of cells
81%
61%
65%
0.073
0.037
0.025
APA Vmax
µM/min
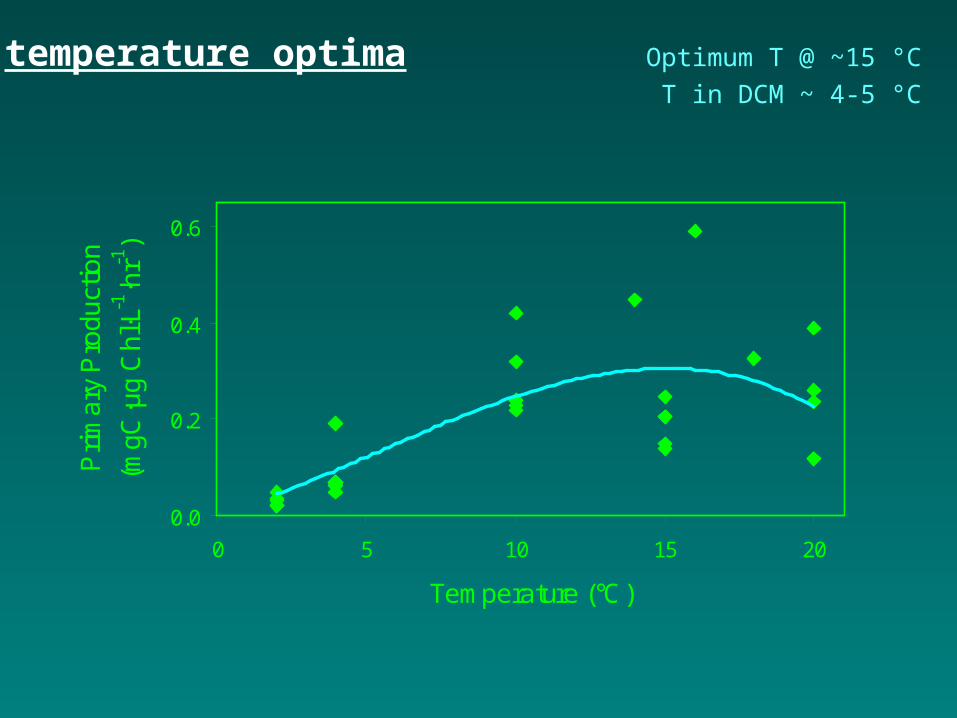
temperature optima
0.0
0.2
0.4
0.6
0 5 10 15 20
Temperature (°C)
Pri
ma
ry P
rod
uct
ion
(mg
C∙µ
g C
hl∙L
-1∙h
r-1)
Optimum T @ ~15 °CT in DCM ~ 4-5 °C
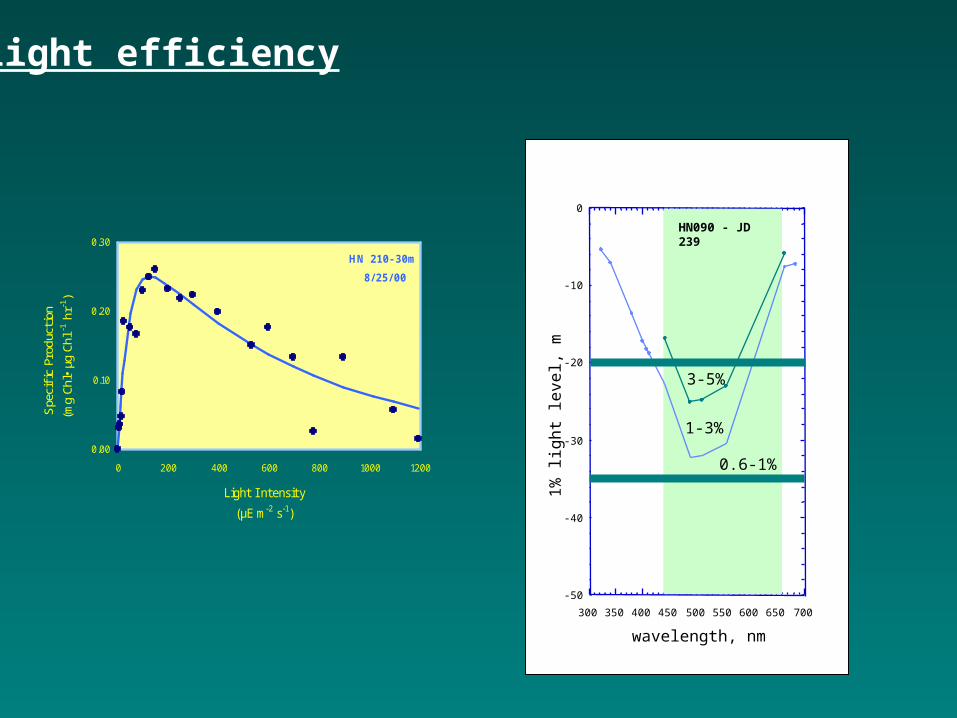
light efficiency
HN 210- 30m
8/25/00
0.00
0.10
0.20
0.30
0 200 400 600 800 1000 1200
Light I ntensity
(µE m-2 s-1)
Spe
cifi
c Pr
oduc
tion
(mg
Chl•
µg
Chl-1
hr-1
)
-50
-40
-30
-20
-10
0
300 350 400 450 500 550 600 650 700
1%
lig
ht
level, m
wavelength, nm
HN090 - JD 239
3-5%
1-3%
0.6-1%
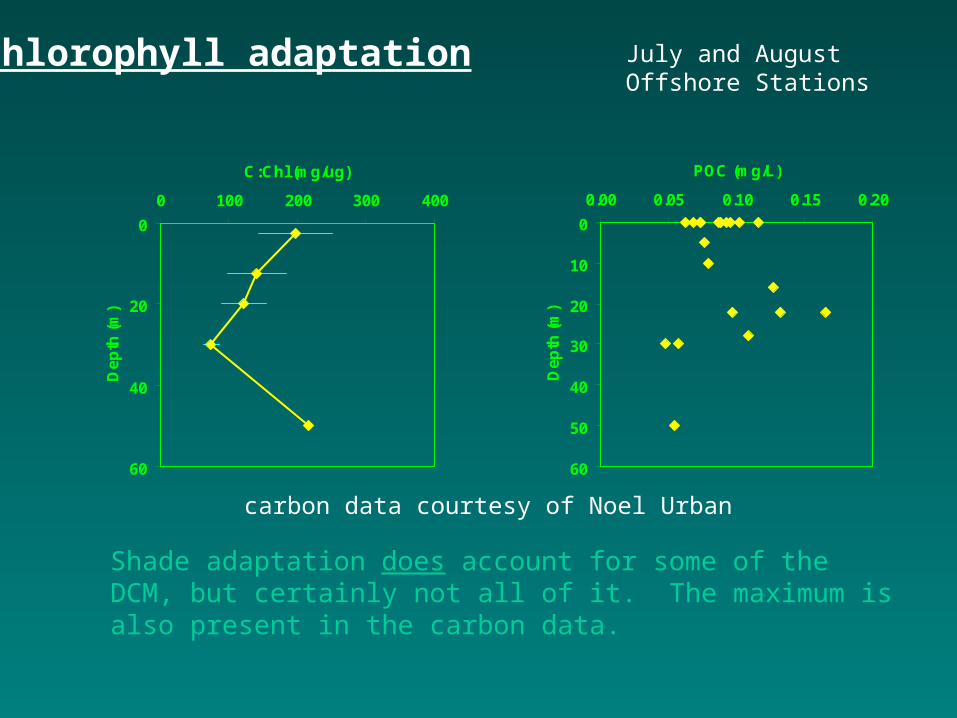
chlorophyll adaptation
Shade adaptation does account for some of the DCM, but certainly not all of it. The maximum is also present in the carbon data.
0
10
20
30
40
50
60
0.00 0.05 0.10 0.15 0.20
POC (mg/L)
De
pth
(m
)
carbon data courtesy of Noel Urban
0
20
40
60
0 100 200 300 400
C:Chl (mg/ug)
De
pth
(m
)
July and AugustOffshore Stations
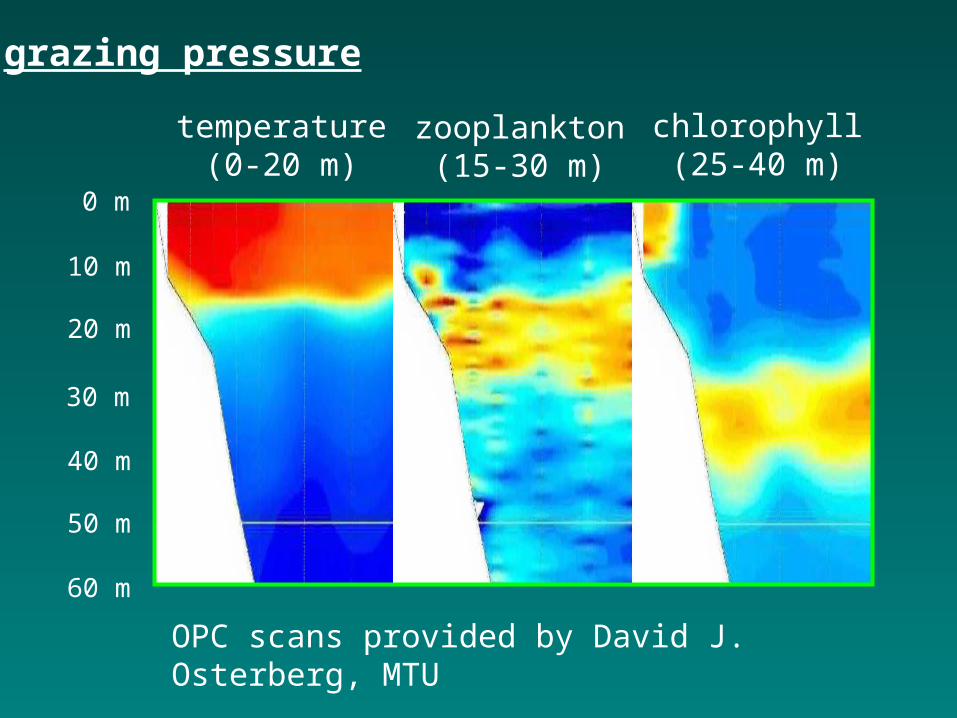
grazing pressure
OPC scans provided by David J. Osterberg, MTU
temperature(0-20 m)
zooplankton(15-30 m)
chlorophyll(25-40 m)
0 m
30 m
60 m
10 m
20 m
40 m
50 m
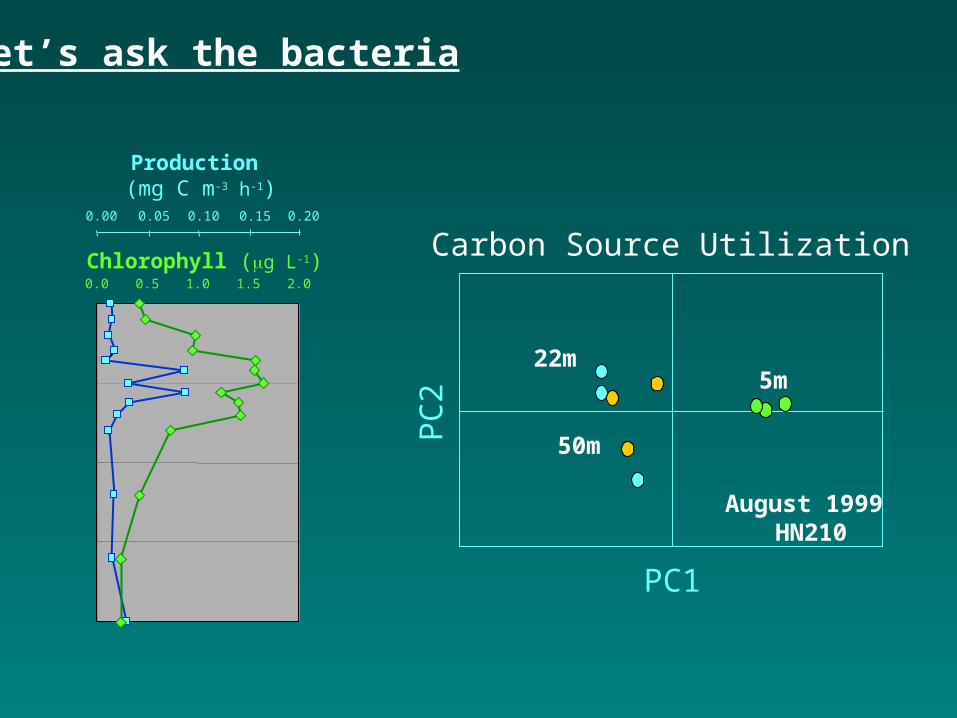
0.0 0.5 1.0 1.5 2.0
0.00 0.05 0.10 0.15 0.20
Chlorophyll (g L-1)
Production (mg C m-3 h-1)
August 1999 HN210
PC
2
PC1
5m22m
50m
Carbon Source Utilization
let’s ask the bacteria
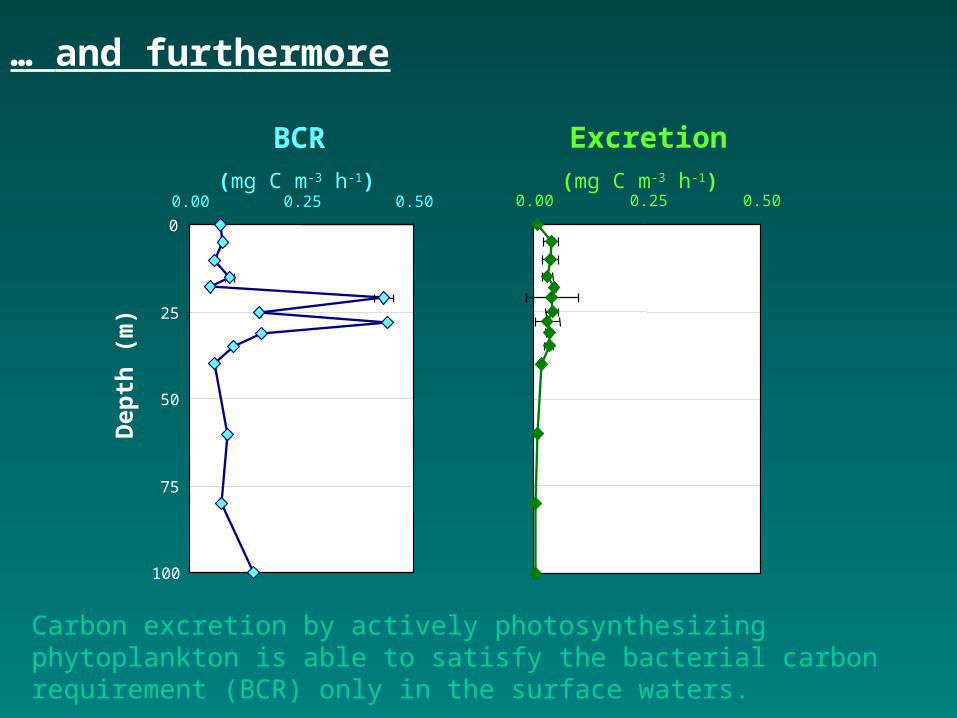
… and furthermore
0
25
50
75
100
0.00 0.25 0.50 0.00 0.25 0.50
BCR(mg C m-3 h-1)
Excretion(mg C m-3 h-1)
Dep
th (
m)
Carbon excretion by actively photosynthesizing phytoplankton is able to satisfy the bacterial carbon requirement (BCR) only in the surface waters.
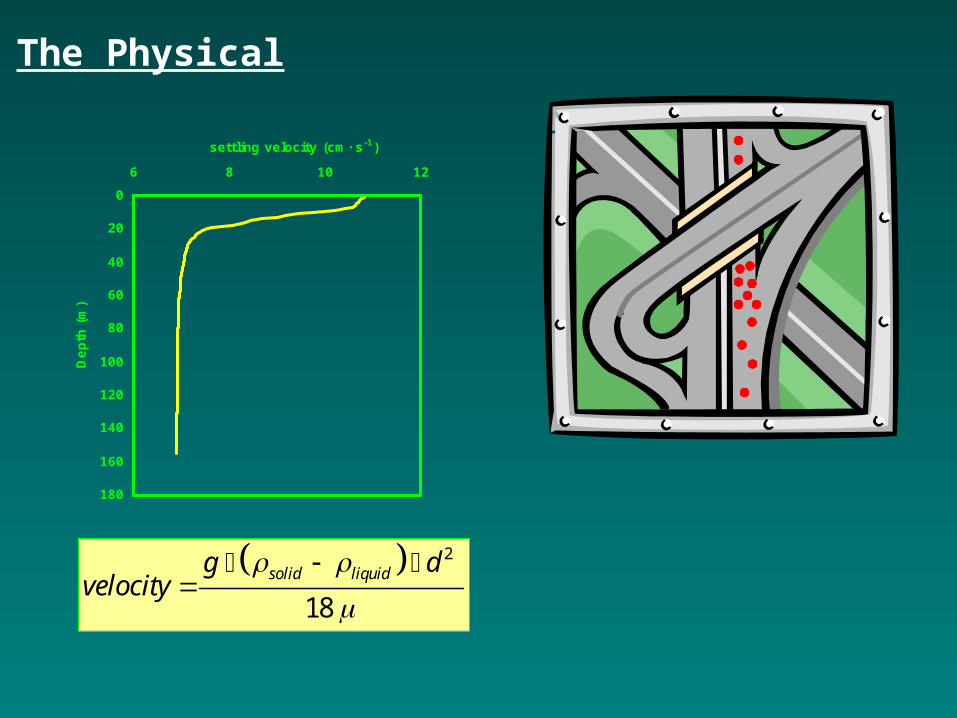
The Physical
0
20
40
60
80
100
120
140
160
180
6 8 10 12
settling velocity (cm∙ s-1)
Depth
(m
)
2
18solid liquidg d
velocity
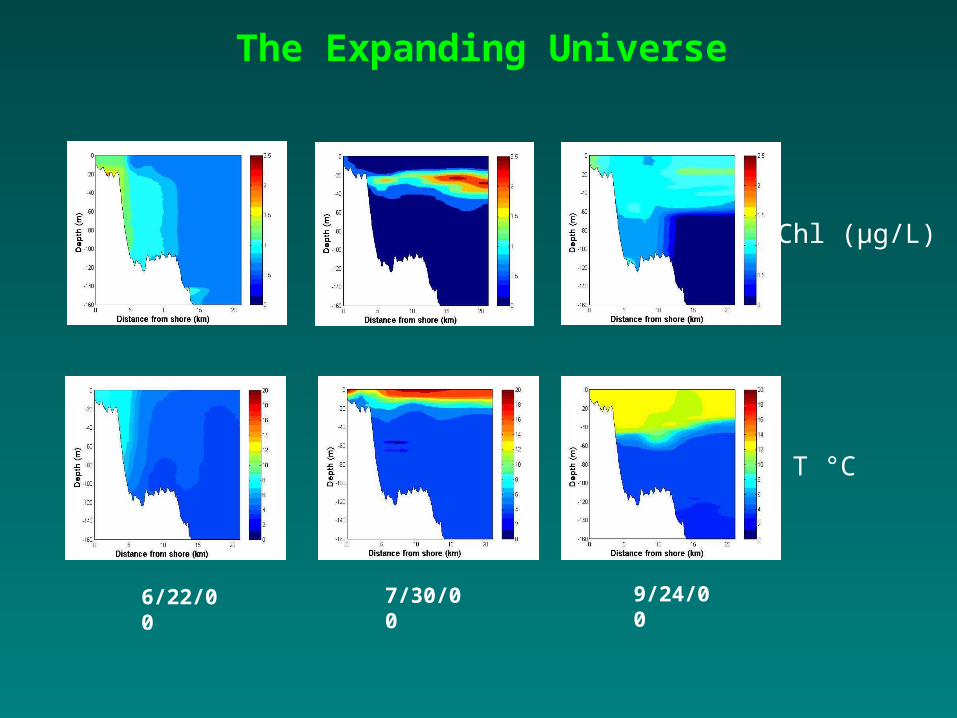
The Expanding Universe
6/22/00
7/30/00
9/24/00
T °C
Chl (µg/L)
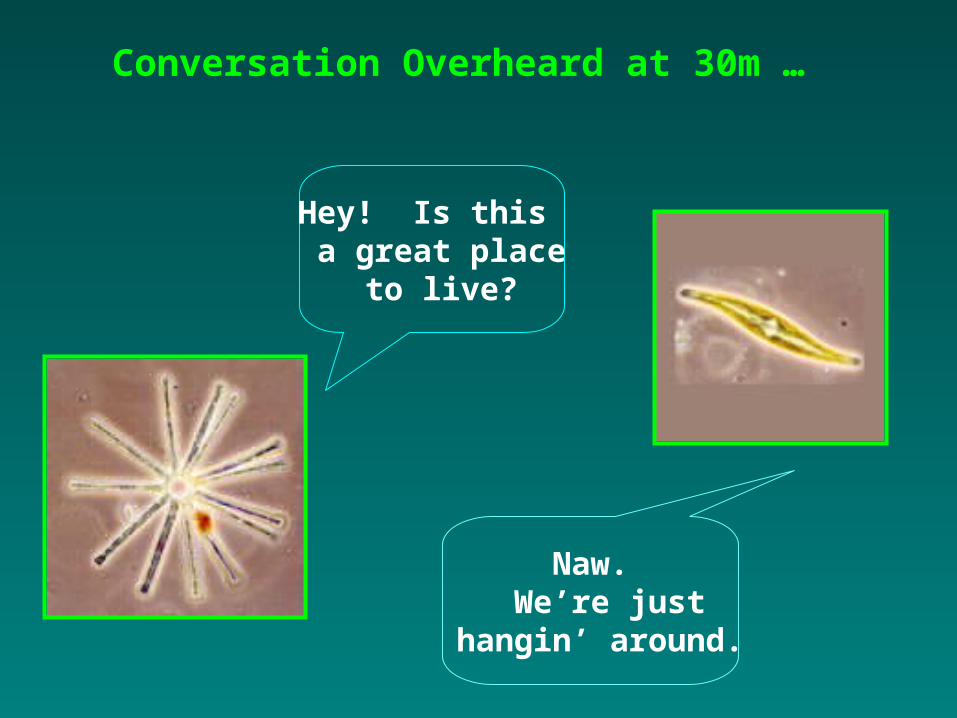
Conversation Overheard at 30m …
Hey! Is this a great place
to live?
Naw. We’re just
hangin’ around.
acknowledgements:
For field support:
Captain & Crew of the R/V Laurentian
For assistance in data analysis:
Jae Jeong, MTU
For data:
Angela Cates, LLOJudy Budd, MTUKim Elenbaas, MTUSarah Green, MTUVickie Morris, MTUDave Osterberg, MTUNoel Urban, MTU
For financial support:
National Science Foundation