THE DECLINING LABOUR SHARE IN MEASUREMENT, AND INTERNATIONAL
22
Stanford, J. (2018) ‘The Declining Labour Share in Australia: Definition, Measurement, and International Comparisons’ Journal of Australian Political Economy No. 81, pp. 11-32. THE DECLINING LABOUR SHARE IN AUSTRALIA: DEFINITION, MEASUREMENT, AND INTERNATIONAL COMPARISONS Jim Stanford The explosion of research and policy interest in the problem of inequality in recent years has focused primarily on the distribution of income across individuals or households. This research has documented the dramatic growth of personal income inequality, and explored its causes, consequences, and solutions. 1 However, a parallel and related dimension of inequality has received rather less attention: namely, the shifting distribution of income between the major factors of production (primarily labour and capital, but also land, mixed incomes, and other smaller categories). In fact, the changing factor distribution of income is one of the major causes of shifts in personal income distribution. And the factor distribution of income raises many additional and important issues for macroeconomics and political economy. 2 Indeed, David Ricardo (1911) stated famously, ‘To determine the laws which regulate this distribution, is the principal problem in Political Economy.’ For these reasons, exploring the changing distribution of income between factors is an essential complement to other studies of inequality. 1 Leading entries in this body of literature include Piketty (2014), Wilkinson and Pickett (2009), and Stiglitz (2012). 2 Including savings, investment, growth, and taxation; see Bertola et al. (2006).
Transcript of THE DECLINING LABOUR SHARE IN MEASUREMENT, AND INTERNATIONAL

Stanford, J. (2018)
‘The Declining Labour Share in Australia: Definition, Measurement, and
International Comparisons’
Journal of Australian Political Economy
No. 81, pp. 11-32.
THE DECLINING LABOUR SHARE IN
AUSTRALIA: DEFINITION,
MEASUREMENT, AND INTERNATIONAL
COMPARISONS
Jim Stanford
The explosion of research and policy interest in the problem of inequality
in recent years has focused primarily on the distribution of income across
individuals or households. This research has documented the dramatic
growth of personal income inequality, and explored its causes,
consequences, and solutions.1 However, a parallel and related dimension
of inequality has received rather less attention: namely, the shifting
distribution of income between the major factors of production (primarily
labour and capital, but also land, mixed incomes, and other smaller
categories). In fact, the changing factor distribution of income is one of
the major causes of shifts in personal income distribution. And the factor
distribution of income raises many additional and important issues for
macroeconomics and political economy.2 Indeed, David Ricardo (1911)
stated famously, ‘To determine the laws which regulate this distribution,
is the principal problem in Political Economy.’ For these reasons,
exploring the changing distribution of income between factors is an
essential complement to other studies of inequality.
1 Leading entries in this body of literature include Piketty (2014), Wilkinson and Pickett
(2009), and Stiglitz (2012).
2 Including savings, investment, growth, and taxation; see Bertola et al. (2006).

12 JOURNAL OF AUSTRALIAN POLITICAL ECONOMY No 81
This article reviews the evolution of the factor distribution of income in
Australia through the postwar era, with a focus on the initial rise and
subsequent fall of the share of national income going to labour. The next
section defines the labour share, discusses its relationship to the personal
distribution of income, and considers several issues of measurement and
theoretical interpretation. The following section presents empirical
evidence of the marked decline of the labour share since its peak in the
mid-1970s. The Australian experience is then placed in an international
context, comparing it to the experience of other developed capitalist
economies. The conclusion considers the implications of this trend for
future economic and labour market policy.
Definitions, Methodology, and Theoretical Perspectives
At its simplest, the labour share (LS) of GDP represents the proportion of
total economic output that is received as compensation by paid
employees. Compensation is considered broadly to include wages,
salaries, and other benefits (such as superannuation contributions by
employers). ‘Employee’ is also defined broadly to include anyone in a
paid position (in most statistical series this even includes the salary
portion of the compensation of top business executives3).
(1) 𝐿𝑆 =𝐿𝑎𝑏𝑜𝑢𝑟 𝐶𝑜𝑚𝑝𝑒𝑛𝑠𝑎𝑡𝑖𝑜𝑛
𝑂𝑢𝑡𝑝𝑢𝑡
The labour share can be measured in aggregate terms over a period of
time (say, a year or a quarter, to coincide with macroeconomic statistics).
It can also be expressed in terms of hourly output, by decomposing both
compensation and output into hourly rates.
(2) 𝐿𝑆 =𝐻𝑜𝑢𝑟𝑙𝑦 𝐶𝑜𝑚𝑝𝑒𝑛𝑠𝑎𝑡𝑖𝑜𝑛 ∗ 𝐻𝑜𝑢𝑟𝑠 𝑜𝑓 𝐸𝑚𝑝𝑙𝑜𝑦𝑚𝑒𝑛𝑡
𝐻𝑜𝑢𝑟𝑙𝑦 𝑃𝑟𝑜𝑑𝑢𝑐𝑡𝑖𝑣𝑖𝑡𝑦 ∗ 𝐻𝑜𝑢𝑟𝑠 𝑜𝑓 𝐸𝑚𝑝𝑙𝑜𝑦𝑚𝑒𝑛𝑡
On an hourly basis, therefore, the labour share of output is identical to
unit labour cost: that is, the cost of hiring an hour of labour relative to the
value of output produced in that hour:
3 Most business leaders receive much of their compensation in the form of equity-based
options or grants, which are not included in labour compensation; their base salaries and
cash bonuses, however, are considered payment to their labour. Some authors have attempted to adjust overall labour share measures by excluding estimated compensation
received by, say, the highest-income 1 percent of households or top executives; see, for
example, Brennan (2016) and Cowgill (2013, Appendix D).
THE DECLINING LABOUR SHARE IN AUSTRALIA 13
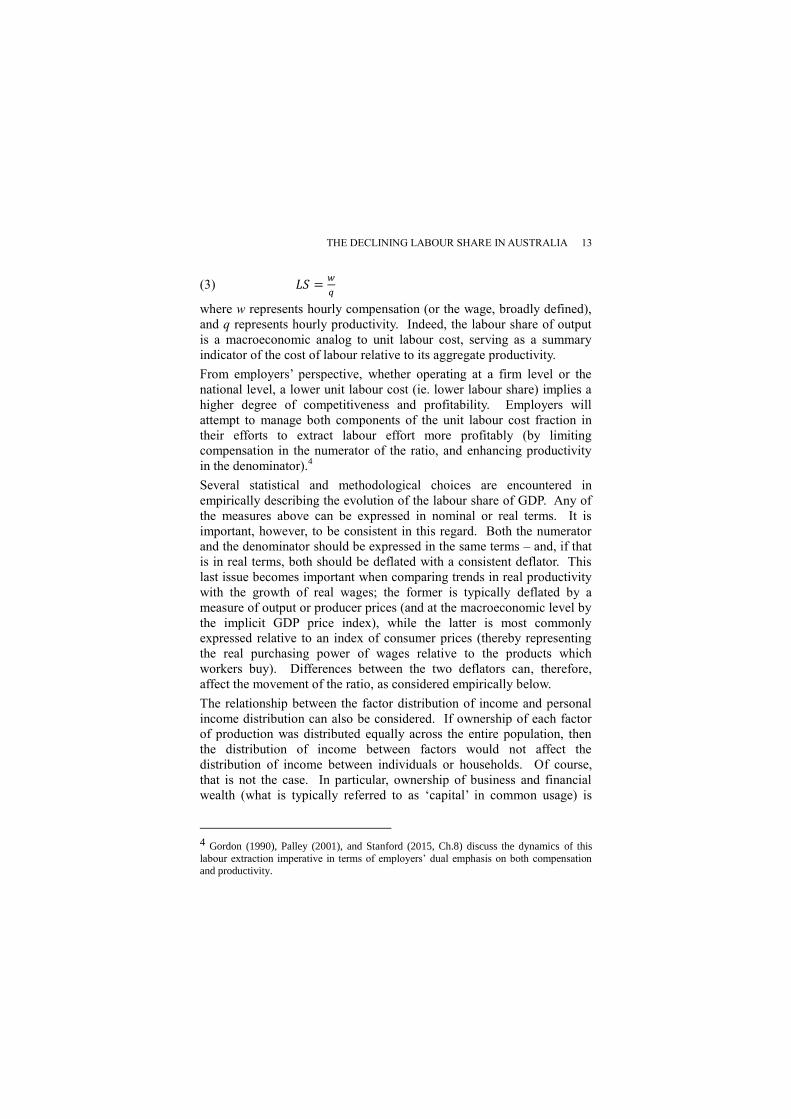
(3) 𝐿𝑆 =𝑤
𝑞
where w represents hourly compensation (or the wage, broadly defined),
and q represents hourly productivity. Indeed, the labour share of output
is a macroeconomic analog to unit labour cost, serving as a summary
indicator of the cost of labour relative to its aggregate productivity.
From employers’ perspective, whether operating at a firm level or the
national level, a lower unit labour cost (ie. lower labour share) implies a
higher degree of competitiveness and profitability. Employers will
attempt to manage both components of the unit labour cost fraction in
their efforts to extract labour effort more profitably (by limiting
compensation in the numerator of the ratio, and enhancing productivity
in the denominator).4
Several statistical and methodological choices are encountered in
empirically describing the evolution of the labour share of GDP. Any of
the measures above can be expressed in nominal or real terms. It is
important, however, to be consistent in this regard. Both the numerator
and the denominator should be expressed in the same terms – and, if that
is in real terms, both should be deflated with a consistent deflator. This
last issue becomes important when comparing trends in real productivity
with the growth of real wages; the former is typically deflated by a
measure of output or producer prices (and at the macroeconomic level by
the implicit GDP price index), while the latter is most commonly
expressed relative to an index of consumer prices (thereby representing
the real purchasing power of wages relative to the products which
workers buy). Differences between the two deflators can, therefore,
affect the movement of the ratio, as considered empirically below.
The relationship between the factor distribution of income and personal
income distribution can also be considered. If ownership of each factor
of production was distributed equally across the entire population, then
the distribution of income between factors would not affect the
distribution of income between individuals or households. Of course,
that is not the case. In particular, ownership of business and financial
wealth (what is typically referred to as ‘capital’ in common usage) is
4 Gordon (1990), Palley (2001), and Stanford (2015, Ch.8) discuss the dynamics of this
labour extraction imperative in terms of employers’ dual emphasis on both compensation
and productivity.
14 JOURNAL OF AUSTRALIAN POLITICAL ECONOMY No 81
concentrated in a surprisingly small segment of society. While official
data on wealth ownership is inconsistent and incomplete, various studies
have estimated that the richest 1 percent of Australians owns between 15
and 25 percent of all financial wealth, and the majority of wealth is
owned by the richest decile (Hutchens, 2018; Sheil and Stilwell, 2016).
Moreover, the composition of household income shifts predictably
toward a greater reliance on capital income as household incomes rise.5
Distributional shifts of aggregate income from labour to capital,
therefore, generate rising relative incomes for the higher (wealth-owning)
echelons of society. Research has indicated that most of the recent
increase in top incomes (for the richest 1 percent, or 0.1 percent, or even
0.01 percent of the population) is attributable to growing capital
incomes,6 confirming the importance of the shifting factor distribution of
income to growing inequality in personal income distribution.
Neoclassical economic theory explains the distribution of income as the
result of mutually beneficial exchange between the owners of different
factors of production – both direct (through trading one factor for
another) and indirect (through the exchange of final products which
embody different intensity of factors). Market-clearing prices for all
factors are determined in competitive markets, ensuring both uniform
prices for equivalent factor supplies (which, under perfectly competitive
conditions, should equal the marginal productivity of each factor), and
the optimal allocation of all available factors to their most productive
uses. In this framework, it is not clear at all why the aggregate
distribution of income across factors is even relevant; the whole
framework is described as optimal market interactions between
individuals possessing various exogenously-determined initial
endowments of factors.
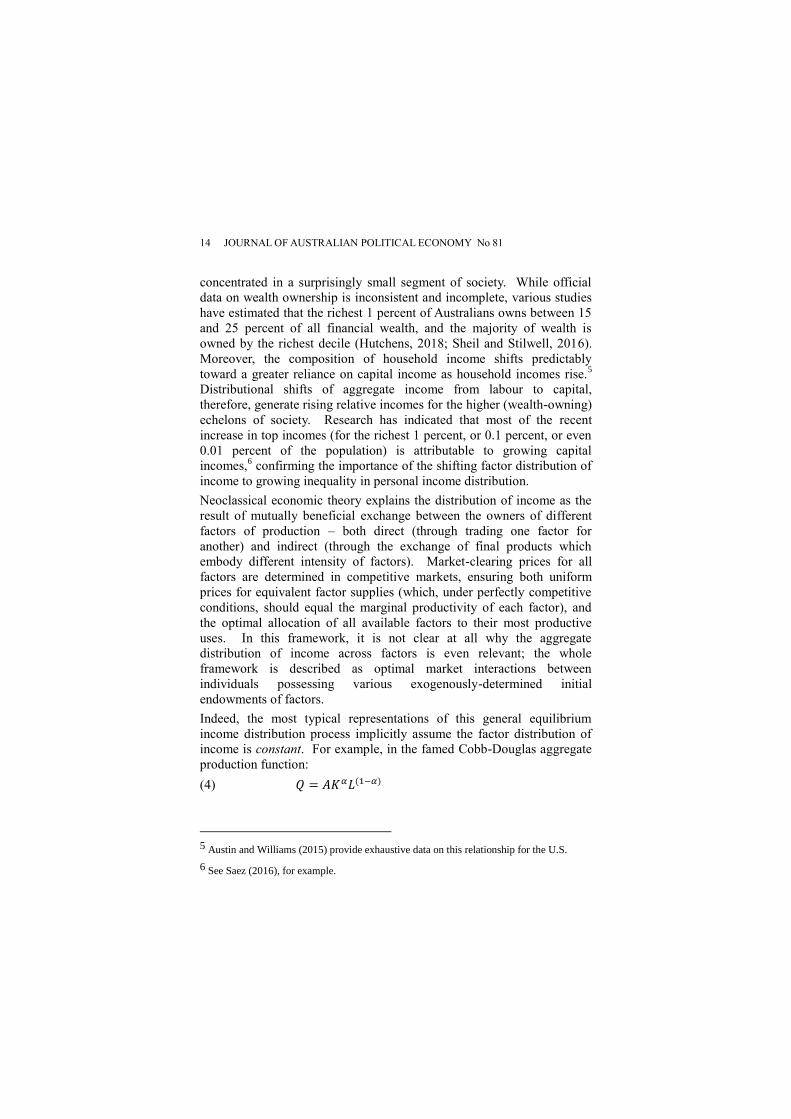
Indeed, the most typical representations of this general equilibrium
income distribution process implicitly assume the factor distribution of
income is constant. For example, in the famed Cobb-Douglas aggregate
production function:
(4) 𝑄 = 𝐴𝐾𝛼𝐿(1−𝛼)
5 Austin and Williams (2015) provide exhaustive data on this relationship for the U.S.
6 See Saez (2016), for example.

THE DECLINING LABOUR SHARE IN AUSTRALIA 15
the share of total output going to labour is automatically equal to the
(constant) coefficient on the labour input to production (1-α). This is
because the elasticity of substitution between factors with respect to their
price is 1, and hence any change in the price of a factor is proportionately
offset by an opposite change in relative demand for its services (and vice
versa), preserving its share of total output regardless of changes in
relative supply of or demand for each factor. More flexible functional
forms (such as constant elasticity of substitution production functions)
allow for variation in factor shares (Bentolila and Saint-Paul, 2003), but
these movements are still assumed to be driven by competitive market-
clearing mechanisms in the context of shifting relative factor
endowments, non-neutral technological change, and/or other general
equilibrium determinants (rather than linking these movements to non-
market forces such as regulations, institutions, or power).
When orthodox policy analysts bother to consider the factor distribution
of income as a variable of interest, their underlying neoclassical
framework leads to odd and often circular conclusions. For example, one
recent OECD paper (Schwellnus et al., 2017) set out to explain the
decoupling of real wage growth in most OECD countries from growth in
labour productivity (in contrast to conventional marginal productivity
analysis, which expects a close relationship between the two). The
authors identified the declining labour share of GDP as a cause of that
decoupling – whereas, arithmetically, the former is the result of the latter
(since whenever real wages grow more slowly than real productivity, the
labour share of GDP must fall).
The International Monetary Fund (2017) attributes the declining labour
share experienced in many OECD countries to the falling relative price
of investment goods, which has supposedly sparked a shift in demand
toward capital and away from labour. There are several problems with
this analysis, not least of which has been the very weak rate of business
capital investment in most OECD countries since the turn of the century
(and especially since the GFC). This contradicts the model’s assumption
that lower investment good prices must have led to faster investment.
Moreover, under marginal productivity principles, the growing capital
intensity of production should be associated with rising labour
productivity and hence wages (as labour becomes relatively scarce).7 As
7 Whether rising wages translates into a growing labour share depends on the assumed
elasticities of substitution in the underlying production function; in some cases, as noted,

16 JOURNAL OF AUSTRALIAN POLITICAL ECONOMY No 81
with other applications of neoclassical distributional theory (similarly
based on the assumption that incomes reflect marginal productivity), the
IMF approach explains the shift in factor distribution as a tautology:
since relative labour incomes are falling, this must (in a market-clearing
model) prima facie reflect a decline in the relative demand for labour,
which is assumed to reflect a relative decline in labour productivity.
The Treasury Department in Australia (2017) also considered the
evolution of the labour share of GDP, as part of a recent review of the
slowdown in wage growth. This report correctly describes the arithmetic
of movements in the labour share – driven by differences in relative
growth rates of real wages (deflated by producer prices or the GDP
deflator, rather than by the consumer price index) versus real
productivity. But then, curiously, the report denies that there has been
any downward trend in the labour share in Australia at all since the early
1990s; the authors suggest Australia’s experience has differed from other
OECD economies (where they acknowledge the labour share has
declined). This claim is empirically false: as indicated below, the labour
share has indeed declined since 1990 (although not as rapidly as during
the 1983-1990 period), falling by about 3 percentage points of GDP over
the last quarter-century. Despite denying any recent decline in the labour
share of GDP, the Treasury paper catalogues several potential reasons
why it might decline. Like the IMF, the Treasury paper highlights market
adjustments in relative factor prices (and in particular a supposed decline
in the relative price of capital). The paper also mentions the market
power of ‘superstar’ firms which control large market shares in specific
industries (such as high-tech sectors), and this might boost the profit
share.8 The Treasury report acknowledges that the compositional shift in
production toward more labour-intensive service sectors should be lifting
the labour income share of total output, but suggests that this trend must
be overwhelmed by other factors. There is no reference to the
institutional or political-economic context of factor income distribution
in explaining the decline of the labour share.
factor shares are assumed constant as an artifact of the assumed functional form, and this would hold even under growing capital intensity.
8 Most economists would refer to these dominant firms as monopolies or oligopolies, not
‘superstars.’

THE DECLINING LABOUR SHARE IN AUSTRALIA 17
Quiggin (2018) has critiqued an especially one-sided analysis of changes
in the labour share prepared by another Australian government agency:
the Department of Industry, Innovation and Science, which recently
published a report celebrating the legacy of neoliberal policy reform in
Australia since the 1980s (Office of the Chief Economist, 2018). This
report criticised the rise in the labour share that was experienced in the
initial postwar decades; it then credits more ‘flexible’ and pro-
competitive labour policies (starting with the Prices and Incomes
Accords of the early 1980s) with reestablishing a healthier equilibrium:
Australian wage growth ran ahead of GDP per capita growth
throughout the 1950s and 1960s which was a major source of
underlying inflation. The gap opened wider in the 1970s and 1980s.
This further drove up domestic inflation. ‘Imported inflation’ from
global trading partners increased inflation yet more. During the
operation of the Prices and Incomes Accord, real wages and GDP per
capita were gradually brought into alignment and alleviated
inflationary pressures in the economy (p. 9).
The asymmetry of the analysis is clear. When wages rise faster than
productivity, it is a problem (allegedly causing inflation, among other
ills), but when wages rise more slowly than productivity (as has usually
been the case since the early 1980s), this is said to restore ‘alignment.’
(In reality, wages growth and productivity growth were not ‘aligned’
after the early 1980s; the former has consistently lagged the latter, as is
described below.) In short, in the government view, an ongoing decline
in the labour share is considered healthy. At least this report implicitly
hints at the relevance of shifting regulatory and institutional factors in
explaining the decline in the labour share (mentioning in particular the
erosion of collective bargaining in Australia over this period); however,
this trend is interpreted as the restoration of some ‘normal’ market
equilibrium, rather than a matter of concern.
Heterodox economists, in contrast, recognise both the fluidity of factor
shares (instead of assuming their fixity), and the importance of changes
in factor distribution to other economic and social outcomes. Concern
with inequality, as noted, has sparked some of this focus. But there are
other rationales for heterodox interest in the factor distribution of
income. In the Kaleckian macroeconomic tradition, differential savings
rates out of labour versus capital income are a key behavioural feature of
the macroeconomy. In this context, changes in the factor distribution of
income have major implications for savings behavior, consumer demand,
18 JOURNAL OF AUSTRALIAN POLITICAL ECONOMY No 81
and hence overall economic growth (especially when output and
employment are demand-constrained, as heterodox theory believes is
generally the case). This perspective has sparked a rich literature on the
different properties of wage-led versus profit-led economic systems.9
Other implications of changes in factor shares include impacts on
investment (to the extent that investment is sensitive to labour cost
competitiveness), innovation, and fiscal performance. Recent examples
of heterodox analyses of the labour share of GDP include Glyn (2009),
Atkinson (2009), and in the Australian context Cowgill (2013).
Evolution of the Labour Share in Australia’s Postwar
Economy
An aggregate measure of the labour share of GDP (corresponding to
equation (1) above) can be directly constructed from the national income
accounts published by the Australian Bureau of Statistics. Figure 1
illustrates the evolution of the aggregate labour share, including all
wages, salaries, and other compensation (such as superannuation
benefits), dating back to the advent of the ABS’s quarterly GDP data in
1959.
The labour share rose steadily during the 1960s and early 1970s,
reaching peaks of over 55 percent of GDP in the late 1970s and early
1980s. The labour share began to decline rapidly after 1984, initially due
in part to the effects of the Prices and Incomes Accords system launched
in 1983 by the new Labor government (led by Bob Hawke) and the trade
union movement. The Accord process was aimed at restricting wage
growth and boosting profits, purportedly to ameliorate the effects of
‘excessive’ wage growth in previous years;10
measured by the decline in
labour share, the policy achieved these goals. The erosion of the labour
share continued through the 1990s and 2000s, falling below 47 percent of
9 A classic reference is Bhaduri and Marglin (1990); an important recent application is Stockhammer and Lavoie (2013).
10 The Accords also featured an expansion of important social benefits, notably the re-
introduction of Medicare and the implementation of the superannuation system, described as trade-offs in return for voluntary wage restraint by unions. Note, however, that employer
superannuation contributions are included in this measure of labour compensation; so the
decline in base wages was even steeper.

THE DECLINING LABOUR SHARE IN AUSTRALIA 19
GDP by 2010. The labour share regained about 2 percentage points of
GDP over the following several years, on the strength of a renewed boom
in the natural resources sector (which sparked rapid wage growth, led by
the mining and construction sectors, from 2011 through 2015), but that
rebound was temporary. The sharp downturn of global commodity prices
after 2014 put an end to the resource boom, and the labour share began to
decline again. In the March quarter of 2017 the labour share reached
46.5 percent, the lowest point since 1960.
Figure 1: Labour Compensation as Share of GDP, 1959-2017
Source: Author’s calculations from ABS Catalogue 5206.0, Table 7.
It is evident from Figure 1 that the labour share exhibits a complex
combination of cyclical and structural movements. In peak times, with
relatively strong labour market conditions, workers may be able to wrest
a larger share of output from employers, and the labour share grows; this
was true in the long postwar expansion, as well as during the peak of the
more recent resources boom. But the labour share can also exhibit a
counter-cyclical pattern, rising (at least temporarily) during a downturn
(because profits typically decline faster than wages as a recession sets
in). Simultaneously, longer-run evolution of the institutional structures of

20 JOURNAL OF AUSTRALIAN POLITICAL ECONOMY No 81
income distribution, and changes in the broad balance of economic and
political power between classes, will also affect the factor distribution of
income in a more lasting way. This effect is apparent in the long decline
of labour’s share throughout the whole era of neoliberalism.
Figure 2: Wages Share of Total Factor Income, 1960-2017
Source: ABS Catalogue 5206.0, Table 24.
As discussed above, there are several alternative ways to portray the
labour share of GDP. A second common measure in Australia, often cited
by journalists and commentators, is the share of wages in total factor
income. This is illustrated in Figure 2. It shows a very similar pattern to
the basic labour share of GDP. It differs primarily in that it uses total
factor income, rather than GDP, as the denominator. Factor income is
smaller than total GDP (since it excludes net indirect taxes less subsidies
received by government), so labour’s share seems larger (around 53
percent in 2017, 6 percentage points higher than labour’s share of GDP).
In addition, the decline in the labour share is incrementally muted in this
measure, since the total slice of GDP allocated to net indirect taxes has
increased slightly since the 1970s (due primarily to the introduction of
the national GST in 2000). Opinion differs as to which of these two

THE DECLINING LABOUR SHARE IN AUSTRALIA 21
measures is preferable. The shift in the incidence of taxation from
income taxes (especially business taxes) to more regressive indirect taxes
(primarily the GST) represents a secondary cause of growing inequality
in final consumption, and in this light the increase in indirect taxes as a
share of GDP can rightly be associated with labour’s falling share of final
output (in which case measuring factor shares relative to GDP, not factor
incomes, is more appropriate). In any event, however, the trends depicted
in the two series are very similar.
Figure 3: Real Unit Labour Cost, 1985-2017
Source: ABS Catalogue 5206.0, Table 42.
As noted in equation (3) above, the labour share of GDP is the
macroeconomic expression of unit labour cost. Unit labour cost can also
be measured directly by separately estimating productivity and labour
compensation. Again, both components of this ratio should be expressed
in comparable terms: either nominal or real (and if the latter is chosen, a
consistent deflator should be used).11
Figure 3 illustrates the evolution of
11 The ABS also produces a hybrid measure, which it calls ‘nominal unit labour cost,’
which is an index expressing nominal compensation relative to real productivity; this

22 JOURNAL OF AUSTRALIAN POLITICAL ECONOMY No 81
unit labour cost in Australia’s aggregate economy, in real terms: it is an
index, reflecting growth in real compensation relative to real
productivity. If real compensation grows more slowly than real output,
then the real unit labour cost will fall. This has been the case almost
continuously since 1985 (when the ABS began publishing this series).
Over that 30-year period, the unit labour cost declined by close to 20
percent; the decline in unit labour cost was especially rapid during 2016
and early 2017, rebounding somewhat in the last quarters of 2017.
That the evolution of the labour share reflects differential growth rates in
wages and productivity can also be highlighted with a separate portrayal
of those two components. Figure 4 illustrates the growth of real hourly
labour productivity since 1975 – around the time that the labour share of
GDP peaked. Productivity is expressed in real terms, relative to the
overall GDP price deflator.
Figure 4: Gap Between Productivity Growth and Wages, 1975-
2017
Source: Author’s calculations from ABS Catalogues 5206.0 and 6202.0.
measure is held to be a measure of underlying inflationary pressure. For analysing the
distribution of income, however, real unit labour cost is the more appropriate measure.
THE DECLINING LABOUR SHARE IN AUSTRALIA 23
Figure 4 also portrays two separate measures of real labour
compensation: one defined relative to the GDP deflator (the same
deflator used to measure real productivity), and one relative to the
growth of consumer prices (what workers actually buy with their wages).
By either definition, real wages have lagged considerably behind labour
productivity through the neoliberal era. The gap between productivity
and wages is somewhat larger when wages are measured relative to
consumer prices (rather than the GDP deflator): the cumulative shortfall
in real wages relative to productivity since 1975 is about 30 percentage
points when wages are deflated by GDP prices, but over 40 percentage
points when the CPI is used.
The difference between these two measures of real wages results from
the fact that consumer price inflation has slightly outstripped GDP-wide
price inflation over the period considered. However, the comparison
between these two deflators can shift rapidly, on the basis of changes in
the nominal prices of output. In the case of Australia’s resource-oriented
economy, this can occur because of fluctuations in world prices for
natural resource exports. When commodity prices are high, the nominal
price of Australian output rises quickly – and, during those times, real
wage growth measured relative to the GDP deflator is suppressed (even
though aggregate demand conditions and nominal wage increases may
seem vibrant). When commodity prices decline, real wages measured
this way may counter-intuitively accelerate; that outcome, however, is an
artifact of the importance of resource commodities in Australia’s total
output, and does not reflect any increase in effective purchasing power
for workers (nor any increase in their fundamental economic bargaining
power).
The contrast between the two measures of inflation is illustrated in
Figure 5, which portrays annual rates of inflation according to both
indicators. In general the measures track closely. During periods of
sustained boom or bust in global commodity markets, however, they can
diverge. For example, during the global commodities boom of the 2000s,
GDP inflation was consistently faster than CPI inflation, which served to
suppress real wages measured by the GDP deflator at the very time when
labour markets were relatively tight. In those years, real wages deflated
by the CPI ‘caught up’ to the other measure (as is visible in the ‘closing
gap’ between the two real wage measures pictured in Figure 4). The
subsequent downturn in global commodity prices, however, caused the
two series to diverge again. More recently, wild swings in global

24 JOURNAL OF AUSTRALIAN POLITICAL ECONOMY No 81
commodity prices have caused unprecedented volatility in the rate of
GDP inflation – which has swung rapidly from high levels (above 5
percent) to negative deflation several times since the global financial
crisis. These rapid shifts in the nominal prices of Australian output cause
equally rapid and unpredictable movements in the labour share of GDP.
In particular, the decline of the labour share to a 30-year low in early
2017 reflected a sudden but temporary increase in prices for resource
exports; as that price spike abated, the labour share rebounded somewhat.
Intuitively, the relationship between commodity prices and the labour
share can be understood this way: fluctuations in resource prices have a
powerful and immediate flow-through impact on profits in Australia’s
resource-focused business sector, and hence it is to be expected that the
labour share would move opposite to the direction of resource prices.
Figure 5: Measures of Inflation, 1959-2017
Source: ABS Catalogues 5206.0, Table 5, and 6401.0.
These more fleeting shorter-term movements in the labour share do not
alter, however, the obvious long-run trend that has occurred in factor
distribution since the early 1980s. Using the four-year period of peak
labour share as a starting point (1974 through 1977), we can calculate the

THE DECLINING LABOUR SHARE IN AUSTRALIA 25
cumulative shift in factor shares that has occurred in the subsequent forty
years (using an equivalent four year period, 2014-2017, as the ending
point). Over that period the labour share of GDP declined by just over 8
percentage points of GDP. That represents the redistribution away from
labour of aggregate output in today’s terms of some $150 billion per year.
Figure 6: Redistribution of Factor Incomes, 1974-7 to 2014-7
Source: Author’s calculations from ABS Catalogue 5206.0, Table 7.
What other factors increased their share of national income, as labour’s
share was shrinking? Figure 6 indicates the cumulative change in factor
shares experienced by owners of other factors in the economy (following
the categorization of factor incomes in the ABS national accounts data).
The corporate sector was the primary beneficiary of the decline in the
labour share of GDP: gross corporate surplus (before depreciation and
taxes) increased by over 7 percentage points of GDP over the same forty-
year period. In other words, almost 90 percent of the decline in the
labour share over this time, was reflected in an increase in the corporate
share. It is interesting to note that, in turn, over half of the corporate gain
(more than 4 of the 7 percentage points change) was due to increased
operating profits for financial companies, attesting to the dramatic
26 JOURNAL OF AUSTRALIAN POLITICAL ECONOMY No 81
impact of financialisation on income distribution (a relationship explored
further in the article by Peetz in this journal). As discussed above,
governments have also collected a slightly larger share of GDP in the
form of indirect taxes (net of subsidies), primarily due to the introduction
of the GST. That shift has not been large: less than 1 percentage point of
GDP over the forty year-period.12
Two other significant shifts in factor
distribution round out the picture. Interestingly, mixed income (earned
by self-employed proprietors of farms and small businesses13
) has also
declined as a share of GDP, by over 4 percentage points. This has
occurred despite the increase in numbers of self-employed individuals in
recent years (arising from the trend toward outsourcing, independent
contractors, and ‘gig’ workers). This erosion of mixed incomes may
reflect similar shifts in market and institutional power, with small
businesses facing the same concentrated power of large businesses as
confront waged workers. The only other factor to increase its share of
GDP is the value ascribed in the national accounts to the operating
surplus generated on owner-occupied dwellings, which increased by 3
percentage points. The escalation of real estate prices and residential
construction in recent decades has been a clear factor in this shift.
In summary, by a range of statistical indicators, the share of total output
received by labour in all forms of compensation (wages, salaries, and
employer superannuation contributions) has declined substantially since
the peak of the postwar expansion in the mid-1970s. The decline in the
labour share was especially rapid in the latter 1980s (associated with the
deliberate effort to suppress wage growth implemented as part of the
Prices and Incomes Accords). However, the decline in the labour share
has continued in subsequent decades. Most of the decline is reflected in
a nearly-equal increase in gross corporate surpluses, led especially by the
financial sector. While movements in the labour share reflect a complex
mixture of cyclical and structural determinants, the long-run trend in the
factor distribution of income is clearly away from labour, and this almost
certainly reflects epochal shifts in the institutions and regulation of
income distribution during the neoliberal era.
12 As noted above, this increase in net indirect taxes explains why the decline in the wage share of factor income is slightly smaller than the decline in the labour share of GDP.
13 This flow is termed ‘mixed income’ because it is held to be a return both to the work of
those individuals, and to their invested personal capital.

THE DECLINING LABOUR SHARE IN AUSTRALIA 27
Australia’s Experience in International Perspective
It is often suggested that the erosion of labour incomes is a universal
phenomenon across industrialised countries, resulting from common
underlying factors such as technological change and globalisation. To be
sure, Australia is not the only country experiencing a substantial
redistribution of factor income from labour to capital over the neoliberal
era; in fact, it could be argued that achieving such a redistribution was
precisely the point of neoliberalism.14
However, it would be wrong to
assume that Australia’s experience simply reflects an overarching and
hence inevitable global trend. In fact, there is surprising diversity across
OECD countries in both the extent and even the direction of factor
income redistribution over the neoliberal era (Bentolila and Saint-Paul,
2003; Uguccioni and Sharpe, 2016). This suggests that considerable
influence is still wielded by factors (including institutional and policy
factors) specific to particular nations.
Figure 7 on the next page summarises, on the basis of consistent OECD
national accounts data, the cumulative decline in the labour share of GDP
in 25 industrialised countries during the neoliberal era. To reduce the
impact of specific events, it compares the average labour share over the
entire 1970s (prior to the advent of neoliberal policies in most countries)
to the average share experienced in the present decade (from 2010
through 2015, the most recent consistent data available). In one-third of
the countries considered, the labour share was stable or actually
increased. This immediately contradicts the assumption that this trend is
universal. In the other two-thirds of countries, the labour share declined,
but to very different extents. In some cases (including Sweden, Belgium,
Finland, Austria, and Canada), the decline was modest (2-3 percentage
points of GDP). The most dramatic erosion of the labour share was
experienced in Mexico (13 points) and Ireland (over 10 points).
14 Duménil and Lévy (2011: 8), make this point aptly: ‘The overall dynamics of capitalism under neoliberalism, both nationally and internationally, were determined by new class
objectives that worked to the benefit of the highest income brackets: capitalist owners and
the upper fractions of management.’
28 JOURNAL OF AUSTRALIAN POLITICAL ECONOMY No 81
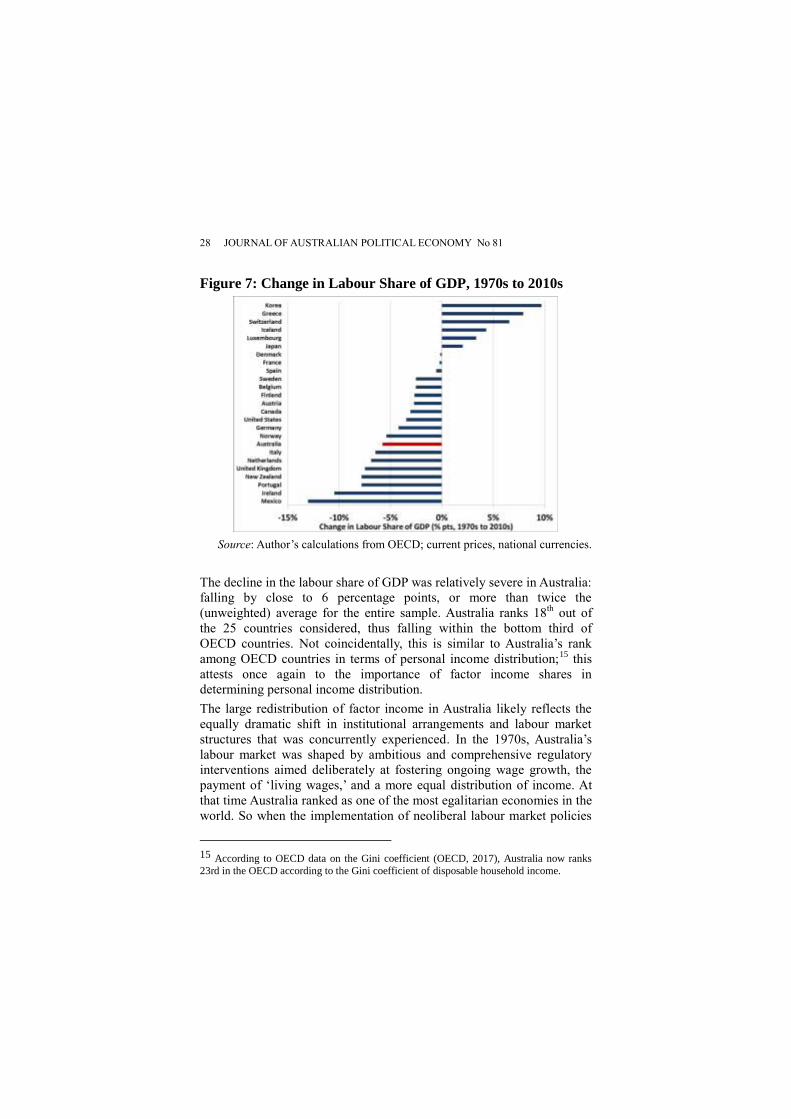
Figure 7: Change in Labour Share of GDP, 1970s to 2010s
Source: Author’s calculations from OECD; current prices, national currencies.
The decline in the labour share of GDP was relatively severe in Australia:
falling by close to 6 percentage points, or more than twice the
(unweighted) average for the entire sample. Australia ranks 18th
out of
the 25 countries considered, thus falling within the bottom third of
OECD countries. Not coincidentally, this is similar to Australia’s rank
among OECD countries in terms of personal income distribution;15
this
attests once again to the importance of factor income shares in
determining personal income distribution.
The large redistribution of factor income in Australia likely reflects the
equally dramatic shift in institutional arrangements and labour market
structures that was concurrently experienced. In the 1970s, Australia’s
labour market was shaped by ambitious and comprehensive regulatory
interventions aimed deliberately at fostering ongoing wage growth, the
payment of ‘living wages,’ and a more equal distribution of income. At
that time Australia ranked as one of the most egalitarian economies in the
world. So when the implementation of neoliberal labour market policies
15 According to OECD data on the Gini coefficient (OECD, 2017), Australia now ranks
23rd in the OECD according to the Gini coefficient of disposable household income.

THE DECLINING LABOUR SHARE IN AUSTRALIA 29
began, Australia’s starting point was unusual – and hence the ‘distance
traveled’ under neoliberalism has been relatively larger.16
The relatively dramatic restructuring of labour market policy in Australia
is evidenced by clear trends in several important institutional
determinants of factor income distribution:17
A steep decline in trade union density in Australia (falling from
over 50 percent in the 1950s to under 15 percent at present) –
one of the most dramatic declines of any OECD country.
The erosion of minimum wage policy, measured by a large
decline in Australian minimum wages as a share of median
earnings.
The restructuring of Australia’s unique ‘awards system’ for
regulating and arbitrating wages and working conditions on a
sector-wide basis, which beginning in the 1990s became a
network of minimum ‘safety net’ protections (no longer used to
set the pace for general labour compensation).
The expansion of non-standard and precarious employment,
including casual work, irregular part-time positions, and various
forms of marginal self-employment (such as ‘gig’ jobs with
digital platform businesses).
While the sustained reduction in the labour share of Australian GDP
certainly reflects the impact of the broader global shift toward neoliberal
policy, therefore, the relatively severe extent of that shift also reflects the
unique and relatively extreme history of neoliberalism here.
Conclusion
The rise and fall of the labour share of GDP in Australia is an empirical
symbol of the corresponding rise and fall of the postwar vision of
managed, inclusive growth – and its replacement by a less forgiving
16 New Zealand has also experienced one of the most dramatic shifts away from labour in
the factor distribution of income, reflecting a similar shift from relatively interventionist
and egalitarian labour policies to a more typical neoliberal approach.
17 The extent of the historical shift in these and other Australian labour market policies
under neoliberalism is described in more detail in the article by Mackenzie in this journal;
see also Stanford (forthcoming).

30 JOURNAL OF AUSTRALIAN POLITICAL ECONOMY No 81
capitalist political economy. The steady expansion of the labour share of
GDP through the first three decades after the Second World War reflected
the spillover benefits of vibrant accumulation and growth, combined with
efforts to distribute the gains of that growth through egalitarian labour
policies, a growing network of public services, and a redistributive tax
and transfer system. That regime reached its limits in the 1970s, in
Australia and elsewhere, as evidenced by inflation, slowing growth, and
financial and political instability. Corporate elites and their political
allies began to push back fiercely with a multidimensional strategy to
restore business dominance of the economy, politics, and society. A
fundamental restructuring of power balances in the labour market was a
core component of that effort. Both the extent and the timing of the
subsequent decline in labour’s share of GDP reflect the unique
characteristics of neoliberalism in Australia: including the bipartisan
consensus around its major features that has prevailed through most of
this time.18
By 2017, the labour share of GDP had reached its lowest
level in almost 60 years, reflecting both the longer-run structural shift in
factor distribution (away from labour, and toward profits) and more
cyclical and immediate factors (such as continuing fluctuations in prices
for Australia’s resource exports).
This observed experience suggests two important conclusions. First, the
traditional expectation that an expanding GDP will automatically lift
labour incomes is no longer valid. Wages no longer rise in tandem with
either aggregate economic output or with labour productivity. Second,
the redistributive institutions which helped to create and maintain a
correlation (evident in the initial postwar decades) between growth,
productivity, and wages, have been dramatically weakened by successive
labour market ‘reforms.’ To restore growth in real wages as a normal
economic outcome, and to rebuild labour’s share of the economic pie,
will require an ambitious effort to modernise and strengthen those
redistributive institutions.
In sum, there is no reason to believe (indeed, there never was) that
economic growth alone will ‘lift all boats’ and automatically ‘trickle
down’ into material improvements for working Australians. Australian
18 This consensus may be breaking down at present due to growing discontent with
inequality and wage stagnation, and resulting space for political leaders to break with
fundamental neoliberal precepts.

THE DECLINING LABOUR SHARE IN AUSTRALIA 31
workers are certainly more productive, and the economy is larger than
ever. But workers need pro-active supports (including stronger and more
comprehensive minimum wages, stronger employment standards, and a
resuscitation of collective bargaining) to defend and rebuild their share of
that pie.
Jim Stanford is Director of the Centre for Future Work and Visiting
Professor in Political Economy at the University of Sydney
References
Atkinson, Anthony B. (2009). ‘Factor Shares: The Principal Problem of Political
Economy?’, Oxford Review of Economic Policy 25(1), pp. 3-16.
Austin, Lydia, and Roberton Williams (2015). Composition of Income Reported on Tax
Returns in 2012. Washington: Tax Policy Center.
Bentolila, Samuel, and Gilles Saint-Paul (2003). ‘Explaining Movements in the Labor
Share,’ B.E. Journal of Macroeconomics 3(1), pp. 1-33.
Bertola, Giuseppe, Reto Foellmi and Josef Zweimüller (2006). Income Distribution in
Macroeconomic Models. Princeton: Princeton University Press.
Bhaduri, Amit, and Stephen Marglin (1990). ‘Unemployment and the Real Wage: The
Economic Basis for Contesting Political Ideologies,’ Cambridge Journal of Economics
14(4), pp. 375-393.
Brennan, Jordan (2016). Rising Corporate Concentration, Declining Trade Union Power,
and the Growing Income Gap: American Prosperity in Historical Perspective, Levy
Economics Institute of Bard College, March, http://www.levyinstitute.org
/pubs/e_pamphlet_1.pdf.
Cowgill, Matt (2013). A Shrinking Slice of the Pie. Melbourne: Australian Council of
Trade Unions.
Glyn, Andrew (2011). ‘Functional Distribution and Inequality,’ in Wiemer Salverda, Brian
Nolan, and Timothy M. Smeeding, eds., Oxford Handbook of Economic Inequality. Oxford:
Oxford University Press.
Gordon, David M. (1990). ‘Who Bosses Whom? The Intensity of Supervision and the
Discipline of Labor,’ American Economic Review, Papers and Proceedings 80(2), pp. 28-
32.
Hutchens, Gareth (2018). ‘Top 1% of Australians own more wealth than bottom 70%
combined,’ The Guardian Australia, 22 January, https://www.theguardian.com/australia-
news/2018/jan/22/top-1-per-cent-of-australians-own-more-wealth-than-bottom-70-per-
cent-combined.

32 JOURNAL OF AUSTRALIAN POLITICAL ECONOMY No 81
International Monetary Fund (2017). ‘Understanding the Downward Trend in Labor
Income Shares,’ World Economic Outlook, April, Chapter 3, pp. 121-172.
Office of the Chief Economist (2018). Flexibility and Growth, Department of Industry,
Innovation and Science, March, https://www.industry.gov.au/Office-of-the-Chief-
Economist/Publications/IndustryInsights/documents/Industry-Insights-Flexibilty-and-
growth.pdf.
Organization for Economic Cooperation and Development (2017). OECD Income
Distribution Database (IDD): Gini, Poverty, Income, Methods and Concepts. Paris:
Organization for Economic Cooperation and Development, http://www.oecd.org
/social/income-distribution-database.htm.
Palley, Thomas I. (2000). ‘Conflict, Distribution, and Finance in Alternative
Macroeconomic Traditions,’ in Jim Stanford, Lance Taylor, and Ellen Houston, eds.,
Power, Employment and Accumulation. Armonk, N.Y. M.E.Sharpe, pp. 107-137.
Piketty, Thomas (2014). Capital in the Twenty-First Century. Cambridge, MA: Harvard
University Press.
Quiggin, John (2018). ‘Government Report Cheers for Wage Cuts,’ Commentary on
Australian & World Events from a Social-Democratic Perspective (blog site), 22 March,
http://johnquiggin.com/2018/03/22/government-report-cheers-for-wage-cuts/.
Ricardo, David (1911). Principles of Political Economy. London: Dent.
Saez, Emmanuel (2016). ‘Striking it Richer: The Evolution of Top Incomes in the United
States,’ UC Berkley Discussion Paper, 30 June, https://eml.berkeley.edu/~saez/saez-
UStopincomes-2015.pdf.
Schwellnus, Cyrille, Andreas Kappeler, and Pierre-Alain Pionnier (2017). ‘Decoupling of
Wages from Productivity: Macro-Level Facts,’ Economics Department Working Paper
#1373. Paris: Organization for Economic Cooperation and Development.
Sheil, Christopher, and Frank Stilwell (2016). The Wealth of the Nation: Current Data on
the Distribution of Wealth in Australia. Sydney: Evatt Foundation.
Stanford, Jim (2015). Economics for Everyone: A Short Guide to the Economics of
Capitalism. London: Pluto, 2nd edition.
Stanford, Jim (forthcoming). ‘“Fair Go” No More: Australian Neoliberalism and Labour
Market Policy,’ in Damien Cahill and Philip Toner, eds., The Costs of Economic Reform.
Melbourne: Black Inc.
Stiglitz, Joseph E. (2012). The Price of Inequality: How Today's Divided Society
Endangers Our Future. New York: Norton.
Stockhammer, Engelbert, and Marc Lavoie (2013). Wage-Led Growth: An Equitable
Strategy for Economic Recovery. Geneva: International Labour Organization.
Treasury, Government of Australia (2017). Analysis of Wage Growth, November,
https://treasury.gov.au/publication/p2017-t237966/.
Wilkinson, Richard G., and Kate Pickett (2009). The Spirit Level: Why More Equal
Societies Almost Always Do Better. London: Allen Lane.