The DDM and Common Stock Valuation Some quick examples, courtesy of Harcourt –The Effect of...
22
The DDM and Common Stock Valuation • Some quick examples, courtesy of Harcourt – The Effect of Evolving Growth Rates – Valuation via Operating Cash Flow
-
date post
19-Dec-2015 -
Category
Documents
-
view
215 -
download
0
Transcript of The DDM and Common Stock Valuation Some quick examples, courtesy of Harcourt –The Effect of...

The DDMand Common Stock Valuation
• Some quick examples, courtesy of Harcourt– The Effect of Evolving Growth Rates
– Valuation via Operating Cash Flow

Assume beta = 1.2, kRF = 7%, and kM = 12%. What is the required rate of return
on the firm’s stock?
ks= kRF + (kM – kRF)bFirm
= 7% + (12% – 7%) (1.2) = 13%.
Use the SML to calculate ks:

D0 was $2.00 and g is a constant 6%. Find the expected dividends for the next
3 years, and their PVs. ks = 13%.
0 1
2.247
2
2.382
3g = 6%
1.87611.7599
D0 = 2.00
1.6509
13%2.12

= =
What’s the stock’s market value? D0 = 2.00, ks = 13%, g = 6%.
Constant growth model:
P0 = = D1
ks – g 0.13 – 0.06
$2.12
$2.12
0.07$30.29.

• D1 will have been paid, so expected dividends are D2, D3, D4 and so on. Thus,
Could also find P1 as follows:
ks – g 0.13 – 0.06 P1 = =
What is the stock’s market value one year from now, P1?
^
^
^
D2 $2.247^
= $32.10.
P1 = P0(1.06) = $32.10.

Find the expected dividend yield, capital gains yield, and total return during the
first year.
Dividend yld = = =
Cap gains yld = =
Total return = 7.0% + 6.0% = 13.0%.
D1
P0
P1 – P0
P0
^$30.29$2.12
7.0%.
$32.10 – $30.29$30.29
= 6.0%.
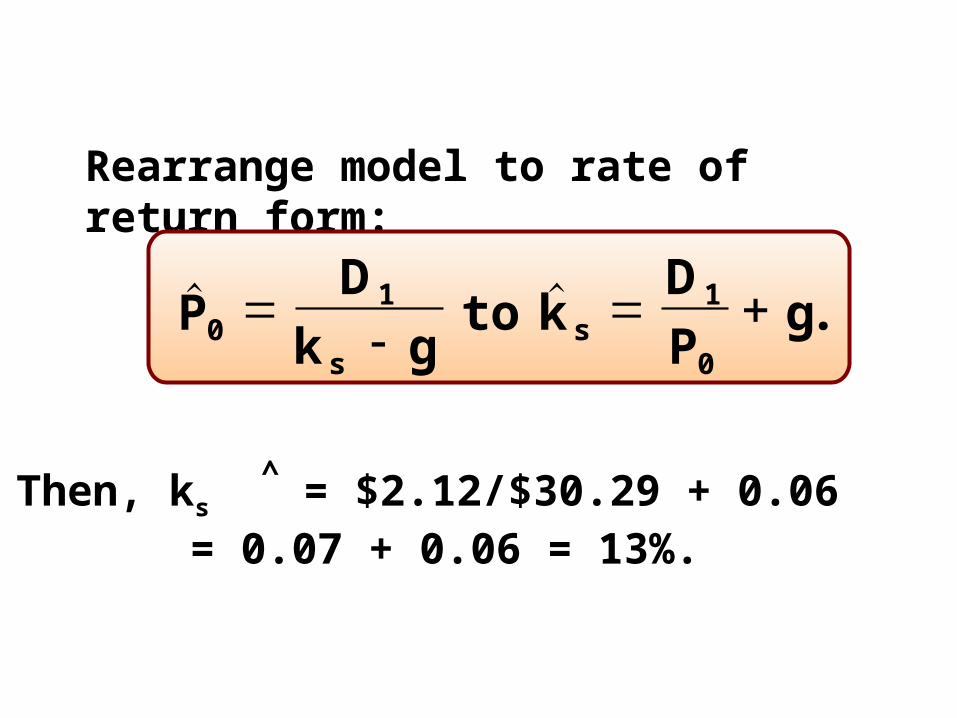
Rearrange model to rate of return form:
.PD
k g
D
Pg
s0
1 1
0
to k s
Then, ks = $2.12/$30.29 + 0.06= 0.07 + 0.06 = 13%.
^

P0 = = = $15.38.
What would P0 be if g = 0?
The dividend stream would be a perpetuity.
2.00 2.002.00
0 1 2 313% ...
^ PMTk
$2.000.13
^

• Can no longer use constant growth model.• However, growth becomes constant after 3
years.
If we have supernormal growth of 30% for 3 years, then a long-run constant g = 6%, what is P0? k is still 13%.
^

Nonconstant growth followed by constantgrowth:
0
2.301
2.647
3.045
46.116
1 2 3 4ks = 13%
54.109 = P0
g = 30% g = 30% g = 30% g = 6%
D0 = 2.00 2.600 3.380 4.394 4.658
.. .
$66.54P34.65813 0 06
0
...
^

What is the expected dividend yield and capital gains yield at t = 0?
At t = 4?
Div. yield0 = = 4.81%.
Cap. gain0 = 13.00% – 4.81% = 8.19%.
$2.60$54.11

• During nonconstant growth, D/P and capital gains yield are not constant, and capital gains yield is less than g.
• After t = 3, g = constant = 6% = capital gains yield; k = 13%; so D/P = 13% – 6% = 7%.

25.72
Suppose g = 0 for t = 1 to 3, and then g is a constant 6%. What is P0?
0
1.771.571.39
20.99
1 2 3 4ks=13%
g = 0% g = 0% g = 0% g = 6%
2.00 2.00 2.00 2.00 2.12
.P3
2.12
0 0730.29.
^
...

t = 3: Now have constant growth with g = capital gains yield = 6% and D/P = 7%.
$2.00$25.72
What is D/P and capital gains yield at t = 0 and at t = 3?
t = 0:D1
P0
= = 7.78%.
CGY = 13% – 7.78% = 5.22%.

If g = -6%, would anyone buy the stock? If so, at what price?
Firm still has earnings and still paysdividends, so P0 > 0:
PD
k g
D g
k gs s0
1 0 1=
=
$2.00(0.94) $1.880.13 – (-0.06) 0.19
= = = $9.89.

What is the annual D/P and capital gains yield?
Capital gains yield = g = -6.0%,
Dividend yield= 13.0% – (-6.0%) = 19%.
D/P and cap. gains yield are constant,with high dividend yield (19%) offsettingnegative capital gains yield.

Free Cash Flow Method
• The free cash flow method suggests that the value of the entire firm equals the present value of the firm’s free cash flows (calculated on an after-tax basis).
• Recall that the free cash flow in any given year can be calculated as:
NOPAT – Net capital investment.

• Once the value of the firm is estimated, an estimate of the stock price can be found as follows:– MV of common stock (market capitalization) =
MV of firm – MV of debt and preferred stock.– P = MV of common stock/# of shares.
Using the Free Cash Flow Method
^

• Free cash flow method is often preferred to the dividend growth model--particularly for the large number of companies that don’t pay a dividend, or for whom it is hard to forecast dividends.
Issues Regarding the Free Cash Flow Method
(More...)
• Similar to the dividend growth model, the free cash flow method generally assumes that at some point in time, the growth rate in free cash flow will become constant.
• Terminal value represents the value of the firm at the point in which growth becomes constant.
FCF Method Issues Continued

416.942
FCF estimates for the next 3 years are -$5, $10, and $20 million, after which
the FCF is expected to grow at 6%. The overall firm cost of capital is 10%.
0
-4.5458.264
15.026398.197
1 2 3 4k = 10%
g = 6%
-5 10 20 21.20
21.200.04
...
*TV3 represents the terminal value of the firm, at t = 3.
530 = = *TV3

If the firm has $40 million in debt and has 10 million shares of stock, what is
the price per share?
Value of equity = Total value – Value of debt
= $416.94 – $40
= $376.94 million.
Price per share = Value of equity/# of shares
= $376.94/10
= $37.69.