
The DCS-120 Confocal Scanning FLIM System · 2015-07-17 · The bh DCS-120 confocal scanning FLIM...
10
Application Note dcs-appnote3.doc 1 The DCS-120 Confocal Scanning FLIM System The bh DCS-120 confocal scanning FLIM system converts a conventional microscope into a high-performance fluorescence lifetime imaging system. The system is based on picosecond diode laser excitation, fast galvanometer-mirror scanning, confocal detection, and bh’s multi-dimensional TCSPC technique. The system features high sensitivity, high time resolution, multi-spectral FLIM capability, and extremely fast recording. Overview The DCS-120 system complements the bh series of modular FLIM systems for the Zeiss, Leica, and Olympus laser scanning microscopes [4, 5, 6]. Different than these systems, the DCS-120 does not require an expensive laser scanning microscope. Instead, the DCS-120 system consists of a confocal scan head, one or two bh BDL-SMC picosecond diode lasers [10], one or two detectors, a scan controller, and one or two bh TCSPC modules [2]. The scan head is attached to a side port or back port of a conventional inverted microscope, see Fig. 1. The DCS-120 scans the sample by deflecting the laser beam by fast galvanometer mirrors. The fluorescence light returning from the sample is split into two channels of different wavelength or different polarisation. The signals are fed through confocal pinholes to reject light from outside the focal plane. The signals are detected by two separate detectors. The detectors are directly coupled to the scanner thus avoiding coupling loss or pulse dispersion in optical fibres. A number of different detectors are available, including the bh MW-FLIM multi spectral detection system [2, 3, 7]. Fig. 1: DCS-120 scan head attached to a Nikon TE 2000 inverted microscope The signals of the detectors are processed by bh’s multi-dimensional TCSPC technique [1, 2]. The DCS-120 is compatible with any of the bh SPC-830, SPC-140, or SPC-150 modules. The signals of both detectors can either be processed by a single TCSPC module or by two parallel TCSPC
Transcript of The DCS-120 Confocal Scanning FLIM System · 2015-07-17 · The bh DCS-120 confocal scanning FLIM...

Application Note
dcs-appnote3.doc 1
The DCS-120 Confocal Scanning FLIM System
The bh DCS-120 confocal scanning FLIM system converts a conventional microscope into a high-performance fluorescence lifetime imaging system. The system is based on picosecond diode laser excitation, fast galvanometer-mirror scanning, confocal detection, and bh’s multi-dimensional TCSPC technique. The system features high sensitivity, high time resolution, multi-spectral FLIM capability, and extremely fast recording.
Overview
The DCS-120 system complements the bh series of modular FLIM systems for the Zeiss, Leica, and Olympus laser scanning microscopes [4, 5, 6]. Different than these systems, the DCS-120 does not require an expensive laser scanning microscope. Instead, the DCS-120 system consists of a confocal scan head, one or two bh BDL-SMC picosecond diode lasers [10], one or two detectors, a scan controller, and one or two bh TCSPC modules [2]. The scan head is attached to a side port or back port of a conventional inverted microscope, see Fig. 1. The DCS-120 scans the sample by deflecting the laser beam by fast galvanometer mirrors. The fluorescence light returning from the sample is split into two channels of different wavelength or different polarisation. The signals are fed through confocal pinholes to reject light from outside the focal plane. The signals are detected by two separate detectors. The detectors are directly coupled to the scanner thus avoiding coupling loss or pulse dispersion in optical fibres. A number of different detectors are available, including the bh MW-FLIM multi spectral detection system [2, 3, 7].
Fig. 1: DCS-120 scan head attached to a Nikon TE 2000 inverted microscope
The signals of the detectors are processed by bh’s multi-dimensional TCSPC technique [1, 2]. The DCS-120 is compatible with any of the bh SPC-830, SPC-140, or SPC-150 modules. The signals of both detectors can either be processed by a single TCSPC module or by two parallel TCSPC
Application Note
2 dcs-appnote3.doc
modules. With parallel processing lifetime images can be obtained at unprecedented count rates and extremely short acquisition times.
The control of the DCS-120 scanner is fully integrated into the bh SPCM data acquisition software. Thus, the DCS-120 system allows the user to exploit the full range of functions of the bh TCSPC technique [2].
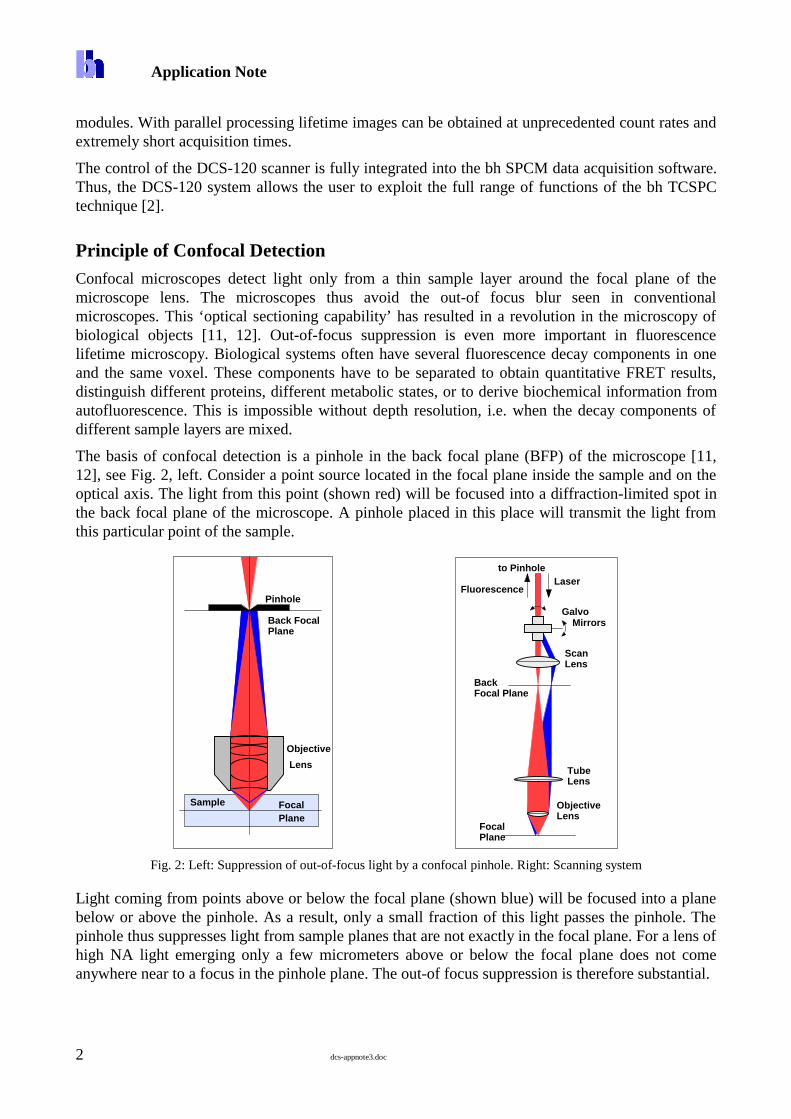
Principle of Confocal Detection
Confocal microscopes detect light only from a thin sample layer around the focal plane of the microscope lens. The microscopes thus avoid the out-of focus blur seen in conventional microscopes. This ‘optical sectioning capability’ has resulted in a revolution in the microscopy of biological objects [11, 12]. Out-of-focus suppression is even more important in fluorescence lifetime microscopy. Biological systems often have several fluorescence decay components in one and the same voxel. These components have to be separated to obtain quantitative FRET results, distinguish different proteins, different metabolic states, or to derive biochemical information from autofluorescence. This is impossible without depth resolution, i.e. when the decay components of different sample layers are mixed.
The basis of confocal detection is a pinhole in the back focal plane (BFP) of the microscope [11, 12], see Fig. 2, left. Consider a point source located in the focal plane inside the sample and on the optical axis. The light from this point (shown red) will be focused into a diffraction-limited spot in the back focal plane of the microscope. A pinhole placed in this place will transmit the light from this particular point of the sample.
Objective
Lens
Pinhole
Back FocalPlane
FocalPlane
Sample
Laser Fluorescence
GalvoMirrors
Scan Lens
TubeLens
ObjectiveLens
FocalPlane
BackFocal Plane
to Pinhole
Fig. 2: Left: Suppression of out-of-focus light by a confocal pinhole. Right: Scanning system
Light coming from points above or below the focal plane (shown blue) will be focused into a plane below or above the pinhole. As a result, only a small fraction of this light passes the pinhole. The pinhole thus suppresses light from sample planes that are not exactly in the focal plane. For a lens of high NA light emerging only a few micrometers above or below the focal plane does not come anywhere near to a focus in the pinhole plane. The out-of focus suppression is therefore substantial.

Application Note
dcs-appnote3.doc 3
An optical system as the one shown in Fig. 2, left, does, of course, not deliver an image of the sample. To obtain an image, the point from which the light is detected must be scanned over the sample. Scanning can be achieved by moving the sample by a piezo stage. Moving the sample has the benefit that the point from which the system detects is always on the optical axis. The drawback is, however, that piezo scanning is slow. Confocal laser scanning microscopes therefore use optical beam scanning by galvanometer-driven mirrors (often called ‘galvos’). The principle is shown in Fig. 2, right. The collimated laser beam is deflected by the galvo mirrors. It then passes the ‘scan lens’. This lens actually replaces the eyepiece of the microscope. It focuses the laser into the back focal plane, which is conjugate with the focal plane of the microscope objective lens in the sample. The angular motion of the galvos scans a focused spot of laser light across the back focal plane and thus over the focal plane in the sample.
The second task performed by the scan lens is a projection of the galvo rotation axis into the principal plane of the microscope lens. The motion of the laser beam at the back aperture of the microscope lens is therefore mainly an angular one.
Fluorescence light emitted in the focal plane is returned via the same beam path. After being reflected at the galvo mirrors the fluorescence light forms a stationary collimated beam. In other words, the fluorescence beam is ‘descanned’. It can therefore be focused into a stationary pinhole. The light passing the pinhole is detected, and the image is built up from the detector signal and the known momentary position of the laser beam in the scan area.
DCS-120 Scan Head
A schematic drawing of the DCS-120 scan head is shown in Fig. 3.
To Detector 1
Detector 2
Pinhole wheel
Pinhole wheelDichroicbeamsplitterwheel
Filter sliders
Filter sliders
Telescope
Galvos
Scanlens
Main dichroicassembly
Beam
Dichroic Mirror
400 500 600 700
Tz405-473
400 500 600 700
Tz405rdc
400 500 600 700
Thq485lp
485
400 500 600 700
Thq435lp
435
400 500 600 700
Thq480/40m460-500CFP
400 500 600 700
T hq620/60m590-650Ds Red
Mirror
Filter Sliders
405nm
473nm or 440nm
To
Secondary
combiner
400 500 600 700
Thq535
YFP
/30m520-550
Input Laser 1
Input Laser 2
Variable ND
Variable ND
wheel
wheel
400 500 600 700
T 510dclp
400 500 600 700
T 560dclp
Fig. 3: Schematics of the DCS-120 scan head with characteristics of standard filters and dichroics

Application Note
4 dcs-appnote3.doc
One or two BDL-SMC diode lasers are connected to the scan head via single-mode optical fibres [10]. Both laser input channels have neutral-density filter wheels. By these filter wheels, the laser intensity can be varied within a range of more than 1:100. Both laser beams are combined via a dichroic mirror. A mirror sends the combined laser beams down to the main dichroic beamsplitter assembly.
The main dichroic assembly consists of a solid block that holds a conventional mirror and the dichroic. The dichroic is designed to reflect the laser and transmit the fluorescence. The benefit of this design is that the excitation light is less likely to induce fluorescence in the glass of the dichroic. The complete dichroic assembly can be replaced, see Fig. 4, left.
After being reflected at the main dichroic the laser beam is deflected by the galvanometer mirrors. The galvos are shown in Fig. 4, right. The mirrors have small size and, consequently, small moments of inertia. Moreover, optimised electronic control and optimised flyback trajectories minimise mechanical resonance. The scanner thus achieves line times down to 0.6 ms and pixel times down to 0.6 µs.
Fig. 4: Left: Dichroic assembly. Right: Galvanometer mirrors of the DCS-120 scan head
The excitation light leaves the scanner through the scan lens. The lens focuses the laser into the back focal plane of the microscope and simultaneously projects the galvo rotation axis on the back aperture of the microscope lens (see Fig. 2).
The fluorescence light returned from the sample enters the scanner via the scan lens. The scan lens collimates the light into a narrow beam. The motion of the beam is ‘descanned’ by reflection at the galvo mirrors. The descanned beam passes the main dichroic. The result is a stationary beam of fluorescence light that is largely free of the laser light.
The beam of fluorescence light passes a lens system that further reduces the beam diameter and increases the magnification. The beam is then split into two components by the secondary beamsplitter. This is a wheel containing two dichroics, a polarising beamsplitter, a mirror, and a glass plate. Thus, the light can be split into two different wavelength components, two components of 0° and 90° polarisation, or the full signal can be sent into either detection channel.
Both detection channels have separate pinholes wheels. Each wheel contains 11 pinholes from 0.25 to 5 mm diameter. Depending on the NA and the magnification factor of the microscope objective lens used the effective pinhole diameters range from about 0.5 to 10 Airy disk diameters.
After having passed the pinholes the light of each channel passes two filters. The filters are contained in sliders which can be replaced from outside the scan head. Typically, the first filter position is used for a laser blocking filter, the second for a bandpass filter. The DCS-120 scan head

Application Note
dcs-appnote3.doc 5
comes with a number of standard filters and dichroics. The approximate filter characteristics are indicated in Fig. 3. Other filters and dichroics are available on request.
Integration into the TCSPC System
The system components of the DCS-120 systems are shown in Fig. 5. The system consists of the scan head, one or two bh BDL-SMC diode lasers [10], a DCC-100 detector control module [8], a GVD-120 scan controller card, the GDA-120 galvo driver amplifier, and a bh TCSPC module [2]. The standard module for the DCS system is the SPC-150, but SPC-830 or SPC-140 modules can be used as well.
Fig. 5: Components of the DCS-120 scanning system. Upper row. Scan head, BDL-SMC laser, DCC-100 detector
controller. Lower row: GVD-120 galvo driver, GDA-120 galvo amplifier, SPC-150 TCSPC module
Systems containing a single SPC-150 TCSPC module come in a lap-top computer with a bus extension box, see Fig. 6. Systems with two SPC modules come in a standard PC.
Fig. 6: Simple-Tau 150 compact TCSPC system. The scanner control, detector control, and the TCSPC electronics is
contained in an extension box of a lap-top computer
The control of the scanner is fully integrated in the SPCM software of the bh TCSPC modules [2]. The main panel of the SPCM software can be configured by the user. Fig. 7 shows a typical configuration for a one-detector system. An image in a selected time window is displayed on the left. The scanner control panel is kept open on the right. The detector control panel has been placed
Application Note
6 dcs-appnote3.doc
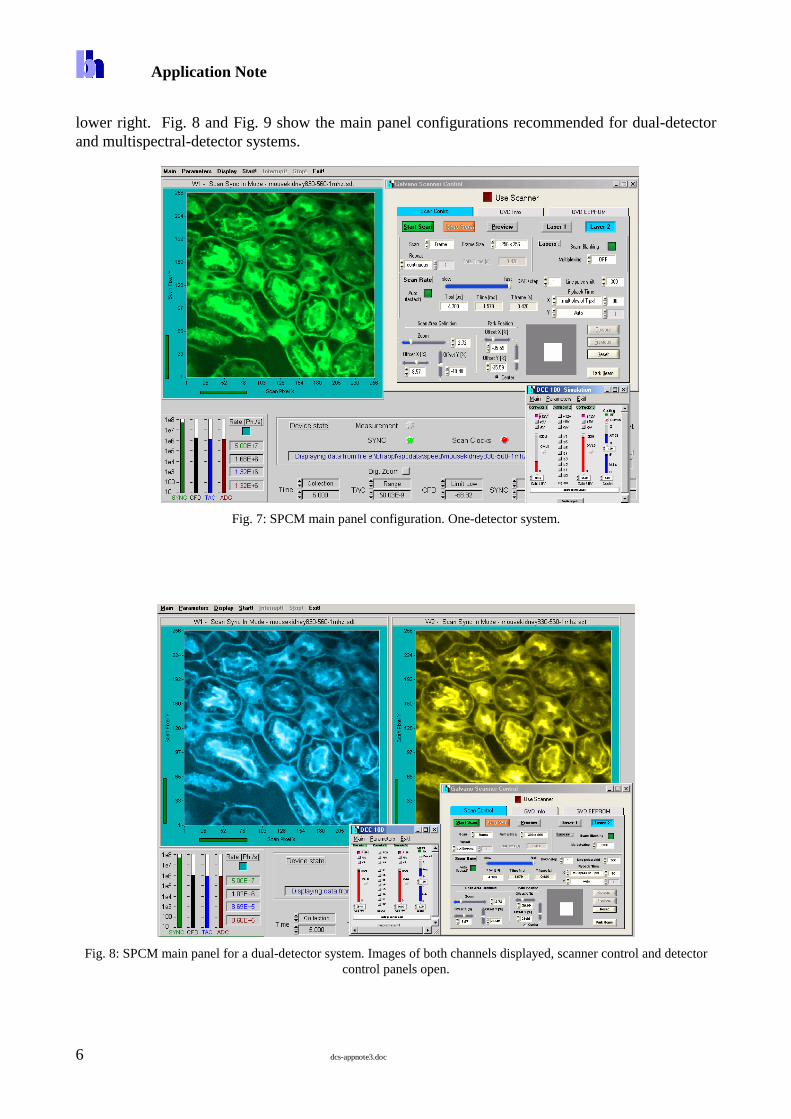
lower right. Fig. 8 and Fig. 9 show the main panel configurations recommended for dual-detector and multispectral-detector systems.
Fig. 7: SPCM main panel configuration. One-detector system.
Fig. 8: SPCM main panel for a dual-detector system. Images of both channels displayed, scanner control and detector
control panels open.
Application Note
dcs-appnote3.doc 7
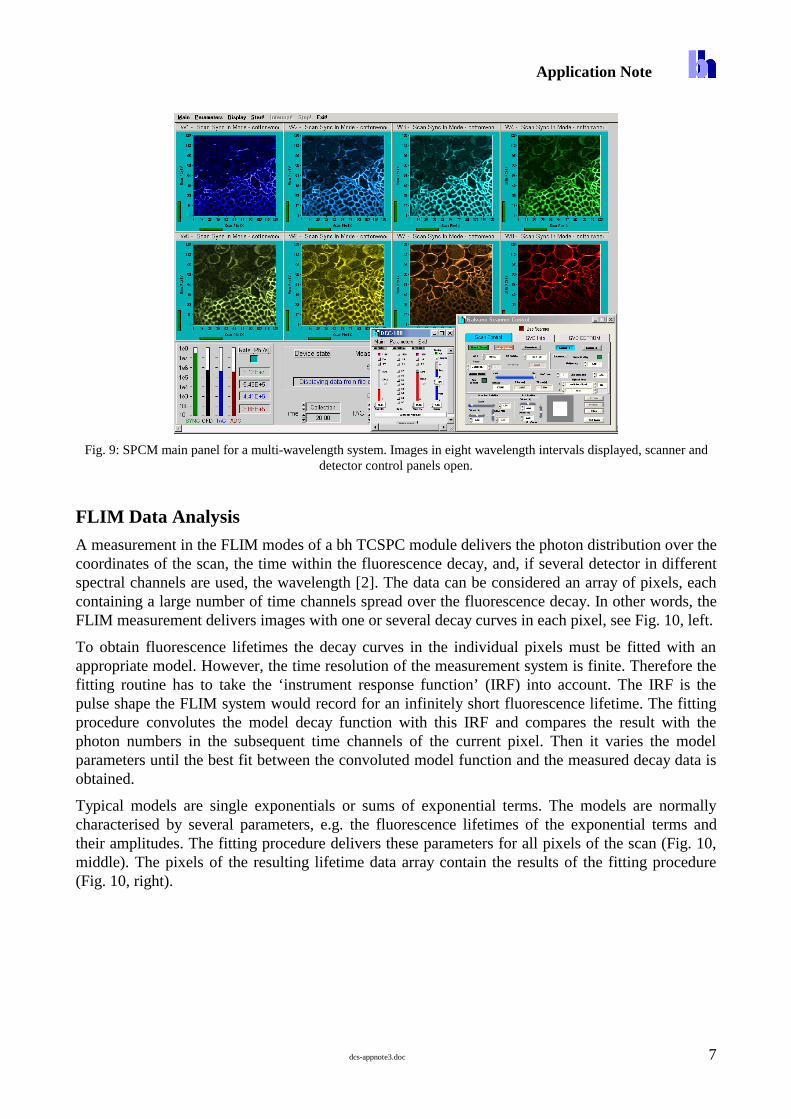
Fig. 9: SPCM main panel for a multi-wavelength system. Images in eight wavelength intervals displayed, scanner and
detector control panels open.
FLIM Data Analysis
A measurement in the FLIM modes of a bh TCSPC module delivers the photon distribution over the coordinates of the scan, the time within the fluorescence decay, and, if several detector in different spectral channels are used, the wavelength [2]. The data can be considered an array of pixels, each containing a large number of time channels spread over the fluorescence decay. In other words, the FLIM measurement delivers images with one or several decay curves in each pixel, see Fig. 10, left.
To obtain fluorescence lifetimes the decay curves in the individual pixels must be fitted with an appropriate model. However, the time resolution of the measurement system is finite. Therefore the fitting routine has to take the ‘instrument response function’ (IRF) into account. The IRF is the pulse shape the FLIM system would record for an infinitely short fluorescence lifetime. The fitting procedure convolutes the model decay function with this IRF and compares the result with the photon numbers in the subsequent time channels of the current pixel. Then it varies the model parameters until the best fit between the convoluted model function and the measured decay data is obtained.
Typical models are single exponentials or sums of exponential terms. The models are normally characterised by several parameters, e.g. the fluorescence lifetimes of the exponential terms and their amplitudes. The fitting procedure delivers these parameters for all pixels of the scan (Fig. 10, middle). The pixels of the resulting lifetime data array contain the results of the fitting procedure (Fig. 10, right).

Application Note
8 dcs-appnote3.doc
Fit Procedure
Model, fitted to data
Data, photon numbersin time channels
1, 2
a1, a2Results:
Pixels Pixels
Fig. 10: Analysis of FLIM data. Left: Raw data, pixels contain decay curves. Middle: Fit procedure, delivers lifetimes and amplitudes for individual pixels. Right: Lifetime data: Pixels contain results of fit procedure
In the DCS-120 system the lifetime images are calculated by the bh SPCImage FLIM data analysis software [4, 5, 6, 9]. There is a direct link between the SPCM and the SPCImage software. The data analysis can therefore be started without further user interaction. The main panel of SPCImage is shown in Fig. 11.
Fig. 11: Main panel of the SPCImage data analysis software. Spores of Amanita Citrina, triple-exponential decay model,
lifetime image shows amplitude-weighted average of the three lifetime components.
Fig. 11 shows a lifetime image calculated from an amplitude-weighted average of the three lifetimes of a triple-exponential decay. Images of the lifetimes of the individual components and there amplitudes can be obtained as well. For FRET experiments the average FRET efficiency, the fraction of interacting proteins, or the FRET efficiency of the interacting protein fraction can be calculated and displayed.
Application Note
dcs-appnote3.doc 9
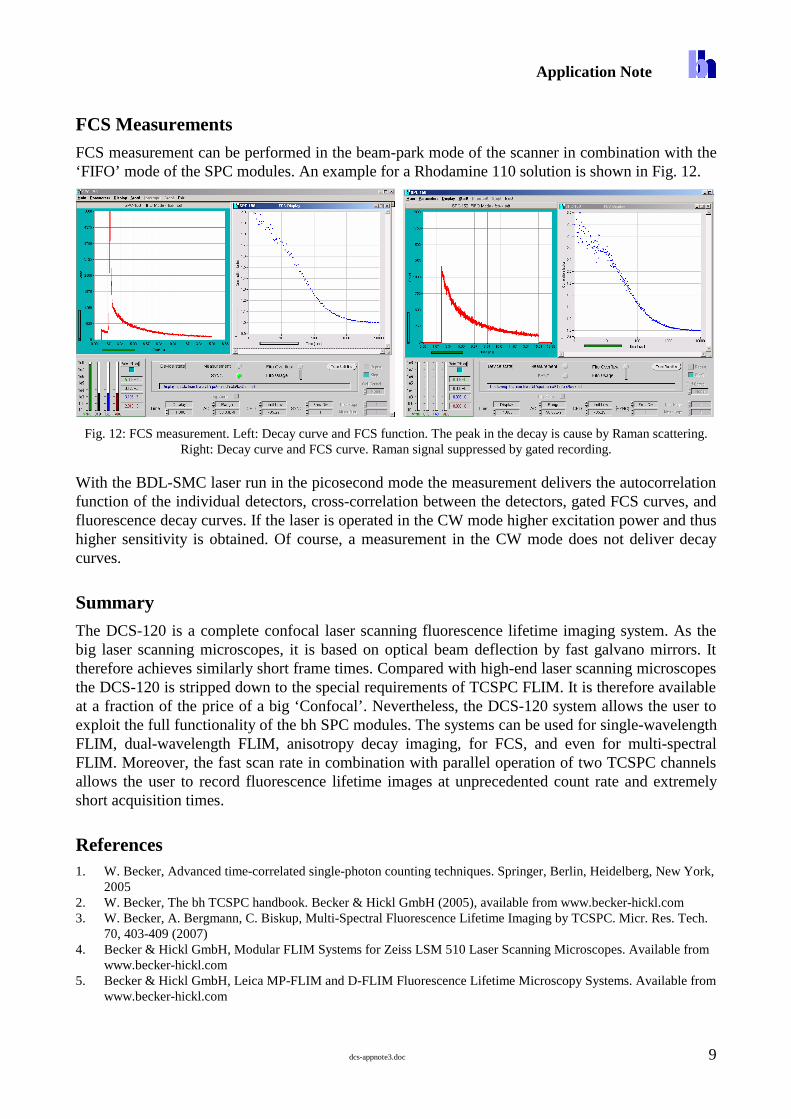
FCS Measurements
FCS measurement can be performed in the beam-park mode of the scanner in combination with the ‘FIFO’ mode of the SPC modules. An example for a Rhodamine 110 solution is shown in Fig. 12.
Fig. 12: FCS measurement. Left: Decay curve and FCS function. The peak in the decay is cause by Raman scattering.
Right: Decay curve and FCS curve. Raman signal suppressed by gated recording.
With the BDL-SMC laser run in the picosecond mode the measurement delivers the autocorrelation function of the individual detectors, cross-correlation between the detectors, gated FCS curves, and fluorescence decay curves. If the laser is operated in the CW mode higher excitation power and thus higher sensitivity is obtained. Of course, a measurement in the CW mode does not deliver decay curves.
Summary
The DCS-120 is a complete confocal laser scanning fluorescence lifetime imaging system. As the big laser scanning microscopes, it is based on optical beam deflection by fast galvano mirrors. It therefore achieves similarly short frame times. Compared with high-end laser scanning microscopes the DCS-120 is stripped down to the special requirements of TCSPC FLIM. It is therefore available at a fraction of the price of a big ‘Confocal’. Nevertheless, the DCS-120 system allows the user to exploit the full functionality of the bh SPC modules. The systems can be used for single-wavelength FLIM, dual-wavelength FLIM, anisotropy decay imaging, for FCS, and even for multi-spectral FLIM. Moreover, the fast scan rate in combination with parallel operation of two TCSPC channels allows the user to record fluorescence lifetime images at unprecedented count rate and extremely short acquisition times.
References 1. W. Becker, Advanced time-correlated single-photon counting techniques. Springer, Berlin, Heidelberg, New York,
2005 2. W. Becker, The bh TCSPC handbook. Becker & Hickl GmbH (2005), available from www.becker-hickl.com 3. W. Becker, A. Bergmann, C. Biskup, Multi-Spectral Fluorescence Lifetime Imaging by TCSPC. Micr. Res. Tech.
70, 403-409 (2007) 4. Becker & Hickl GmbH, Modular FLIM Systems for Zeiss LSM 510 Laser Scanning Microscopes. Available from
www.becker-hickl.com 5. Becker & Hickl GmbH, Leica MP-FLIM and D-FLIM Fluorescence Lifetime Microscopy Systems. Available from
www.becker-hickl.com

Application Note
10 dcs-appnote3.doc
6. Becker & Hickl GmbH, Modular FLIM Systems for Olympus Laser Scanning Microscope Fluo View FV1000. Available from www.becker-hickl.com
7. Becker & Hickl GmbH, PML-16C, 16 channel detector head for time-correlated single photon counting, user handbook, available on www.becker-hickl.com, (2006)
8. Becker & Hickl GmbH, DCC-100 detector control module, manual, available on www.becker-hickl.com 9. Becker & Hickl GmbH, SPCImage Data Analysis Software for Fluorescence Lifetime Imaging Microscopy,
available on www.becker-hickl.com 10. Becker & Hickl GmbH, BDL-375SMC, BDL-405SMC, BDL-440SMC, BDL-475SMC Ultraviolet and Blue
Picosecond Diode Lasers, available on www.becker-hickl.com 11. G. Cox, Optical imaging techniques in cell biology. Taylor & Francis (2007) 12. J. Pawley (ed.), Handbook of biological confocal microscopy, 2nd edn. Plenum Press, New York (1995)


![FLIM Systems for Zeiss LSM-710 / 780 / 880 · [1] FLIM Systems for Zeiss LSM 710 / 780 / 880 family laser scanning microscopes, user handbook. 7th edition (2017), [2] FLIM systems](https://static.fdocuments.in/doc/165x107/611b3f26ede66b1f2323f888/flim-systems-for-zeiss-lsm-710-780-880-1-flim-systems-for-zeiss-lsm-710-.jpg)


