The DCAQ Journey in NHS Lothian Paul Arbuckle - QI Hub 1 - the dcaq journey.pdf · Quality and...
33
Quality and Efficiency Support Team (QuEST) Directorate for Health Workforce and Performance The DCAQ Journey in NHS Lothian Paul Arbuckle
Transcript of The DCAQ Journey in NHS Lothian Paul Arbuckle - QI Hub 1 - the dcaq journey.pdf · Quality and...

Quality and Efficiency Support Team (QuEST) Directorate for Health Workforce and Performance
The DCAQ Journey in NHS Lothian
Paul Arbuckle

I am going to cover
• A quick reminder of the question, a proposed method for answering
• The context, journey and experience of the early implementer
• What we learnt and what we achieved
• Everything in the phase 1 and phase 2 reports

I am going to cover
The killer question and a proposed method for answering

The killer question
Is it possible to reduce waiting times for our services
sustainably to within 18 weeks, within existing resources and without impacting negatively on quality of care?

Demand, Capacity, Activity & Queue
Demand is the amount of time needed to respond to all requests for a service Capacity is the amount of time potentially available to respond to those requests Activity is the amount of time actually spent responding to those requests Queue is the requests that went unmet
Influence the first three in order to reduce the fourth

For this journey, you will need…
• Clinical and managerial leadership
• Knowledge of DCAQ and systems theory, and how to apply to Mental Health systems, so…
• … Service knowledge
• Practical and analytical skills in understanding and using data
• Project governance
• Time

DCAQ in East and Midlothian Psychological Therapies Services
The context, journey and experience of the QuEST and NHS Lothian early
implementer

Early Implementer – did we have everything we needed?
Strengths • Leadership • Improvement expertise • Some strong processes • Service knowledge • Time and some money • Project governance • Enthusiasm
Weaknesses • Data • Analytical support
Opportunities • Data • Learning • Longstanding issues • Waiting times
Threats • The unknown • Engagement • Other priorities • Time!

We had to agree our destination: Option One

Or option 2?
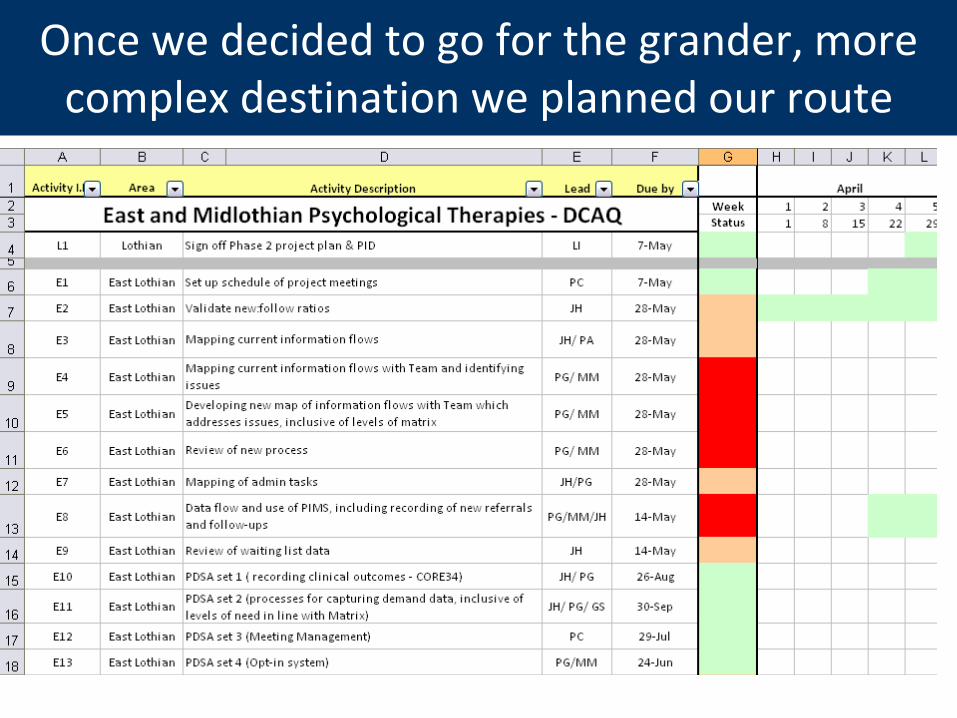
Once we decided to go for the grander, more complex destination we planned our route

We had to visit the routine processes used for capturing all of this lot
Number of referrals in
period
Number inappropriate
Percentage DNA
(& CNA, CBS) New, Follow-up
Number who don’t opt in
Length of appointment,
New, Follow-up
Average Number of
appointments
Percentage Individual/
Group
Who do they NEED to see?
Number of staff
Number of each type
Experience and skill set
Other capacity resources e.g. rooms
Travel Training Meetings Admin
Sick Leave Annual Leave &
Special Leave Other projects Data collection
The way we work: processes, waste

Our first stop
PIMS
Motel
We weren’t the only guests

So how did we keep the nightmares at bay?
• Excellent staff
• Open minds and pragmatic
• Understanding our own fears and frustrations, and asking for help coping with them
• Being clear about what we wanted, why we were
there and being organised – back to the route map!

But even so, it wasn’t a pleasant stay
• There were no analytical staff – a key feedback mechanism as well as a key part of our destination
• There was scarcity of administrative support
• And all the time we were in there, we weren’t getting any nearer to our goal
• In fact, it was such a challenging stay, that…

Maybe we should just go back to option one?
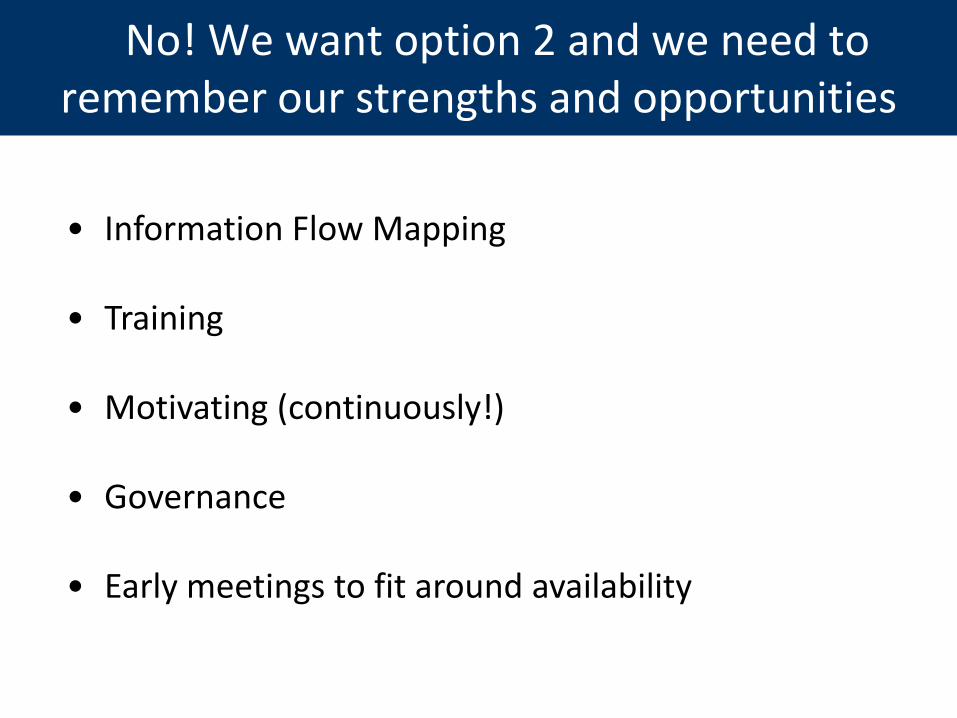
No! We want option 2 and we need to remember our strengths and opportunities
• Information Flow Mapping
• Training
• Motivating (continuously!)
• Governance
• Early meetings to fit around availability

We got just about everything we needed from PIMS
EAST
10
780
7.5
153
14.0
17.7
15.9
15.2followup DNA %
Opt Out #
1st app Cancelled%
1st app DNA %
followup Cancelled%
Summary Table for:
Number of months
Referrals
Followups for each new
For DCAQ East Lothian Psychological Therapies
Nov11 - Aug 12: Referrals
5262
8376
69
98 102
73 72
93
0
20
40
60
80
100
120
Nov Dec Jan Feb Mar Apr May Jun Jul Aug
Month
Refe
rrals
Referrals
Median number ofReferrals
Trend data for service management

NHS Somewhere
Psychological Therapies
Waiting Time: Referral to Treatment
December 1st 2011
0
20
40
60
80
100
120
140
1 4 7 10 13 16 19 22 25 28 31 34 37 40 43 46 49 52 55 58 61 64 67 70 73 76 79 82 85 88 91 94 97 100 103
Patient
Weeks o
n t
he l
ist
Weeks on List
Target
And reportable waiting times data
Longest Wait: 127 weeks
Number waiting: 104
Number waiting longer than 18 weeks: 45
Each one of these bars has a name

We used Activity Audits for other pieces of the puzzle
Percentage of Total Hours per week by Activity - All Staff Groups
0% 5% 10% 15% 20% 25%
Assessment
Case review (with patient)
Group Therapy
Other (specify)
Individual Follow up
Clinical Administration (notes, letters, data inputting, therapy prep)
Clinical meeting / discussion
Other (specify)
Supervision - giving
Supervision - receiving
Telephone - (eg other agency, patient for non-therapeutic reasons)
Dealing with emails (other than ones that are clinical admin)
Management
Meetings (non-clinical)
Other (specify)
Research
Training/ CPD (Delivering)
Training/ CPD (Receiving)
Travel
Admin tasks (eg room booking)
Direct C
linic
al
Indirect C
linic
al
Non-C
linic
al A
ctivitie
s

I am going to cover What we learnt and what we achieved
Did we get there and was it worth it?

The teams got an initial DCAQ Analysis
Hours per Week % of hours per w eek
Average WTE hours per staff member 37.5 100%
Seek to increase this Time left for Direct Client Contact 10.1 27%
Time left for Clinical Admin (applying ratio from data input) 10.1 27%
Sickness Absence 0.9 2%
Time spent travelling 2.3 6%
Training 0.6 2%
Meetings (eg allocation, team business meetings etc) 1.8 5%
Supervision (average hours per person, per week) 1.5 4%
Other eg projects (per person per week) 4.0 11%
These are fixed Annual & Special Leave 6.3 17%
Hours per week Hours per week
Your average weekly demand: Incl Clin Admin Excl Clin Admin
Your average weekly demand for first assessments: 28 14
Your average weekly demand for follow ups: 149 75
Your average weekly demand for group work: 35 18
Your average weekly demand for all client work (hours) 213 106
Your average weekly demand for all client work as WTE 5.7 2.8
Based on the data
entered, this table tells
you how much time is
needed on average to
respond to your referrals.
ACTUAL
Seek opportunities to
move time from here into
category above
TIME BY CATEGORY
DEMANDACTUAL

Initial DCAQ Analysis

Waiting Times are now accurate and actively being managed at service user level

Some general learning
• DCAQ works well as a problem solving framework in context; take the time to understand the issues
• Tackle frustrations
• DCAQ work requires collaboration
• Be mindful of interfaces with other initiatives
• Good project governance really helps
• We now have a range of tools available

Specific learning: Productive Opportunities
• 1/3rd of all available time spent on clinical and non-clinical admin
• Cancellations (by pt) as big a problem as Did Not Attend
• Non-attendance at follow-up is the place to focus
• Be wary of benchmarking new to return ratios at practitioner level

Specific learning: Data for Continuous Quality Improvement
• Ensure capacity to produce reports is in place prior to asking teams to collect data
• Automate as much as possible…
• …but analytical time still needed to support improvement work and look at specific issues

Specific learning: Effective Management of Service
• May need to run cross-locality groups
• Maternity leave may need to be covered
• May need a system for allocating follow-up work separately to assessments

Remember the killer question…
Is it possible to reduce waiting times for our services sustainably to within 18 weeks, within existing resources
and without impacting negatively on quality of care?
Undecided! So was it worth it?

Well, we now know that…
• This target may require a balance of redesign work and additional investment, but you will need to do the former to make the case for the latter
• There are significant opportunities to make better use of resources
• The early implementer has shed more light on what this work entails, how to do it and some key areas to focus on
• The two services are in a strong position now
• The learning from this project played a big part in securing the QuEST funding that has been made available to you in 2012-13 and 2013-14

Thank you for listening.
Read more here ->
QuEST Quality and Efficiency Support Team

Table Discussion
1. How does what you’ve heard resonate with your work around improving access to psychological therapies?
2. What barriers have you faced, or think you might face, in quantifying demand and capacity for your services, and how did you or might you overcome them?
3. Are any of the lessons learnt a potential issue for you, and what do you need to do next to address them/ manage the risk they pose?