The data assimilation system implementation and output for validation Gianpaolo BALSAMO, François...
17
The data assimilation system implementation and output for validation Gianpaolo BALSAMO, François BOUYSSEL, Jöel NOILHAN Gianpaolo BALSAMO, François BOUYSSEL, Jöel NOILHAN ELDAS ELDAS Data Coordination meetin Data Coordination meeting – Météo-France – Météo-France Toulouse Toulouse 17-18 17-18 September 2003 September 2003
-
Upload
alan-barker -
Category
Documents
-
view
217 -
download
0
Transcript of The data assimilation system implementation and output for validation Gianpaolo BALSAMO, François...

The data assimilation system implementation and output for validation
Gianpaolo BALSAMO, François BOUYSSEL, Jöel NOILHANGianpaolo BALSAMO, François BOUYSSEL, Jöel NOILHAN
ELDAS ELDAS Data Coordination meetinData Coordination meeting – Météo-France– Météo-France ToulouseToulouse 17-18 September 200317-18 September 2003

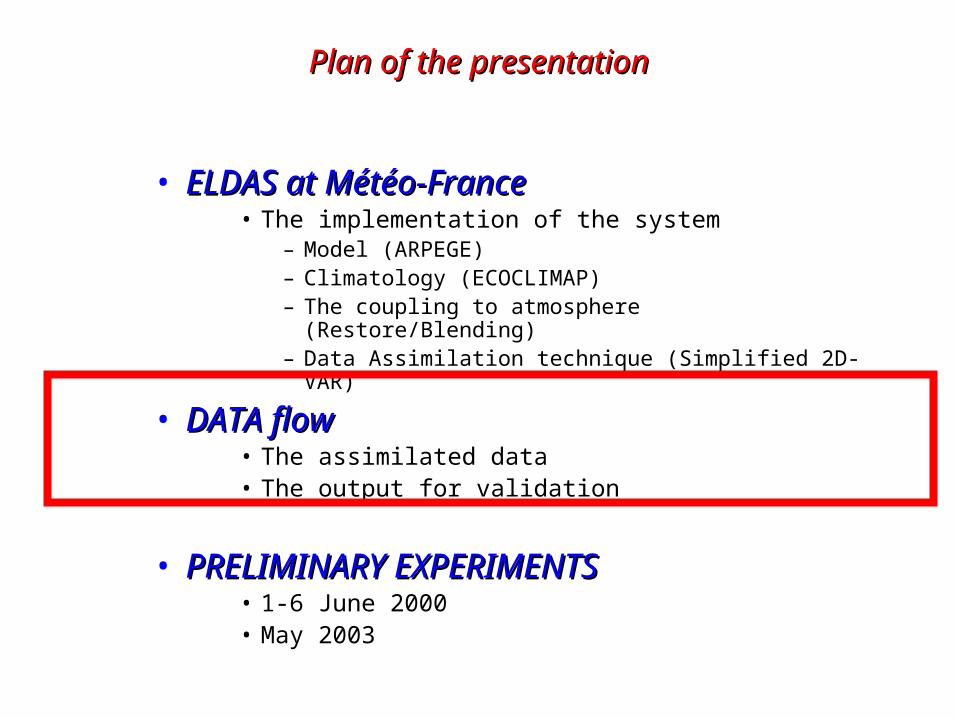
Plan of the presentationPlan of the presentation
• ELDAS at Météo-FranceELDAS at Météo-France• The implementation of the system
– Model (ARPEGE)– Climatology (ECOCLIMAP)– The coupling to atmosphere (Restore/Blending)– Data Assimilation technique (Simplified 2D-VAR)
• DATA flowDATA flow• The assimilated data• The output for validation
• PRELIMINARY EXPERIMENTSPRELIMINARY EXPERIMENTS• 1-6 June 2000• May 2003

ARPEGE: Global spectral stretched model20 to 200 km, 41 levels (1 hPa) , 4 runs/day (96h)4D-Var (T107, T161) : 6h assimilation cycle
The NWP modelThe NWP model
Cycle 26
(Current)
Operational
version:
(stretching 3.5 )

Spatial CoverageSpatial Coverage

The implementation of ECOCLIMAPThe implementation of ECOCLIMAP
• Global 1km database (V. Masson et al., 2003)
• Issued combining existing land-cover maps, climate maps, in addition to using the AVHRR satellite data
A 10km aggregation is used for ARPEGE input climatology
LAI for January and June from ECOCLIMAP
See: http://www.cnrm.meteo.fr/gmme/PROJETS/ECOCLIMAP/page_ecoclimap.htm
LAI for January and June from ECOCLIMAP
See: http://www.cnrm.meteo.fr/gmme/PROJETS/ECOCLIMAP/page_ecoclimap.htm

+6hfcst +6hfcst +6hfcst+6hfcstNew T2m, Rh2m, Ts, Tp, Ws
New Wp
The atmospheric couplingThe atmospheric coupling
• The atmospheric state is not re-analysed– 2 solutions:Restore or Blending
The land surface analysisThe land surface analysis

The atmospheric couplingThe atmospheric coupling
Restore Restore BlendingBlending
« + »« + »+6hfcst
Archive Atmospheric
Analyse
Atmospheric
guess
New Land Surface Analysis
New Land SurfaceAnalysis
Atmosphericguess
Archive Atmospheric
Analyse
New Land SurfaceAnalysis
Plan of the presentationPlan of the presentation
• ELDAS at Météo-FranceELDAS at Météo-France• The implementation of the system
– Model (ARPEGE)– Climatology (ECOCLIMAP)– The coupling to atmosphere (Restore/Blending)– Data Assimilation technique (Simplified 2D-VAR)
• DATA flowDATA flow• The assimilated data• The output for validation
• PRELIMINARY EXPERIMENTSPRELIMINARY EXPERIMENTS• 1-6 June 2000• May 2003

The assimilated dataThe assimilated data
• T2m RH2m (analysed by the Optimum Interpolation on ARPEGE grid)
• Observations are available every 6 hours.
• No other observations are assimilated (at present).

Field site temporal dataField site temporal data
• Extracted from Arpege 6h forecast cycle (1 hour rate)
• Nearest model grid point
• No post-processing (at present) to compensate field site / model differences.
Spatial dataSpatial data
• Extracted from Arpege grid:
• LAT, LON, VALUE
• No extrapolation to ELDAS regular lat lon grid (at present)
• No grib produced (at present)

Site Name Latitude Longitude Elevation (m) Latitude Longitude Elevation (m)Collelongo 41,867 13,633 1550 10,55 41,842 13,753 1541Castelporziano 41,750 12,367 3 8,80 41,762 12,475 68Sarrebourg_Hesse 48,667 7,833 300 9,59 48,626 7,718 126Bordeaux 44,083 0,083 60 9,33 44,022 0,000 158Soroe_Lille_Boegesko 55,483 11,650 40 8,80 55,557 11,703 57Flakaliden 64,117 19,450 225 5,82 64,137 19,558 293Norunda 60,083 17,467 45 9,84 60,157 17,561 51Tharandt 50,967 13,567 380 3,11 50,981 13,544 395Loobos 52,167 5,733 25 6,60 52,136 5,645 36Vielsalm 50,300 6,000 450 5,82 50,306 5,920 557Brasschaat 51,300 4,517 16 8,23 51,276 4,403 13Hyytiala 61,850 24,283 170 6,60 61,812 24,380 156El_Saler 39,333 -0,317 3 6,60 39,361 -0,384 43Lleida 41,550 0,867 -9999 7,30 41,500 0,808 447Tomelloso 39,117 -2,917 -9999 7,62 39,183 -2,947 751Badajoz 38,933 -6,617 -9999 7,30 38,876 -6,649 230Tylstrup 57,183 9,967 14 7,30 57,245 9,929 36Jyndevad 54,900 9,117 15 6,22 54,957 9,093 35Silstrup 56,933 8,650 37 2,20 56,925 8,672 17Estrup 55,483 9,067 56 12,05 55,429 8,906 41Faardrup 55,317 11,350 28 7,30 55,253 11,317 8Slaeggerup 55,683 12,000 21 2,20 55,668 11,998 37Nigula 58,967 23,833 -9999 6,96 58,998 23,715 24Saku 59,300 24,583 -9999 11,43 59,249 24,410 52Turi 58,767 25,433 -9999 11,64 58,713 25,602 81Jogeva 58,767 26,433 -9999 5,82 58,768 26,532 80Vinni 59,317 26,517 -9999 9,59 59,232 26,502 126Kuusiku 58,967 24,700 -9999 9,07 58,926 24,836 70Parnu 58,433 24,483 -9999 8,23 58,365 24,535 18Viljandi 58,333 25,617 -9999 7,62 58,263 25,627 94Tartu 58,333 26,650 -9999 6,60 58,309 26,542 89Polva 58,017 26,983 -9999 8,80 57,957 26,899 138Voru 57,900 26,917 -9999 6,60 57,957 26,899 138Valga 57,817 26,100 -9999 8,23 57,751 26,166 76Bari 41,050 16,833 -9999 8,23 41,045 16,934 99Flevoland 52,217 5,250 -9999 3,81 52,232 5,191 -1
SITE COORDINATES MODEL GRID-POINT COORDINATESDistance (Km)

Vegetation type SURFIND.VEG.DOMI (3=low vegetation, 4= high vegetation)
3
Leaf Area Index SURFIND.FOLIAIRE 1.225Albedo SURFALBEDO (clim) 0.153Aerodynamic roughness (m) SURFZ0.FOIS.G/9.81 (dyn.),
SURFGZ0.THERM/9.81 (therm.)
3.098/9.81 m
Displacement height (m) Not available.. //Soil type SURFPROP.ARGILE,
SURFPROP.SABLE5.83% ; 82.6%
Rooting depth (m) SURFEPAIS.SOL 1.63 mVolumetric soil wilting point (m3/m3)
37.1342*exp(0.50*log(SURFPROP.ARGILE))
89.66
Volumetric soil field capacity (m3/m3)
89.0467*exp(0.35*log(SURFPROP.ARGILE))
165.04
Vertical discretisation (m) ISBA force-restore has d1=0.01 m, d2=SURFEPAIS.SOL
0.01 m 1.63 m
Orographic model height (m) SURFGEOPOTENTIEL / 9.81 36.4 m
Field site climatology: Loobos SiteField site climatology: Loobos Site

Energetic Budget at Loobos Site
-500
-400
-300
-200
-100
0
100
200
300
400
500
600
700
800
900
01/06/2000 00:00 02/06/2000 00:00 03/06/2000 00:00 04/06/2000 00:00 05/06/2000 00:00 06/06/2000 00:00 07/06/2000 00:00
Date and Time (UTC)
Rad
iati
on
Flu
x (
W/m
2)
SURFFLU.RAY.SOLA SURFFLU.RAY.THER SURFFLU.LAT.MEVA SURFFLU.CHA.SENS SURFCHAL.DANSSOL

Hydrologic Budget at Loobos Site
-1,0
-0,5
0,0
0,5
1,0
1,5
2,0
2,5
3,0
3,5
01/06/2000 00:00 02/06/2000 00:00 03/06/2000 00:00 04/06/2000 00:00 05/06/2000 00:00 06/06/2000 00:00 07/06/2000 00:00
Date and Time (UTC)
Wate
r F
lux (
mm
)
SURFFLU.MEVAP.EA SURFPREC.EAU.CON SURFPREC.NEI.CON
SURFPREC.EAU.GEC SURFPREC.NEI.GEC SURFRUISSELLEMEN
PROFRUISSELLEMEN

Plan of the presentationPlan of the presentation
• ELDAS at Météo-FranceELDAS at Météo-France• The implementation of the system
– Model (ARPEGE)– Climatology (ECOCLIMAP)– The coupling to atmosphere (Restore/Blending)– Data Assimilation technique (Simplified 2D-VAR)
• DATA flowDATA flow• The assimilated data• The output for validation
• PRELIMINARY EXPERIMENTSPRELIMINARY EXPERIMENTS• 1-6 June 2000• May 2003

•PRELIMINARY EXPERIMENTSPRELIMINARY EXPERIMENTS
•1-6 June 2000 and zoom over ELDAS domain
•May 2003: Ecoclimap and Operational cycles

Schedule of activitiesSchedule of activities
Implementation partImplementation part• The implementation of the system [done]• Validation of Atm. Coupling method [in progress]• Optimization of cycle settings [in progress]
Output data productionOutput data production• Trial dataset 1-6 June 2000 [done]• May-June 2000 [to be done: ready to start]• May-October 2000 [by end of 2003]