The Dartmouth Atlas ofHealth Care
246
The Dartmouth Atlas of Health Care The Center for the Evaluative Clinical Sciences Dartmouth Medical School AHA books are published by American Hospital Publishing, Inc., an American Hospital Association company
Transcript of The Dartmouth Atlas ofHealth Care

TheDartmouthAtlasofHealth Care
The Center for theEvaluative Clinical Sciences
Dartmouth Medical School
AHA books are published by American Hospital Publishing, Inc., an American Hospital Association company

The Dartmouth Atlas of Health Care
© 1996 The Trustees of Dartmouth College
ISBN 1-55648-155-1

The Dartmouth Atlas of Health Care in the United States
John E. Wennberg, M.D., M.P.H., Principal Investigator and Series Editor
Megan McAndrew Cooper, M.B.A., M.S., Editor
and other members of the Dartmouth Atlas of Health Care Working Group
Co-investigators and Researchers
Thomas A. Bubolz, Ph.D.
Elliott S. Fisher, M.D., M.P.H.
Alan M. Gittelsohn, Ph.D.
David C. Goodman, M.D., M.S.
Jack E. Mohr
James F. Poage, Ph.D.
Sandra M. Sharp, S.M.
Jonathan Skinner, Ph.D.
Thérèse A. Stukel, Ph.D.
Administration, Data Production, and Technical Support
Nancy E. Cloud
Jiaqi Gong, M.S.
Kristen K. Patterson


The research to create the Dartmouth Atlas of Health Carewas made possible by a grant from
The Robert Wood Johnson Foundation

The Center for the Evaluative Clinical Sciences
Dartmouth Medical School
Hanover, New Hampshire 03756
(603) 650-1820
http://www.dartmouth.edu/~atlas/
Published in cooperation with The Center for Health Care Leadership
of the American Hospital Association
American Hospital Publishing, Inc.
Chicago, Illinois
vii
Table of Contents
Map List: x
Figure List: xii
Introduction: 1
Part One: The Geography of Health Care in the United States 11How Hospital Service Areas Were Defined 12
Hospital Service Areas in the United States 15
Population Size in Hospital Service Areas 17
How Hospital Referral Regions Were Defined 19
The Hospital Referral Regions in the United States 22
Maps of Hospital Referral Regions in the United States 24
Part Two: Acute Care Hospital Resources and Expenditures 37Acute Care Hospital Beds 38
Acute Care Hospital Employees 40
Registered Nurses Employed in Acute Care Hospitals 42
Total Acute Care Hospital Expenditures 45
Part Three: Hospital Capacity, Utilization, and Outcomes 47Hospital Capacity and Per Capita Expenditures for Hospital Care 49
Hospital Capacity and Medicare Hospitalizations for Hip Fractures 51
Hospital Capacity and Medicare Hospitalizations for Surgical Care 52
Hospital Capacity and Medicare Hospitalizations for High VariationMedical Conditions 53
Hospital Capacity and the Place Where Death Occurs 54
Is More Better? 55

viii
Hospital Capacity, Income Levels, and Medicare Hospitalizations for HighVariation Medical Conditions 56
Part Four: The Medicare Program 59Medicare Reimbursements for Traditional (Noncapitated) Medicare 62
Medicare Reimbursements for Professional and Laboratory Services 64
Medicare Reimbursements for Inpatient Hospital Services 66
Medicare Reimbursements for Outpatient Facilities 68
Medicare Reimbursements for Home Health Care Services 70
Are There Tradeoffs Between Sectors of Care? 72
Medicare Enrollment in Capitated Managed Care Plans 76
The Federal Contribution for Medicare Enrollment in Risk Bearing HealthMaintenance Organizations 78
Part Five: The Physician Workforce 81The Physician Workforce Active in Patient Care 82
Physicians in Primary Care 84
Specialist Physicians 86
The 50/50 Rule 88
The Association Between the Primary Care and Specialist PhysicianWorkforces and Medicare Reimbursements for Physicians’ Services 91
Anesthesiologists 92
Cardiologists 94
General Surgeons 96
Obstetrician/Gynecologists 98
Ophthalmologists 100
Orthopedic Surgeons 102
Psychiatrists 104
Radiologists 106
Urologists 108
Physicians in Residency Training Programs 110
Part Six: The Diagnosis and Surgical Treatment ofCommon Medical Conditions 113The Problem of Scientific Uncertainty 114
Which Surgical Rate Is Right? 115
Underservice 116
The Diagnosis and Treatment of Coronary Artery Disease 117
Coronary Artery Bypass Grafting 118
THE DARTMOUTH ATLAS OF HEALTH CARE

ix
Percutaneous Transluminal Coronary Angioplasty 120
Coronary Angiography 122
The Diagnosis and Treatment of Breast Cancer 125
Mammography 126
Breast Sparing Surgery 128
The Treatment of Back Pain Due to Disc Disease 131
Back Surgery 132
The Diagnosis and Treatment of Early Stage Prostate Cancer 135
Prostate Biopsy 136
Radical Prostatectomy 138
The Diagnosis and Treatment of Benign Prostatic Hyperplasia 141
Transurethral Resection of the Prostate for Benign Prostatic Hyperplasia
Part Seven: Benchmarking 145Benchmarking the United States Supply of Physicians to a Large HealthMaintenance Organization 148
Benchmarking the United States Supply of Physicians to the MinneapolisHospital Referral Region 149
Benchmarking Medicare Reimbursements and the Supply of HospitalResources in the United States to the Minneapolis Hospital ReferralRegion 152
Benchmarking the Chicago, Los Angeles, New Orleans, Miami, andPhiladelphia Hospital Referral Regions to the Minneapolis HospitalReferral Region 153
Benchmarking the Rates of Surgery 156
Part Eight: Tables 159Table One: Acute Care Hospital Resources Allocated to Hospital ReferralRegions 161
Table Two: Clinically Active Physician Workforce Serving Residents ofHospital Referral Regions 167
Table Three: Selected Causes of Hospitalization, Diagnostic and SurgicalProcedures, and Mortality Among Non-HMO Medicare Enrollees byHospital Referral Region 177
Table Four: Unadjusted and Price Adjusted Medicare Reimbursements byProgram Components and Hospital Referral Region 187
Part Nine: Strategies and Methods 197Map List 225
Figure List 227
TABLE OF CONTENTS

x THE DARTMOUTH ATLAS OF HEALTH CARE
Maps
NUMBER
1.1
1.2
1.3
1.4
1.5
1.6
1.7
1.8
1.9
1.10
1.11
1.12
1.13
1.14
1.15
1.16
2.1
2.2
2.3
2.4
4.1
4.2
MAP TITLE
ZIP Codes Assigned to the Windsor, Vermont Hospital Service Area
Hospital Service Areas According to the Number of Acute CareHospitals
Hospital Service Areas According to Population Size
Hospital Service Areas Assigned to the Evansville, Indiana HospitalReferral Region
Hospital Referral Regions According to the Number of HospitalsPerforming Major Cardiovascular Surgery
New England Hospital Referral Regions
Northeast Hospital Referral Regions
South Atlantic Hospital Referral Regions
Southeast Hospital Referral Regions
South Central Hospital Referral Regions
Southwest Hospital Referral Regions
Great Lakes Hospital Referral Regions
Upper Midwest Hospital Referral Regions
Rocky Mountain Hospital Referral Regions
Pacific Northwest Hospital Referral Regions
Pacific Coast Hospital Referral Regions
Acute Care Hospital Beds
Acute Care Hospital Employees
Registered Nurses Employed in Acute Care Hospitals
Total Acute Care Hospital Expenditures
Price Adjusted Medicare Reimbursements for Traditional(Noncapitated) Medicare
Price Adjusted Medicare Reimbursements for Professional andLaboratory Services
PAGE
14
16
18
21
23
25
26
27
28
29
30
31
32
33
34
35
39
41
43
45
63
65

xi
4.3
4.4
4.5
4.6
4.7
5.1
5.2
5.3
5.a
5.4
5.5
5.6
5.7
5.8
5.9
5.10
5.11
5.12
5.13
6.1
6.2
6.3
6.4
6.5
6.6
6.7
6.8
6.9
Price Adjusted Medicare Reimbursements for Inpatient HospitalServices
Price Adjusted Medicare Reimbursements for Outpatient Facilities
Price Adjusted Medicare Reimbursements for Home Health CareServices
Medicare Enrollment in Capitated Managed Care Plans
Variations in Medicare Reimbursements
The Physician Workforce Active in Patient Care
Physicians in Primary Care
Specialist Physicians
The 50/50 Rule
Anesthesiologists
Cardiologists
General Surgeons
Obstetrician/Gynecologists
Ophthalmologists
Orthopedic Surgeons
Psychiatrists
Radiologists
Urologists
Physicians in Residency Training Programs
Coronary Artery Bypass Grafting
Percutaneous Transluminal Coronary Angioplasty
Coronary Angiography
Mammography
Breast Sparing Surgery
Back Surgery
Prostate Biopsy
Radical Prostatectomy
Transurethral Resection of the Prostate
67
69
71
77
79
83
85
87
89
93
95
97
99
101
103
105
107
109
111
119
121
123
127
129
133
137
139
143
MAPS

xii
Figures
FIGURE TITLE
Cumulative Percentage of Population of the United States According to theHospital Service Area Localization Index (1992-93)
Cumulative Percentage of Population of the United States According to thePopulation Size of Hospital Service Areas (1990 Census)
Cumulative Percentage of Population of the United States According to theHospital Referral Region Localization Index (1992-93)
Acute Care Hospital Beds Allocated to Hospital Referral Regions (1993)
Hospital Employees Allocated to Hospital Referral Regions (1993)
Hospital-Based Registered Nurses Allocated to Hospital Referral Regions(1993)
Price Adjusted Acute Care Hospital Expenditures Allocated to HospitalReferral Regions (1993)
The Association Between Allocated Hospital Beds and Price AdjustedHospital Expenditures (1993)
The Association Between Allocated Hospital Employees and Price AdjustedMedicare Reimbursements for Inpatient Hospital Services (1993)
The Association Between Allocated Hospital Beds and MedicareHospitalizations for Hip Fractures (1992-93)
The Association Between Allocated Hospital Beds and MedicareHospitalizations for Surgical Care (1992-93)
The Association Between Allocated Hospital Beds and MedicareHospitalizations for High Variation Medical Conditions (1992-93)
The Association Between Allocated Hospital Beds and the Percentage ofMedicare Deaths That Occurred in Hospitals (1992-93)
Summary of Effect of Hospital Capacity on Utilization (1992-93)
The Association Between Allocated Hospital Beds and Population BasedMedicare Mortality
The Association Between Hospital Capacity and Medicare HospitalizationRates for High Variation Medical Conditions Among Populations Stratifiedby Median Income in Zip Code of Residence
NUMBER
1.1
1.2
1.3
2.1
2.2
2.3
2.4
3.1
3.2
3.3
3.4
3.5
3.6
3.7
3.8
3.9
PAGE
15
17
22
38
40
42
44
49
50
51
52
53
54
55
56
57
THE DARTMOUTH ATLAS OF HEALTH CARE

xiii
4.1
4.2
4.3
4.4
4.5
4.6
4.7
4.8
5.1
5.2
5.3
5.a
5.b
5.4
5.5
5.6
5.7
5.8
5.9
5.10
5.11
5.12
5.13
Price Adjusted Reimbursements for Traditional (Noncapitated) MedicareAmong Hospital Referral Regions (1993)
Price Adjusted Part B Medicare Reimbursements for Professional andLaboratory Services Among Hospital Referral Regions (1993)
Price Adjusted Reimbursements for Inpatient Hospital Services AmongHospital Referral Regions (1993)
Price Adjusted Medicare Reimbursements for Outpatient Services AmongHospital Referral Regions (1993)
Price Adjusted Medicare Reimbursements for Home Health Care ServicesAmong Hospital Referral Regions (1993)
The Association Between Price Adjusted Medicare Reimbursements forOutpatient and Inpatient Hospital Services (1993)
The Association Between Price Adjusted Medicare Reimbursements forProfessional and Laboratory Services and for Inpatient Hospital Services(1993)
The Association Between Price Adjusted Medicare Part B ReimbursementsProvided Outside and Inside the Hospital (1993)
Physicians Allocated to Hospital Referral Regions (1993)
Primary Care Physicians Allocated to Hospital Referral Regions (1993)
Specialists Allocated to Hospital Referral Regions (1993)
The Association Between the Specialty Physician Workforce and PriceAdjusted Medicare Medical and Surgical Reimbursements (1993)
The Association Between the Primary Care Physician Workforce and PriceAdjusted Medicare Medical and Surgical Reimbursements (1993)
Anesthesiologists Allocated to Hospital Referral Regions (1993)
Cardiologists Allocated to Hospital Referral Regions (1993)
General Surgeons Allocated to Hospital Referral Regions (1993)
Obstetrician/Gynecologists Allocated to Hospital Referral Regions (1993)
Ophthalmologists Allocated to Hospital Referral Regions (1993)
Orthopedic Surgeons Allocated to Hospital Referral Regions (1993)
Psychiatrists Allocated to Hospital Referral Regions (1993)
Radiologists Allocated to Hospital Referral Regions (1993)
Urologists Allocated to Hospital Referral Regions (1993)
Physicians in Residency Training Programs Allocated to Hospital ReferralRegions (1993)
FIGURES
62
64
66
68
70
72
74
75
82
84
86
91
91
92
94
96
98
100
102
104
106
108
110

xiv
CABG Among Hospital Referral Regions (1992-93)
PTCA Among Hospital Referral Regions (1992-93)
The Association Between the Incidence of Angiography and the Rates ofCABG and PTCA (1992-93)
Mammography for Medicare Eligible Women Among Hospital ReferralRegions (1993)
Use of Inpatient Breast Sparing Surgery for Medicare Eligible WomenAmong Hospital Referral Regions (1992-93)
Back Surgery Among Hospital Referral Regions (1992-93)
Prostate Biopsy Among Hospital Referral Regions (1993)
Radical Prostatectomy Among Hospital Referral Regions (1992-93)
TURP for BPH Among Hospital Referral Regions (1992-93)
Ratios of the Rates of Supply of Physicians in the United States to Rates in aLarge Health Maintenance Organization (1993)
Ratios of the Rates of Supply of Physicians in the United States to Rates inthe Minneapolis Hospital Referral Region (1993)
Ratios of the Rates of Supply of Physicians in Minneapolis to Rates in aLarge Health Maintenance Organization (1993)
Ratios of the Rates for Medicare Reimbursements and for Hospital ResourceAllocations in the United States to the Rates in the Minneapolis HospitalReferral Region (1993)
Ratios of the Rates of Physicians in Selected HRRs to Rates in theMinneapolis Hospital Referral Region (1993)
Ratios of the Rates for Hospital Resources and Medicare Reimbursement inSelected HRRs to Rates in the Minneapolis Hospital Referral Region (1993)
6.1
6.2
6.3
6.4
6.5
6.6
6.7
6.8
6.9
7.1
7.2
7.3
7.4
7.5
7.6
THE DARTMOUTH ATLAS OF HEALTH CARE
118
120
122
126
128
132
136
138
142
149
150
151
153
154
155

Introduction

2 THE DARTMOUTH ATLAS OF HEALTH CARE
Health services researchers have long been aware of large variations in the use of
medical care among communities and regions. In the 1930s, the British pediatrician
J. Allison Glover observed that the rates of surgical removal of the tonsils in British
schoolchildren varied widely, depending on the district in which the students lived
and the school health doctors who examined them. In some school districts, more
than 50% of children had tonsillectomies, while in others, less than 10% did. In the
1970s, studies of variation among local hospital market areas in Vermont and Maine
revealed wide variations in the per capita numbers of hospital beds, employees, and
physicians and noted the associations between supply of resources and use of care:
more beds meant greater rates of hospitalization, and more surgeons meant more
surgery. In the 1980s, a series of studies of Boston and New Haven, Connecticut
(see box), extended insights into the variation phenomenon, demonstrating once
again that in health care markets, geography is destiny: the care one receives depends
in large part on the supply of resources available in the place where one lives – and
on the practice patterns of local physicians.
The existence of variation raises a number of important issues. Foremost is the ques-
tion “Which rate is right?” Which pattern of resource allocation, and which pattern
of utilization, is “correct?” The study of practice variations reveals how complex this
question really is. In the case of variations in rates of individual procedures, such as
tonsillectomy and hysterectomy, the explanation is not that patients in areas with
low procedure rates are going without treatment; they are, instead, being treated dif-
ferently, often with more conservative medical management. Learning which rate is
right requires learning what informed patients want. The right rate must be the one
that reflects the choices of patients who have been adequately informed and empow-
ered to choose among the available options.
In the case of variations in the supply of health care resources, such as the numbers
of hospital beds and physicians, the question “Which rate is right?” needs to be
framed in another way: What is the impact on population health of variations in
resource allocation? Is more better? And if not, how much could be reallocated to
Geographic Variations in Health Care

3INTRODUCTION
The Boston, Massachusetts, and New Haven, Con-
necticut, hospital service areas have provided an
excellent small-scale laboratory for studying varia-
tions in medical resource allocation and utilization.
Both communities are similar in factors that deter-
mine the need for and access to health care, such as
age, race, and income levels. Both are served by
prestigious medical centers. Yet residents of the two
communities are treated in very different ways,
both in terms of overall health care utilization and
in terms of the kinds of treatment they receive for
specific conditions.
In 1989, the residents of the Boston hospital service
area used more than 4.3 hospital beds for every
thousand residents, compared with fewer than 2.3
beds for every thousand residents of the New Ha-
ven hospital service area. Bostonians were much
more likely to be hospitalized for virtually all acute
and chronic medical conditions. Most of the extra
beds in Boston were used for the hospitalization of
patients with such common conditions as pneumo-
nia, heart failure, and gastroenteritis; patients with
these problems who lived in the New Haven hospi-
tal service area were more likely to be treated
outside of the hospital.
The reasons for the differences in the number of
beds per resident included greater competition be-
tween hospitals (there were 11 acute care hospitals
in Boston and only two in New Haven), the needs
of academic medical centers (there were three medi-
cal schools in Boston and one in New Haven), and
the needs of religious communities for their own
hospitals (there were four hospitals affiliated with
religious groups in Boston and one in New Haven).
Whatever the causes, the variations in the availabil-
ity and use of hospital care resulted in substantial
differences in health care spending. In 1989, the per
capita expenditure for acute hospital care was
$1,524 for Bostonians; for residents of New Haven,
it was $777. Had the per capita rates of hospitaliza-
tion and reimbursements in Boston and
neighboring Brookline been the same as those in
New Haven, Boston would have needed 1,529
fewer hospital beds, and expenditures for hospital
care for Bostonians alone would have been reduced
by half a billion dollars in 1989.
Patterns of surgical care, however, were much more
idiosyncratic. Rates of some procedures were higher
in Boston; rates of other kinds of surgery were
higher in New Haven. In the 1980s, the rates for
coronary artery bypass grafting surgery and for hys-
terectomy, per thousand Medicare enrollees, were
much higher for residents of the New Haven hospi-
tal service area; Bostonians, on the other hand, were
much more likely to undergo hip and knee replace-
ment surgery. This does not mean that patients in
areas with low surgical rates were necessarily
underserved; they were simply cared for differently.
Boston residents with coronary artery disease were
more likely to be treated with medications or
angioplasty than residents of New Haven.
A Case Study of Variation: Boston and New Haven

4 THE DARTMOUTH ATLAS OF HEALTH CARE
other, more effective uses by reducing resources and their utilization to the level of
more conservative communities?
Another important issue raised by geographic variation concerns fairness. Variation
studies provide good evidence that populations in low cost regions are not sicker or
in greater medical need than those in high cost regions. Costs are higher, not be-
cause better health is being achieved, but because the local health care systems have
greater capacity, or because the price of medical care in these communities is higher.
A system that rewards high cost areas by continuing to pay their higher costs is by
definition economically punishing areas that have fewer resources, use them more
efficiently, and are reimbursed less. Is it fair for citizens living in regions with low
per capita health care costs to subsidize the greater (and more costly) use of care by
people living in high resource and high utilization regions?

5
The Geography of Health Care in the United States
The first task in preparing this Atlas was to establish the geographic boundaries of
naturally occurring health care markets in the United States. Based on a study of
where Medicare patients were hospitalized, 3,436 geographic hospital service areas
were defined. The hospital service areas were then grouped into 306 hospital referral
regions on the basis of where Medicare patients were hospitalized for major cardio-
vascular surgical procedures and neurosurgery, markers for regionalization. Part One
of the Atlas describes how this was done, and contains a series of maps that detail each
hospital referral region in the United States. One important finding was that most
hospital service areas and hospital referral regions, as defined by where patients actually
receive their care, correspond poorly to political configurations, such as counties,
which have traditionally been used to measure health care resources and utilization.
Acute Care Hospital Resources and Expenditures
Part Two focuses on the acute care hospital capacity in each hospital referral region.
After adjusting for differences in the age, sex, and race of resident populations, there
were greater than twofold differences in the numbers of hospital beds per thousand
residents of hospital referral regions in the United States. For example, in 1993,
Honolulu had 2.2 beds per thousand residents and Seattle had 2.4. But Chicago
had 4.6 beds per thousand residents and New Orleans had 5.2. The differences in
hospital personnel and expenditures were of similar magnitude.
Hospital Capacity, Utilization, and Outcomes
Part Three of the Atlas provides a framework for understanding the implications of
geographic variations in hospital resources, the utilization and costs of care, and the
impact of these variations for one health outcome, population mortality. Variations
in hospital utilization cannot be explained by differences in the underlying rates of
illness; rather, they reflect two distinctive aspects of our health care system: inequal-
ity in hospital capacity, and the implicit assumption in some areas that more
aggressive intervention – diagnosis, hospitalization, and treatment – is better.
INTRODUCTION

6 THE DARTMOUTH ATLAS OF HEALTH CARE
The Medicare Program
Part Four of the Atlas reports on federal spending for the Medicare program in each
of the 306 hospital referral regions during 1993. There were important differences
between regions. Total Medicare reimbursements in the Minneapolis region were
about $2,800 per enrollee; in the Miami region, they were $6,400, more than twice
as high. Reimbursements for inpatient care, outpatient care, physicians’ services, and
home health care also exhibited substantial variations; for example, home health
care reimbursements in Rochester, Minnesota, were $46 per enrollee; in Chatta-
nooga, Tennessee, they were $1,177, about 25 times higher.
The differences in Medicare’s per enrollee reimbursements raise important issues con-
cerning geographic equity and have important implications for the Medicare program.
The Physician Workforce
Since the early 1960s, the numbers of medical schools and residency training posi-
tions in the United States have increased dramatically, and the physician supply has
increased correspondingly – from about 200,000 physicians in active practice in
1970 to over 450,000 in 1993, an 80% per capita increase. Part Five provides de-
tailed information about the geographic distribution of the physician workforce in
1993. The supply of physicians varied by a factor of three, from fewer than 100
physicians per hundred thousand residents of some hospital referral regions to more
than 300 in others. The variation was greater among the individual specialties, and
greatest among psychiatrists, where the supply varied from a low of 2.5 per hundred
thousand residents to a high of 43.9.
The Diagnosis and Surgical Treatment of Common Medical Conditions
Part Six of the Atlas documents wide variation in the use of diagnostic and surgi-
cal procedures for people with coronary artery disease, prostate cancer, breast cancer,
and back pain. The magnitude of the geographic variation is remarkable. There was
7
a fourfold variation in per capita rates of coronary artery bypass surgery in 1992-93
among Medicare enrollees. There was an eightfold variation in rates of radical pros-
tatectomy, an operation used to treat early stage prostate cancer. Variations in the
use of breast sparing surgery in the treatment of breast cancer were over 33-fold.
Benchmarking the Patterns of Resource Allocation and Care
The aggregate quantities of hospital resources and physicians available for the care
of residents of the United States are not determined by well-established evidence
concerning the relationship between need and clinical outcomes. If more resources
and care cannot be demonstrated to be better for a community’s health outcomes,
it may well be reasonable for patients, and in the public interest, to reduce the
health care system’s capacity to the levels of regions that have conservative levels of
resources and utilization. Part Seven provides estimates of the number of hospital
beds, personnel, and expenditures that could be reallocated to another use if the
rates in more efficient regions became the standard of practice. For example, if the
resources in all hospital referral regions in the United States that have greater sup-
plies of hospital resources than Minneapolis were brought down to the level in the
Minneapolis region, nearly 120,000 hospital beds would be closed, and $32.6 bil-
lion could be saved (or spent for a more effective purpose). Similar analysis is
provided for physician staffing levels, leading to similar conclusions; if, for example,
all hospital referral regions in the United States had per capita physician workforces
no higher than the numbers employed by a well-established health maintenance or-
ganization, the number of physicians now active in the workforce, and the numbers
being trained and brought into the workforce, would be profoundly affected.
Tables
Part Eight provides detailed information about each hospital referral region, includ-
ing most of the variables presented in the Atlas. A more extensive database is
available in machine-readable form.
INTRODUCTION

8 THE DARTMOUTH ATLAS OF HEALTH CARE
Strategies and Methods
Part Nine provides details of the methods used in the Atlas and an explanation of
the distribution graphs and the measure of association – the R2 statistic – used in
the Atlas.

9
About Rates in the Atlas
In order to make comparisons easier, all rates in the Atlas are expressed in terms that
result in at least one digit to the left of the decimal point (e.g., 1.6 cardiologists per
hundred thousand residents, 3.9 hospital beds per thousand residents). In order to
achieve this result, different denominators were used in calculating rates.
The levels of supply of hospital beds and hospital full time equivalent employees are
expressed as beds and employees per thousand residents of the hospital referral re-
gion, based on American Hospital Association and Medicare data.
Expenditures and reimbursements are expressed as dollars per capita, or per resident
of the hospital referral region, based on Medicare claims data and census calculations.
The numbers of physicians providing services to residents of hospital referral regions
are expressed as physicians per hundred thousand residents, based on American Medi-
cal Association and American Osteopathic Association data and census calculations.
The numbers of surgical and diagnostic procedures performed are expressed as
procedures per thousand Medicare enrollees in the hospital referral region, or as
procedures per thousand male or female Medicare enrollees in the region – for
procedures like prostatectomy or mammography that apply only to one sex – based
on Medicare claims data.
Patient day rates are expressed as total inpatient days per thousand Medicare enrollees.
INTRODUCTION

10 THE DARTMOUTH ATLAS OF HEALTH CARE
Making Fair Comparisons Between Regions
Some areas of the country have greater needs for health care services and resources
than others; for example, in some communities in Florida, as many as 60% of resi-
dents are over 65, while other areas – including some with large college populations,
or ski resorts – have much larger proportions of younger people. To ensure fair com-
parisons between regions, all rates in the Atlas have been adjusted to remove the
differences that might be due to the age and sex composition of regional popula-
tions. This adjustment avoids identifying some regions as having high rates of
utilization simply because of their larger proportions of elderly residents. When data
were available, rates have also been adjusted for differences in race. The methods
used to adjust these rates are explained in Part Nine.
Some parts of the country, such as major urban areas, have higher costs of living
than others. Such areas are likely to have higher health care expenditures because the
cost of personnel, real estate, and supplies are higher, and not necessarily because
they are providing more services. Adjusting for such variation provides a better
measure of differences in real health care spending, not simply differences attribut-
able to the fact that some regions are more expensive in which to live than others.
To ensure fair comparisons of health care expenditures, hospital expenditure rates
and Medicare reimbursement rates were adjusted to take into account regional dif-
ferences in costs of living.
The methods used to adjust for age, sex, race, and price of medical care are detailed
in Part Nine of the Atlas.
Communicating With Us About the Atlas
Our Atlas Home Page on the World Wide Web contains Atlas information, includ-
ing a summary of Dartmouth related research and electronic copies of some hard to
find references. Please send us your comments on the Atlas, particularly suggestions
on how to improve it in the future. We are at http://www.dartmouth.edu/~atlas/

The Geography of Health Carein the United States
PART ONE

12 THE DARTMOUTH ATLAS OF HEALTH CARE
The Geography of Health Care in the United States
The use of health care resources in the United States is highly localized. Most
Americans use the services of physicians whose practices are nearby. Physicians, in
turn, are usually affiliated with hospitals that are near their practices. As a result,
when patients are admitted to hospitals, the admission generally takes place within
a relatively short distance of where the patient lives. This is true across the United
States. Although the distances from homes to hospitals vary with geography –
people who live in rural areas travel farther than those who live in cities – in general
most patients are admitted to a hospital close to where they live which provides an
appropriate level of care.
The Medicare program maintains exhaustive records of hospitalizations, which
makes it possible to define the patterns of use of hospital care. When Medicare en-
rollees are admitted to hospitals, the program’s records identify both the patients’
places of residence (by ZIP Code) and the hospitals where the admissions took place
(by a unique numerical identifier). These files provide a reliable basis for determin-
ing the geographic pattern of health care use, because research shows that the
migration patterns of patients in the Medicare program are similar to those for
younger patients.
Medicare records of hospitalizations were used to define 3,436 geographically dis-
tinct hospital service areas in the United States. In each hospital service area, most
of the care received by Medicare patients is provided in hospitals within the area.
Based on the patterns of care for major cardiovascular surgery and neurosurgery,
hospital service areas were aggregated into 306 hospital referral regions; this Atlas
reports on patterns of care in these hospital referral regions.
How Hospital Service Areas Were Defined
Hospital service areas were defined through a three-step process. First, all acute care
hospitals in the 50 states and the District of Columbia were identified from the
American Hospital Association and Medicare provider files and assigned to the
town or city in which they were located. The name of the town or city was used
13
as the name of the hospital service area, even though the area might have extended
well beyond the political boundary of the town. For example, the Mt. Ascutney
Hospital is in Windsor, Vermont. The area is called the Windsor hospital service
area, even though the area serves several other communities.
In the second step, all 1992 and 1993 Medicare hospitalization records for each
hospital were analyzed to ascertain the ZIP Code of each of its patients. When a
town or city had more than one hospital, the counts were added together. Using a
plurality rule, each ZIP Code was assigned on a provisional basis to the town con-
taining the hospitals most often used by local residents.
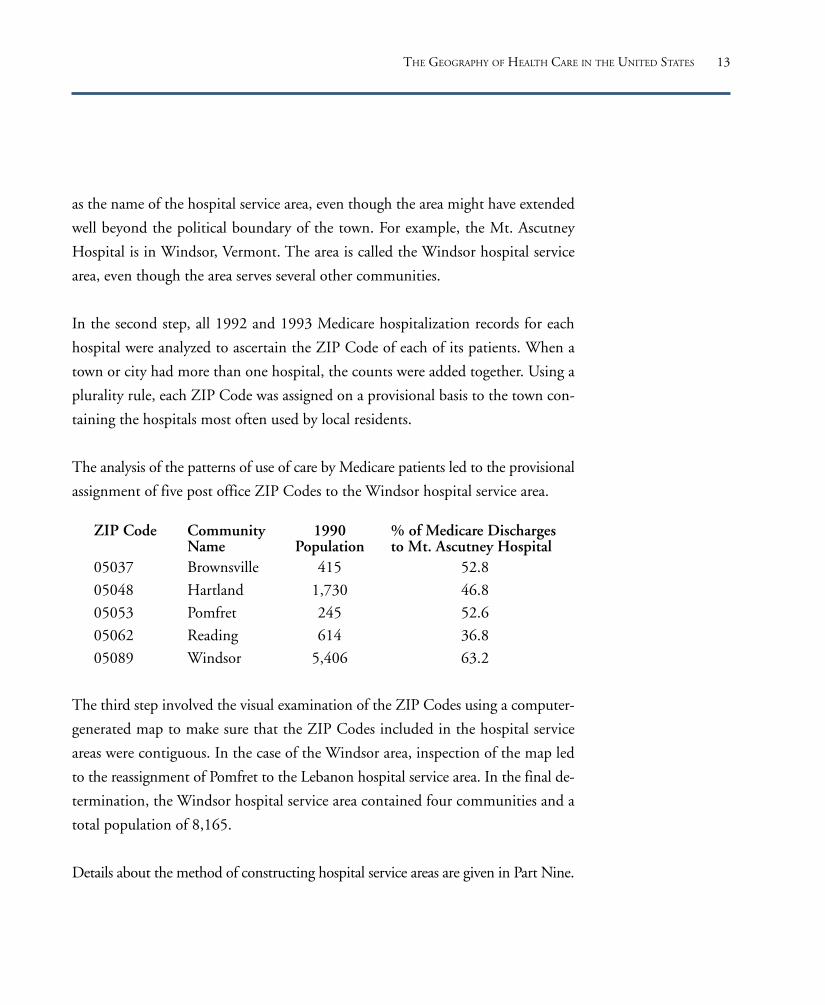
The analysis of the patterns of use of care by Medicare patients led to the provisional
assignment of five post office ZIP Codes to the Windsor hospital service area.
The third step involved the visual examination of the ZIP Codes using a computer-
generated map to make sure that the ZIP Codes included in the hospital service
areas were contiguous. In the case of the Windsor area, inspection of the map led
to the reassignment of Pomfret to the Lebanon hospital service area. In the final de-
termination, the Windsor hospital service area contained four communities and a
total population of 8,165.
Details about the method of constructing hospital service areas are given in Part Nine.
ZIP Code
05037
05048
05053
05062
05089
CommunityNameBrownsville
Hartland
Pomfret
Reading
Windsor
1990Population
415
1,730
245
614
5,406
% of Medicare Dischargesto Mt. Ascutney Hospital
52.8
46.8
52.6
36.8
63.2
THE GEOGRAPHY OF HEALTH CARE IN THE UNITED STATES
14 THE DARTMOUTH ATLAS OF HEALTH CARE
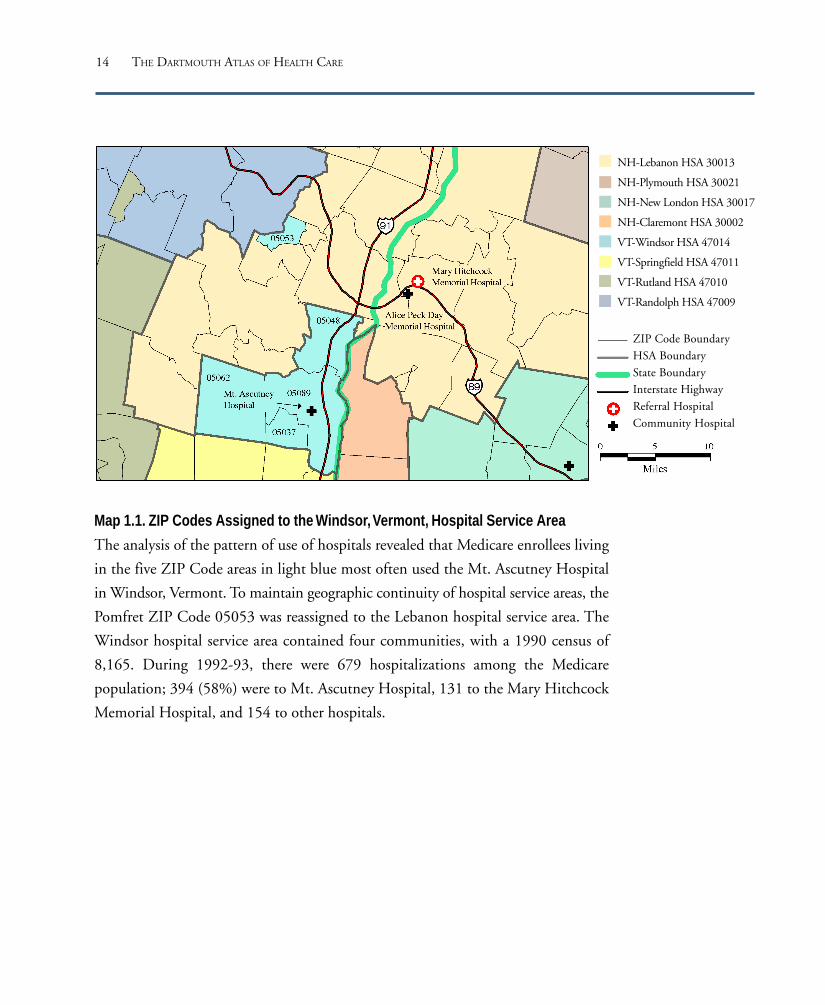
Map 1.1. ZIP Codes Assigned to the Windsor, Vermont, Hospital Service Area
The analysis of the pattern of use of hospitals revealed that Medicare enrollees living
in the five ZIP Code areas in light blue most often used the Mt. Ascutney Hospital
in Windsor, Vermont. To maintain geographic continuity of hospital service areas, the
Pomfret ZIP Code 05053 was reassigned to the Lebanon hospital service area. The
Windsor hospital service area contained four communities, with a 1990 census of
8,165. During 1992-93, there were 679 hospitalizations among the Medicare
population; 394 (58%) were to Mt. Ascutney Hospital, 131 to the Mary Hitchcock
Memorial Hospital, and 154 to other hospitals.
NH-Lebanon HSA 30013
NH-Plymouth HSA 30021
NH-New London HSA 30017
NH-Claremont HSA 30002
VT-Windsor HSA 47014
VT-Springfield HSA 47011
VT-Rutland HSA 47010
VT-Randolph HSA 47009
ZIP Code Boundary
HSA Boundary
State Boundary
Interstate Highway
Referral Hospital
Community Hospital

15
Figure 1.1. Cumulative Percentage of Population of theUnited States According to the Hospital Service AreaLocalization Index (1992-93)The localization index is the proportion of all hospitalizations forarea residents that occur in a hospital or hospitals within the area.The figure shows the localization index for Medicare patients in3,436 hospital service areas, according to the cumulative propor-tion of the population living in the region. Most of the populationlived in regions where more than 50% of hospitalizations occurredlocally.
Hospital Service Areas in the United States
The documentation of the patterns of use of hospitals according to Medicare
enrollee ZIP Codes during 1992-93 led to the aggregation of approximately 42,000
ZIP Codes into 3,436 hospital service areas. In each area, more Medicare patients
were hospitalized locally than in any other single hospital service area. The propen-
sity of patients to use local hospitals is measured by the localization index, which is
the percentage of all residents’ hospitalizations that occur in local hospitals (the
number of local hospitalizations of residents divided by all hospitalizations of resi-
dents). This index varied from a low of 17.9% to over 94%. More than 85% of
Americans lived in hospital service areas where the majority of Medicare hospital-
izations occurred locally. More than 51% lived in areas where the localization index
100
90
80
70
60
50
40
30
20
10
015% 35% 55% 75% 95%
Localization Index for Hospital Service Areas
Cum
ulat
ive P
erce
ntag
e of
U.S
. Pop
ulat
ion
exceeded 70%.
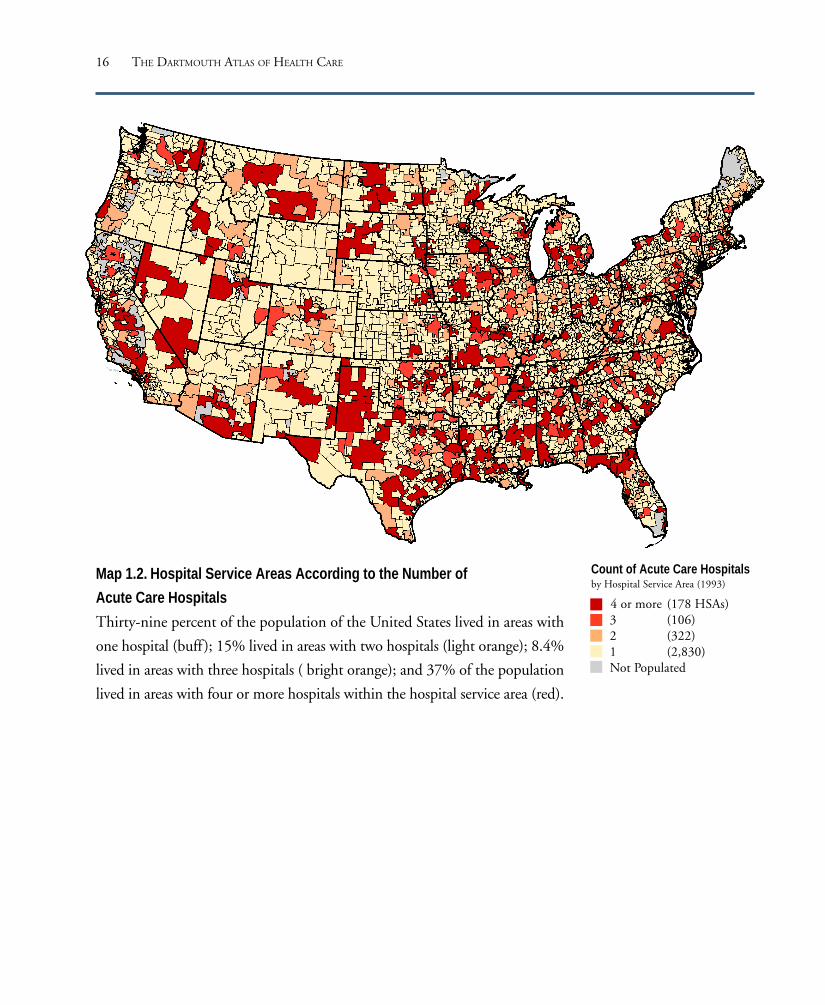
In 1993, most Americans lived in hospital ser-
vice areas with three or fewer local hospitals.
Eighty-two percent, or 2,830, of all hospital
service areas, which comprised 39% of the
population in 1990, had only one hospital.
Four hundred twenty-eight hospital service
areas, which comprised 23% of the United
States population, had either two or three hos-
pitals. One hundred seventy-eight, or less than
6% of hospital service areas, had four or more
local hospitals and comprised about 37% of the
population of the United States.
THE GEOGRAPHY OF HEALTH CARE IN THE UNITED STATES
16 THE DARTMOUTH ATLAS OF HEALTH CARE
Map 1.2. Hospital Service Areas According to the Number of
Acute Care Hospitals
Thirty-nine percent of the population of the United States lived in areas with
one hospital (buff); 15% lived in areas with two hospitals (light orange); 8.4%
lived in areas with three hospitals ( bright orange); and 37% of the population
lived in areas with four or more hospitals within the hospital service area (red).
Count of Acute Care Hospitalsby Hospital Service Area (1993)
4 or more (178 HSAs)3 (106)2 (322)1 (2,830)Not Populated

17
Population Size in Hospital Service Areas
In 1993, most of the nation’s 3,436 hospital service areas had relatively small popu-
lations; 92% had fewer than 180,000 residents. The 1990 census reported that
about 50% of the population of the United States lived in such regions. Only 32%
of Americans lived in hospital service areas with populations above 360,000 in
1990. This has important implications for health care markets, because communi-
ties with populations of fewer than 360,000 are probably too small to support
independent, competing health plans. Market research suggests that in such com-
munities, hospital resources must be shared among health plans in order to achieve
efficiency. A population of 180,000 could support three plans which provided pri-
mary care and some basic specialty services but shared inpatient facilities.
More than 52% of the nation’s 3,436 hospital service areas had fewer than 30,000
residents; these areas comprised about 10% of the population of the United States.
In these areas, the population may be too small to support competition between
even primary care physician networks.
Figure 1.2. Cumulative Percentage of Population of the UnitedStates According to the Population Size of Hospital ServiceAreas (1990 Census)Most Americans lived in hospital service areas with fewer than360,000 residents, the minimum size required to support threeindependent health plans.
Resident Population in HSAs(Log Scale)
Perc
enta
ge o
f U.S
. Pop
ulat
ion
Livin
g in
HSA
sof
Les
s Th
an S
pecif
ic Si
ze
1,000 10,000 100,000 1,000,000 10,000,000
100
90
80
70
60
50
40
30
20
10
0
THE GEOGRAPHY OF HEALTH CARE IN THE UNITED STATES

18 THE DARTMOUTH ATLAS OF HEALTH CARE
Map 1.3. Hospital Service Areas According to Population Size
According to the 1990 census, about 10% of the population of the
United States lived in areas with populations of fewer than 30,000;
about 50% lived in areas with fewer than 180,000 residents. Only
32% of Americans lived in hospital service areas with populations
greater than 360,000.
Population of HospitalService Areas
360,000 or more (104 HSAs)180,000 to <360,000 (171)
30,000 to <180,000 (1,344)866 to <30,000 (1,817)
Not Populated

19
How Hospital Referral Regions Were Defined
Hospital service areas make clear the patterns of use of local hospitals. A significant
proportion of care, however, is provided by referral hospitals that serve a larger
region. Hospital referral regions were defined in this Atlas by documenting where
patients were referred for major cardiovascular surgical procedures and for neurosur-
gery. Each hospital service area was examined to determine where most of its
residents went for these services. The result was the aggregation of the 3,436 hos-
pital service areas into 306 hospital referral regions. Each hospital referral region had
at least one city where both major cardiovascular surgical procedures and neurosur-
gery were performed. Maps were used to make sure that the small number of
“orphan” hospital service areas – those surrounded by hospital service areas allocated
to a different hospital referral region – were reassigned, in almost all cases, to ensure
geographic contiguity. Hospital referral regions were pooled with neighbors if their
populations were less than 120,000 or if less than 65% of their residents’ hospital-
izations occurred within the region.
Hospital referral regions were named for the hospital service area containing the
referral hospital or hospitals most often used by residents of the region. The regions
sometimes cross state boundaries. The Evansville, Indiana, hospital referral region
(Map 1.4) provides an example of a region that is located in three states: Illinois,
Indiana, and Kentucky. In this region, three hospitals provided cardiovascular sur-
gery services. Two were in Evansville; a third hospital, in Vincennes, Indiana, also
provided cardiovascular surgery, but in the years of this study residents of the
Vincennes area used cardiovascular and neurosurgery procedures provided in Evans-
ville more frequently than those in Vincennes, resulting in the assignment of the
Vincennes hospital service area to the Evansville hospital referral region.
Map 1.4 also provides an example of a region with a population too small to meet
the minimum criterion for designation as a hospital referral region. The Madison-
ville, Kentucky, hospital service area met the criterion as a hospital referral region
THE GEOGRAPHY OF HEALTH CARE IN THE UNITED STATES

20 THE DARTMOUTH ATLAS OF HEALTH CARE
on the basis of the plurality rule, but its population was less than 57,000. The area
was assigned to the Paducah, Kentucky, hospital referral region because hospitals in
Paducah were the second most commonly used place of care for cardiovascular and
neurosurgical procedures.
21
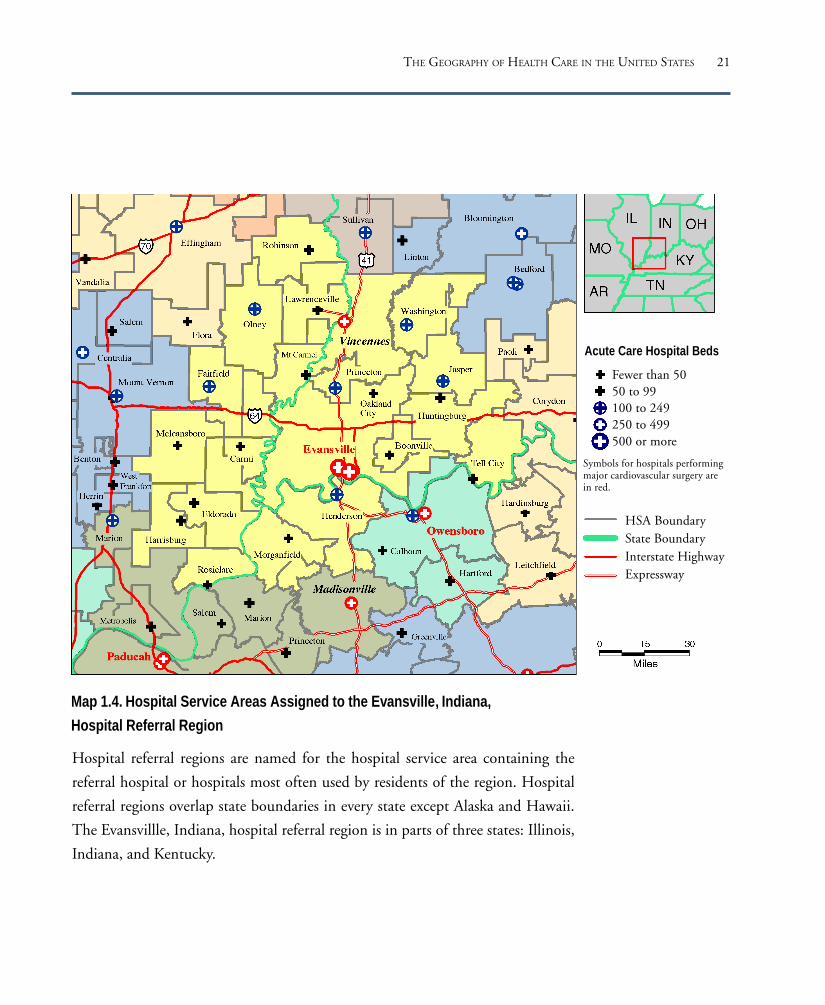
Acute Care Hospital Beds
Fewer than 5050 to 99100 to 249250 to 499500 or more
Symbols for hospitals performingmajor cardiovascular surgery arein red.
HSA BoundaryState BoundaryInterstate HighwayExpressway
Map 1.4. Hospital Service Areas Assigned to the Evansville, Indiana,
Hospital Referral Region
THE GEOGRAPHY OF HEALTH CARE IN THE UNITED STATES
Hospital referral regions are named for the hospital service area containing the
referral hospital or hospitals most often used by residents of the region. Hospital
referral regions overlap state boundaries in every state except Alaska and Hawaii.
The Evansvillle, Indiana, hospital referral region is in parts of three states: Illinois,
Indiana, and Kentucky.

22 THE DARTMOUTH ATLAS OF HEALTH CARE
Figure 1.3. Cumulative Percentage of Population of theUnited States According to the Hospital Referral RegionLocalization Index (1992-93)The localization index is the proportion of allhospitalizations for area residents that occurred in a hospitalor hospitals within the region. Ninety-one percent ofAmericans lived in regions in which more than 80% ofhospitalizations occurred locally.
Among the 306 hospital referral regions in the United States, the localization index
ranged from 66% to over 97%; the median was 87.5%. Ninety-one percent of
Americans lived in hospital referral regions in which more than 80% of hospitaliza-
tions occurred locally.
The hospital referral regions’ populations ranged from 121,666, in Bend, Oregon,
to 8,891,233 in Los Angeles. One hundred fifty-one regions, or 49%, comprising
17% of the population of the United States, had populations of fewer than
500,000. Seventy-four hospital referral regions, or 24%, comprising 60% of the
population, had more than one million residents, according to the 1990 census.
The number of hospitals providing major cardiovascular surgery within the hospital
referral region ranged from one (in most regions) to 37 in Los Angeles. One
hundred twenty-two, or 40%, of the 306 hospital
referral regions had only one hospital that
performed major cardiovascular surgery. One
hundred fourteen, or 37%, had two or three
hospitals providing these services; 70, or 23%, had
four or more.
The Hospital Referral Regions in the United States
100
90
80
70
60
50
40
30
20
10
0
Localization Index for Hospital Referral Regions
Cum
ulat
ive P
erce
ntag
e of
U.S
. Pop
ulat
ion
65% 70% 75% 80% 85% 90% 95% 100%

23
Map 1.5. Hospital Referral Regions According to the Number of Hospitals
Performing Major Cardiovascular Surgery
Seventeen percent of the population of the United States lived in hospital
referral regions with one hospital offering major cardiovascular surgery
(buff ), 18% in areas with two (light orange), 11% in regions with three
(bright orange), and 54% in regions with four or more (red).
THE GEOGRAPHY OF HEALTH CARE IN THE UNITED STATES
San Francisco Washington-Baltimore New YorkDetroitChicago
Number of HospitalsPerforming MajorCardiovascular Surgeryby Hospital Referral Region (1993)
4 or more (70 HRRs)3 (36)2 (78)1 (122)Not Populated

24 THE DARTMOUTH ATLAS OF HEALTH CARE
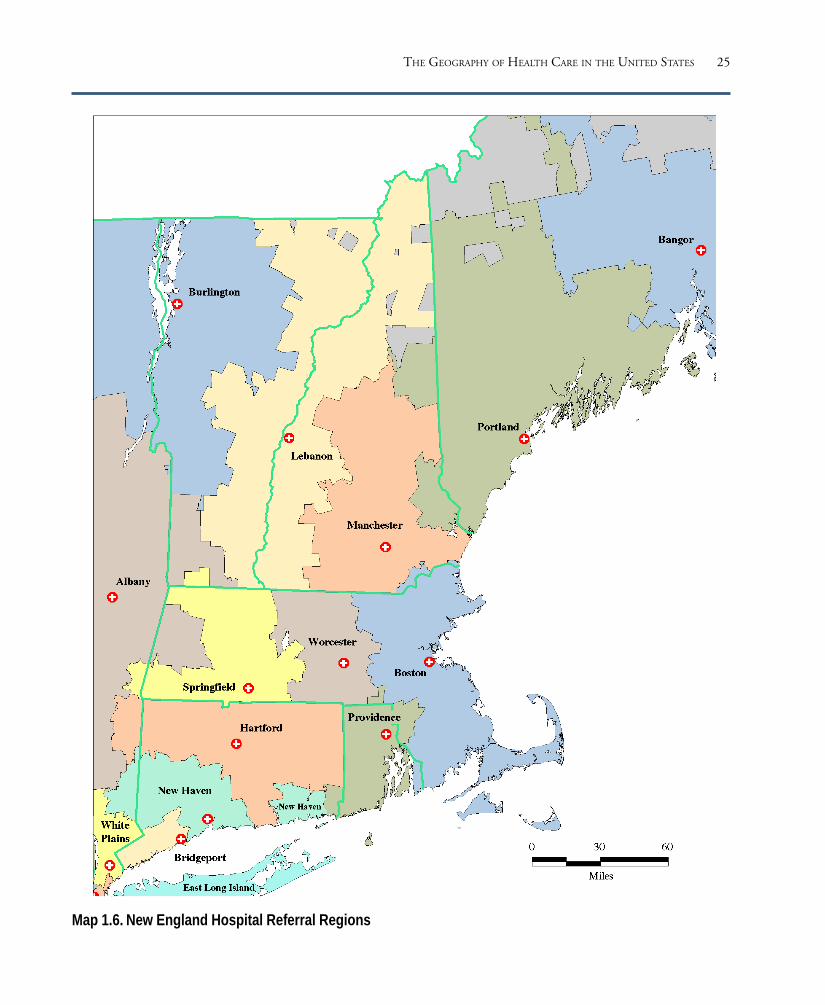
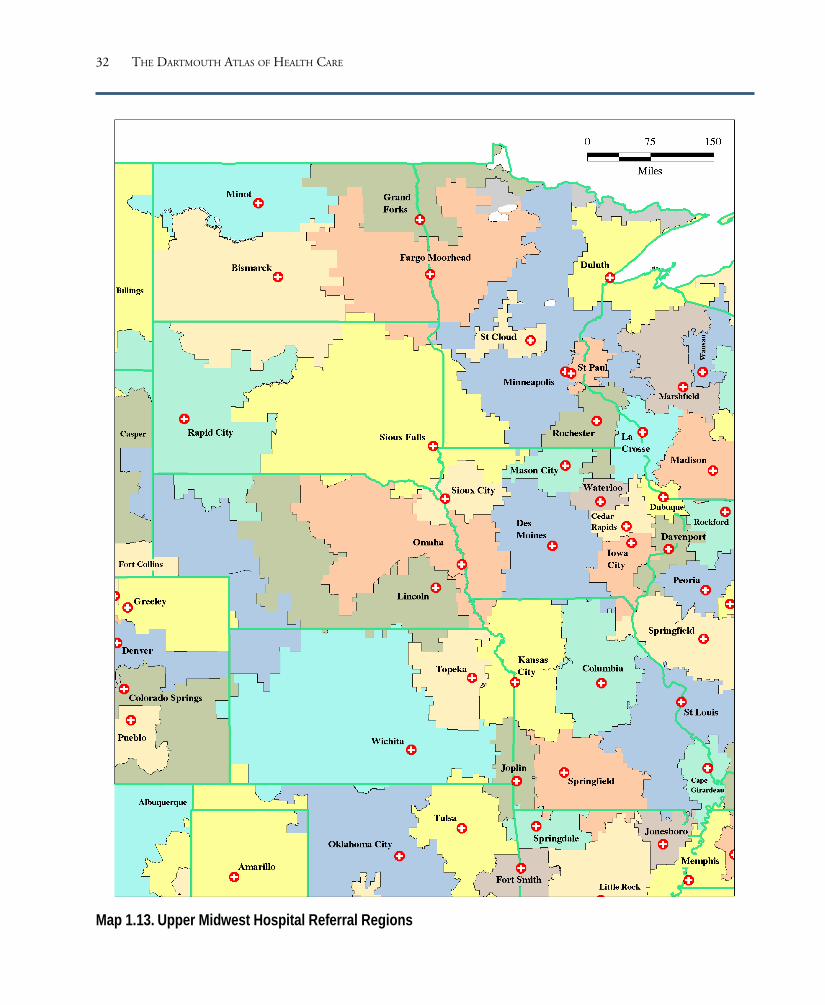
The maps on the following pages outline the boundaries of the hospital referral
regions. Although in some regions more than one city provided referral care, each
hospital referral region was named for the city where most patients receiving major
cardiovascular surgical procedures and neurosurgery were referred for care.
Maps of Hospital Referral Regions in the United States
25
Map 1.6. New England Hospital Referral Regions
THE GEOGRAPHY OF HEALTH CARE IN THE UNITED STATES

26 THE DARTMOUTH ATLAS OF HEALTH CARE
Map 1.7. Northeast Hospital Referral Regions

27
Map 1.8. South Atlantic Hospital Referral Regions
THE GEOGRAPHY OF HEALTH CARE IN THE UNITED STATES

28 THE DARTMOUTH ATLAS OF HEALTH CARE
Map 1.9. Southeast Hospital Referral Regions

29
Map 1.10. South Central Hospital Referral Regions
THE GEOGRAPHY OF HEALTH CARE IN THE UNITED STATES

30 THE DARTMOUTH ATLAS OF HEALTH CARE
Map 1.11. Southwest Hospital Referral Regions

31
Map 1.12. Great Lakes Hospital Referral Regions
THE GEOGRAPHY OF HEALTH CARE IN THE UNITED STATES
32 THE DARTMOUTH ATLAS OF HEALTH CARE
Map 1.13. Upper Midwest Hospital Referral Regions
33
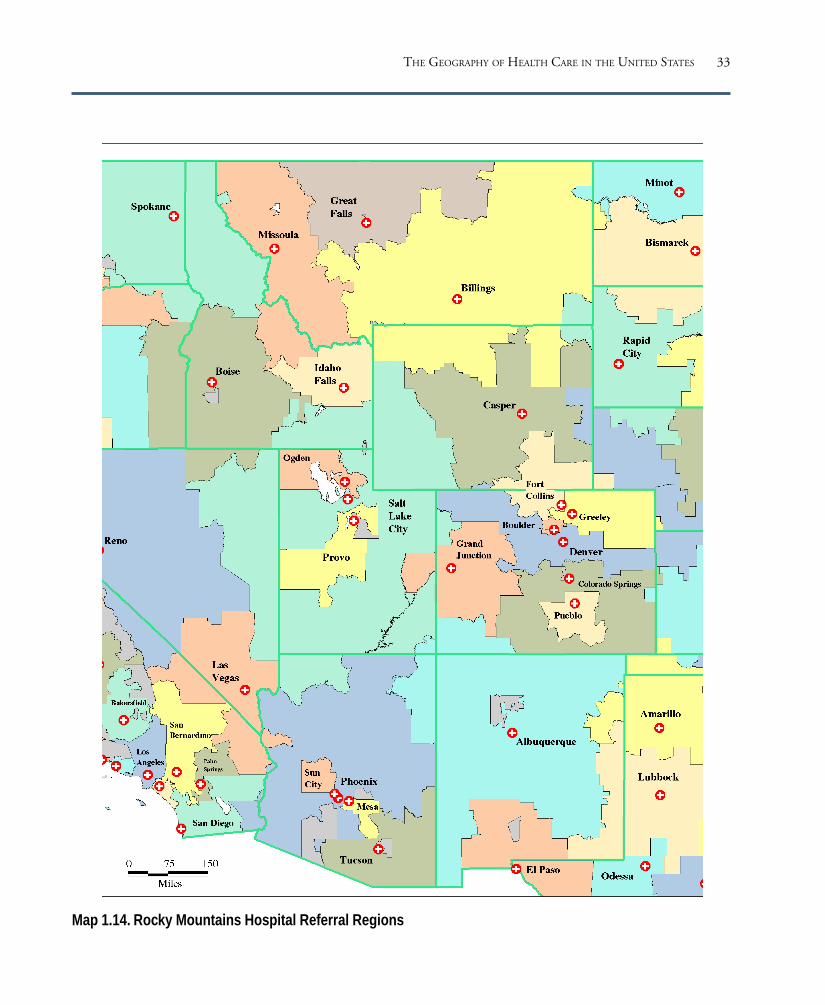
Map 1.14. Rocky Mountains Hospital Referral Regions
THE GEOGRAPHY OF HEALTH CARE IN THE UNITED STATES

34 THE DARTMOUTH ATLAS OF HEALTH CARE
Map 1.15. Pacific Northwest Hospital Referral Regions

35
Map 1.16. Pacific Coast Hospital Referral Regions
THE GEOGRAPHY OF HEALTH CARE IN THE UNITED STATES

Acute Care Hospital Resourcesand Expenditures
This section provides measures of the allocation of hospital re-
sources to the populations living in the nation’s 306 hospital
referral regions. Data from the American Hospital Association
and the Medicare Program were used to estimate the numbers
of staffed hospital beds, full time equivalent hospital employ-
ees, registered nurses employed in acute care hospitals, and
hospital expenditures allocated to care for the population of
each region. The population count is from the 1990 United
States census.
The estimates for resource allocations presented in the Atlas
have been adjusted for differences in age, sex, and, in the case
of expenditures, regional differences in prices. The allocation
method adjusts for patient migration to hospitals located out-
side of the hospital referral region where the patient resides.
Part Nine explains how these adjustments were done.
PART TWO

38 THE DARTMOUTH ATLAS OF HEALTH CARE
There were more than 827,000 acute care hospital beds in the United States in
1993, an average of 3.3 hospital beds per thousand residents. The numbers of
hospital beds per thousand persons, after adjusting for differences in age and sex,
varied by a factor of 2.8, from fewer than 2 beds per thousand residents in Mesa,
Arizona (1.9); Santa Cruz, California (1.9); and Everett, Washington (2.0), to more
than 5 in Bismarck, North Dakota (5.2); New Orleans (5.2); and Monroe,
Louisiana (5.3).
Among the hospital referral regions with large populations, those with the highest
numbers of hospital beds per thousand residents were the Bronx, New York (4.9);
Jackson, Mississippi (4.7); Newark, New Jersey (4.7); Manhattan (4.6); and
Chicago (4.6).
Acute Care Hospital Beds
Figure 2.1. Acute Care Hospital Beds Allocated to HospitalReferral Regions (1993)The number of hospital beds per thousand residents, after adjustingfor differences in the age and sex of the local population, rangedfrom fewer than two to more than five. Each point represents oneof the 306 hospital referral regions in the United States.
Regions with more than one million residents
that had comparatively low numbers of beds per
thousand residents were San Jose, California (2.1);
Seattle (2.2); Arlington, Virginia (2.2); Hono-
lulu (2.4); and New Haven, Connecticut (2.5).
The numbers of hospital beds in some cases
varied strikingly between neighboring hospital
referral regions. For example, the Augusta,
Georgia, hospital referral region had 4.2 beds
per thousand residents, but the contiguous hos-
pital referral region in Columbia, South
Carolina, had 3.2. Sioux Falls, South Dakota,
had 4.2 beds per thousand, but the neighboring
Minneapolis hospital referral region had only 2.8.
Hosp
ital B
eds
per 1
,000
Res
iden
ts in
HRR
s
5.5
5.0
4.5
4.0
3.5
3.0
2.5
2.0
1.5
1.0

39
San Francisco Washington-Baltimore New YorkDetroitChicago
Map 2.1. Acute Care Hospital Beds
There were clear patterns of variation in the supply of hospital beds per
thousand residents across the United States in 1993. The West Coast, parts
of the East Coast, and some other areas had relatively few beds per thousand
residents, but the Midwest, Upper Midwest, and South had high numbers
of beds per thousand residents.
Acute Care Hospital Bedsper 1,000 Residentsby Hospital Referral Region(1993)
3.96 to 5.30 (60 HRRs)3.45 to <3.96 (62)3.08 to <3.45 (61)2.75 to <3.08 (61)1.86 to <2.75 (62)Not Populated
ACUTE CARE HOSPITAL RESOURCES AND EXPENDITURES

40 THE DARTMOUTH ATLAS OF HEALTH CARE
There were more than 3.56 million workers employed in acute care hospitals in the
United States in 1993. The numbers of full time equivalent hospital employees per
thousand residents, after adjusting for differences in population age and sex, varied
by a factor of 3.3, from 8 or fewer in Mesa, Arizona (8.0); Bradenton, Florida (7.9);
Santa Cruz, California (7.2); and Mason City, Iowa (6.5), to more than 21 in
Chicago (21.0); New Orleans (21.2); Manhattan (22.3); Monroe, Louisiana (24.0);
and the Bronx, New York (26.4).
Other hospital referral regions with high numbers of employees per thousand
residents included Munster, Indiana (19.1); Newark, New Jersey (19.0); Johnstown,
Pennsylvania (19.0); Detroit (18.8); and Meridian, Mississippi (18.4). Among
hospital referral regions with low numbers of personnel per thousand residents were
San Diego (9.8); Austin, Texas (9.0); and Clearwater, Florida (8.9).
Acute Care Hospital Employees
Figure 2.2. Hospital Employees Allocated to HospitalReferral Regions (1993)The number of full time equivalent hospital employees perthousand residents, after adjusting for differences in the ageand sex of the local population, ranged from 6.5 to morethan 26. Each point represents one of the 306 hospitalreferral regions in the United States.
30
25
20
15
10
5Hosp
ital E
mpl
oye
espe
r 1,0
00 R
esid
ents
in H
RRs

41
San Francisco Washington-Baltimore New YorkDetroitChicago
Hospital Employees per 1,000Residentsby Hospital Referral Region (1993)
15.85 to 26.42 (61 HRRs)14.48 to <15.85 (63)13.30 to <14.48 (61)11.93 to <13.30 (57)
6.50 to <11.93 (64)Not Populated
Map 2.2. Acute Care Hospital Employees
There were clear patterns of variation in the numbers of hospital employees
per thousand residents in hospital referral regions across the United States
in 1993. The West Coast, parts of the East Coast, and some other areas had
relatively few, but the Midwest, Northeast, and South tended to have larger
workforces devoted to acute care.
ACUTE CARE HOSPITAL RESOURCES AND EXPENDITURES
42 THE DARTMOUTH ATLAS OF HEALTH CARE
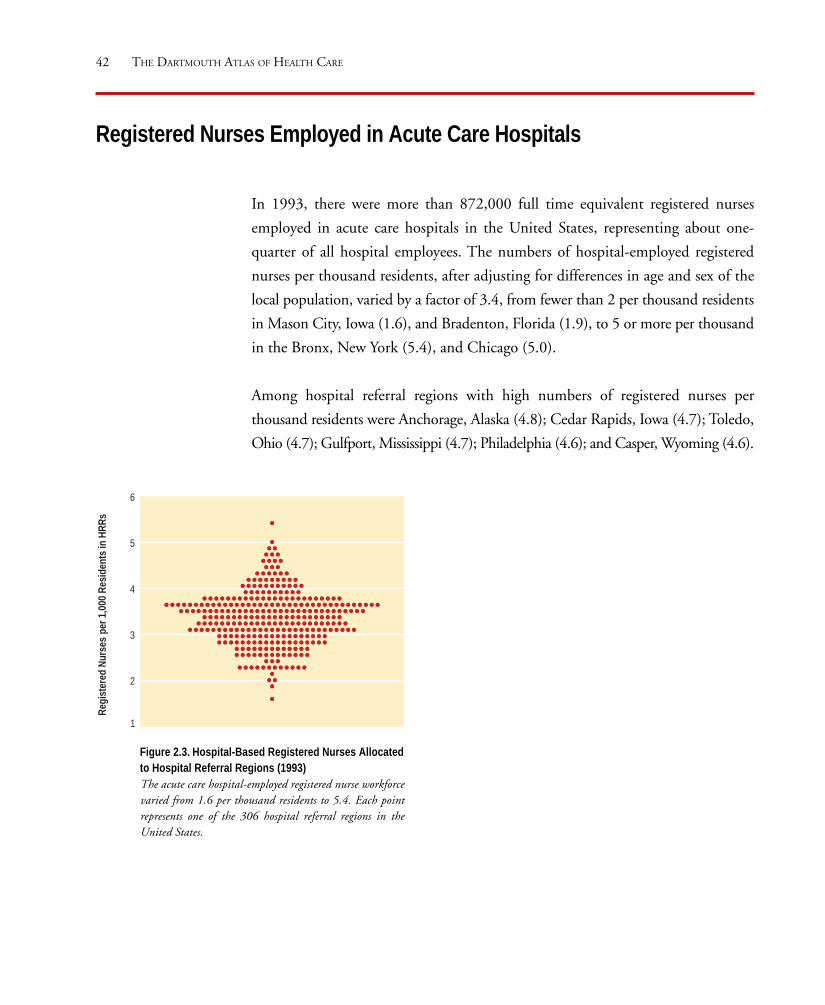
In 1993, there were more than 872,000 full time equivalent registered nurses
employed in acute care hospitals in the United States, representing about one-
quarter of all hospital employees. The numbers of hospital-employed registered
nurses per thousand residents, after adjusting for differences in age and sex of the
local population, varied by a factor of 3.4, from fewer than 2 per thousand residents
in Mason City, Iowa (1.6), and Bradenton, Florida (1.9), to 5 or more per thousand
in the Bronx, New York (5.4), and Chicago (5.0).
Among hospital referral regions with high numbers of registered nurses per
thousand residents were Anchorage, Alaska (4.8); Cedar Rapids, Iowa (4.7); Toledo,
Ohio (4.7); Gulfport, Mississippi (4.7); Philadelphia (4.6); and Casper, Wyoming (4.6).
Registered Nurses Employed in Acute Care Hospitals
Figure 2.3. Hospital-Based Registered Nurses Allocatedto Hospital Referral Regions (1993)The acute care hospital-employed registered nurse workforcevaried from 1.6 per thousand residents to 5.4. Each pointrepresents one of the 306 hospital referral regions in theUnited States.
6
5
4
3
2
Regi
ster
ed N
urse
spe
r 1,0
00 R
esid
ents
in H
RRs
1

43
San Francisco Washington-Baltimore New YorkDetroitChicago
Registered Nursesper 1,000 Residentsby Hospital Referral Region (1993)
3.80 to 5.43 (60 HRRs)3.55 to <3.80 (63)3.25 to <3.55 (61)2.90 to <3.25 (59)1.64 to <2.90 (63)Not Populated
Map 2.3. Registered Nurses Employed in Acute Care Hospitals
There were more hospital-employed registered nurses per thousand residents
in areas of the Midwest and West, and in parts of the East, and fewer in
most of California, Minnesota, Michigan, and parts of Florida and Texas
in 1993.
ACUTE CARE HOSPITAL RESOURCES AND EXPENDITURES

44 THE DARTMOUTH ATLAS OF HEALTH CARE
According to American Hospital Association records, the nation spent $260.9 billion
on hospital care in 1993, an average of $1,049 per capita. Even after adjusting for
age, sex, and regional differences in prices (see Part Nine for a description of the
methods used), the per capita expenditures for hospital care varied by a factor of 2.5,
from $651 or less in Mason City, Iowa ($503), and Arlington, Virginia ($651), to
more than $1,600 per capita in New Orleans ($1,646) and the Bronx, New York
($1,682).
Among other hospital referral regions with high per capita expenditures for hospital
care in 1993 were Chicago ($1,475 ), Manhattan ($1,467 ), Houston ($1,354),
Pittsburgh ($1,315), Philadelphia ($1,295), Cincinnati ($1,278), and Detroit
($1,263).
Total Acute Care Hospital Expenditures
Figure 2.4. Price Adjusted Acute Care HospitalExpenditures Allocated to Hospital ReferralRegions (1993)Price adjusted per capita expenditures for inpatientand outpatient care delivered by acute care hospitalsvaried by a factor of more than 3, from about $500to nearly $1,700. Each point represents one of the306 hospital referral regions in the United States.
Among the hospital referral regions with low per
capita expenditures were Takoma Park, Maryland
($703); Austin, Texas ($750); San Diego ($764);
San Jose, California ($788); Morristown, New
Jersey ($816); Orange County, California ($808);
New Haven, Connecticut ($851); and Portland,
Oregon ($856).
1,700
1,600
1,500
1,400
1,300
1,200
1,100
1,000
900
800
700
600
500
400Tota
l Hos
pita
l Exp
endi
ture
s pe
r Cap
ita in
HRR
s(d
olla
rs)

45
San Francisco Washington-Baltimore New YorkDetroitChicago
Acute Care HospitalExpenditures per capitaby Hospital Referral Region (1993)
$1,169 to 1,682 (61 HRRs)1,062 to <1,169 (61)
978 to <1,062 (59)895 to < 978 (62)503 to < 895 (63)
Not Populated
Map 2.4. Total Acute Care Hospital Expenditures
Hospital expenditures in 1993 were highest in the Midwest, South, and in
metropolitan areas, with the exception of cities in California. Total inpatient
and outpatient expenditures were generally lowest in California and the
Pacific Northwest, and in some areas, like Minnesota, where managed care
and other efforts to control costs have been effective.
ACUTE CARE HOSPITAL RESOURCES AND EXPENDITURES


Hospital Capacity,Utilization, and Outcomes
PART THREE

48 THE DARTMOUTH ATLAS OF HEALTH CARE
The availability of hospital resources is linked to hospital expenditures. The greater
the per capita supply of hospital resources, the greater will be their per capita use,
and the greater the per capita expenditures. This relationship is both straightforward
and easy to understand.
The relationship between hospital capacity and clinical decision making is more
complex. In the absence of strong scientific evidence about the outcomes of inter-
ventions, physicians must act to solve patients’ problems in the best way they know
how. This frequently involves deciding whether or not the patient would be best
served by being admitted to a hospital. The belief that hospitalization is efficacious
is widely shared between patients and physicians. Most patients who are seriously
ill willingly accept the recommendation that they be hospitalized; most physicians
believe that such patients are better served with such care. These assumptions lead
naturally to the use of available hospital resources, up to the point of their exhaus-
tion. This is true in spite of the fact that the benefits of hospitalization for most
conditions have not been tested by clinical studies.
The effect of capacity on utilization is evidenced by the fact that hospitals in areas
with very high per capita supplies of hospital beds are as likely to have high occu-
pancy rates as are hospitals in areas with low per capita supplies of hospital beds,
even in areas that are demographically very similar. For example, the occupancy rate
in Boston hospitals is about equal to the occupancy rate in New Haven hospitals,
even though there are substantially more beds per capita in Boston than there are
in New Haven, and in spite of the fact that the two cities are demographically
much alike.
Hospital capacity is selective in its influence on clinical decision making. For the
majority of common episodes of illness, patients obviously do not need hospitaliza-
tion, and their treatments are not influenced by hospital capacity. Some patients
have conditions, such as hip fracture, about which virtually all physicians agree on
the diagnosis and the need for hospitalization. These patients find their way into the
Hospital Capacity, Utilization, and Outcomes

49
Figure 3.1. The Association Between AllocatedHospital Beds and Price Adjusted HospitalExpenditures (1993)Greater hospital bed capacity per thousand residents ofthe hospital referral region is associated with higherexpenditures per capita (R2=.57). In the 33 regions withfewer than 2.5 beds per thousand residents, the averageper capita expenditure was $831. In the 21 regions withmore than 4.5 beds per thousand, the average per capitaexpenditure was $1,389, or 67% higher.
hospital, regardless of the number of beds per thousand residents. But only a minor-
ity of beds are occupied by patients who have conditions about which all physicians
agree on the necessity for hospitalization. This is true even in areas with relatively
few beds per thousand.
When the number of hospital beds per thousand residents increases, some of the
incremental capacity is allocated to surgical cases; but most of the increased bed
capacity is used to treat patients with a host of common acute and chronic medi-
cal illnesses, such as pneumonia, gastroenteritis, and chronic lung disease.
Hospital Capacity and Per Capita
Expenditures for Hospital Care
In the early 1960s, Milton Roemer, a health
services researcher interested in the use of hos-
pitals, suggested that hospital beds, once built,
will be used, no matter how many there are.
The relationship between the capacity of the
acute care hospital sector (measured in allocated
beds per thousand residents of the local hospi-
tal referral region) and the costs of care provides
an important illustration of what has become
known as “Roemer’s law.” Figure 3.1 demon-
strates the strong correlation (R2=.57) between
hospital beds per thousand residents and hospi-
tal expenditures per capita.
The number of hospital employees is another
measure of hospital capacity. Figure 3.2 illus-
trates the relationship between the numbers of
employees per thousand residents in hospital
1.5 2.0 2.5 3.0 3.5 4.0 4.5 5.0 5.5
Hospital Beds per 1,000 Residents in HRRs
Price
Adju
sted
Hos
pita
l Exp
endi
ture
spe
r cap
itain
HRR
s (d
olla
rs)
1,800
1,600
1,400
1,200
1,000
800
600
400
HOSPITAL CAPACITY, UTILIZATION, AND OUTCOMES

50 THE DARTMOUTH ATLAS OF HEALTH CARE
Figure 3.2. The Association Between AllocatedHospital Employees and Price Adjusted MedicareReimbursements for Inpatient Hospital Services(1993)Greater numbers of hospital employees per thousandresidents of the hospital referral region are associatedwith higher Medicare reimbursements per enrollee(R2=.32). In the 20 regions with fewer than 10 full timeequivalent hospital employees per thousand residents, theaverage per capita reimbursement was $1,773. In the27 regions with more than 17 hospital employees perthousand, the average per capita reimbursement was$2,372, or 34% higher.
Pric
eAd
just
edIn
patie
ntRe
imbu
rsem
ents
per E
nro
llee
inHR
Rs(d
olla
rs)
3,000
2,500
2,000
1,500
1,000
Hospital Employees per 1,000 Residents in HRRs
5 10 15 20 25 30
referral regions and the regions’ price adjusted per
enrollee reimbursements for acute care hospital
services for the Medicare population. The num-
bers of full time equivalent hospital employees
and Medicare reimbursements for acute hospital
care are also correlated (R2=.32)

51
Figure 3.3. The Association Between AllocatedHospital Beds and Medicare Hospitalizations forHip Fractures (1992-93)There is little relationship between the hospital bedcapacity and the discharge rate for hip fractures(R2=.07). In hospital referral regions with more than4.5 beds per thousand residents, the average dischargerate for hip fracture was 7.3; in regions with fewerthan 2.5 beds per thousand, it was 7.2 per thousandMedicare enrollees.
Hospital Capacity and Medicare Hospitalizations for Hip Fractures
Roemer’s law does not apply equally to all conditions. Hospitalization rates for some
injuries, such as hip fractures, and certain illnesses, such as heart attacks and major
strokes, are not very sensitive to the hospital capacity; physicians everywhere appear
to agree on the need to hospitalize all patients in whom these conditions are diagnosed.
It is easy to understand why the rate of hospitalization for hip fractures is closely
related to the actual incidence of the condition. Hip fractures are life-threatening,
and patients who break their hips almost always seek medical care. The condition
is easily diagnosed with either physical examination or X-ray. Once hip fractures are
diagnosed, virtually all patients are admitted to the hospital, even when beds are in
short supply.
Hospital capacity has little influence on the rate of
hospitalization of Medicare patients with hip frac-
tures. Figure 3.3 shows the association between beds
per thousand residents of hospital referral regions
and the age, sex, and race adjusted rates of hospital-
ization. The correlation between them is weak
(R2=.07)
Conditions like hip fracture, about which virtually
all physicians agree on the diagnosis and the need
for hospitalization, are relatively rare. Patients with
these conditions occupy a small proportion of the
available beds – less than 20% – even in regions
with low per capita hospital bed capacity.
1.5 2.0 2.5 3.0 3.5 4.0 4.5 5.0 5.5
Hospital Beds per 1,000 Residents in HRRs
10
9
8
7
6
5
Hip
Frac
ture
Disc
har
ges
per 1
,000
Enro
ll ees
inHR
Rs
HOSPITAL CAPACITY, UTILIZATION, AND OUTCOMES

52 THE DARTMOUTH ATLAS OF HEALTH CARE
Figure 3.4. The Association Between AllocatedHospital Beds and Medicare Hospitalizations forSurgical Care (1992-93)Hospital capacity is related to the Medicare dischargerate for surgical care. In hospital referral regions withfewer than 2.5 beds per thousand residents, the averagedischarge rate for surgical care among Medicareenrollees was 87.5 per thousand; in regions with morethan 4.5 beds, it was 97.3.
Hospital Capacity and Medicare Hospitalizations for Surgical Care
About 30% of hospitalizations of Medicare enrollees involve surgery. In recent years,
health policy makers have sought to promote the wider use of outpatient surgery as
a means of controlling costs, yet Roemer’s law still influences the rates of hospital-
ization for surgery. Figure 3.4 shows the association between beds per thousand
residents and the age, sex, and race adjusted rates of Medicare surgical hospitaliza-
tions (R2=.20). The relationship between capacity and the hospitalization rate is
important, but not as strong as for medical conditions.
Previous studies have shown that the effect of capacity is largely on the admission
rates for minor surgery – procedures that can be done on an outpatient basis. Major
operations are not very sensitive to overall bed capacity. The rates of major surgery
are influenced by other factors, including the per
capita numbers of surgeons, the availability of diag-
nostic screening tests, and the practice styles of
individual physicians.
1.5 2.0 2.5 3.0 3.5 4.0 4.5 5.0 5.5
Hospital Beds per 1,000 Residents in HRRs
Surg
ical
Disc
har
ges
per
1,00
0En
roll e
esin
HRRs
130
120
110
100
90
80
70
60

53
Figure 3.5. The Association Between AllocatedHospital Beds and Medicare Hospitalizations forHigh Variation Medical Conditions (1992-93)There is a strong relationship between hospital capacityand its utilization for the treatment of patients withhigh variation medical conditions (R2=.57). Inhospital referral regions with fewer than 2.5 beds perthousand residents, the average discharge rate forpatients with these conditions was 145.0 per thousand;in regions with more than 4.5 beds per thousandresidents, the rate was 219.8.
Hospital Capacity and Medicare Hospitalizations for High Variation
Medical Conditions
Most patients – more than 80% – who are admitted to the medical wards of the
nation’s hospitals are suffering with what have been described as “high variation
medical conditions.” These are conditions that show striking variation in the rates
of admission among regions. They include such problems as pneumonia, chronic
obstructive pulmonary disease, gastroenteritis, and congestive heart failure. Hospital
capacity exercises its strongest influence on physicians’ decisions about whether to
hospitalize patients with such conditions.
Figure 3.5 demonstrates the strong relationship be-
tween hospital beds per thousand residents and the
hospitalization rate for patients with high variation
conditions (R2=.57). In contrast to hip fracture pa-
tients, the rules used for decisions about whether
or not to hospitalize patients with high variation
medical conditions are not well standardized; there
is no scientific basis for professional consensus.
Physicians cannot consult medical textbooks to
learn which patients with high variation medical
conditions should be hospitalized and which could
be safely treated outside the hospital. In areas with
higher supplies of acute care hospital beds per
thousand residents, people with high variation
medical conditions are more likely to be admitted
to the hospital than they would be if they had the
same condition but were living in a region with lower
per capita supplies of hospital beds. In the absence of
consensus, availability drives utilization and costs.
HOSPITAL CAPACITY, UTILIZATION, AND OUTCOMES
1.5 2.0 2.5 3.0 3.5 4.0 4.5 5.0 5.5
Hospital Beds per 1,000 Residents in HRRs
HVM
CDi
sch
arge
spe
r1,
000
Med
icar
eEn
roll
ees
inHR
Rs350
300
250
200
150
100

54 THE DARTMOUTH ATLAS OF HEALTH CARE
Figure 3.6. The Association Between AllocatedHospital Beds and the Percentage of MedicareDeaths That Occurred in Hospitals (1992-93)Greater hospital capacity increases the likelihood thatMedicare deaths will occur in the hospital (R2 = .36).In the 33 regions with fewer than 2.5 beds perthousand residents, an average of 30.5% of allMedicare deaths occurred in a hospital. In the 21regions with more than 4.5 beds per thousandresidents, the rate was 1.52 times higher; an average of46.6% of deaths occurred during a hospitalization.
Hospital Capacity and the Place Where Death Occurs
Hospital capacity influences the decisions physicians make about whether to
hospitalize patients across a broad spectrum of disease. Studies in the 1980s
comparing Boston (which had 4.5 beds per thousand residents) and New Haven
(which had 2.9) illustrated that 22% of the residents of Boston enrolled in Medicare
were admitted to hospitals; in New Haven, only 16% were. The threshold effect
also works to increase the intensity of care of the very sick. In 1985, Medicare
reimbursements for hospital care for patients who died in hospitals were 2.1 times
greater per enrollee for Bostonians than for residents of New Haven. Forty percent
of deaths of Bostonians occurred in hospitals, compared to 32% among Medicare
enrollees living in New Haven.
Researchers have found evidence that many elderly
patients would prefer to die at home, rather than in a
hospital, but hospital capacity has an important, and
apparently overriding, bearing on the place where
death occurs. Figure 3.6 illustrates the association be-
tween allocated hospital beds per thousand residents
and the probability that deaths of Medicare enrollees
will occur in a hospital. The R2 is .36.1.5 2.0 2.5 3.0 3.5 4.0 4.5 5.0 5.5
Hospital Beds per 1,000 Residents in HRRs
60
50
40
30
20Perc
enta
ge o
f all M
edica
re D
eath
sin
HRR
s Th
at O
ccur
red
in H
ospi
tals

55
Is More Better?
Residents of regions with higher hospital capacity
experience greater use of hospital care, although
the threshold effect of capacity on clinical decision
making does not extend to all conditions, as illus-
trated in Figure 3.7. The strong link between the
supply of resources, their utilization, and the
amount expended on them, raises a crucial ques-
tion: Do hospital referral regions with greater
hospital capacity have better health outcomes?
While there are many dimensions of health out-
comes, the easiest to measure and the most
important for acute care hospital services is mor-
tality. There is little evidence that populations
living in communities or regions with higher re-
source investment in inpatient care have lower
mortality. Epidemiologic studies relating level of
use of hospital care to population-based mortality
rates in New England failed to show lower mortal-
Figure 3.7. Summary of Effect of Hospital Capacity on Utilization(1992-93)The threshold effect of capacity on clinical decision making does notextend to all conditions. The figure compares the hospitalizationexperience in regions with 2.5 beds per thousand or more to regionswith fewer than 2.5 beds. There is no consistent relationship betweenhospital capacity and the discharge rate for hip fractures. The dischargerate for inpatient surgery increases as the number of beds increases. Ashospital capacity increases, the greatest increases in utilization are seenin the discharge rates for high variation medical conditions and in theintensity of care for the very sick (measured here by the percentage of allMedicare deaths in the region that occurred in hospitals).
ity rates in high rate areas, even though hospital expenditures in some communities,
such as Boston, were almost twice as high as in low use communities, such as New
Haven. A recent national study conducted in conjunction with the research for the
Atlas found a slight increase in mortality among hospital service areas with higher
levels of investment in acute hospital care, even after controlling for age, sex, race,
income, and a number of other factors related to illness and the need for care. Al-
though correlations at the population level do not provide direct evidence of cause
and effect, the association does not support the hypothesis that more hospital care
results in lower population mortality rates.
HOSPITAL CAPACITY, UTILIZATION, AND OUTCOMES
Hospital Beds per 1,000 Residents in HRRs
Hip FractureSurgery% DeadHVMC
Fewerthan2.5
2.5to
3.5
3.5to
4.5
4.5or
more
1.60
1.50
1.40
1.30
1.20
1.10
1.00
0.90
0.80Rate
s Re
lativ
e to
HRR
s W
ith F
ewer
Than
2.5
Beds
per
1,0
00 R
esid
ents
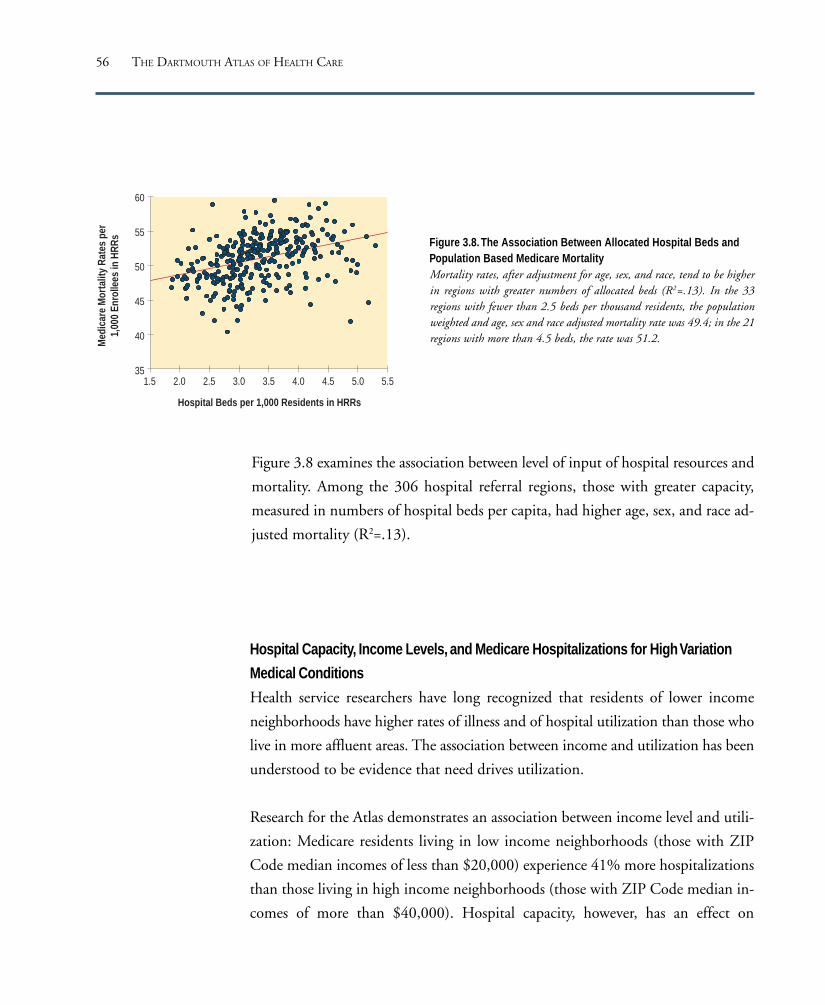
56 THE DARTMOUTH ATLAS OF HEALTH CARE
Figure 3.8. The Association Between Allocated Hospital Beds andPopulation Based Medicare MortalityMortality rates, after adjustment for age, sex, and race, tend to be higherin regions with greater numbers of allocated beds (R2=.13). In the 33regions with fewer than 2.5 beds per thousand residents, the populationweighted and age, sex and race adjusted mortality rate was 49.4; in the 21regions with more than 4.5 beds, the rate was 51.2.
Figure 3.8 examines the association between level of input of hospital resources and
mortality. Among the 306 hospital referral regions, those with greater capacity,
measured in numbers of hospital beds per capita, had higher age, sex, and race ad-
justed mortality (R2=.13).
Hospital Capacity, Income Levels, and Medicare Hospitalizations for High Variation
Medical Conditions
Health service researchers have long recognized that residents of lower income
neighborhoods have higher rates of illness and of hospital utilization than those who
live in more affluent areas. The association between income and utilization has been
understood to be evidence that need drives utilization.
Research for the Atlas demonstrates an association between income level and utili-
zation: Medicare residents living in low income neighborhoods (those with ZIP
Code median incomes of less than $20,000) experience 41% more hospitalizations
than those living in high income neighborhoods (those with ZIP Code median in-
comes of more than $40,000). Hospital capacity, however, has an effect on
1.5 2.0 2.5 3.0 3.5 4.0 4.5 5.0 5.5
Hospital Beds per 1,000 Residents in HRRs
Med
icar
eM
orta
lity
Rate
spe
r1,
000
Enro
ll ees
inHR
Rs
60
55
50
45
40
35
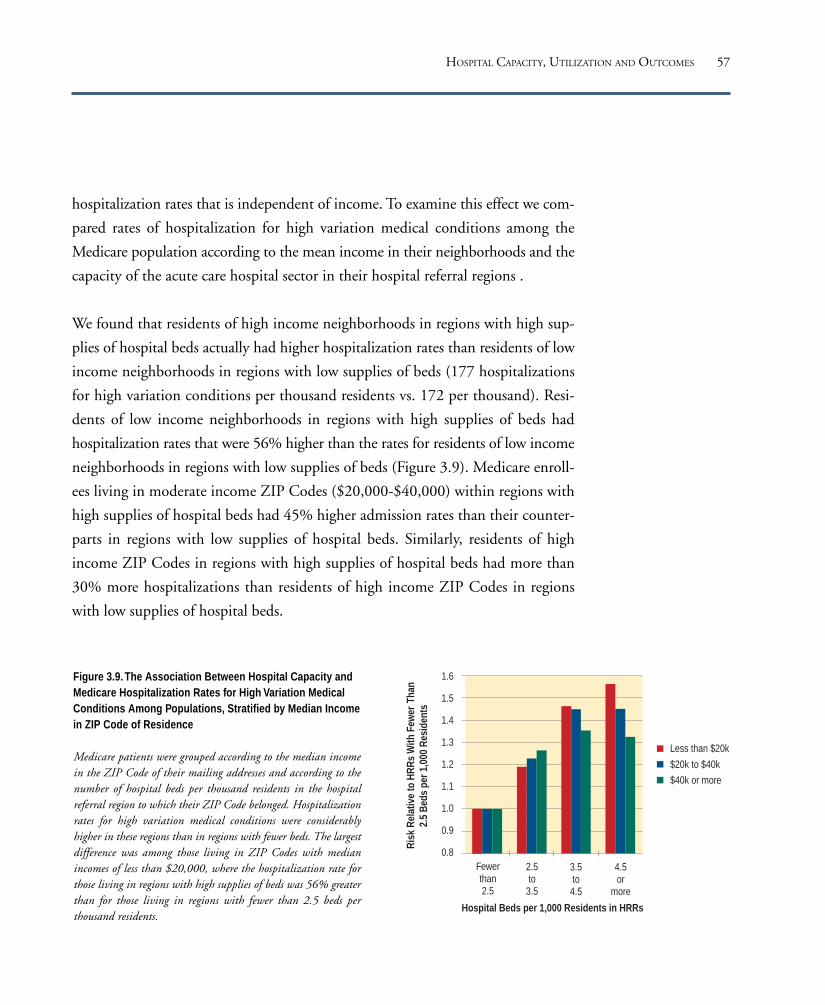
57
hospitalization rates that is independent of income. To examine this effect we com-
pared rates of hospitalization for high variation medical conditions among the
Medicare population according to the mean income in their neighborhoods and the
capacity of the acute care hospital sector in their hospital referral regions .
We found that residents of high income neighborhoods in regions with high sup-
plies of hospital beds actually had higher hospitalization rates than residents of low
income neighborhoods in regions with low supplies of beds (177 hospitalizations
for high variation conditions per thousand residents vs. 172 per thousand). Resi-
dents of low income neighborhoods in regions with high supplies of beds had
hospitalization rates that were 56% higher than the rates for residents of low income
neighborhoods in regions with low supplies of beds (Figure 3.9). Medicare enroll-
ees living in moderate income ZIP Codes ($20,000-$40,000) within regions with
high supplies of hospital beds had 45% higher admission rates than their counter-
parts in regions with low supplies of hospital beds. Similarly, residents of high
income ZIP Codes in regions with high supplies of hospital beds had more than
30% more hospitalizations than residents of high income ZIP Codes in regions
with low supplies of hospital beds.
Figure 3.9. The Association Between Hospital Capacity andMedicare Hospitalization Rates for High Variation MedicalConditions Among Populations, Stratified by Median Incomein ZIP Code of Residence
Medicare patients were grouped according to the median incomein the ZIP Code of their mailing addresses and according to thenumber of hospital beds per thousand residents in the hospitalreferral region to which their ZIP Code belonged. Hospitalizationrates for high variation medical conditions were considerablyhigher in these regions than in regions with fewer beds. The largestdifference was among those living in ZIP Codes with medianincomes of less than $20,000, where the hospitalization rate forthose living in regions with high supplies of beds was 56% greaterthan for those living in regions with fewer than 2.5 beds perthousand residents.
HOSPITAL CAPACITY, UTILIZATION AND OUTCOMES
Fewerthan2.5
2.5to
3.5
3.5to
4.5
4.5or
more
Less than $20k
$20k to $40k
$40k or more
1.6
1.5
1.4
1.3
1.2
1.1
1.0
0.9
0.8
Hospital Beds per 1,000 Residents in HRRs
Risk
Rel
ative
to H
RRs
With
Few
erTh
an2.
5 Be
ds p
er 1
,000
Res
iden
ts


The Medicare ProgramPART FOUR

60 THE DARTMOUTH ATLAS OF HEALTH CARE
In 1993, more than 34.0 million Americans over the age of 65 were enrolled in the
Medicare program. Most – more than 32.4 million – received their care from
“traditional” Medicare. That is, their care was obtained from providers who charged
on a fee-for-service basis, either as independent practitioners or as members of
health maintenance organizations that were not capitated. In 1993, $115.2 billion
– over 95% of Medicare outlays for people over 65 – was reimbursed on a fee-for-
service basis.
There were large differences in these reimbursements between hospital referral re-
gions. Total program outlays per capita varied by a factor of more than two, even
after adjusting for differences in prices among the regions. Price adjusted reimburse-
ments for acute hospital care varied more than 2.1-fold, professional and laboratory
services by more than 4.3, and home health care services by more than 25.0. The
uneven distribution of reimbursements raises the question of whether areas with
lower levels of acute care hospital services might have been achieving their inpatient
savings by substituting outpatient care, hospice care, or home health care services.
Research conducted in conjunction with the preparation of this Atlas shows very
little evidence of substitution. The opposite is often the case. Regions with higher
reimbursements for acute care hospital services tend also to have higher reimburse-
ments for hospital-based outpatient care, as well as higher reimbursements for
physician services and home health care services.
In 1993, approximately 1.6 million Medicare enrollees over the age of 65 were
members of “new” Medicare – that is, “risk bearing” or capitated payment managed
care plans. The Medicare program contributed about $7.7 billion in reimburse-
ments for the care of these enrollees as contract payments to health maintenance
organizations. There were large variations in the amount the federal government re-
imbursed for the care of those covered under the “new” Medicare, since payments
were based on the fee-for-service reimbursement rate in the region where the ben-
eficiary lived.
The Medicare Program

61
The proportion of Medicare beneficiaries who were enrolled in risk bearing man-
aged care varied greatly among hospital referral regions. More than 59.8% of
beneficiaries over the age of 65 lived in regions where less than 1% were members
of risk bearing health maintenance organizations. In San Bernardino, California,
and San Diego, California, more than 36% of Medicare participants were enrolled
in health maintenance organizations. Regions with higher per capita reimburse-
ments for traditional Medicare also tended to have larger proportions of Medicare
enrollees in risk bearing health maintenance organizations.
Estimates for reimbursements are based on a 5% sample of the Medicare population
as recorded in the Continuous Medicare History File. Fee-for-service reimburse-
ments have been price adjusted to take into account differences in the cost of living
among hospital referral regions.
THE MEDICARE PROGRAM

62 THE DARTMOUTH ATLAS OF HEALTH CARE
In 1993, price adjusted Medicare payments for Americans over the age of 65 for
services reimbursed on a fee-for-service basis (including non-risk bearing health
maintenance organizations) amounted to $115.9 billion, an average of $3,929 per
enrollee. Price adjusted per enrollee reimbursements varied remarkably among
hospital referral regions. The region with the lowest rate of Medicare reimbursement
was Lincoln, Nebraska, which had an average Medicare payment of $2,729 per
enrollee in 1993; the hospital referral region with the highest rate was Miami, which
was reimbursed $5,966 per enrollee – more than twice the rate in Lincoln.
Among the hospital referral regions with the highest per capita reimbursements for
all services were, in addition to Miami, New Orleans ($5,391); Pittsburgh ($5,096);
Nashville, Tennessee ($4,785); Baltimore ($4,664); Birmingham, Alabama
($4,643); Houston ($4,624); and Los Angeles ($4,615).
Medicare Reimbursements for Traditional (Noncapitated) Medicare
Figure 4.1. Price Adjusted Reimbursements forTraditional (Noncapitated) Medicare Among HospitalReferral Regions (1993)Per enrollee reimbursements by the Medicare program for allservices varied by a factor of more than 2, from about$2,700 to almost $6,000. Each point represents one of the306 hospital referral regions in the United States.
Among the large hospital referral regions with
lower price adjusted Medicare reimbursements
per capita were Honolulu ($2,917); Minneapo-
lis ($2,984); Grand Rapids, Michigan ($3,066);
Buffalo, New York ($3,100); Albany, New York
($3,173); Albuquerque, New Mexico ($3,178);
San Jose, California ($3,211); and Arlington,
Virginia ($3,218).
6,000
5,500
5,000
4,500
4,000
3,500
3,000
2,500Price
Adj
uste
d Re
imbu
rsem
ents
for A
ll Ser
vices
per
Enro
llee
in H
RRs
(dol
lars
)

63
San Francisco Washington-Baltimore New YorkDetroitChicago
Total MedicareReimbursements perMedicare Enrolleeby Hospital Referral Region (1993)
$4,340 to 5,966 (61 HRRs)4,020 to <4,340 (61)3,702 to <4,020 (61)3,336 to <3,702 (61)2,729 to <3,336 (62)
Not Populated
Map 4.1. Price Adjusted Reimbursements for Traditional
(Noncapitated) Medicare
Total Medicare reimbursements for all services were generally higher in
urban and densely populated areas and lower in more rural regions in 1993.
Reimbursements were higher in the East, South, and West than in the
Midwest and Northwest.
THE MEDICARE PROGRAM

64 THE DARTMOUTH ATLAS OF HEALTH CARE
Professional services reimbursements include payments to surgeons and medical
doctors for activities such as office consultations, vaccinations, and open heart sur-
gery. Among the more common laboratory services are biopsy evaluations and
blood tests. In 1993, price adjusted reimbursements for fee-for-service professional
and laboratory services for Americans over age 65 totaled $31.2 billion, an average
of $1,057 per enrollee. This represented 26.9% of total price adjusted Medicare
outlays for traditional Medicare.
With price adjusted reimbursements for professional and laboratory services totaling
$2,380 per enrollee, Miami had the highest rate in the United States. Los Angeles,
with per capita reimbursements of $1,575, was substantially lower than Miami, but
four times higher than the lowest rate region. Other regions with high per enrollee
reimbursements included Fort Lauderdale, Florida ($1,559); Orange County, Cali-
Medicare Reimbursements for Professional and Laboratory Services
Figure 4.2. Price Adjusted Part B MedicareReimbursements for Professional and LaboratoryServices Among Hospital Referral Regions (1993)Reimbursements for professional and laboratory servicesvaried by a factor of more than 4, from $546 per Medicareenrollee to $2,380. Each point represents one of the 306hospital referral regions in the United States.
fornia ($1,449); Manhattan ($1,325); Detroit
($1,302); Philadelphia ($1,309); San Diego
($1,361); Tampa, Florida ($1,311); New Or-
leans ($1,310); and Baltimore ($1,200).
Among the regions with relatively low per
capita reimbursements for professional and
laboratory services were Minneapolis ($585);
Madison, Wisconsin ($671); Rochester, Minne-
sota ($671); Portland, Oregon ($729); Sioux
Falls, South Dakota ($738); Salt Lake City
($748); Rochester, New York ($780); and Albu-
querque, New Mexico ($809).
2,500
2,000
1,500
1,000
500Price
Adj
uste
d Re
imb
urse
men
tsfo
r Pr o
fess
iona
lan
d La
b Se
rvice
spe
r Enr
olle
e in
HRR
s (d
olla
rs)
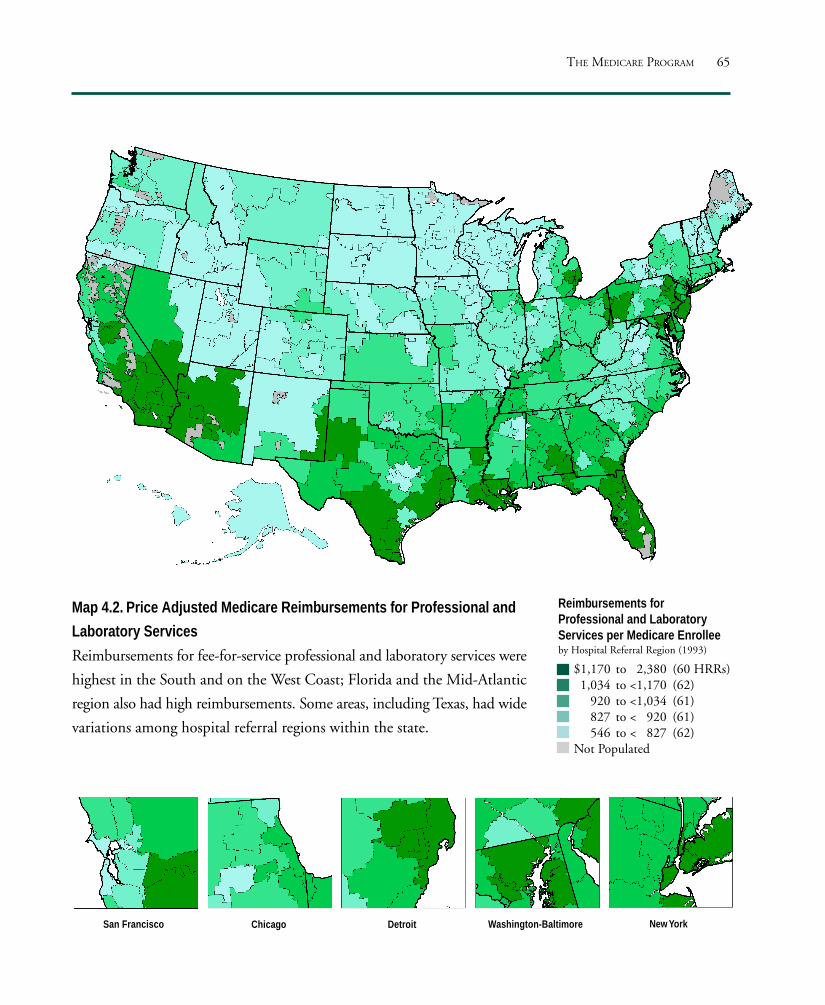
65
San Francisco Washington-Baltimore New YorkDetroitChicago
Reimbursements forProfessional and LaboratoryServices per Medicare Enrolleeby Hospital Referral Region (1993)
$1,170 to 2,380 (60 HRRs)1,034 to <1,170 (62)
920 to <1,034 (61)827 to < 920 (61)546 to < 827 (62)
Not Populated
Map 4.2. Price Adjusted Medicare Reimbursements for Professional and
Laboratory Services
Reimbursements for fee-for-service professional and laboratory services were
highest in the South and on the West Coast; Florida and the Mid-Atlantic
region also had high reimbursements. Some areas, including Texas, had wide
variations among hospital referral regions within the state.
THE MEDICARE PROGRAM

66 THE DARTMOUTH ATLAS OF HEALTH CARE
In 1993, price adjusted Medicare reimbursements to hospitals for acute, short stay
care for Americans over age 65 whose care was paid for on a fee-for-service basis was
$59.5 billion, or $2,018 per enrollee. These payments represented 51.4% of the
Medicare program’s total outlays for traditional Medicare. Price adjusted reimburse-
ments to hospitals per Medicare enrollee were more than twice as high in the
highest rate hospital referral region, Slidell, Louisiana ($2,956), than in the lowest
rate region, Albuquerque, New Mexico ($1,407).
Among the large hospital referral regions with the highest rates of per enrollee re-
imbursements for acute hospital care were Pittsburgh ($2,786); Baltimore ($2,656);
the Bronx, New York ($2,476); Toledo, Ohio ($2,423); and Chicago ($2,420).
Medicare Reimbursements for Inpatient Hospital Services
Figure 4.3. Price Adjusted Reimbursements forInpatient Hospital Services Among Hospital ReferralRegions (1993)Per enrollee Medicare reimbursements for acute carehospital services varied by a factor of more than 2, fromabout $1,400 to almost $3,000. Each point represents oneof the 306 hospital referral regions in the United States.
Other areas where per enrollee reimbursements for
hospital care were high included Manhattan
($2,382); Philadelphia ($2,379); Houston ($2,347);
and Miami ($2,297).
Other large metropolitan hospital referral regions
had relatively low per enrollee payments for acute
hospital care; they included Arlington, Virginia
($1,543); Honolulu ($1,558); Buffalo, New York
($1,601); San Francisco ($1,627); and Hartford,
Connecticut ($1,647).
3,000
2,500
2,000
1,500
1,000Price
Adj
uste
d Re
imb
urse
men
tsfo
r Inp
atie
ntHo
spita
l Ser
vices
per E
nrol
lee
in H
RRs
(dol
lars
)

67
San Francisco Washington-Baltimore New YorkDetroitChicago
Reimbursements for InpatientHospital Servicesper Medicare Enrolleeby Hospital Referral Region (1993)
$2,200 to 2,956 (63 HRRs)2,036 to <2,200 (61)1,893 to <2,036 (59)1,732 to <1,893 (60)1,407 to <1,732 (63)
Not Populated
Map 4.3. Price Adjusted Medicare Reimbursements for
Inpatient Hospital Services
Medicare reimbursements for inpatient hospital services were generally
lower in the West than in the East, and generally higher in the South than
elsewhere. Some high states, including Texas and Florida, had hospital
referral regions with inpatient reimbursement rates in each of the five
quintiles.
THE MEDICARE PROGRAM

68 THE DARTMOUTH ATLAS OF HEALTH CARE
In 1993, price adjusted Medicare reimbursements for the use of fee-for-service out-
patient facilities by enrollees over age 65 totaled $10.1 billion, or $342 per enrollee.
These reimbursements represented 8.7% of total outlays for traditional Medicare.
Price adjusted reimbursements varied by a factor of almost 3 between the lowest rate
hospital referral region, Sun City, Arizona ($190), and the highest rate region,
Slidell, Louisiana ($552).
Among the hospital referral regions with the highest rates of price adjusted Medicare
reimbursements for outpatient services per enrollee were Baltimore ($473); Omaha,
Nebraska ($458); Toledo, Ohio ($442); Wichita, Kansas ($439); Ann Arbor,
Michigan ($432); and Albuquerque, New Mexico ($430).
Medicare Reimbursements for Outpatient Facilities
Figure 4.4. Price Adjusted Medicare Reimbursementsfor Outpatient Services Among Hospital ReferralRegions (1993)Price adjusted Medicare reimbursements for outpatientservices varied by a factor of almost 3, from $190 perenrollee to $552. Each point represents one of the 306hospital referral regions in the United States.
Among the hospital referral regions with rela-
tively low per enrollee rates of reimbursement
for outpatient services in 1993 were New
Brunswick, New Jersey ($215); White Plains,
New York ($226); East Long Island, New York
($226); Las Vegas ($232); Melrose Park, Illinois
($254); Honolulu ($255); and Columbia,
South Carolina ($261).
550
500
450
400
350
300
250
200
150Price
Adj
uste
d Re
imb
urse
men
tsfo
r Out
patie
ntFa
cilitie
s pe
r Enr
olle
e in
HRR
s (d
olla
rs)

69
San Francisco Washington-Baltimore New YorkDetroitChicago
Reimbursements for OutpatientFacilities per Medicare Enrolleeby Hospital Referral Region (1993)
$393 to 552 (61 HRRs)356 to <393 (61)326 to <356 (61)291 to <326 (61)190 to <291 (62)
Not Populated
Map 4.4. Price Adjusted Medicare Reimbursements for Outpatient Services
Outpatient facilities were most heavily used in urban areas, particularly in
New England and the West Coast, and in parts of the Midwest and
Southwest. In New Mexico, Texas, and parts of the Midwest, regions with
high rates of use of outpatient facilities were contiguous with regions with
low rates; in many areas, rates of use of inpatient and outpatient facilities
were both high.
THE MEDICARE PROGRAM
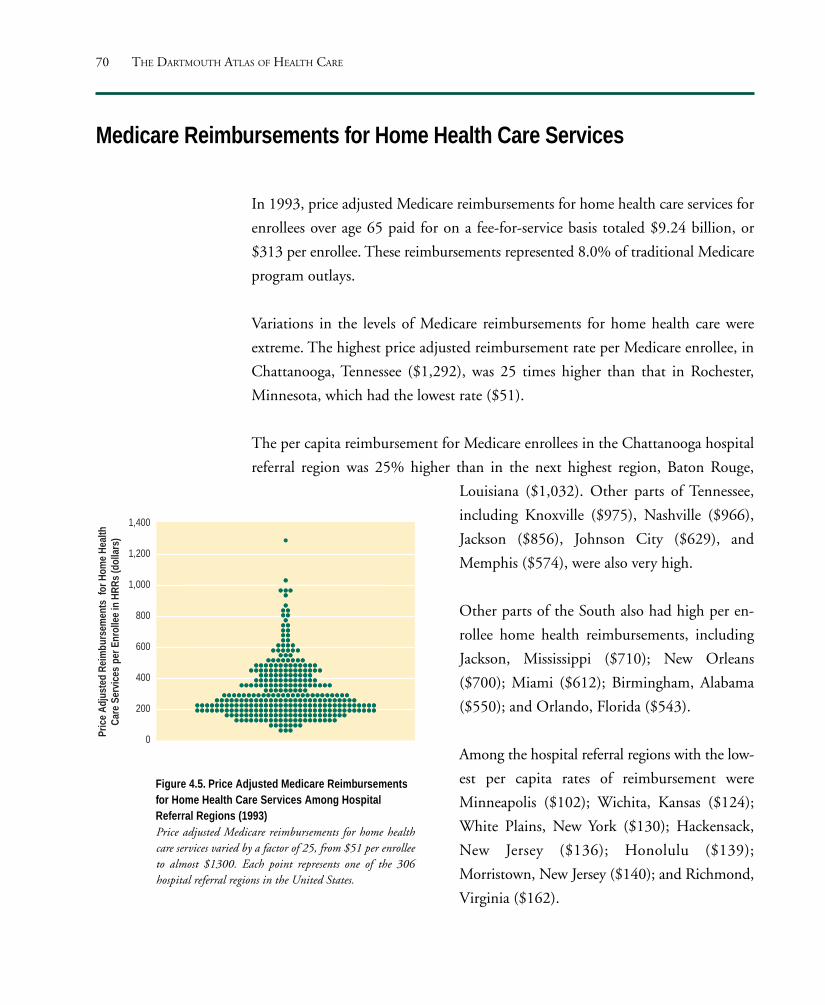
70 THE DARTMOUTH ATLAS OF HEALTH CARE
Medicare Reimbursements for Home Health Care Services
In 1993, price adjusted Medicare reimbursements for home health care services for
enrollees over age 65 paid for on a fee-for-service basis totaled $9.24 billion, or
$313 per enrollee. These reimbursements represented 8.0% of traditional Medicare
program outlays.
Variations in the levels of Medicare reimbursements for home health care were
extreme. The highest price adjusted reimbursement rate per Medicare enrollee, in
Chattanooga, Tennessee ($1,292), was 25 times higher than that in Rochester,
Minnesota, which had the lowest rate ($51).
The per capita reimbursement for Medicare enrollees in the Chattanooga hospital
referral region was 25% higher than in the next highest region, Baton Rouge,
Figure 4.5. Price Adjusted Medicare Reimbursementsfor Home Health Care Services Among HospitalReferral Regions (1993)Price adjusted Medicare reimbursements for home healthcare services varied by a factor of 25, from $51 per enrolleeto almost $1300. Each point represents one of the 306hospital referral regions in the United States.
Louisiana ($1,032). Other parts of Tennessee,
including Knoxville ($975), Nashville ($966),
Jackson ($856), Johnson City ($629), and
Memphis ($574), were also very high.
Other parts of the South also had high per en-
rollee home health reimbursements, including
Jackson, Mississippi ($710); New Orleans
($700); Miami ($612); Birmingham, Alabama
($550); and Orlando, Florida ($543).
Among the hospital referral regions with the low-
est per capita rates of reimbursement were
Minneapolis ($102); Wichita, Kansas ($124);
White Plains, New York ($130); Hackensack,
New Jersey ($136); Honolulu ($139);
Morristown, New Jersey ($140); and Richmond,
Virginia ($162).
1,400
1,200
1,000
800
600
400
200
0Price
Adj
uste
d Re
imbu
rsem
ents
for H
ome
Heal
thCa
re S
ervic
espe
r Enr
olle
e in
HRR
s (d
olla
rs)

71
San Francisco Washington-Baltimore New YorkDetroitChicago
Reimbursements forHome Health Care Servicesper Medicare Enrolleeby Hospital Referral Region (1993)
$451 to 1,292 (63 HRRs)305 to <451 (59)235 to <305 (60)189 to <235 (62)
51 to <189 (62) Not Populated
Map 4.5. Price Adjusted Medicare Reimbursements for
Home Health Care Services
Home health care services were more heavily used in the South and West
than elsewhere in the country; in contrast to most other health care services,
home health care was less heavily utilized in urban areas than in rural
regions. The Upper Midwest and Northwest had notably low rates of use of
home health care services.
THE MEDICARE PROGRAM

72 THE DARTMOUTH ATLAS OF HEALTH CARE
It has often been proposed that overall expenditures for health care can be reduced
by substituting less costly care, such as hospital outpatient services and home health
care, for more costly hospital inpatient care. It has also been suggested that reim-
bursements for physicians’ services might be lower in regions with greater use of
home health care services. Others theorize that regions with relatively scarce per
capita investment in physician services have higher costs for hospital care. The docu-
mented patterns of variation in reimbursements for Medicare services provide no
evidence that such substitutions are occurring.
Are There Tradeoffs Between Sectors of Care?
Figure 4.6. The Association Between PriceAdjusted Medicare Reimbursements forOutpatient and Inpatient Hospital Services(1993)Regions with higher reimbursements for out-patient care tended to have higher inpatientreimbursements (R2=.17).
Greater levels of expenditures for outpatient ser-
vices were not associated with lower levels of
expenditure for inpatient services. Indeed, the oppo-
site is the case: regions with higher levels of
reimbursement for outpatient care tended to
have higher reimbursements for acute hospital
care (Figure 4.6).
A number of regions that were in the top 20%
of spending for outpatient services were also in
the top quintile for spending on inpatient care;
examples include Slidell, Louisiana, which
ranks first in inpatient as well as outpatient re-
imbursements among the 306 hospital referral
regions. Johnstown, Pennsylvania, ranks fourth
in inpatient and second in outpatient reim-
bursements. Among larger hospital referral
regions that rank in the top quintile for both
inpatient and outpatient reimbursements are
Ann Arbor, Michigan; Baltimore; and Houston.
3,000
2,500
2,000
1,500
1,000150 200 250 300 350 400 450 500 550
Price Adjusted Reimbursements for OutpatientFacilities per Enrollee in HRRs (dollars)
Pric
eAd
jus
ted
Reim
burs
eme
nts
for
Inpa
tient
Hosp
ital
Serv
ices
per E
nro
llee
inHR
Rs(d
olla
rs)
73
Similarly, several regions in the lowest 20% of reimbursements for inpatient
care were also in the lowest 20% for outpatient care. These included Buf-
falo, New York; Albany, New York; Hackensack, New Jersey; and Honolulu.
Albuquerque, New Mexico, was the exception. It ranked lowest among the
306 regions in inpatient cost and was among the top 10% in outpatient
reimbursements.
There was also no evidence of tradeoffs between other alternatives to acute hos-
pital care and inpatient care. No association was found between the level of
reimbursement for acute hospital care and for home health agency care
(R2=.03), hospice care (R2=.00), or long stay care (R2=.01)
Greater reimbursements for home health agency services were not associated with
lower physician reimbursements. Indeed, there was a weak association in the
opposite direction (R2=.11), indicating that there may in fact be some rela-
tionship between higher rates of use of physicians’ services and higher rates
of use of home health care services.
THE MEDICARE PROGRAM

74 THE DARTMOUTH ATLAS OF HEALTH CARE
Regions with higher reimbursements for physicians’ services tended also to have higher
reimbursements for acute hospital care. Figure 4.7 illustrates the correlation between
price adjusted Medicare reimbursements for inpatient hospital services and price
adjusted reimbursements for professional and laboratory services; the association has
an R2 of .23.
Figure 4.7. The Association Between Price Adjusted MedicareReimbursements for Professional and Laboratory Services andfor Inpatient Hospital Services (1993)Communities with greater per enrollee outlays for short term hospitalstend also to have higher reimbursements for professional andlaboratory services (R2=.23).
3,000
2,500
2,000
1,500
1,000500 1,000 1,500 2,000 2,500
Pric
eAd
just
edRe
imbu
rse
men
tsfo
rIn
patie
ntHo
spita
l Ser
vice
spe
rEn
roll e
ein
HRRs
(dol
lars
)
Price Adjusted Reimbursements for Professionaland Lab Services per Enrollee in HRRs (dollars)
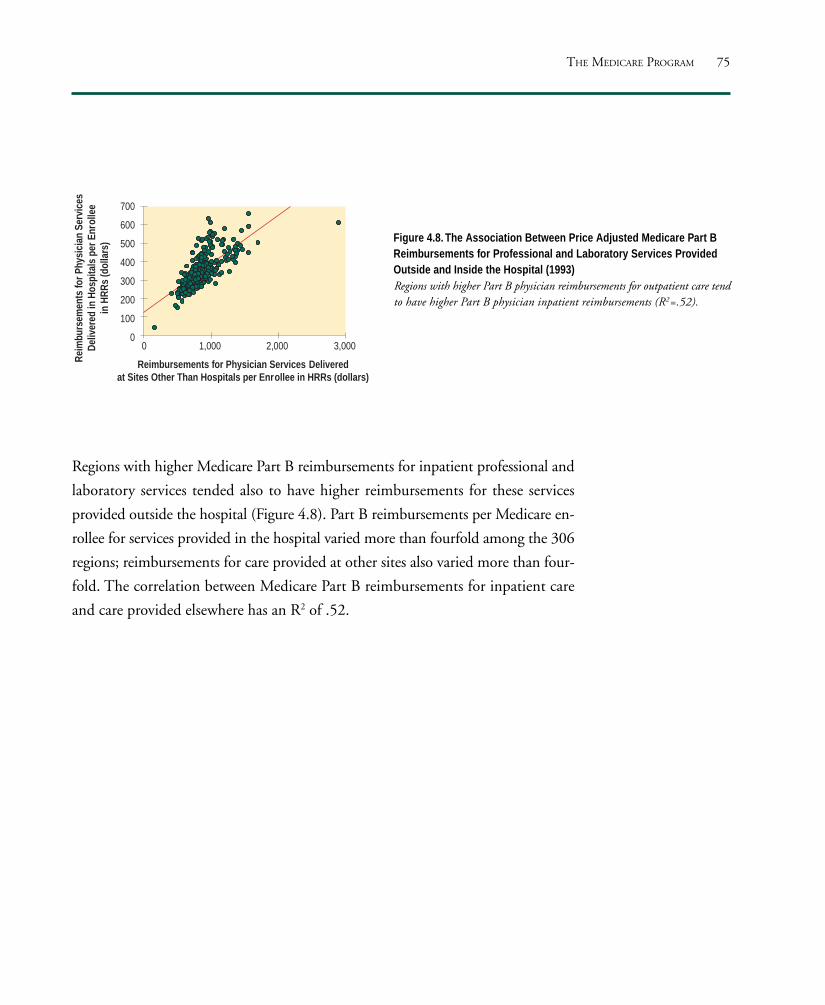
75
Figure 4.8. The Association Between Price Adjusted Medicare Part BReimbursements for Professional and Laboratory Services ProvidedOutside and Inside the Hospital (1993)Regions with higher Part B physician reimbursements for outpatient care tendto have higher Part B physician inpatient reimbursements (R2=.52).
700
600
500
400
300
200
100
0
Reimbursements for Physician Services Deliveredat Sites Other Than Hospitals per Enrollee in HRRs (dollars)
Reim
burs
emen
tsfo
r Ph
ysici
an S
ervic
esDe
liver
ed in
Hos
pita
ls pe
r Enr
olle
ein
HRR
s (d
olla
rs)
0 1,000 2,000 3,000
Regions with higher Medicare Part B reimbursements for inpatient professional and
laboratory services tended also to have higher reimbursements for these services
provided outside the hospital (Figure 4.8). Part B reimbursements per Medicare en-
rollee for services provided in the hospital varied more than fourfold among the 306
regions; reimbursements for care provided at other sites also varied more than four-
fold. The correlation between Medicare Part B reimbursements for inpatient care
and care provided elsewhere has an R2 of .52.
THE MEDICARE PROGRAM

76 THE DARTMOUTH ATLAS OF HEALTH CARE
Medicare Enrollment in Capitated Managed Care Plans
Since the early 1970s, Medicare beneficiaries have been offered the option of joining
risk bearing, or capitated, health maintenance organizations. Under the capitation
plan, the federal government pays health maintenance organizations a fixed annual
amount per enrollee. In exchange, the health maintenance organization must pro-
vide all required services. If the total costs of care exceed the amount the
government pays, then the health maintenance organization must absorb the loss;
if they are less, then the health maintenance organization may retain the difference.
In 1993, about 1.6 million, or 5.2%, of all Medicare enrollees were covered by risk
bearing health maintenance organizations, but enrollment was geographically very
uneven across the United States. More than 50% of those with health maintenance
organization coverage lived in just eight hospital referral regions. Six were on the
West Coast: Los Angeles; San Diego; San Bernardino, California; Orange County,
California; Seattle; and Portland, Oregon. Two, Fort Lauderdale and Miami, were
in Florida.
San Bernardino, California, where 50% of Medicare enrollees were in risk bearing
health maintenance organizations, had the highest penetration, followed by San
Diego (36%), Orange County (35%), and Portland (32%).
More than 60% of the Medicare population lived in hospital referral regions where
less than 1% of beneficiaries were in risk bearing health maintenance organizations.

77
San Francisco Washington-Baltimore New YorkDetroitChicago
Percentage of MedicarePopulation Enrolled inRisk Bearing HMOsby Hospital Referral Region (1993)
15 or More (24 HRRs)1 to 15 (50)Less than 1 (232)Not Populated
Map 4.6. Medicare Enrollment in Capitated Managed Care Plans
In some hospital referral regions, 15% or more of the resident Medicare
population were members of risk bearing health maintenance organizations
in 1993 (dark green). More than 71% of Medicare beneficiaries who were
members of risk bearing health maintenance organizations lived in these
regions. In other hospital referral regions, very few – less than 1% – of the
Medicare population were enrolled in risk bearing health maintenance
organizations (pale green).
THE MEDICARE PROGRAM

78 THE DARTMOUTH ATLAS OF HEALTH CARE
The federal payment for managed care coverage of Medicare enrollees is based on
the amount reimbursed for fee-for-service care where the enrollee lives. As a result,
per enrollee reimbursements are significantly higher for managed care coverage in
regions where reimbursements have historically been high. The difference can be
substantial; for example, in 1993, the age, sex and race adjusted per enrollee Medi-
care reimbursement for residents of Minneapolis served by fee-for-service care was
$2,794, while the per enrollee reimbursement for those living in Miami was $6,429,
more than twice as much.
The amount of the federal reimbursement for managed care coverage has an obvi-
ous effect on the benefits that a managed care plan is able to offer Medicare
enrollees. Health maintenance organizations in Miami or Los Angeles, where the re-
imbursement is well above the national average, can afford to offer such benefits as
drugs, eyeglasses, and long term care. Health maintenance organizations in Minne-
apolis or in Rochester, Minnesota, where reimbursements are well below the
national average, may not have the resources to provide such benefits. Enrollees liv-
ing in historically efficient markets lose, while those in inefficient markets gain.
Moreover, because the contributions that Americans make to the Medicare program
have never been adjusted for regional costs, those in more efficient, low cost mar-
kets such as Minneapolis are subsidizing the care of those living in high cost regions
like Miami.
What can be done to achieve geographic equity? The federal reimbursement can be
adjusted to equalize the per enrollee federal payment in each region. Many parts of
the country would benefit from such a policy. In 1993, 31 states had Medicare
spending rates below the national average; in 10 states the rate was more than 25%
below average.
The Federal Contribution for Medicare Enrollment in Risk BearingHealth Maintenance Organizations

79
San Francisco Washington-Baltimore New YorkDetroitChicago
Total MedicareReimbursementsas Percentage of U.S. Averageby Hospital Referral Region (1993)
125 to 176% (35 HRRs)100 to <125% (104)
75 to <100% (146)60 to < 75% (21)
Not Populated
Map 4.7. Variations in Medicare Reimbursements
Hospital referral regions that have historically received reimbursements of
less than 75% of the national average (lightest green) would benefit most
from a policy to equalize differences in per enrollee reimbursements in
establishing the value of the Medicare voucher. Those spending 125% or
more of the national average would lose the most. Equalization would
eliminate subsidies that now flow from residents of low cost regions to those
in high cost regions.
THE MEDICARE PROGRAM


The Physician Workforce
This section provides measures of the allocation of
physician resources to the populations living in the
nation’s 306 hospital referral regions. The data come
from the American Medical Association, the Ameri-
can Osteopathic Association, and the Medicare
program and are for 1993. A clinically active physi-
cian is defined as one who reported that he or she
spends at least 20 hours a week in patient care. The
population count is from the 1990 census.
The estimates for the physician workforce per
100,000 population take into account patient migra-
tion across the boundaries of the regions, using a
method similar to that used for hospital beds (Part
Two), except that surgical specialists are allocated on
the basis of surgical admissions, and medical spe-
cialists and primary care physicians on the basis of
medical admissions.
The estimates have been adjusted for differences in
age and sex of the population. Part Nine explains
how these adjustments were done.
PART FIVE

THE DARTMOUTH ATLAS OF HEALTH CARE82
The Physician Workforce Active in Patient Care
100
150
200
250
300
350
50
All A
ctive
Ph
ysici
ans
per 1
00,0
00 R
esid
ents
in H
RRs
In the 1960s and early 1970s, American health care policy leaders believed that the
physician workforce in the United States was inadequate, particularly in
underserved areas. A concerted effort was undertaken to increase the number of
medical schools and the size of their graduating classes. Residency programs were
expanded and graduates of foreign medical schools were offered more opportunities
to enter practice in the United States. These initiatives were extremely successful in
increasing the size of the physician workforce. In 1970, there were 235,241 active
physicians in the United States. By 1993, the number of active physicians had
doubled, to 469,603. The supply of physicians increased by 67%, from 113.1 per
hundred thousand persons in the United States to 189.0. (These figures measure
physicians in active clinical practice and do not
include physicians in residency training pro-
grams, who are counted separately.)
Despite this increase in the number of active
physicians, there is still a great deal of geo-
graphic variation in the distribution of the
workforce. Among the hospital referral regions
with the highest total age and sex adjusted
numbers of active physicians per hundred thou-
sand residents in 1993 were San Francisco
(317.2); White Plains, New York (303.8);
Washington, D.C. (291.1); Hackensack, New
Jersey (266.0); Manhattan (265.7); Philadelphia
(259.4); and Boston (256.0). Regions that were
below the United States average included
Wichita, Kansas (142.9); Charlotte, North
Carolina (149.0); Memphis, Tennessee (150.4);
Columbus, Ohio (153.6); Fort Worth, Texas
(154.4); Birmingham, Alabama (154.9); and
Lexington, Kentucky (155.5).
Figure 5.1. Physicians Allocated to Hospital ReferralRegions (1993)The number of physicians in active practice per hundredthousand residents, after adjusting for differences in age and sexof the local population, ranged from fewer than 100 to morethan 300. Each point represents one of the 306 hospital referralregions in the United States.

83
San Francisco Washington-Baltimore New YorkDetroitChicago
Map 5.1. The Physician Workforce Active in Patient Care
In 1993, there were higher numbers of physicians per hundred thousand
residents on the East and West Coasts, parts of the Mountain States, and in
the Pacific Northwest. Some regions with very high supplies of physicians
were contiguous with areas that had much lower supplies, as in Kansas,
Nebraska, and Louisiana.
Physiciansper 100,000 Residentsby Hospital Referral Region (1993)
200.3 to 317.2 (61 HRRs)178.4 to <200.3 (61)159.2 to <178.4 (61)145.7 to <159.2 (61)92.5 to <145.7 (62)
Not Populated
THE NATION'S PHYSICIAN WORKFORCE

THE DARTMOUTH ATLAS OF HEALTH CARE84
Physicians in Primary Care
20
30
40
50
60
70
80
90
100
110
120
Prim
ary
Care
Phy
sicia
ns p
er 1
00,0
00 R
esid
ents
in H
RRs
The number of active physicians in primary care practice increased by 62% between
1970 and 1993, from 101,251 to 164,146. The physician-to-population ratio in-
creased by 36%, from 48.7 to 66.0 primary care physicians per hundred thousand
residents of the United States. Among hospital referral regions, the supply of phy-
sicians clinically active in primary care in 1993 varied from 35.4 per hundred
thousand residents in Harlingen, Texas, to 116.6 in San Francisco.
Among the hospital referral regions with the highest number of primary care
physicians per hundred thousand residents were White Plains, New York (93.7);
East Long Island, New York (92.3); Hackensack, New Jersey (90.0); Washington,
D.C. (89.6); Philadelphia (89.3); Manhattan (88.6); Seattle (88.3); Alameda
County, California (86.8); and Chicago (85.9).
Figure 5.2. Primary Care Physicians Allocated to HospitalReferral Regions (1993)The number of primary care physicians in active practice perhundred thousand residents, after adjusting for differences in ageand sex of the local population, ranged from fewer than 36 tomore than 116. Each point represents one of the 306 hospitalreferral regions in the United States.
Among the regions where the supply of primary
care physicians per hundred thousand residents
was lowest were El Paso, Texas (43.4); Winston-
Salem, North Carolina (49.4); Charlotte, North
Carolina (50.3); Memphis, Tennessee (50.7);
Fort Worth, Texas (53.9); Binghamton, New
York (54.9); San Bernardino, California (55.0);
Dallas (56.2); and Houston (56.2).
There were only 24 hospital referral regions in
the United States in 1993 that had fewer pri-
mary care physicians per hundred thousand
population than the 1970 national average.

85
San Francisco Washington-Baltimore New YorkDetroitChicago
Primary Care Physiciansper 100,000 Residentsby Hospital Referral Region (1993)
70.6 to 116.6 (62 HRRs)62.9 to <70.6 (62)57.4 to <62.9 (58)53.7 to <57.4 (58)35.4 to <53.7 (66)Not Populated
Map 5.2. Physicians in Primary Care
In 1993, the numbers of primary care physicians per hundred thousand
residents were greatest in the Northeast, on the West Coast, and in the West.
THE NATION'S PHYSICIAN WORKFORCE

THE DARTMOUTH ATLAS OF HEALTH CARE86
50
70
90
110
130
150
170
190
210
Spec
ialis
ts p
er 1
00,0
00 R
esid
ents
in H
RRs
As the nation’s medical schools produced more graduates, and foreign medical
graduates were attracted to the United States in increasing numbers, the Medicare
program provided the financing that made it possible for virtually all young
physicians to become qualified in the specialty of their choice. The result was an
increase in the number and proportion of physicians who practice specialty
medicine and surgery. In 1970 there were 130,784 clinically active physicians who
were identified as specialists; by 1993 the number had increased by a factor of 2.3,
to 302,511. The population ratio also doubled, from 62.9 to 121.7 specialists per
hundred thousand residents of the United States.
Among the areas with the highest numbers of specialists per hundred thousand residents
were White Plains, New York (208.6); Washington, D.C. (198.9); San Francisco
(196.8); Manhattan (175.6); Hackensack, New Jersey (174.3); and East Long Island,
Specialist Physicians
New York (171.0). The per capita numbers of
specialists serving the populations of White Plains
and Washington were about 60% higher than the
national average.
Although some areas were far below the 1993
national average supply of specialists, only one
hospital referral region in the country –
McAllen, Texas (56.3) – had fewer specialists
per capita in 1993 than the national average in
1970. Wichita, Kansas (80.2); Springfield, Illi-
nois (85.7); Des Moines, Iowa (87.8); Cedar
Rapids, Iowa (87.8); and Dayton, Ohio (89.8)
were among the hospital referral regions with
fewer than 100 specialists per hundred thou-
sand population.
Figure 5.3. Specialists Allocated to Hospital ReferralRegions (1993)The number of specialist physicians in active practice per hundredthousand residents, after adjusting for differences in age and sexof the local population, ranged from about 56 to more than 200.Each point represents one of the 306 hospital referral regions inthe United States.

87
San Francisco Washington-Baltimore New YorkDetroitChicago
Specialist Physiciansper 100,000 Residentsby Hospital Referral Region (1993)
128.7 to 208.6 (63 HRRs)111.9 to <128.7 (59)100.2 to <111.9 (60)90.8 to <100.2 (60)56.3 to < 90.8 (64)
Not Populated
Map 5.3. Specialist Physicians
In 1993, the numbers of specialists per hundred thousand residents were
highest on the East and West Coasts and lowest in the South and parts of
the Midwest. Areas with higher than average supplies of specialists also
included the Mountain States and parts of Texas.
THE NATION'S PHYSICIAN WORKFORCE

THE DARTMOUTH ATLAS OF HEALTH CARE88
The 50/50 Rule
Some health workforce analysts believe that the national goal should be a physician
workforce that is equally balanced between specialists and primary care physicians.
One argument for the “50/50 rule” is that it reflects the balance between specialists
and primary physicians in other industrialized nations, such as Canada, and is simi-
lar to the balance in some staff-model health maintenance organizations.
How far is the nation from achieving the goal of a 50/50 distribution of specialists
and generalists? In 1970, 44% of practicing physicians were in primary care. Al-
though the total number of primary care physicians in active practice increased by
62% between 1970 and 1993, the total number of specialists increased even more.
By 1993, only 35% of clinically active physicians in the United States were in pri-
mary care, and the proportion of active physicians who were in primary care ranged
from 27.5% in New Orleans to 46.6% in Grand Forks, North Dakota.
Among regions with high percentages of generalists were Wichita, Kansas (43.6%):
Minneapolis (41.3%); Tulsa, Oklahoma (39.4%); Lexington, Kentucky (39.2%);
Spokane, Washington (39.2%); and Dayton, Ohio (38.8). In other hospital referral
regions, less than one-third of the physician workforce was in generalist practice in
1993; among them were New Orleans (27.5%); White Plains, New York (31.0%);
Washington, D.C. (31.1%); Salt Lake City (31.3%); Durham, North Carolina
(31.5%); and San Antonio (31.6%).
The distribution of physicians between primary care and specialty care tells only
part of the story. Some hospital referral regions had per capita supplies of both
specialists and generalists in 1993 that were relatively low, and some areas had
relatively high supplies of both. Simply raising the number or proportion of
physicians in primary care in local markets does not address the question of
whether the overall supply of primary care physicians in the community is high,
low, or in between.
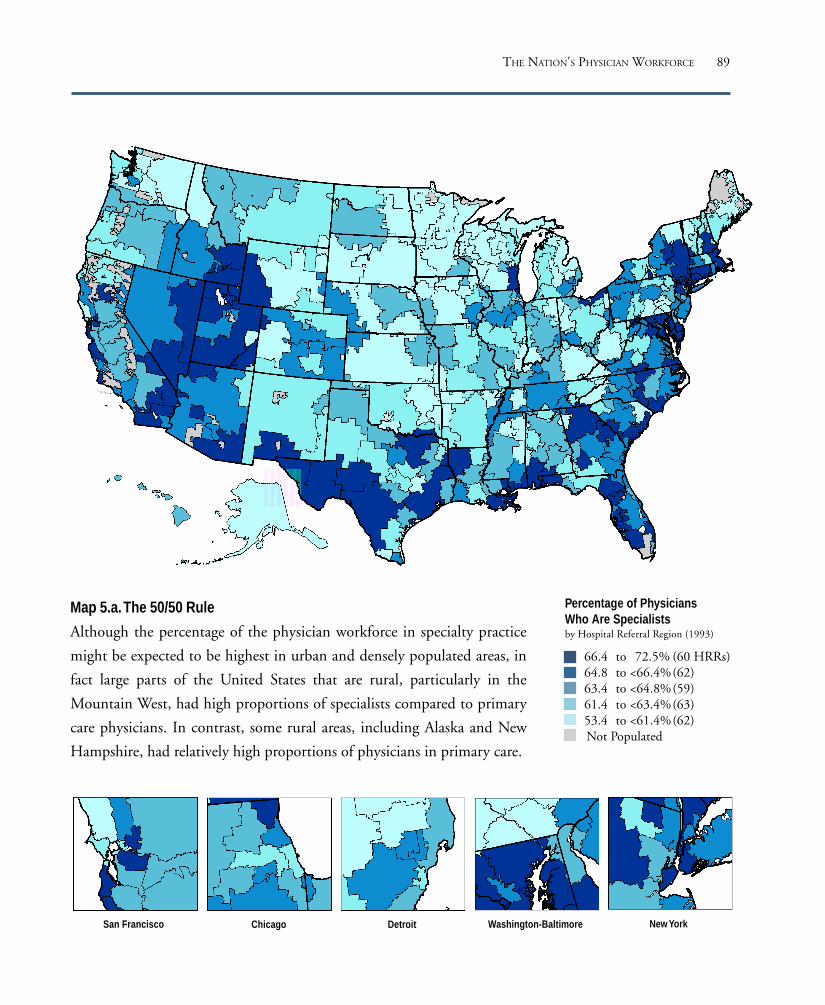
89
San Francisco Washington-Baltimore New YorkDetroitChicago
Percentage of PhysiciansWho Are Specialistsby Hospital Referral Region (1993)
66.4 to 72.5% (60 HRRs)64.8 to <66.4%(62)63.4 to <64.8%(59)61.4 to <63.4%(63)53.4 to <61.4%(62)Not Populated
Map 5.a. The 50/50 Rule
Although the percentage of the physician workforce in specialty practice
might be expected to be highest in urban and densely populated areas, in
fact large parts of the United States that are rural, particularly in the
Mountain West, had high proportions of specialists compared to primary
care physicians. In contrast, some rural areas, including Alaska and New
Hampshire, had relatively high proportions of physicians in primary care.
THE NATION'S PHYSICIAN WORKFORCE

THE DARTMOUTH ATLAS OF HEALTH CARE90
For example, Wichita, Kansas, had a mix of specialists and primary care physicians
in 1993 that was close to the proposed 50/50 goal. Wichita’s supply of primary care
physicians per hundred thousand residents (62.0) was close to the national average,
but the city’s supplies of specialists per hundred thousand residents (80.2) and of all
physicians (142.9) were in the lowest fifth of all hospital referral regions. In contrast,
although the physician workforce in White Plains, New York, had only about 31%
generalists, the supply of generalists per hundred thousand residents in White Plains
(93.7) was about 51% higher than the supply in Wichita. The proportion of gen-
eralists in White Plains was lower than in Wichita, but the per capita numbers of
primary care physicians available to treat the local population were higher.
A comparison between Minneapolis and Dayton, Ohio, provides another example
of the importance of examining the supply of physicians per hundred thousand resi-
dents instead of the proportion of generalists within an area. The proportion of the
physician workforce in generalist practice in Minneapolis (41.3%) in 1993 was close
to that in Dayton (38.8%), but the supply of generalist physicians per hundred
thousand residents was 25% higher in Minneapolis (70.9) than in Dayton (56.9).

91
The marked variation in the per capita supply of phy-
sicians across regions raises the question of whether
spending for physician services is higher in areas with
a greater physician supply. We examined correlations
between Medicare spending for medical and surgical
services and the supply of primary and specialty phy-
sicians.
There is a significant relationship between the special-
ist physician supply per hundred thousand residents
and Medicare spending on physicians’ services. As the
supply of specialist physicians increases by 100 per
hundred thousand population (e.g., from 150 to 250),
Medicare spending could be predicted to increase by
$136 per enrollee (R2 = .15).
By contrast, the association between the capacity of
the primary care physician workforce and Medicare
reimbursements for medical and surgical services
shows virtually no relationship between costs and re-
imbursements (R2=.01).
Figure 5.b. The Association Between thePrimary Care Physician Workforce andPrice Adjusted Medicare Medical andSurgical Reimbursements (1993)There was virtually no association between thecapacity of the primary care physicianworkforce and Medicare reimbursements formedical and surgical services.
Figure 5.a. The Association Between theSpecialty Physician Workforce and PriceAdjusted Medicare Medical and SurgicalReimbursements (1993)There was a significant but modestrelationship between total physician supply percapita and Medicare spending on physicians’services. As the physician supply increases,Medicare spending could also be predicted toincrease.
1,1001,000
900800700600500400300200
Specialists per 100,000 Residents in HRRs
Price
Adj
uste
d M
edica
l and
Surg
ical
Reim
burs
emen
tspe
r Enr
olle
ein
HRR
s (d
olla
rs)
50 100 150 200 250
1,1001,000
900800700600500400300200
Primary Care Physiciansper 100,000 Residents in HRRs
Price
Adj
uste
d M
edica
l and
Surg
ical
Reim
burs
emen
tspe
rEn
rolle
e in
HRR
s (d
olla
rs)
25 50 75 100 125
THE NATION'S PHYSICIAN WORKFORCE
The Association Between the Primary Care and Specialist PhysicianWorkforces and Medicare Reimbursements for Physicians’ Services

THE DARTMOUTH ATLAS OF HEALTH CARE92
Anesthesiologists
0
5
10
15
20
25
Anes
thes
iolo
gist
s pe
r 100
,000
Res
iden
ts in
HRR
s
Between 1970 and 1993, the number of clinically active anesthesiologists rose more
than 170%, from 8,942 to 24,469. The number of anesthesiologists per hundred
thousand residents rose from 4.3 to 9.8, a factor of more than 2.25.
Although Hackensack, New Jersey, with 16.0 per hundred thousand population,
was among the hospital referral regions with the highest ratio of anesthesiologists,
there was a clear pattern of high anesthesiologist supply in the Mountain States and
the West. Seattle (14.2), Salt Lake City (13.6), and Orange County, California
(13.0), were typical of this trend.
Figure 5.4. Anesthesiologists Allocated to Hospital ReferralRegions (1993)The number of anesthesiologists in active practice per hundredthousand residents, after adjusting for differences in age and sex ofthe local population, ranged from fewer than 4 to more than 20.Each point represents one of the 306 hospital referral regions in theUnited States.
Among the regions with the lowest numbers of
anesthesiologists per hundred thousand resi-
dents in 1993 were Charlotte, North Carolina
(6.4); Wichita, Kansas (6.7); Omaha, Nebraska
(7.3); and Birmingham, Alabama (7.5). Others
that were below the national average were Ann
Arbor, Michigan (8.0); Nashville, Tennessee
(8.4); and Knoxville, Tennessee (8.0).

93
San Francisco Washington-Baltimore New YorkDetroitChicago
Anesthesiologistsper 100,000 Residentsby Hospital Referral Region (1993)
11.05 to 20.43 (60 HRRs)9.61 to <11.05 (61)8.48 to < 9.61 (61)7.23 to < 8.48 (62)3.94 to < 7.23 (62)
Not Populated
Map 5.4. Anesthesiologists
In 1993, the numbers of anesthesiologists per hundred thousand residents
were high in the West, in parts of Texas, and on the West Coast;
metropolitan areas also tended to have high supplies.
THE NATION'S PHYSICIAN WORKFORCE

THE DARTMOUTH ATLAS OF HEALTH CARE94
Cardiologists
0
2
4
6
8
10
12
14
Card
iolo
gist
s pe
r 100
,000
Res
iden
ts in
HRR
s
In 1970, there were 4,616 clinically active cardiologists practicing in the United
States, or 2.2 for every hundred thousand residents. By 1993, the number of cardi-
ologists had risen to 14,125, or 5.7 per hundred thousand residents. The actual
number of cardiologists rose by a factor of 3.1, and the number per hundred thou-
sand residents rose by a factor of 2.6.
Hospital referral regions with very high supplies of cardiologists in 1993 were
heavily concentrated on the East Coast. Among the regions with the highest num-
bers of cardiologists per hundred thousand residents were Miami (10.1);
Philadelphia (9.8); Hackensack, New Jersey (9.3); Manhattan (9.3); Washington,
D.C. (9.2); and White Plains, New York (8.4).
Areas below the national average included
Wichita, Kansas (3.5); Little Rock, Arkansas
(3.9); Fort Worth, Texas (4.0); Charlotte, North
Carolina (4.0); and Nashville, Tennessee (4.3).
Figure 5.5. Cardiologists Allocated to Hospital ReferralRegions (1993)The number of cardiologists in active practice per hundredthousand residents, after adjusting for differences in age and sex ofthe local population, ranged from fewer than 2 to 12. Each pointrepresents one of the 306 hospital referral regions in the UnitedStates.

95
San Francisco Washington-Baltimore New YorkDetroitChicago
Cardiologistsper 100,000 Residentsby Hospital Referral Region (1993)
6.11 to 12.01 (62 HRRs)4.80 to < 6.11 (61)4.08 to < 4.80 (58)3.29 to < 4.08 (62)1.68 to < 3.29 (63)Not Populated
Map 5.5. Cardiologists
In 1993, the numbers of cardiologists per hundred thousand residents were
generally higher on the East and West Coasts, and lower in the Midwest
and parts of the South.
THE NATION'S PHYSICIAN WORKFORCE

THE DARTMOUTH ATLAS OF HEALTH CARE96
4
6
8
10
12
14
16
Gen
eral
Sur
geon
s pe
r 100
,000
Res
iden
ts in
HRR
s
General Surgeons
Between 1970 and 1993, the number of clinically active general surgeons in the
United States rose from 22,204 to 24,060, an increase of only 8%, the smallest in-
crease among specialists. The number of general surgeons per hundred thousand
residents actually declined by about 10%, from 10.7 in 1970 to 9.7 in 1993.
Hospital referral regions with very high numbers of general surgeons per hundred
thousand residents in 1993 included White Plains, New York (14.4); Baltimore
(13.5); Buffalo, New York (12.9); Providence, Rhode Island (12.7); Washington,
D.C. (12.6); and Hackensack, New Jersey (12.4). Manhattan (12.1) and East Long
Island, New York (12.6), also had higher than average supplies of general surgeons.
Among the regions with numbers of general
surgeons per hundred thousand residents below
the national average in 1993 were Kansas City,
Missouri (8.1); Orlando, Florida (8.2); Colum-
bus, Ohio (8.2); Indianapolis (8.3); Tulsa,
Oklahoma (8.4); San Bernardino, California
(8.4); and Arlington, Virginia (8.5).
Figure 5.6. General Surgeons Allocated to Hospital ReferralRegions (1993)The number of general surgeons in active practice per hundredthousand residents, after adjusting for differences in age and sex ofthe local population, ranged from 5.3 to 16. Each point representsone of the 306 hospital referral regions in the United States.

97
San Francisco Washington-Baltimore New YorkDetroitChicago
General Surgeonsper 100,000 Residentsby Hospital Referral Region (1993)
11.00 to 15.98 (61 HRRs)9.73 to <11.00 (61)8.87 to < 9.73 (60)8.17 to < 8.87 (61)5.26 to < 8.17 (63)Not Populated
Map 5.6. General Surgeons
In 1993, the numbers of general surgeons per hundred thousand residents
were highest on the East Coast and in the West, and lower throughout the
Midwest.
THE NATION'S PHYSICIAN WORKFORCE

THE DARTMOUTH ATLAS OF HEALTH CARE98
Obstetrician/Gynecologists
0
5
10
15
20
25
30
Obs
tetri
cian/
Gyn
ecol
ogist
s pe
r 100
,000
Res
iden
ts in
HRR
s
In 1970, there were 15,460 obstetrician/gynecologists in active clinical practice in
the United States; by 1993, there were 30,042, a 94% increase. The rate per
hundred thousand residents increased by 62%, from 7.4 to 12.1.
Hospital referral regions with numbers of obstetrician/gynecologists per hundred
thousand residents substantially above the national average in 1993 included White
Plains, New York (19.7); East Long Island, New York (18.7); Fort Lauderdale,
Florida (18.8); Hackensack, New Jersey (18.0); Baltimore (17.7); Washington, D.C.
(17.5); and Camden, New Jersey (16.0).
Hospital referral regions with smaller populations were more heavily represented in
the group of areas with low per capita supplies of obstetrician/gynecologists; among
the lowest were Mason City, Iowa (6.8); La
Crosse, Wisconsin (6.7); Grand Forks, North
Dakota (6.5); Fort Wayne, Indiana (6.4); and
Cedar Rapids, Iowa (6.1).
Few regions with populations of over one mil-
lion residents had supplies below the national
average. Among those large hospital referral re-
gions which had relatively low numbers of
obstetrician/gynecologists per hundred thou-
sand residents in 1993 were Madison,
Wisconsin (7.5); Wichita, Kansas (7.8); Des
Moines, Iowa (7.9); Omaha, Nebraska (8.7);
Indianapolis (9.2); Lexington, Kentucky (9.4);
Fresno, California (9.9); and Spokane, Wash-
ington (10.1).
Figure 5.7. Obstetrician/Gynecologists Allocated to HospitalReferral Regions (1993)The number of obstetrician/gynecologists in active practice perhundred thousand residents, after adjusting for differences in ageand sex of the local population, ranged from 5.4 to more than 25.Each point represents one of the 306 hospital referral regions in theUnited States.
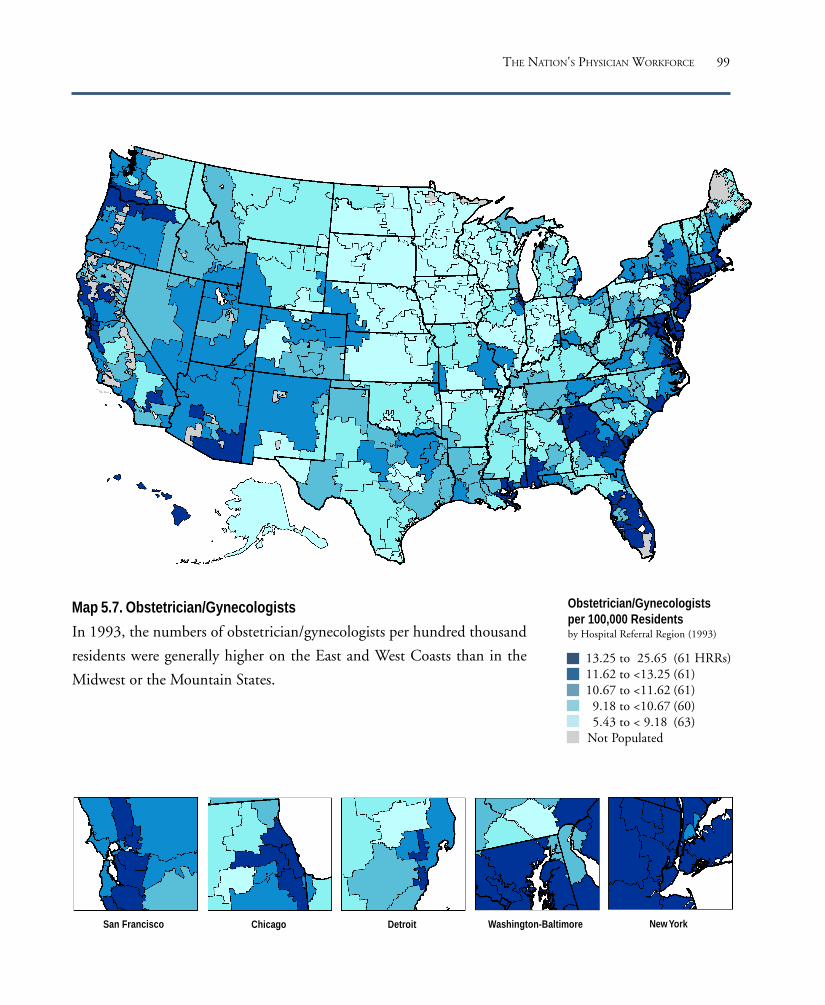
99
San Francisco Washington-Baltimore New YorkDetroitChicago
Obstetrician/Gynecologistsper 100,000 Residentsby Hospital Referral Region (1993)
13.25 to 25.65 (61 HRRs)11.62 to <13.25 (61)10.67 to <11.62 (61)
9.18 to <10.67 (60)5.43 to < 9.18 (63)
Not Populated
Map 5.7. Obstetrician/Gynecologists
In 1993, the numbers of obstetrician/gynecologists per hundred thousand
residents were generally higher on the East and West Coasts than in the
Midwest or the Mountain States.
THE NATION'S PHYSICIAN WORKFORCE

THE DARTMOUTH ATLAS OF HEALTH CARE100
Ophthalmologists
2
3
4
5
6
7
8
9
10
11
12
Oph
thal
mol
ogist
s pe
r 100
,000
Res
iden
ts in
HRR
s
Between 1970 and 1993, the number of clinically active ophthalmologists practic-
ing in the United States rose from 8,273 to 14,659, a 77% increase. The supply of
ophthalmologists grew from 4.0 to 5.9 per hundred thousand residents of the coun-
try, an increase of 48%.
Among the hospital referral regions with high numbers of ophthalmologists per
hundred thousand residents were White Plains, New York (10.9); Manhattan (8.5);
and East Long Island, New York (8.7). Also well above the national average were
Washington, D.C. (9.6); Hackensack, New Jersey (8.8); Miami (7.9); Baltimore
(7.7); Honolulu (7.6); Denver (7.6); and New Haven, Connecticut (7.5).
The ophthalmologist workforces serving
Wichita, Kansas (3.5); Charleston, West Virginia
(4.0); Des Moines, Iowa (4.1); Winston-Salem,
North Carolina (4.1); Knoxville, Tennessee (4.2);
Springfield, Illinois (4.2); and Harrisburg,
Pennsylvania (4.7), were well below the national
average.
Figure 5.8. Ophthalmologists Allocated to Hospital ReferralRegions (1993)The number of ophthalmologists in active practice per hundredthousand residents, after adjusting for differences in age and sex ofthe local population, ranged from fewer than 3 to more than 11.Each point represents one of the 306 hospital referral regions in theUnited States.

101
San Francisco Washington-Baltimore New YorkDetroitChicago
Ophthalmologistsper 100,000 Residentsby Hospital Referral Region (1993)
6.61 to 11.06 (62 HRRs)5.58 to < 6.61 (58)4.95 to < 5.58 (62)4.33 to < 4.95 (61)2.65 to < 4.33 (63) Not Populated
Map 5.8. Ophthalmologists
In 1993, the supply of ophthalmologists was higher on the East and West
Coasts and in the West. The Midwest and the Ohio Valley generally had
lower numbers of ophthalmologists per hundred thousand residents.
THE NATION'S PHYSICIAN WORKFORCE
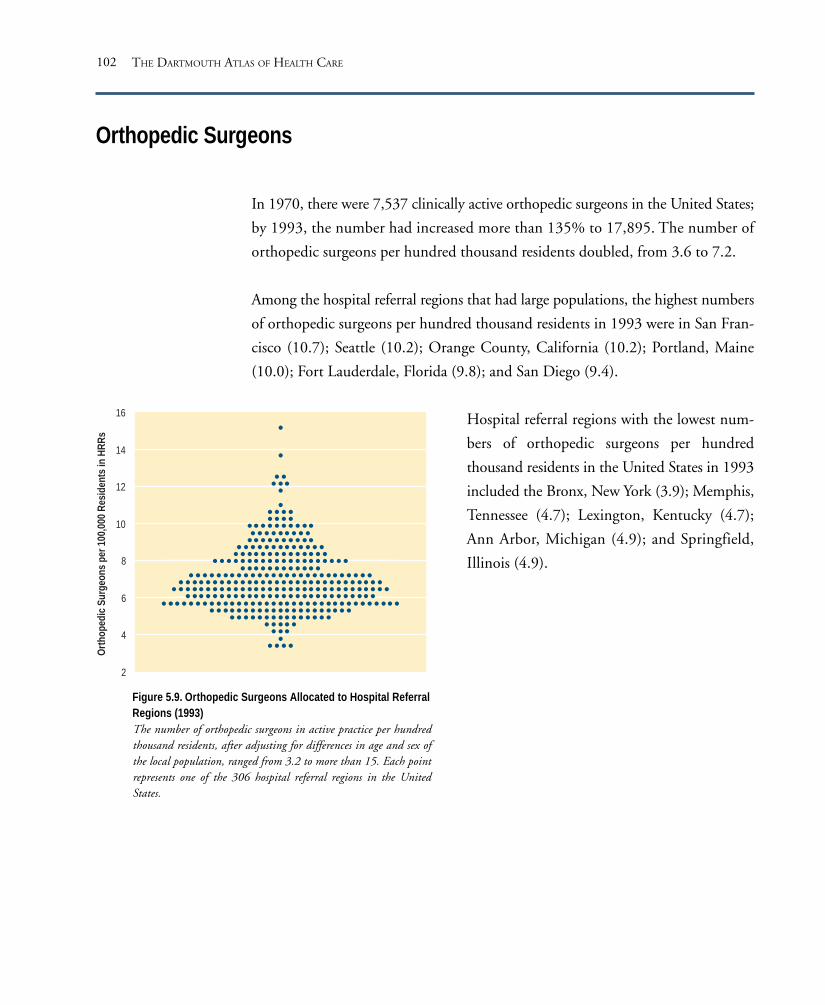
THE DARTMOUTH ATLAS OF HEALTH CARE102
Orthopedic Surgeons
2
4
6
8
10
12
14
16
Orth
oped
ic Su
rgeo
ns p
er 1
00,0
00 R
esid
ents
in H
RRs
In 1970, there were 7,537 clinically active orthopedic surgeons in the United States;
by 1993, the number had increased more than 135% to 17,895. The number of
orthopedic surgeons per hundred thousand residents doubled, from 3.6 to 7.2.
Among the hospital referral regions that had large populations, the highest numbers
of orthopedic surgeons per hundred thousand residents in 1993 were in San Fran-
cisco (10.7); Seattle (10.2); Orange County, California (10.2); Portland, Maine
(10.0); Fort Lauderdale, Florida (9.8); and San Diego (9.4).
Hospital referral regions with the lowest num-
bers of orthopedic surgeons per hundred
thousand residents in the United States in 1993
included the Bronx, New York (3.9); Memphis,
Tennessee (4.7); Lexington, Kentucky (4.7);
Ann Arbor, Michigan (4.9); and Springfield,
Illinois (4.9).
Figure 5.9. Orthopedic Surgeons Allocated to Hospital ReferralRegions (1993)The number of orthopedic surgeons in active practice per hundredthousand residents, after adjusting for differences in age and sex ofthe local population, ranged from 3.2 to more than 15. Each pointrepresents one of the 306 hospital referral regions in the UnitedStates.
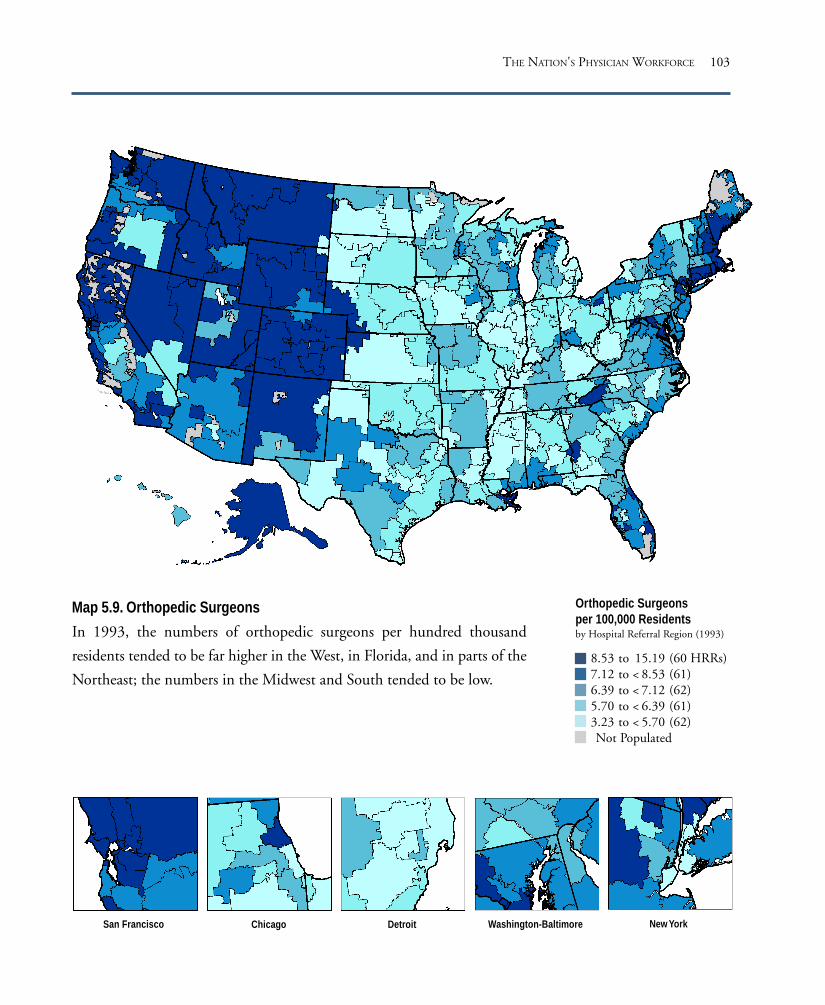
103
San Francisco Washington-Baltimore New YorkDetroitChicago
Orthopedic Surgeonsper 100,000 Residentsby Hospital Referral Region (1993)
8.53 to 15.19 (60 HRRs)7.12 to < 8.53 (61)6.39 to < 7.12 (62)5.70 to < 6.39 (61)3.23 to < 5.70 (62)Not Populated
Map 5.9. Orthopedic Surgeons
In 1993, the numbers of orthopedic surgeons per hundred thousand
residents tended to be far higher in the West, in Florida, and in parts of the
Northeast; the numbers in the Midwest and South tended to be low.
THE NATION'S PHYSICIAN WORKFORCE

THE DARTMOUTH ATLAS OF HEALTH CARE104
Psychiatrists
0
5
10
15
20
25
30
35
40
45
Psyc
hiat
rists
per 1
00,0
00 R
esid
ents
in H
RRs
The number of clinically active psychiatrists in the United States almost doubled be-
tween 1970 and 1993, from 16,450 to 32,254. The number per hundred thousand
residents increased by 64%, from 7.9 to 13.0.
More than any other specialty, the number of psychiatrists per hundred thousand
population tended to be highest in urban areas. Among the regions with the highest
numbers of psychiatrists per hundred thousand residents in 1993 were White
Plains, New York (43.9); San Francisco (38.4); Manhattan (35.5); East Long Island,
New York (25.8); the Bronx, New York (24.5); Boston (30.5); Washington, D.C.
(29.5); New Haven, Connecticut (25.2); Philadelphia (24.7); Hackensack, New
Jersey (24.1); Hartford, Connecticut (22.3); and Lebanon, New Hampshire (22.1).
Most hospital referral regions that had very low
numbers of psychiatrists per hundred thousand
residents had relatively small populations (well
under one million). Among these were Oxford,
Mississippi (2.8); Fort Smith, Arkansas (3.0);
Lake Charles, Louisiana (3.3); Paducah, Ken-
tucky (3.4); and McAllen, Texas (3.4).
Larger areas with relatively low numbers of
psychiatrists in 1993, compared to the national
average, were Des Moines, Iowa (5.9); Bir-
mingham, Alabama (6.4); Fort Worth, Texas
(6.7); Wichita, Kansas (6.8); Tulsa, Oklahoma
(7.0); Memphis, Tennessee (7.1); and El Paso,
Texas (7.1).
Figure 5.10. Psychiatrists Allocated to Hospital ReferralRegions (1993)The number of psychiatrists in active practice per hundredthousand residents, after adjusting for differences in age and sex ofthe local population, ranged from 2.5 to almost 44. Each pointrepresents one of the 306 hospital referral regions in the UnitedStates.
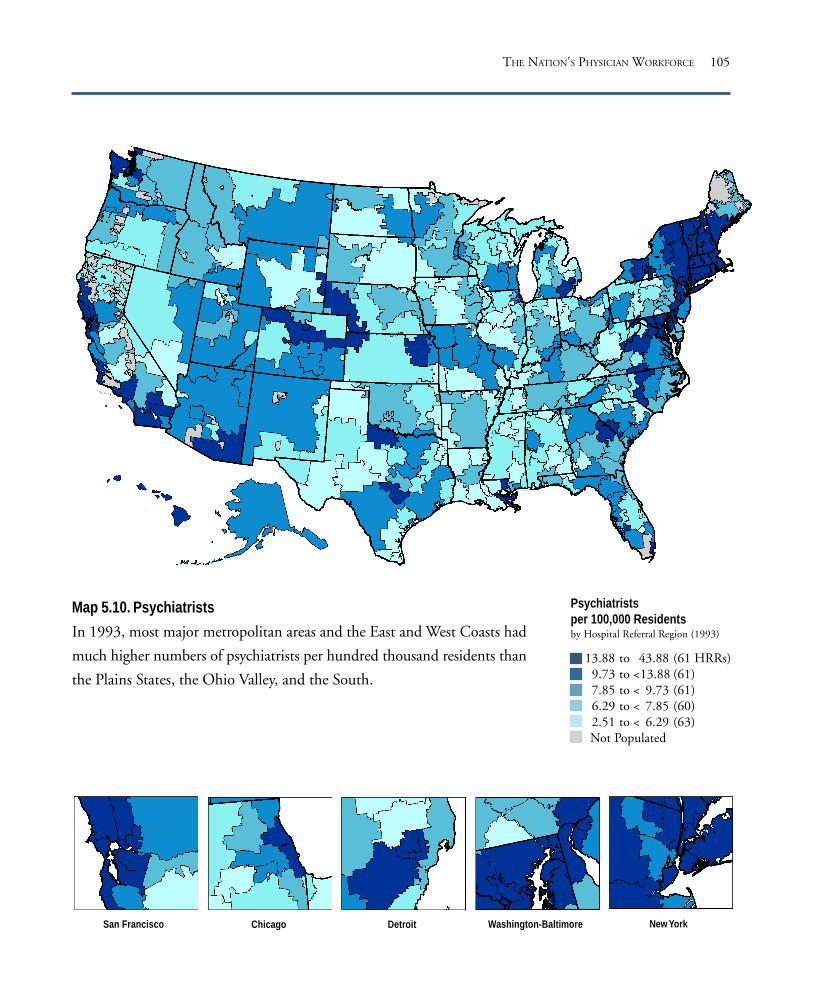
105
San Francisco Washington-Baltimore New YorkDetroitChicago
Psychiatristsper 100,000 Residentsby Hospital Referral Region (1993)
13.88 to 43.88 (61 HRRs)9.73 to <13.88 (61)7.85 to < 9.73 (61)6.29 to < 7.85 (60)2.51 to < 6.29 (63)Not Populated
Map 5.10. Psychiatrists
In 1993, most major metropolitan areas and the East and West Coasts had
much higher numbers of psychiatrists per hundred thousand residents than
the Plains States, the Ohio Valley, and the South.
THE NATION'S PHYSICIAN WORKFORCE

THE DARTMOUTH ATLAS OF HEALTH CARE106
Radiologists
2
4
6
8
10
12
14
16
Radi
olog
ists
per 1
00,0
00 R
esid
ents
in H
RRs
There were 22,413 clinically active radiologists practicing in the United States in
1993, up 142% from the 1970 level of 9,245. The number of radiologists per hun-
dred thousand residents more than doubled, rising from 4.4 to 9.0.
The number of radiologists per hundred thousand residents was about 30% higher
than the national average in Philadelphia (13.6); White Plains, New York (13.4);
Boston (13.0); Washington, D.C. (12.5); and Durham, North Carolina (12.1).
Other areas with high rates in 1993 were Cleveland (12.0), Pittsburgh (11.8), Bal-
timore (11.3), and Seattle (11.0).
Hospital referral regions where the allocated
workforce was less than the national average in-
cluded El Paso, Texas (5.0); Austin, Texas (6.1);
Columbus, Ohio (6.7); Grand Rapids, Michi-
gan (6.9); Fort Worth, Texas (7.2); and San
Bernardino, California (7.2).
Figure 5.11. Radiologists Allocated to Hospital ReferralRegions (1993)The number of radiologists in active practice per hundred thousandresidents, after adjusting for differences in age and sex of the localpopulation, ranged from 3.3 to 15.7. Each point represents one ofthe 306 hospital referral regions in the United States.
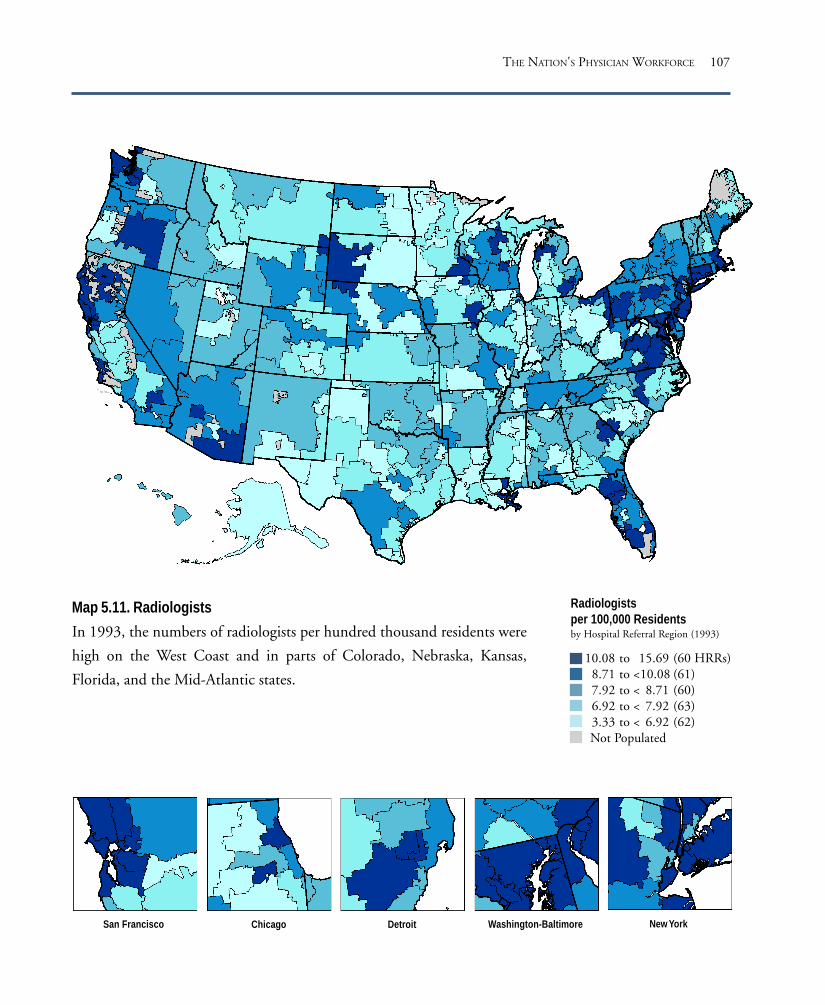
107
San Francisco Washington-Baltimore New YorkDetroitChicago
Radiologistsper 100,000 Residentsby Hospital Referral Region (1993)
10.08 to 15.69 (60 HRRs)8.71 to <10.08 (61)7.92 to < 8.71 (60)6.92 to < 7.92 (63)3.33 to < 6.92 (62)Not Populated
Map 5.11. Radiologists
In 1993, the numbers of radiologists per hundred thousand residents were
high on the West Coast and in parts of Colorado, Nebraska, Kansas,
Florida, and the Mid-Atlantic states.
THE NATION'S PHYSICIAN WORKFORCE

THE DARTMOUTH ATLAS OF HEALTH CARE108
Urologists
5.5
5.0
4.5
4.0
3.5
3.0
2.5
2.0
1.5
1.0
Urol
ogist
s pe
r 100
,000
Res
iden
ts in
HRR
s
The number of urologists in active clinical practice in the United States grew 74%
from 4,745 in 1970 to 8,246 in 1993 and the number of urologists per hundred
thousand residents increased 46%, from 2.3 to 3.3.
Among the hospital referral regions with the highest numbers of urologists per hun-
dred thousand residents were Washington, D.C. (5.0); White Plains, New York
(4.9); Hackensack, New Jersey (4.5); Morristown, New Jersey (4.3); Newark, New
Jersey (4.2); New Orleans (4.5); Miami (4.2); Fort Lauderdale, Florida (4.2); Seattle
(4.1); Manhattan (4.1); and Atlanta (4.0).
The workforces serving hospital referral regions in the
Midwest tended to be relatively small; among the re-
gions with low allocations per hundred thousand
residents were Madison, Wisconsin (2.2); Fort
Worth, Texas (2.3); Omaha, Nebraska (2.4); Detroit
(2.5); and Wichita, Kansas (2.6). Portland, Maine
(2.6); and Lebanon, New Hampshire (2.7), were
among the East Coast hospital referral regions with
relatively low supplies of urologists per hundred thou-
sand residents.
Figure 5.12. Urologists Allocated to Hospital ReferralRegions (1993)The number of urologists in active practice per hundredthousand residents, after adjusting for differences in ageand sex of the local population, ranged from 1.6 to 5.4.Each point represents one of the 306 hospital referralregions in the United States.

109
San Francisco Washington-Baltimore New YorkDetroitChicago
Urologistsper 100,000 Residentsby Hospital Referral Region (1993)
3.72 to 5.44 (63 HRRs)3.34 to <3.72 (60)3.02 to <3.34 (58)2.75 to <3.02 (59)1.61 to <2.75 (66)
Not Populated
Map 5.12. Urologists
In 1993, the numbers of urologists per hundred thousand residents were
high in some hospital referral regions in the Northeast and Mid-Atlantic
states, in the Southeast, and along the West Coast. Most of the Midwest
had relatively low supplies of urologists.
THE NATION'S PHYSICIAN WORKFORCE

THE DARTMOUTH ATLAS OF HEALTH CARE110
Physicians in Residency Training Programs
In 1970, there were 52,233 physicians in residency training programs throughout
the United States; by 1993, the numbers had increased 86%, to 97,047. The rate
increased by 55%, from 25.1 to 39.0 per hundred thousand population. The dis-
tribution of resident physicians among hospital referral regions in 1993 was very
uneven, ranging from 6.6 per hundred thousand residents in Billings, Montana,
to 113.0 in Rochester, Minnesota.
Among the regions with the highest numbers of physicians in residency training
programs per hundred thousand population were Rochester, Minnesota (113.0);
Manhattan (111.1); Chicago (98.7); the Bronx, New York (97.6); Durham,
North Carolina (87.4); Ann Arbor, Michigan (78.8); Philadelphia (77.8); Boston
(77.1); New Orleans (76.7); Cleveland (70.8); Washington, D.C. (68.7); San Fran-
cisco (65.3); Detroit (61.4); and New Haven, Connecticut (61.0).
The hospital referral regions with the lowest
numbers of physicians in residency training
programs per hundred thousand population
were those with populations of under one mil-
lion. Larger referral regions that had fewer than
20 physicians in residency training programs
per hundred thousand population in 1993 in-
cluded Spokane, Washington (12.9); Orlando,
Florida (15.0); Knoxville, Tennessee (15.5); Fort
Worth, Texas (18.2); and Charlotte, North
Carolina (18.7).
Figure 5.13. Physicians in Residency Training ProgramsAllocated to Hospital Referral Regions (1993)The number of physicians in residency training programs perhundred thousand residents ranged from 6.6 to 113.0. Each pointrepresents one of the 306 hospital referral regions in the UnitedStates.
120
100
80
60
40
20
0
Resid
ent P
hys
ician
s pe
r 100
,000
Res
iden
ts in
HRR
s
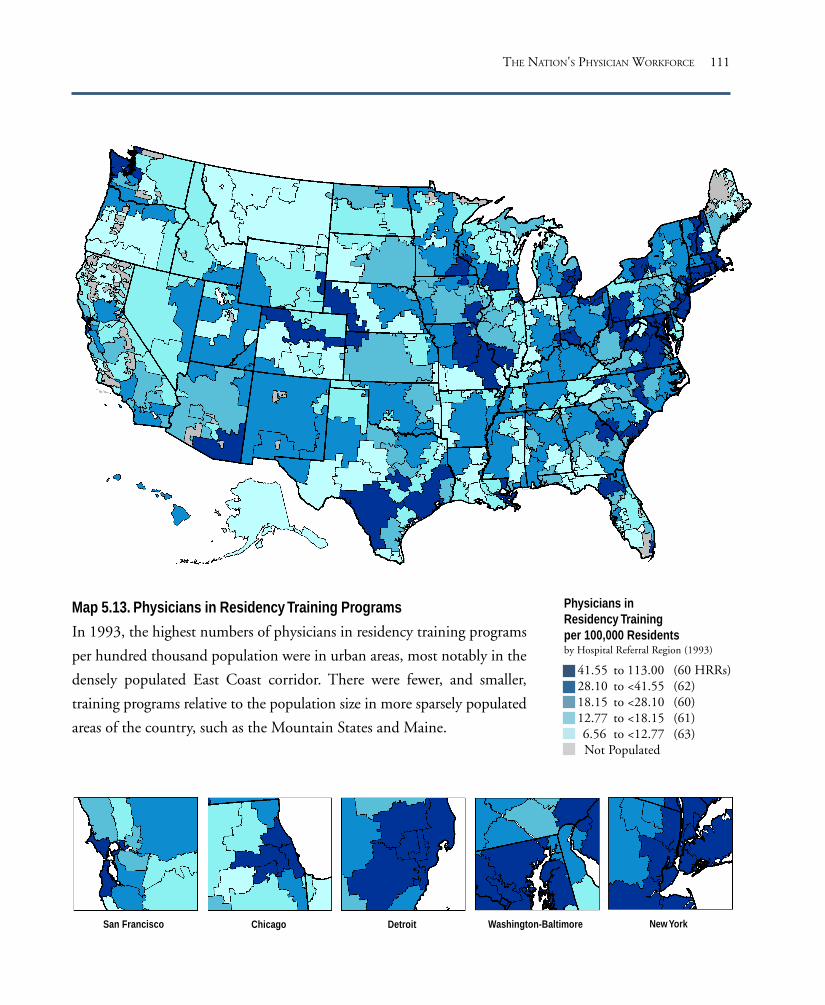
111
San Francisco Washington-Baltimore New YorkDetroitChicago
Physicians inResidency Trainingper 100,000 Residentsby Hospital Referral Region (1993)
41.55 to 113.00 (60 HRRs)28.10 to <41.55 (62)18.15 to <28.10 (60)12.77 to <18.15 (61)6.56 to <12.77 (63)Not Populated
Map 5.13. Physicians in Residency Training Programs
In 1993, the highest numbers of physicians in residency training programs
per hundred thousand population were in urban areas, most notably in the
densely populated East Coast corridor. There were fewer, and smaller,
training programs relative to the population size in more sparsely populated
areas of the country, such as the Mountain States and Maine.
THE NATION'S PHYSICIAN WORKFORCE


The Diagnosis and SurgicalTreatment of CommonMedical Conditions
PART SIX

114 THE DARTMOUTH ATLAS OF HEALTH CARE
Jacob Bigelow, in an 1835 address to the Massachusetts Medical Society, observed
that “A man who falls sick at home or abroad is liable to get heroic treatment, or
nominal treatment, random treatment, or no treatment at all, according to the
hands into which he happens to fall.”
Since Bigelow’s time, doctors and researchers have continued to observe puzzling
variations in rates of common surgical procedures among seemingly similar popu-
lations. In the 1930s, the British pediatrician J. Alison Glover noted that in some
school districts more than half of the children had had tonsillectomies before they
were 18, while in other districts fewer than 10% had had the surgery. Glover traced
the variation to differences in professional opinion among school health officers
about the usefulness of tonsillectomy in preventing illness. Some doctors believed
that in order to avoid hearing loss and learning disability, tonsils should be removed
at the slightest evidence of infection. Others believed that tonsils must serve some
function and were reluctant to remove them unless infection became a serious prob-
lem, which it rarely did.
Although Glover identified disagreement among physicians as the source of varia-
tion, and even undertook outcome studies of children who had had tonsillectomies,
it was not until well after the Second World War that clinical trials of “preventive”
tonsillectomy versus “watchful waiting” (monitoring without surgical intervention)
were undertaken. The results upheld Glover’s conjecture that preventive tonsillec-
tomy was not an effective strategy.
The Problem of Scientific Uncertainty
Failure to evaluate the outcomes of care makes it possible for different theories and
opinions on the risks and benefits of alternative treatments to coexist, unchallenged
by fact. In recent years, greater awareness of practice variations has increased pub-
lic understanding of the need to conduct systematic studies of the outcomes of care.
However, what has been referred to as a double standard of truth in medicine per-
sists. While the Food and Drug Administration assures that new drugs are tested to
The Diagnosis and Surgical Treatment of Common Medical Conditions

115THE DIAGNOSIS AND SURGICAL TREATMENT OF COMMON MEDICAL CONDITIONS
determine that they have clinical efficacy before they are widely marketed, the out-
comes of other treatment options, such as surgical procedures and medical devices
(and drugs used in ways not tested prior to Food and Drug Administration ap-
proval), are not systematically subjected to evaluation. Until clinical research is
applied uniformly to all treatment options, many good medical ideas will remain
unproven and many strategies that do not work will remain in active use. Patients
and physicians will continue to face unnecessary scientific uncertainty about the
risks and benefits of care.
Which Surgical Rate Is Right?
Scientific uncertainty is not a sufficient explanation for practice variations. An
answer to the question “Which rate is right?” depends on knowing who should
decide. Unwanted variations in the use of diagnostic and surgical procedures are
inevitable in clinical environments where the preferences of providers or managed
care companies, rather than those of patients, dominate the choice of treatment.
The problem of unwanted variations in the rates of surgery thus has its origins in
the traditional doctor-patient relationship – in the deep conviction that doctors
know best. Since the time of Hippocrates, this tradition has held that the physician
should make the decision about what treatment to use, based on his or her superior
knowledge of what the patient wants. Since the Second World War, this model has
been challenged, most significantly by the legal doctrine of informed consent, which
demands that patients need to be fully informed about their options before consent-
ing to the recommended treatment.
More recently, the challenge has been to the nature of the doctor-patient relation-
ship itself. For many conditions, the extraordinary success of biomedical science and
technology has created a rich range of diagnostic and therapeutic options. These
options can have very different costs, risks, and benefits. Individual patients have
different attitudes toward risks and different preferences for outcomes. Given the
number of options, it is impossible for providers to accurately intuit how the

116 THE DARTMOUTH ATLAS OF HEALTH CARE
individual patient would choose. To obtain the treatment they want, patients must
evaluate the costs and benefits of treatment for themselves.
To find out which rate is right, patients must be informed about the options and
must be free to choose according to their own preferences. This section of the Atlas
provides a number of examples of practice variations that can only be remedied by
bringing the patient into the clinical decision making process – by reforming the
doctor-patient relationship to incorporate shared decision making.
Underservice
Variations can also reveal the failure of health care plans and providers to provide
benefits that work and that most patients would want if they were informed about
their value. A good example is mammography among women over the age of 50,
which has been shown to reduce premature death from breast cancer. This section
demonstrates significant underservice of mammography throughout the United
States.

117
Chest pain due to blockage of the arteries that feed the heart (angina pectoris) is a
common condition. Many patients with angina have several treatment options,
including coronary artery bypass grafting (open heart surgery) and percutaneous
transluminal coronary angioplasty (balloon angioplasty). Other approaches rely
chiefly on the use of drugs to improve coronary artery flow; still others use strict
dietary control of fat intake.
The pattern of variation in the use of angioplasty and bypass surgery from region
to region provides important evidence about the existence of supplier-induced
demand. First, the wide variation in rates among regions – with neighboring regions
often showing strikingly different rates of intervention – suggests that patients’
choices are not driving the variation; it is highly unlikely that the incidence of
disease or patient preferences vary in such an idiosyncratic way.
Second, although bypass surgery and angioplasty are often alternative ways of
treating the same condition, there is little evidence that one form of invasive
treatment is being substituted for the other; many communities with high rates of
bypass surgery also had high rates of angioplasty.
A third key factor driving the rate of use of invasive procedures is the supply of
diagnostic technology. Coronary angiography is a diagnostic test that is an essential
step in the discovery of coronary artery disease amenable to invasive treatment.
Rates of coronary angiography were closely linked to the decision to undertake
coronary artery bypass surgery or percutaneous transluminal coronary angioplasty.
Medicare enrollees living in communities with higher per capita levels of diagnostic
testing were much more likely to experience invasive treatments for coronary artery
disease than those who lived in regions with relatively low testing rates.
The Diagnosis and Treatment of Coronary Artery Disease
THE DIAGNOSIS AND SURGICAL TREATMENT OF COMMON MEDICAL CONDITIONS

118 THE DARTMOUTH ATLAS OF HEALTH CARE
Coronary artery bypass grafting (CABG) is a surgical procedure in which blood
flow to the heart is rerouted through a substitute blood vessel. For some patients
with angina, clinical trials have shown that CABG can prolong life; but most pa-
tients have forms of coronary artery disease for which the main benefit of treatment
is reduction of pain or improved functional capacity. More than 300,000 CABG
procedures were performed on Medicare enrollees over the age of 65 who had tra-
ditional Medicare coverage (that is, who were not enrolled in risk bearing health
maintenance organizations) during 1992-93. The rates of CABG surgery per thou-
sand Medicare enrollees varied by a factor of more than 4, from 2.1 in the Grand
Junction, Colorado, hospital referral region, to 8.5 in the Joliet, Illinois, region.
Among the large hospital referral regions with the highest rates of CABG per
thousand Medicare enrollees were Birmingham, Alabama (7.7); Memphis,
Tennessee (7.7); Little Rock, Arkansas (7.1); and Dayton, Ohio (6.8). Hospital
referral regions with more than one million residents that had low rates of the
Coronary Artery Bypass Grafting
Figure 6.1. CABG Among Hospital Referral Regions(1992-93)The number of CABG procedures varied from 2.1 to 8.5per thousand Medicare enrollees, after adjusting fordifferences in age, sex, and race of the local population. Eachpoint represents one of the 306 hospital referral regions inthe United States.
procedure included Albuquerque, New Mexico (2.7);
Denver (3.1); Honolulu (3.4); and the Bronx, New
York (3.5).
Lubbock, Texas, had a rate that was more than twice
as high as Albuquerque, New Mexico, although the
regions are contiguous; similarly, the Norfolk and
Arlington hospital referral regions, both in Virginia,
were at opposite ends of the spectrum. Rockford,
Illinois, had a rate that was less than half that for the
residents of nearby Joliet. The rate of bypass surgery in
Saginaw, Michigan, was 60% higher than in Grand
Rapids. The rate in Little Rock, Arkansas, was nearly
70% higher than in neighboring Jackson, Mississippi.
9
8
7
6
5
4
3
2CABG
Pr o
cedu
res
per 1
,000
Med
icare
Enr
olle
es in
HRR
s

119
San Francisco Washington-Baltimore New YorkDetroitChicago
CABG Procedures per 1,000Medicare Enrolleesby Hospital Referral Region(1992-93)
6.07 to 8.50 (62 HRRs)5.40 to <6.07 (62)4.86 to <5.40 (59)4.43 to <4.86 (60)2.06 to <4.43 (63)Not Populated
Map 6.1. Coronary Artery Bypass Grafting
Although rates tended to be lower in the West and Northeast in 1992-93,
there were no strong geographic patterns; hospital referral regions with high
rates were often near those where rates were low.
THE DIAGNOSIS AND SURGICAL TREATMENT OF COMMON MEDICAL CONDITIONS

120 THE DARTMOUTH ATLAS OF HEALTH CARE
Percutaneous transluminal coronary angioplasty (PTCA) is a procedure in which a
catheter with a small balloon attached to it is inserted into the blocked artery; at the
blockage, the balloon is inflated, pushing the fatty deposits against the artery wall.
Angioplasty does not require open heart surgery, but its effects are usually less lasting
than those of bypass grafts, and repeat procedures are required more often. More
than 287,000 PTCA procedures were performed on Medicare enrollees over the age
of 65 who had traditional Medicare coverage (that is, who were not enrolled in risk
bearing health maintenance organizations) during 1992-93. The rate per thousand
Medicare enrollees varied by a factor of 8, from 1.6 in Buffalo, New York, to 12.8
in Stockton, California.
Among the large hospital referral regions with high rates of PTCA per thousand
Medicare enrollees were Milwaukee (8.1); Birmingham, Alabama (7.7); and
Alameda County, California (7.4). Among the regions with the lowest rates of
angioplasty, seven were in New York State. Other low rate regions included Lexington,
Kentucky (2.8) and Albuquerque, New Mexico (2.9).
Percutaneous Transluminal Coronary Angioplasty
Figure 6.2. PTCA Among Hospital Referral Regions(1992-93)The number of PTCA procedures performed varied fromfewer than 2 to almost 13 per thousand Medicare enrollees,after adjusting for differences in age, sex, and race of the localpopulation. Each point represents one of the 306 hospitalreferral regions in the United States.
In a few regions, there was an inverse relationship be-
tween PTCA and CABG; for example, in Texarkana,
Arkansas, and Bloomington, Illinois, rates of CABG
were high and rates of PTCA were relatively low. In
Missoula, Montana, the PTCA rate was high while
the CABG rate was low. Across the nation, however,
the rates of the two procedures were positively corre-
lated (R2=.10). For example, rates for both CABG and
PTCA were high in Birmingham, Alabama, and Mil-
waukee. In Albuquerque, New Mexico, and Syracuse,
New York, the rates were low for both.
14
12
10
8
6
4
2
0
PTCA
Pro
cedu
res
per 1
,000
Med
icare
Enro
llees
in H
RRs
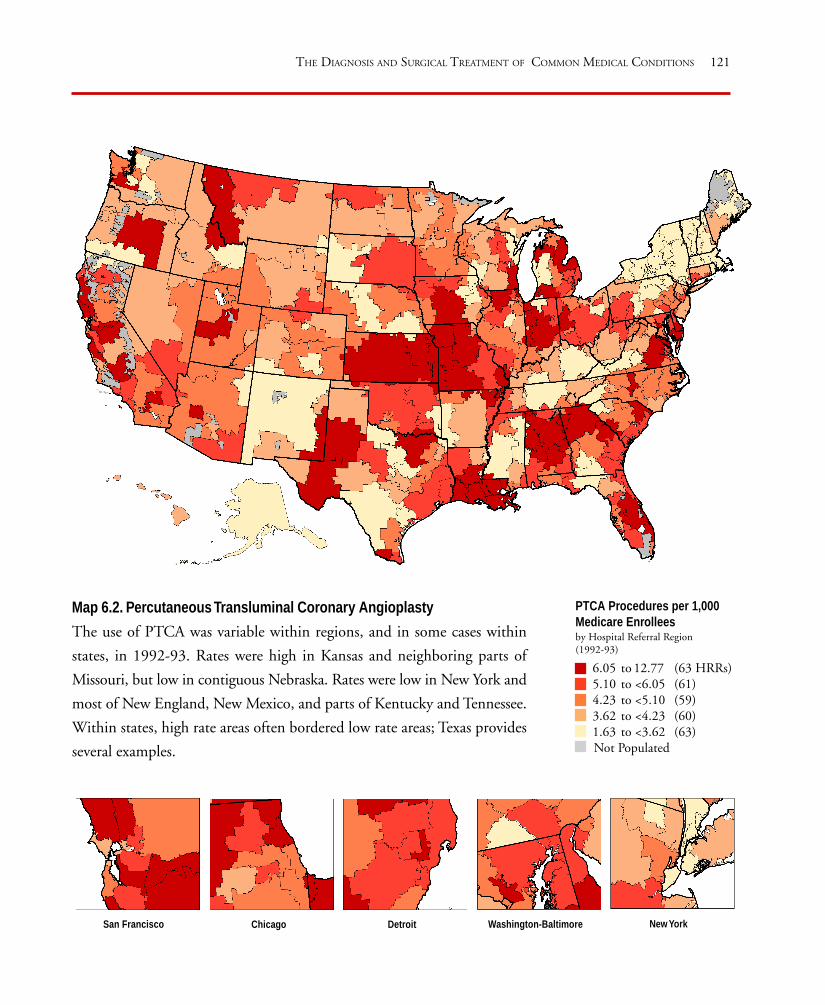
121
San Francisco Washington-Baltimore New YorkDetroitChicago
PTCA Procedures per 1,000Medicare Enrolleesby Hospital Referral Region(1992-93)
6.05 to 12.77 (63 HRRs)5.10 to <6.05 (61)4.23 to <5.10 (59)3.62 to <4.23 (60)1.63 to <3.62 (63) Not Populated
Map 6.2. Percutaneous Transluminal Coronary Angioplasty
The use of PTCA was variable within regions, and in some cases within
states, in 1992-93. Rates were high in Kansas and neighboring parts of
Missouri, but low in contiguous Nebraska. Rates were low in New York and
most of New England, New Mexico, and parts of Kentucky and Tennessee.
Within states, high rate areas often bordered low rate areas; Texas provides
several examples.
THE DIAGNOSIS AND SURGICAL TREATMENT OF COMMON MEDICAL CONDITIONS
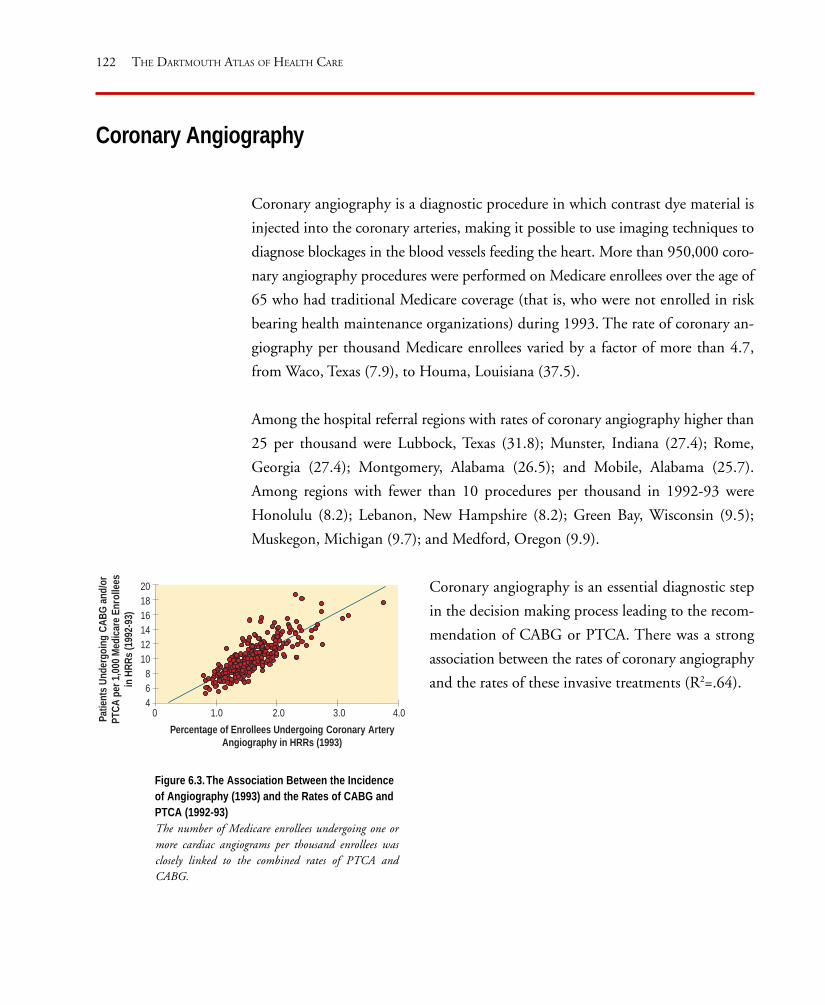
122 THE DARTMOUTH ATLAS OF HEALTH CARE
Coronary Angiography
Coronary angiography is a diagnostic procedure in which contrast dye material is
injected into the coronary arteries, making it possible to use imaging techniques to
diagnose blockages in the blood vessels feeding the heart. More than 950,000 coro-
nary angiography procedures were performed on Medicare enrollees over the age of
65 who had traditional Medicare coverage (that is, who were not enrolled in risk
bearing health maintenance organizations) during 1993. The rate of coronary an-
giography per thousand Medicare enrollees varied by a factor of more than 4.7,
from Waco, Texas (7.9), to Houma, Louisiana (37.5).
Among the hospital referral regions with rates of coronary angiography higher than
25 per thousand were Lubbock, Texas (31.8); Munster, Indiana (27.4); Rome,
Georgia (27.4); Montgomery, Alabama (26.5); and Mobile, Alabama (25.7).
Among regions with fewer than 10 procedures per thousand in 1992-93 were
Honolulu (8.2); Lebanon, New Hampshire (8.2); Green Bay, Wisconsin (9.5);
Muskegon, Michigan (9.7); and Medford, Oregon (9.9).
Figure 6.3. The Association Between the Incidenceof Angiography (1993) and the Rates of CABG andPTCA (1992-93)The number of Medicare enrollees undergoing one ormore cardiac angiograms per thousand enrollees wasclosely linked to the combined rates of PTCA andCABG.
Coronary angiography is an essential diagnostic step
in the decision making process leading to the recom-
mendation of CABG or PTCA. There was a strong
association between the rates of coronary angiography
and the rates of these invasive treatments (R2=.64).
Percentage of Enrollees Undergoing Coronary ArteryAngiography in HRRs (1993)
Patie
nts
Unde
rgoi
ngCA
BG a
nd/o
rPT
CA p
er 1
,000
Med
icare
Enr
olle
esin
HRR
s (1
992-
93)
201816141210
864
0 1.0 2.0 3.0 4.0

123
San Francisco Washington-Baltimore New YorkDetroitChicago
Coronary AngiographyProceduresper 1,000 Medicare Enrolleesby Hospital Referral Region
19.3 to 37.5 (61 HRRs)16.6 to <19.3 (61)14.9 to <16.6 (61)12.9 to <14.9 (61)
7.9 to <12.9 (62)Not Populated
Map 6.3. Coronary Angiography
Coronary angiography rates were generally higher in the Eastern half of the
United States than in the West. The exceptions were Northern California,
where some areas had high rates, and the Northeast, where rates were
relatively low, in 1993.
THE DIAGNOSIS AND SURGICAL TREATMENT OF COMMON MEDICAL CONDITIONS


125
There is good evidence, based on numerous randomized clinical trials, about the
efficacy of diagnostic screening and active treatment for improving health outcomes
for breast cancer in women over the age of 50. Periodic mammograms for women
in this age group result in a reduction of at least 30% in premature mortality from
breast cancer.
Despite this evidence, and the consensus within the medical community that an-
nual or biennial screening mammography should be routinely and uniformly
offered to women over 50, there were wide variations in the rates at which women
in the Medicare program actually had mammograms during 1992-93.
Different treatment options are available to women whose breast cancer has not
spread beyond their breasts, including breast sparing surgery (partial mastectomy or
lumpectomy) or excision of the entire breast (complete mastectomy). Breast spar-
ing surgery, which involves the removal of only part of the breast, either the tissue
immediately surrounding the tumor (lumpectomy) or a larger portion (partial mas-
tectomy), reduces the disfigurement associated with total mastectomy. Clinical trials
have shown little difference in death rates among women whose disease has not
spread beyond the breast at the time of treatment, whether they undergo breast
sparing surgery followed by radiation or chemotherapy, or whether they have total
mastectomy.
The choice of treatment should depend on how individual women evaluate the risks
and benefits of their choices, including how women feel about keeping their breasts;
how they feel about radiation therapy and the risk of recurrence, should they choose
partial mastectomy; and the issues of breast reconstruction or wearing a prosthesis,
if they elect complete mastectomy. The pattern of variation, however, suggests that
Medicare patients are not uniformly being advised about their options in ways that
encourage them to participate in the decision making process.
The Diagnosis and Treatment of Breast Cancer
THE DIAGNOSIS AND SURGICAL TREATMENT OF COMMON MEDICAL CONDITIONS

126 THE DARTMOUTH ATLAS OF HEALTH CARE
Mammography is a radiological examination of breast tissue, which, in women over
the age of 50, is highly effective in identifying cancers of the breast. During 1993,
about 3.6 million female Medicare enrollees over the age of 65 who had traditional
Medicare coverage (that is, who were not enrolled in risk bearing health mainte-
nance organizations), representing 20% of women in this category, had one or more
mammograms. The percentage of all women enrolled in traditional Medicare on
whom the examination was performed varied by a factor of more than 3.5 between
regions, from Odessa, Texas (9.2%), to Sun City, Arizona (35.6%).
The percentage of female Medicare enrollees who had one or more mammograms
was high, relative to the national average, in some hospital referral regions, including
Lansing, Michigan (34.7%); Flint, Michigan (34.5%); Fort Lauderdale, Florida
(34.2%); and Sarasota, Florida (33.8%). Rates of mammography in these regions
Mammography
Figure 6.4. Mammography for Medicare EligibleWomen Among Hospital Referral Regions (1993)The percentage of women who had mammogramsvaried from about 9% to more than 35% of womenenrolled in traditional Medicare, after adjusting fordifferences in age and race of the local population.Each point represents one of the 306 hospital referralregions in the United States.
were about three times higher than in low rate areas,
but still fall far below the goal of an annual mammo-
gram for women over 50.
The percentage female Medicare enrollees who had
one or more mammorgrams was notably low in
Oklahoma City (13.1%); Salt Lake City (13.4%);
Memphis, Tennessee (13.9%); Albuquerque, New
Mexico (14.2%); Fort Worth, Texas (14.3%); and
Dallas (14.5%).
40
35
30
25
20
15
10
5
Perc
enta
ge o
f Med
icare
Wom
en U
nder
goin
gM
amm
ogra
ms
in H
RRs

127
San Francisco Washington-Baltimore New YorkDetroitChicago
Percentage of Medicare WomenWho Had Mammogramsby Hospital Referral Region (1993)
24.1 to 35.6% (61 HRRs)20.8 to <24.1% (61)18.4 to <20.8% (61)16.2 to <18.4% (61)
9.2 to <16.2% (62)Not Populated
Map 6.4. Mammography
In 1993, the percentage of women undergoing one or more mammograms
was high in the Northeast – notably New York State – and in Florida,
Michigan, and most of California. North and South Dakota were
remarkably split between high and low rate areas, as were Illinois, Colorado,
and Wyoming.
THE DIAGNOSIS AND SURGICAL TREATMENT OF COMMON MEDICAL CONDITIONS

128 THE DARTMOUTH ATLAS OF HEALTH CARE
Breast Sparing Surgery
Breast sparing surgery for breast cancer involves the removal of only part of the
breast, either the tissue immediately surrounding the tumor (lumpectomy) or a
larger portion (partial mastectomy). In 1992-93, more than 100,000 breast surgeries
were performed on women over age 65 who were enrolled in traditional Medicare
(that is, who were not enrolled in risk bearing health maintenance organizations)
who were diagnosed with breast cancer. In spite of the evidence that there is little
difference in survival rates between women who undergo partial mastectomy fol-
lowed by chemotherapy or radiation, and women who have total mastectomies, the
proportion of women who had breast sparing surgery varied by a factor of 33, from
1.4% of breast surgeries for cancer in Rapid City, South Dakota, to 48.0% in Elyria,
Ohio.
Among the large hospital referral regions where the proportion of breast sparing
surgery among women having surgery for breast cancer was over 30% were
Figure 6.5. Use of Inpatient Breast Sparing Surgery forMedicare Eligible Women Among Hospital ReferralRegions (1992-93)The proportion of mastectomies for breast cancer that werebreast sparing varied from 1.4% to 48.0%, after adjustingfor age and race of the local population. Each pointrepresents one of the 306 hospital referral regions in theUnited States.
Paterson, New Jersey (37.8%); Ridgewood,
New Jersey (34.8%); Boston (31.7%);
Philadelphia (30.6%); East Long Island, New
York (30.4%); and White Plains, New York
(30.1%). Hospital referral regions in which the
proportion of breast sparing surgery was under
5% included Ogden, Utah (1.9%); Yakima,
Washington (3.8%); Fort Smith, Arkansas
(4.3%); Fort Collins, Colorado (4.7%); and
Joplin, Missouri (4.9%).
50
45
40
35
30
25
20
15
10
5
0
Perc
enta
ge o
f Bre
ast C
ance
r Sur
gery
that
was
Brea
st S
parin
g Am
ong
Med
icare
Wom
en in
HRR
s

129
San Francisco Washington-Baltimore New YorkDetroitChicago
Percentage of Inpatient BreastCancer Surgery in MedicareWomen That Was BreastSparingby Hospital Referral Region (1992-93)
19.4 to 48.0% (61 HRRs)14.5 to <19.4% (60)11.3 to <14.5% (62)
8.1 to <11.3% (59)1.4 to < 8.1% (64)
Not Populated
Map 6.5. Breast Sparing Surgery
Breast sparing surgery was more widely and commonly used in the
Northeast than elsewhere in the United States; regionally, its use was lowest
in the South, Midwest, and Northwest.
THE DIAGNOSIS AND SURGICAL TREATMENT OF COMMON MEDICAL CONDITIONS


131
There are several strategies for dealing with back pain and related problems caused
by injury to the intervertebral disc. Watchful waiting – monitoring the situation
without surgical intervention – can lead to a cure if care is taken not to reinjure the
spine. Exercise and medication are effective remedies for some patients, and this
approach also avoids the risks and discomfort of surgery. Surgery does offer many
patients a more rapid recovery, but carries with it a small but not insignificant risk
that the effort to make things better may actually make them worse.
Patients with similar “objective” measures of disease experience the discomforts
associated with disc injury differently. Some are very bothered by their condition,
and wish to have surgery in the hope that it will offer a quicker and more definitive
cure for their pain and loss of function; others with equally severe injury – as
measured by examination of the spine – are not bothered enough by their
symptoms to wish to undertake the discomforts and risks of surgery.
The patient’s choice whether or not to undergo back surgery should depend most
upon how the patient evaluates the risks and benefits of the available options. But
as with other common conditions, the pattern of variation suggests that the deci-
sion to undergo back surgery is more likely to be driven by the physician’s preference
than the patient’s.
The Treatment of Back Pain Due to Disc Disease
THE DIAGNOSIS AND SURGICAL TREATMENT OF COMMON MEDICAL CONDITIONS
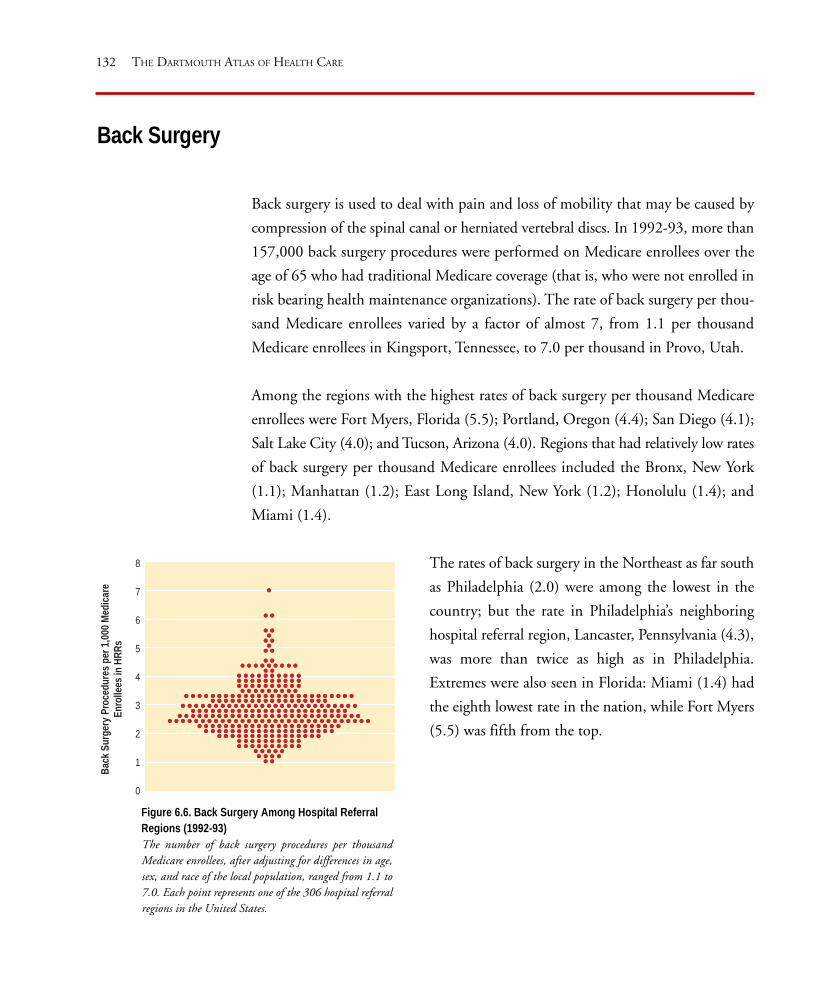
132 THE DARTMOUTH ATLAS OF HEALTH CARE
Back surgery is used to deal with pain and loss of mobility that may be caused by
compression of the spinal canal or herniated vertebral discs. In 1992-93, more than
157,000 back surgery procedures were performed on Medicare enrollees over the
age of 65 who had traditional Medicare coverage (that is, who were not enrolled in
risk bearing health maintenance organizations). The rate of back surgery per thou-
sand Medicare enrollees varied by a factor of almost 7, from 1.1 per thousand
Medicare enrollees in Kingsport, Tennessee, to 7.0 per thousand in Provo, Utah.
Among the regions with the highest rates of back surgery per thousand Medicare
enrollees were Fort Myers, Florida (5.5); Portland, Oregon (4.4); San Diego (4.1);
Salt Lake City (4.0); and Tucson, Arizona (4.0). Regions that had relatively low rates
of back surgery per thousand Medicare enrollees included the Bronx, New York
(1.1); Manhattan (1.2); East Long Island, New York (1.2); Honolulu (1.4); and
Miami (1.4).
Back Surgery
Figure 6.6. Back Surgery Among Hospital ReferralRegions (1992-93)The number of back surgery procedures per thousandMedicare enrollees, after adjusting for differences in age,sex, and race of the local population, ranged from 1.1 to7.0. Each point represents one of the 306 hospital referralregions in the United States.
The rates of back surgery in the Northeast as far south
as Philadelphia (2.0) were among the lowest in the
country; but the rate in Philadelphia’s neighboring
hospital referral region, Lancaster, Pennsylvania (4.3),
was more than twice as high as in Philadelphia.
Extremes were also seen in Florida: Miami (1.4) had
the eighth lowest rate in the nation, while Fort Myers
(5.5) was fifth from the top.
Back
Sur
gery
Proc
edur
es p
er 1
,000
Med
icare
Enro
llees
in H
RRs
8
7
6
5
4
3
2
1
0

133
San Francisco Washington-Baltimore New YorkDetroitChicago
Map 6.6. Back Surgery
The rates of back surgery were much higher in the Mountain States and the
Northwest than in the Northeast or Upper Midwest in 1992-93.
THE DIAGNOSIS AND SURGICAL TREATMENT OF COMMON MEDICAL CONDITIONS
Back Surgery per 1,000Medicare Enrolleesby Hospital Referral Region(1992-93)
3.44 to 7.02 (63 HRRs)2.94 to <3.44 (61)2.57 to <2.94 (57)2.15 to <2.57 (63)1.12 to <2.15 (62)Not Populated


135
In recent years, the incidence of prostate biopsy has skyrocketed. The increase in
biopsy rates is the result of a concerted effort in some areas to detect preclinical can-
cer with the prostate-specific antigen, or PSA, test. It is likely that the remarkable
differences in biopsy rates from region to region are a reflection of the differences
in the rates of PSA testing in those areas.
The controversy concerns not the test’s ability to find early stage cancer, but the
uncertainty about whether active treatment – surgery or radiation therapy – actually
extends life expectancy. Unlike the case with many other forms of cancer, clinical
trials to test the efficacy of treatment of early stage prostate cancer have not been
completed. Untreated prostate cancer is usually slow growing and in most men does
not become a clinical problem. For those men who have prostate cancer that is
destined to cause problems, it is not clear that early treatment will significantly alter
the course of events. The complications of treatment can be avoided by watchful
waiting, or monitoring the situation without intervening.
Although science is uncertain about the outcomes, many physicians are quite cer-
tain about the treatment they prefer; and in the United States, preference generally
reflects the physician’s specialty. A 1988 study of physician preferences for the man-
agement of localized prostate cancer found that 79% of urologists in the United
States recommended radical surgery, while 92% of radiation oncologists recom-
mended radiation treatment. The large observed variations across the United States
in both rates of prostate biopsy and rates of radical prostatectomy make a compel-
ling case for the argument that physicians’ choices, rather than those of patients, are
driving the demand for the diagnosis and treatment of prostate cancer.
The Diagnosis and Treatment of Early Stage Prostate Cancer
THE DIAGNOSIS AND SURGICAL TREATMENT OF COMMON MEDICAL CONDITIONS

136 THE DARTMOUTH ATLAS OF HEALTH CARE
Prostate Biopsy
Prostate biopsy is a procedure in which a needle is inserted into the prostate gland
to remove a small amount of tissue for microscopic study to determine the presence
of cancer. More than 298,000 male Medicare enrollees over the age of 65, or 2.5%
of all men who had traditional Medicare coverage (that is, who were not enrolled in
risk bearing health maintenance organizations), had one or more prostate biopsies
during 1993. The percentage of men undergoing prostate biopsy varied by a factor
of 7, from Lafayette, Indiana (0.7%), to Houma, Louisiana (4.9%).
Among the hospital referral regions with high rates of prostate biopsy per thousand
male Medicare enrollees in 1993 were Royal Oak, Michigan (4.7%); Pontiac,
Michigan (4.6%); Dearborn, Michigan (4.4%); Orlando, Florida (4.0%); Las Ve-
gas (4.0%); and Morristown, New Jersey (4.0%).
Figure 6.7. Prostate Biopsy Among HospitalReferral Regions (1993)The percentage of men undergoing prostate biopsiesvaried from 0.7% to almost 5% of male Medicareenrollees, after adjusting for differences in age and raceof the local population. Each point represents one of the306 hospital referral regions in the United States.
Among the regions where the rates of prostate biopsy
per thousand male Medicare enrollees were low were
Alameda County, California (1.4%); Chattanooga,
Tennessee (1.6%); Greenville, North Carolina (1.7%);
and Chicago (1.7%).
5.0
4.5
4.0
3.5
3.0
2.5
2.0
1.5
1.0
0.5
0
Perc
enta
ge o
f Med
icare
Men
Und
ergo
ing
Biop
syfo
r Pr o
stat
e Ca
ncer
in H
RRs

137
San Francisco Washington-Baltimore New YorkDetroitChicago
Percentage of Medicare MenWho Had Prostate Biopsiesby Hospital Referral Region (1993)
3.01 to 4.87% (62 HRRs)2.53 to <3.01% (63)2.20 to <2.53% (57)1.87 to <2.20% (59)0.66 to <1.87% (65)Not Populated
Map 6.7. Prostate Biopsy
There were no clear regional patterns in prostate biopsy rates; throughout
the United States, high and low rate regions were juxtaposed. The rates were
notably low in the Northeast and high in Montana and most of Florida; but
in most parts of the country there were both high and low rate hospital
referral regions.
THE DIAGNOSIS AND SURGICAL TREATMENT OF COMMON MEDICAL CONDITIONS

138 THE DARTMOUTH ATLAS OF HEALTH CARE
Radical Prostatectomy
Radical prostatectomy is the complete surgical removal of the prostate gland. More
than 65,000 radical prostatectomies were performed on Medicare enrollees over the
age of 65 who had traditional Medicare coverage (that is, who were not enrolled in
risk bearing health maintenance organizations) during 1992-93. The rates of radical
prostatectomy varied by a factor of more than 4, from fewer than 1.5 per thousand
in Lafayette, Louisiana; Providence, Rhode Island; and Chicago, to more than 6 per
thousand in Palm Springs, California; Provo, Utah; and Boulder, Colorado.
Among the large hospital referral regions with high rates of radical prostatectomy
per thousand male Medicare enrollees were Salt Lake City (5.6); Fresno, California
(5.0); St. Paul, Minnesota (5.0); St. Louis (4.8); and Oklahoma City (4.7). Regions
with comparatively low rates of radical prostatectomy included Manhattan (1.2);
Figure 6.8. Radical Prostatectomy Among HospitalReferral Regions (1992-93)The number of prostatectomies per thousand maleMedicare enrollees varied from 0.6 to more than 7.0,after adjusting for differences in the age and race of thelocal population. Each point represents one of the 306hospital referral regions in the United States.
Camden, New Jersey (1.4); New Haven, Connecticut
(1.5); and Louisville, Kentucky (1.5).
Radi
cal P
r ost
atec
tom
ies
per 1
,000
Mal
eM
edica
re E
nrol
lees
in H
RRs
8
7
6
5
4
3
2
1
0
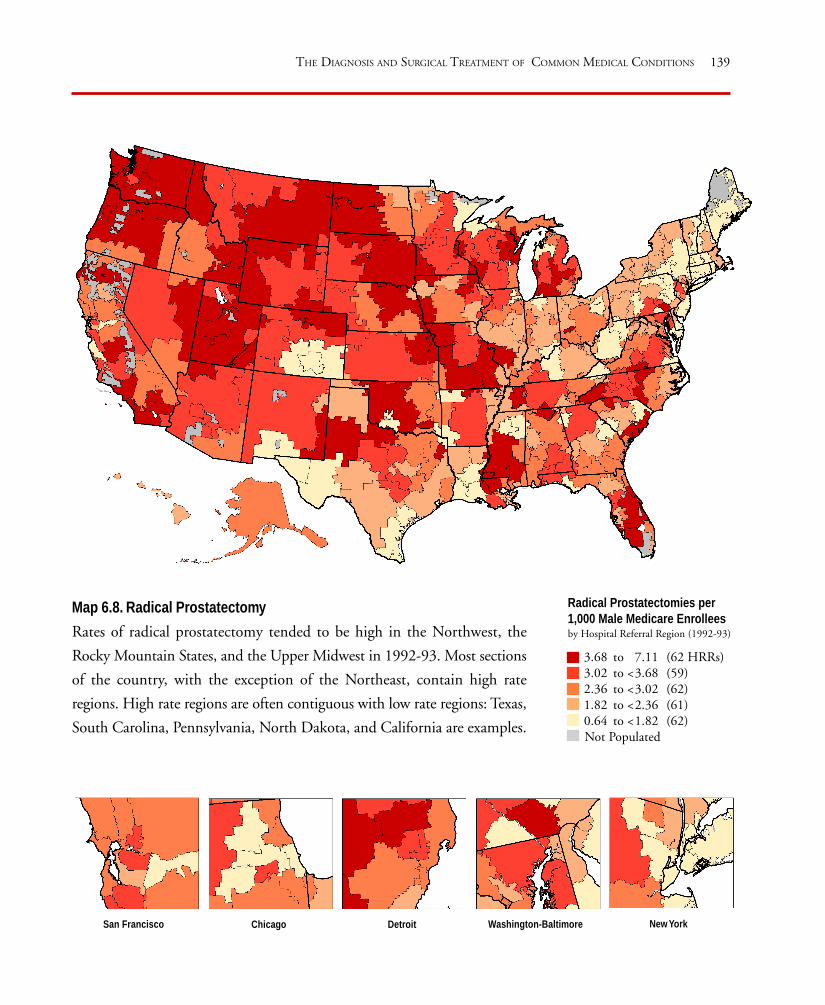
139
San Francisco Washington-Baltimore New YorkDetroitChicago
Map 6.8. Radical Prostatectomy
Rates of radical prostatectomy tended to be high in the Northwest, the
Rocky Mountain States, and the Upper Midwest in 1992-93. Most sections
of the country, with the exception of the Northeast, contain high rate
regions. High rate regions are often contiguous with low rate regions: Texas,
South Carolina, Pennsylvania, North Dakota, and California are examples.
THE DIAGNOSIS AND SURGICAL TREATMENT OF COMMON MEDICAL CONDITIONS
Radical Prostatectomies per1,000 Male Medicare Enrolleesby Hospital Referral Region (1992-93)
3.68 to 7.11 (62 HRRs)3.02 to <3.68 (59)2.36 to <3.02 (62)1.82 to <2.36 (61)0.64 to <1.82 (62)Not Populated


141
Benign prostatic hyperplasia (BPH) is a common condition affecting the majority
of men over the age of 65. As men grow older, the prostate gland, which is near the
outlet of the urinary bladder, often enlarges and causes urinary symptoms that some
men find quite bothersome. The condition can be treated in several ways, includ-
ing transurethral resection (surgical removal) of the prostate, other forms of surgery,
medications, and watchful waiting. Surgery is effective in reducing symptoms for
most men, and medications work well for some. The course of untreated BPH is
variable.
Research conducted in the 1980s into the causes of the variations in surgery rates
for BPH led to an important set of conclusions. Reducing unwanted variations in
the patterns of practice required the active participation of the patient in the deci-
sion process, because the choice among treatments should depend on how
individual patients assess the costs, risks, and benefits of the treatment options. For
most men with BPH, the primary reasons for undergoing surgery are to reduce the
severity of prostate-related symptoms and to improve the quality of life. The other
approaches offer less improvement in symptoms but are also less risky. To make a
rational choice among the options, the individual patient must assess his own situ-
ation, evaluating how much he is bothered by his symptoms and how concerned he
is about possible adverse effects of active treatment.
Research has shown that when they are fully informed, most men with mild symp-
toms choose watchful waiting. Even though surgery is the most effective treatment
for reducing symptoms, many men with moderate or severe symptoms prefer to live
with their symptoms or accept less effective treatment to avoid the risk of surgery.
Others accept the risk, willingly undergoing surgery because they are sufficiently
bothered by their symptoms to want the benefits surgery offers.
The Diagnosis and Treatment of Benign Prostatic Hyperplasia
THE DIAGNOSIS AND SURGICAL TREATMENT OF COMMON MEDICAL CONDITIONS
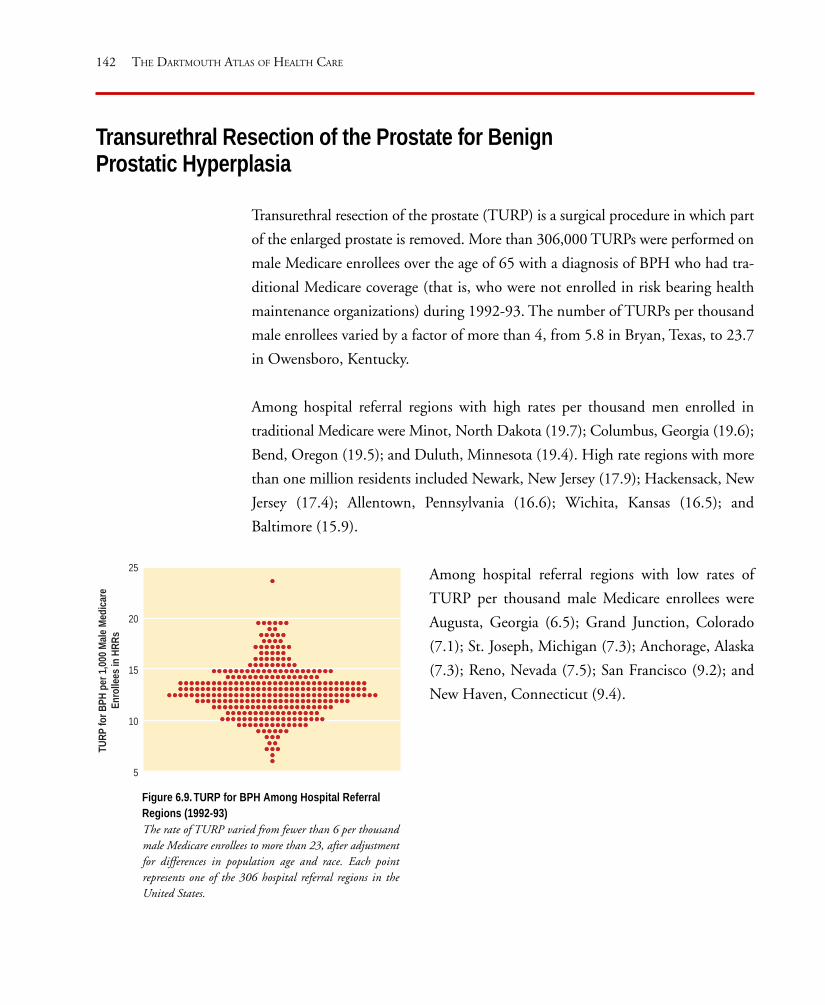
142 THE DARTMOUTH ATLAS OF HEALTH CARE
Transurethral resection of the prostate (TURP) is a surgical procedure in which part
of the enlarged prostate is removed. More than 306,000 TURPs were performed on
male Medicare enrollees over the age of 65 with a diagnosis of BPH who had tra-
ditional Medicare coverage (that is, who were not enrolled in risk bearing health
maintenance organizations) during 1992-93. The number of TURPs per thousand
male enrollees varied by a factor of more than 4, from 5.8 in Bryan, Texas, to 23.7
in Owensboro, Kentucky.
Among hospital referral regions with high rates per thousand men enrolled in
traditional Medicare were Minot, North Dakota (19.7); Columbus, Georgia (19.6);
Bend, Oregon (19.5); and Duluth, Minnesota (19.4). High rate regions with more
than one million residents included Newark, New Jersey (17.9); Hackensack, New
Jersey (17.4); Allentown, Pennsylvania (16.6); Wichita, Kansas (16.5); and
Baltimore (15.9).
Transurethral Resection of the Prostate for BenignProstatic Hyperplasia
Figure 6.9. TURP for BPH Among Hospital ReferralRegions (1992-93)The rate of TURP varied from fewer than 6 per thousandmale Medicare enrollees to more than 23, after adjustmentfor differences in population age and race. Each pointrepresents one of the 306 hospital referral regions in theUnited States.
Among hospital referral regions with low rates of
TURP per thousand male Medicare enrollees were
Augusta, Georgia (6.5); Grand Junction, Colorado
(7.1); St. Joseph, Michigan (7.3); Anchorage, Alaska
(7.3); Reno, Nevada (7.5); San Francisco (9.2); and
New Haven, Connecticut (9.4).
25
20
15
10
5
TURP
for B
PH p
er 1
,000
Mal
e M
edica
reEn
rolle
es in
HRR
s

143
San Francisco Washington-Baltimore New YorkDetroitChicago
Map 6.9. Transurethral Resection of the Prostate
The rates of TURP among male Medicare enrollees were higher in the
Midwest than in most of the rest of the United States, although some areas
in the Northwest and Southeast also had high rates. The rates were not
uniform among major metropolitan areas: San Francisco had low rates for
the procedure, while New York, Washington, and Chicago had high rates.
THE DIAGNOSIS AND SURGICAL TREATMENT OF COMMON MEDICAL CONDITIONS
Transurethral Prostatectomiesfor Benign Prostatic Hyperplasiaper 1,000 Male MedicareEnrolleesby Hospital Referral Region (1992-93)
14.62 to 23.70 (61 HRRs)13.31 to <14.62 (61)12.24 to <13.31 (61)10.86 to <12.24 (61)
5.84 to <10.86 (62)Not Populated


BenchmarkingPART SEVEN

146 THE DARTMOUTH ATLAS OF HEALTH CARE
Benchmarking
For years, health policy experts, educators, and professional societies have struggled
with the question of how many physicians, nurses, and other health care resources
such as hospital beds are “needed.” The issue of need has sometimes been framed in
terms of the outcomes of care: How much is needed to maximize the health of the
American people? Sometimes the issue of need has been placed in the context of
demand: How much health care do the American people want?
In recent years, the concept of needs-based or demand-based planning has come
under serious challenge, in part because the problem of scientific uncertainty about
the outcomes of care has been more widely recognized. The detailed knowledge
required to calculate the resources necessary to optimize health status is simply not
available. It is also not clear how much care Americans really want. The evidence
that provider, rather than patient, preferences dominate much of clinical decision
making, and that capacity exercises a threshold effect on utilization, raises serious
doubts about the belief that utilization rates reflect patient demand.
In the absence of a detailed understanding of the nature of health care needs, medi-
cal care outcomes, and what patients want, what guidelines are available for use in
establishing appropriate levels of supply? One method is to examine the way re-
sources are actually used, and to use as “benchmarks” efficiently operated health care
plans or communities that appear to have an adequate but not excessive level of
supply.
Benchmarking provides answers to two related questions: How much more (or less)
health care capacity would the nation need, if all regions had the level of capacity
of the benchmark region or health plan? And how much more (or less) health care
capacity would be required in a specific region if its per capita capacity were equal
to the level of the benchmark region or health plan?
Two useful benchmarks are the Minneapolis hospital referral region and a large,
well-established, and successful health maintenance organization. Both have

147
demonstrated the ability to deliver an adequate level of care for defined populations
within reasonable constraints. Benchmarking involves the search for communities
and health plans that exhibit models of “best practice” – exemplary ways of practic-
ing medicine that provide answers to the question “Which rate is right?”
For a number of common conditions, patient preference is the key to rational
choice among alternative treatments, including surgery. The search for “best prac-
tices” to benchmark the rates of surgery leads to those practices that have adopted
shared decision making, because learning which rate is right requires the active par-
ticipation of the patient in the decision process. The experiences of two large health
maintenance organizations that adopted shared decision making provide a bench-
mark for the demand for surgical management of benign prostatic hyperplasia
(BPH) when patients were empowered to choose among available treatments ac-
cording to their own preferences.
BENCHMARKING

148 THE DARTMOUTH ATLAS OF HEALTH CARE
Benchmarking the United States Supply of Physicians
to a Large Health Maintenance Organization
How many physicians would the nation need if supply were geared to meet the re-
quirements of a large staff model health maintenance organization? The supply of
physicians in such health maintenance organizations is determined by a deliberate
planning process that pays close attention to the ratios of physicians to members. The
success of health maintenance organizations in gaining market share has demonstrated
that these physician staffing ratios are acceptable to large numbers of consumers.
The impact of using this standard in determining the nation’s need for physicians
could be substantial; after adjustment for differences in population age, sex, and
race, the number of clinically active physicians in the United States in 1993 ex-
ceeded by 158,866, or 51%, the number who would have been employed under the
physician-to-population hiring ratios used by one large staff model health mainte-
nance organization with more than 2.4 million enrollees.
According to this standard, even the supply of primary care physicians practicing in
the United States exceeds the numbers required by the health maintenance organi-
zation by 24,403, or 17%. The number of specialists is substantially in excess:
131,065 physicians, or 76%.
The impact would be greater on some specialties than on others. Among the spe-
cialties included in Figure 7.1, the per capita number of cardiologists and general
surgeons exceeded the number “needed” by more than 100%; by this benchmark,
the national supply in 1993 exceeded the health maintenance organization “de-
mand” by more than 8,000 cardiologists and 12,800 general surgeons. The national
supply of orthopedic surgeons exceeded the benchmark by 60%; obstetrician/gyne-
cologists by 38%; ophthalmologists by 31%; anesthesiologists by 26%; and
urologists by 18%. Radiology was the only one of the listed specialty areas in which
the national per capita supply approximated the staffing levels in the health main-
tenance organization.
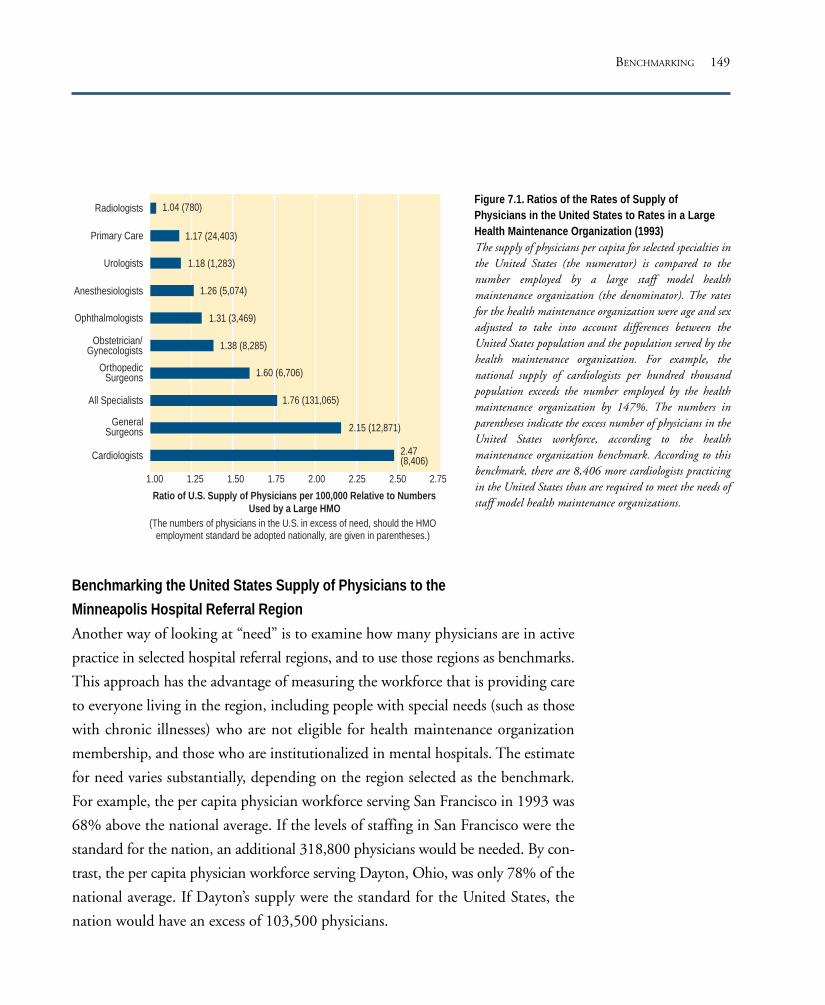
149
Figure 7.1. Ratios of the Rates of Supply ofPhysicians in the United States to Rates in a LargeHealth Maintenance Organization (1993)The supply of physicians per capita for selected specialties inthe United States (the numerator) is compared to thenumber employed by a large staff model healthmaintenance organization (the denominator). The ratesfor the health maintenance organization were age and sexadjusted to take into account differences between theUnited States population and the population served by thehealth maintenance organization. For example, thenational supply of cardiologists per hundred thousandpopulation exceeds the number employed by the healthmaintenance organization by 147%. The numbers inparentheses indicate the excess number of physicians in theUnited States workforce, according to the healthmaintenance organization benchmark. According to thisbenchmark, there are 8,406 more cardiologists practicingin the United States than are required to meet the needs ofstaff model health maintenance organizations.
Benchmarking the United States Supply of Physicians to the
Minneapolis Hospital Referral Region
Another way of looking at “need” is to examine how many physicians are in active
practice in selected hospital referral regions, and to use those regions as benchmarks.
This approach has the advantage of measuring the workforce that is providing care
to everyone living in the region, including people with special needs (such as those
with chronic illnesses) who are not eligible for health maintenance organization
membership, and those who are institutionalized in mental hospitals. The estimate
for need varies substantially, depending on the region selected as the benchmark.
For example, the per capita physician workforce serving San Francisco in 1993 was
68% above the national average. If the levels of staffing in San Francisco were the
standard for the nation, an additional 318,800 physicians would be needed. By con-
trast, the per capita physician workforce serving Dayton, Ohio, was only 78% of the
national average. If Dayton’s supply were the standard for the United States, the
nation would have an excess of 103,500 physicians.
Radiologists
Primary Care
Urologists
Anesthesiologists
Ophthalmologists
Obstetrician/Gynecologists
OrthopedicSurgeons
All Specialists
GeneralSurgeons
Cardiologists
1.00 1.25 1.50 1.75 2.00 2.25 2.50 2.75
1.04 (780)
1.17 (24,403)
1.18 (1,283)
1.26 (5,074)
1.31 (3,469)
1.38 (8,285)
1.60 (6,706)
1.76 (131,065)
2.15 (12,871)
2.47(8,406)
(The numbers of physicians in the U.S. in excess of need, should the HMOemployment standard be adopted nationally, are given in parentheses.)
Ratio of U.S. Supply of Physicians per 100,000 Relative to NumbersUsed by a Large HMO
BENCHMARKING

150 THE DARTMOUTH ATLAS OF HEALTH CARE
We have used the Minneapolis hospital referral region, which has a strong penetra-
tion of managed care, as the regional benchmark for this Atlas. According to the
Minneapolis benchmark, the national per capita supply of primary care physicians
in 1993 was not sufficient to meet existing needs. The national rate of primary care
physicians per hundred thousand population was 93% of the staffing level in Min-
neapolis; to raise the primary physician-to-population ratio of the nation as a whole
to the same level, 12,056 additional primary care physicians would be needed.
The national supply of specialists in 1993
exceeded the staffing pattern in Minne-
apolis by 21%, or 52,418 specialists.
Among the individual specialties listed in
Figure 7.2, the national per capita sup-
plies for obstetrician/gynecologists,
cardiologists, anesthesiologists, and psy-
chiatrists exceeded the numbers required
to achieve the Minneapolis benchmark by
at least 30%; the supplies of general sur-
geons, radiologists, and urologists were
20% to 28% higher than the Minneapo-
lis benchmark. Orthopedic surgery was
the only listed specialty in which the na-
tional per capita supply approximated the
numbers used by the residents of the
Minneapolis hospital referral region.
There were important differences between
the staff model health maintenance orga-
nization and the Minneapolis region in the
Primary Care
OrthopedicSurgeons
Ophthalmologists
Radiologists
All Specialists
GeneralSurgeons
Urologists
Anesthesiologists
Obstetrician/Gynecologists
Cardiologists
Psychiatrists
1.0 1.1 1.2 1.3 1.4 1.50.9
0.93 (-12,056)
1.03 (497)
1.07 (970)
1.20 (3,718)
1.21 (52,418)
1.24 (4,703)
1.28 (1,790)
1.30 (5,608)
1.36 (7,970)
1.37 (8,706)
1.38 (3,862)
Ratio of U.S. Supply of Physicians to the Numbers per 100,000Serving the Minneapolis Hospital Referral Region
(The numbers of physicians in the U.S. in excess (+) or deficit (-) of need, should theMinneapolis benchmark be adopted nationally, are given in parentheses.)
Figure 7.2. Ratios of the Rates of Supply of Physicians in theUnited States to Rates in the Minneapolis Hospital ReferralRegion (1993)The per capita physician workforce in Minneapolis was lower than thenational level of supply in every specialty. If the Minneapolisbenchmark were the standard for the nation, the per capita supply ofcardiologists would exceed need by 38%, and there would be an excessof 3,862 cardiologists in the United States workforce.

151
per capita supply and composition of
the physician workforce. The number
of primary care physicians serving Min-
neapolis exceeded the health mainte-
nance organization benchmark by 26%
(Figure 7.3). Although the number of
all specialists available in the Minne-
apolis hospital referral region exceeded
the health maintenance organization
benchmark by 46%, the health mainte-
nance organization had a greater supply
of some specialists, including radiolo-
gists (16%), urologists (8%), and anes-
thesiologists (3%). By contrast, the per
capita number of cardiologists exceeded
the health maintenance organization
benchmark by 79%, and the number
of general surgeons by 73%.
Radiologists
Primary Care
Urologists
Anesthesiologists
Ophthalmologists
Obstetrician/Gynecologists
OrthopedicSurgeons
All Specialists
GeneralSurgeons
Cardiologists
1.0 1.2 1.4 1.6 1.8 2.00.8
0.86 (-31)
0.93 (-5)
0.97 (-6)
1.01 (3)
1.22 (26)
1.26 (383)
1.46 (827)
1.55 (65)
1.73 (86)
1.79 (48)
Ratio of Minneapolis Supply of Physicians to the Numbers per100,000 Used by a Large HMO
(The numbers of physicians in the Minneapolis HRR in excess (+) or deficit (-) of need,should the HMO benchmark be adopted for Minneapolis, are given in parentheses.)
BENCHMARKING
Figure 7.3. Ratios of the Rates of Supply of Physicians inMinneapolis to Rates in a Large Health Maintenance Organization(1993)
The rates were age and sex adjusted to take into account differences inage structure.
The number of primary care physicians serving the Minneapolis regionexceeded the health maintenance organization benchmark by 26%. Thenumbers in parentheses are the numbers of physicians working in theMinneapolis region in excess of (+) or below (-) the health maintenanceorganization standard. (For example, if Minneapolis were to have thesame per capita supply of primary care physicians as the healthmaintenance organization, it would need to reduce its primary careworkforce by 383 physicians.) The Minneapolis region had fewerphysicians per hundred thousand population practicing in somespecialties than the health maintenance organization; for example,according to the health maintenance organization benchmark,Minneapolis had a shortage of 31 radiologists.
152 THE DARTMOUTH ATLAS OF HEALTH CARE
Benchmarking Medicare Reimbursements and the Supply of Hospital Resources
in the United States to the Minneapolis Hospital Referral Region
Benchmarking can be applied to Medicare reimbursements as well as to the supply
of acute care hospital resources and physicians. In 1993, Medicare program outlays
were more than $115 billion for beneficiaries 65 years of age and older served by
fee-for-service providers. The national per enrollee reimbursement rate exceeded the
rate for the Minneapolis hospital referral region by 40% (Figure 7.4). The price
adjusted Minneapolis rate was well below the United States average for each sector
of care. Overall, if the spending experience for Minneapolis had been the standard
for the nation, federal reimbursements would have been $32.6 billion lower. The
greatest savings would have been for professional and laboratory services ($14.7
billion), followed by inpatient hospital services ($10.2 billion), home health care
services ($6.1 billion), and outpatient services ($1.0 billion).
The supplies of acute care hospital beds, full time equivalent employees, and hos-
pital-based registered nurses in the Minneapolis hospital referral region were also
substantially below the United States average in 1993. In that year, there were more
than 825,000 staffed acute care hospital beds allocated to the populations living in
the 306 hospital referral regions in the United States. If the Minneapolis benchmark
for use of acute care hospital beds had been the standard for the nation, national
capacity could have been reduced by almost 120,000 beds, or 14.5%. In the same
year, the nation’s hospitals employed more than 3,555,000 full time equivalent
workers; if the Minneapolis employment levels had been the benchmark for the
nation, the workforce could have been reduced by about 768,000, or 21.9%. Acute
care hospitals in the United States employed more than 872,000 registered nurses
in 1993; if the Minneapolis nurse staffing level had applied to the entire United
States in that year, the excess supply of nurses would have been more than 187,000,
or 21.4%.

153
Figure 7.4. Ratios of the Rates for Medicare Reimbursements and for Hospital Resource Allocationsin the United States to the Rates in the Minneapolis Hospital Referral Region (1993)There would be substantial savings in both Medicare reimbursements and hospital resources if the experience in theMinneapolis hospital referral region were the standard for the nation. Rates of resource allocation andreimbursements have been age, sex, and race adjusted. The numbers in parentheses are the savings in billions ofdollars or the resources (beds and personnel) in excess of need if the Minneapolis experience were the standard forthe nation.
Benchmarking the Chicago, Los Angeles, New Orleans, Miami, and Philadelphia
Hospital Referral Regions to the Minneapolis Hospital Referral Region
The information presented in this Atlas makes it possible to answer very specific
questions about resource allocation. By how much does the supply of hospital re-
sources serving one region differ from another region? How many more (or fewer)
physicians would be required if the practice patterns in one region were applied to
another?
1.4 1.8 2.2 2.8 3.21.0
Total Reimbursements
Outpatient Facilities
Inpatient Services
Professional and Lab
Home Health Services
Hospital Beds
Hospital-Based RNs
Hospital Employees
1.40 ($32.6)
1.12 ($1.0)
1.21 ($10.2)
1.90 ($14.7)
3.18($6.1)
1.17 (119,535)
1.27 (187,286)
1.28 (768,228)
Ratio of U.S. Supply of Hospital Resources and Expenditures andMedicare Reimbursements to Minneapolis HRR Benchmarks
(The amounts of resources, and billions of dollars in expenditures and reimbursementsin excess of the Minneapolis benchmarks are given in parentheses.)
BENCHMARKING

154 THE DARTMOUTH ATLAS OF HEALTH CARE
Figure 7.5. Ratios of the Rates of Physicians in Selected HRRs to Rates in the MinneapolisHospital Referral Region (1993)The supply of all physicians per hundred thousand residents in Philadelphia exceeded the supply inMinneapolis by 50%. Rates were age and sex adjusted. If Philadelphia’s rate were to be reduced to therate in Minneapolis, 3,400 fewer physicians would be needed. The numbers in parentheses are thenumbers of physicians working in the selected cities in excess of (+) or below (-) the Minneapolisbenchmark.
All Physicians
Primary Care
All Specialists
0.6 0.8 1.0 1.2 1.4 1.6 1.8 2.0 2.2
1.50 (3,400)
1.32 (1,470)
1.30 (429)
1.21 (3,278)
1.38 (1,541)
1.26 (724)
1.21 (403)
0.86 (-82)
1.00 (4)
1.17 (287)
1.68 (2,665)
1.38 (1,037)
1.60 (506)
1.35 (3,170)
1.51 (1,204)
Philadelphia
Chicago
New Orleans
Los Angeles
Miami
Ratio of Physicians per 100,000 Serving Selected U.S. HRRsto the Minneapolis Benchmark
(The numbers of physicians serving each selected HRR in excess (+) or in deficit (-)of need, should the Minneapolis benchmark be adopted, are given in parentheses.)
Minneapolis. The supply of
specialists in each region ex-
ceeded the benchmark, rang-
ing from 35% in excess in Los
Angeles to 68% in Philadel-
phia. The physician workforce
in the Philadelphia region ex-
ceeded the numbers that
would be employed under the
Minneapolis model for re-
source allocation by more than
3,400. In contrast, New Or-
leans would have needed 82
more primary care physicians
to reach the Minneapolis
benchmark.
Acute care hospital services
and Medicare reimbursements
exceeded the Minneapolis
benchmark in each of the five
regions (Figure 7.6). Age, sex,
race and price adjusted Medi
The per capita number of physicians allocated to the Minneapolis hospital referral
region in 1993 was considerably smaller than the numbers allocated to the other
regions (Figure 7.5). Philadelphia had 50% more physicians per capita than Min-
neapolis, and Chicago exceeded the benchmark by 32%. The supply of physicians
was 30% higher in New Orleans, 21% higher in Los Angeles, and 38% higher in
Miami than in Minneapolis. The per capita numbers of primary care physicians
were greater than in Minneapolis in Philadelphia (26%), Chicago (21%), and Mi-
ami (17%). By contrast, the rate in New Orleans was only 86 % of that in

155
Figure 7.6. Ratios of the Rates for Hospital Resources and Medicare Reimbursement in Selected HRRs to Rates in the MinneapolisHospital Referral Region (1993).Resource allocations greatly exceeded the level in Minneapolis. The acute care hospital bed capacity per thousand residents in New Orleans exceededthe supply in Minneapolis by 82%. If New Orleans’ rate for beds per thousand residents had been reduced to the rate in Minneapolis, 1,939 beds couldhave been eliminated. The numbers in parentheses are the amount of hospital resources or of Medicare reimbursements that would have been savedif the referenced region had been equal to the Minneapolis benchmark. (Medicare reimbursements are for Medicare beneficiaries served by fee-for-serviceproviders, including non-risk bearing health maintenance organizations.) Rates were age, sex, and race adjusted.
care reimbursements in the Miami region exceeded those in the Minneapolis region
by 130%. If reimbursements in Miami in 1993 had been at the per capita rate of
the Minneapolis region, federal outlays for care in Miami would have been $860
million less. The per capita numbers of hospital beds and hospital employees in the
Chicago region exceeded those for Minneapolis by 61% and 88%, respectively. If
Chicago had had the bed supply and hospital employee ratios of Minneapolis, the
region would have used 4,625 fewer beds and 26,338 fewer hospital employees.
1.0 1.5 2.0 2.5 3.0
Hospital Beds
Hospital Employees
Hospital-Based RNs
Total Reimbursements
1.36 (4,030)1.61 (4,625)
1.82 (1,939)1.06 (1,625)
1.22 (1,479)
1.60 (26,373)1.88 (26,338)1.89 (8,401)
1.10 (10,391)1.23 (6,080)
1.66 (7,161)1.82 (6,050)
1.59 (1,352)1.15 (3,626)
1.25 (1,614)
1.73 ($1.07)1.65 ($0.46)
1.88 ($0.22)1.94 ($1.38)
2.30 ($0.86)
Philadelphia
Chicago
New Orleans
Los Angeles
Miami
Ratio of Quantities of Hospital Resources per 1,000 and MedicareReimbursements per capita in Selected U.S. HRRs to the Minneapolis Benchmark
(The amounts of hospital resources and billions of Medicare dollars that would be savedin each selected HRR, should the Minneapolis benchmark be adopted, are given in parentheses.)
BENCHMARKING

156 THE DARTMOUTH ATLAS OF HEALTH CARE
Benchmarking the Rates of Surgery
Learning which rate of surgery is right depends on making fundamental changes in
the provider-patient relationship. Patients must participate as active partners in de-
cision making, and health plans must deal with the problem of unwanted provider
influence on demand. The experiences of two staff model health maintenance or-
ganizations that adopted shared decision making for benign prostatic hyperplasia
(BPH) provide a benchmark for estimating the demand for prostatectomy. After
adopting shared decision making, the plans’ rates of transurethral prostatectomy
(TURP) dropped about 40%, even though their rates were already well below the
national average. If the preferences of men throughout the United States proved
similar to those of men enrolled in the two health maintenance organizations, the
demand for the procedure under shared decision making would be substantially less
than the amount delivered under traditional Medicare in 1992-93. In 1992-93, only
the Augusta, Georgia, and Bryan, Texas, hospital referral regions had rates of TURP
that were within 10% of the health maintenance organizations’ benchmark.
These benchmarks do not take into account the longer-range experience under
shared decision making and therefore might underestimate the “steady state” surgery
rate, since patients can change their minds and choose surgery after the initial pe-
riod of watchful waiting. On the other hand, the rates reflect demand in practice
settings where no extra fee was paid when patients chose surgical care; the health
maintenance organizations’ experience therefore overestimates demand in situations
where patients are asked to share the costs of surgery.
The importance of benchmarking the rates of use of surgery under shared decision
making is illustrated in Figure 7.7. The figure includes nine conditions for which
the rates of surgery vary substantially from region to region. Surgical treatment of
these conditions accounts for more than half of the costs of surgery performed in
the United States.

157
Figure 7.7. Conditions for Which Patient Preferences Are Important for Rational ChoiceAmong Treatment Options
Conditions
Angina pectoris
Arthritis of hip and knee
Atherosclerosis of carotid artery with threat of stroke
Benign prostatic hyperplasia (BPH)
Cataracts
Gallstones
Herniated disc
Peripheral vascular disease
Symptoms of menopause
Major Treatment Options
Bypass surgery vs. angioplasty vs. drugs
Hip/knee replacement vs. medical management
Carotid endarterectomy vs. aspirin
Surgery (by type) vs. drugs vs. microwave diathermy vs. watchful waiting
Lens extraction (by type) vs. watchful waiting
Surgery vs. stone crushing vs. medical management vs. watchful waiting
Surgery (by type) vs. various medical management strategies
Bypass surgery vs. angioplasty vs. medical management
Surgery (by type) vs. hormone treatments vs. drugs vs. watchful waiting
BENCHMARKING


TablesPART EIGHT
The tables in this part of the Atlas provide specific informa-
tion for each hospital referral region. Most, but not all, of the
data displayed in maps and figures in parts One through Seven
are presented here. Tables One and Two provide estimates of
acute care hospital resources and the physician workforce allo-
cated to hospital referral regions. In these tables, the rates are
for the resident population of the regions. In tables Three and
Four, the rates are for Medicare enrollees who are not mem-
bers of risk bearing health maintenance organizations. Table
Three provides rates for hospitalizations, diagnostic and surgi-
cal procedures, and mortality. Table Four contains reimburse-
ment rates for the various components of the Medicare
program.
The tables provide the information necessary for benchmark-
ing any hospital referral region to another or to the national
average. Readers interested in benchmarking are referred to
Part Nine, Section 3.9, which contains instructions on how to
do the calculations for any given region.
For readability, the data in the tables have been rounded,
usually to one place to the right of the decimal point.

160 THE DARTMOUTH ATLAS OF HEALTH CARE
Description of Variables for Table 1
Figure List
2.1, 3.1, 3.3, 3.4, 3.5, 3.6, 3.7, 3.8,7.4, 7.6
2.2, 3.2, 7.4, 7.6
2.3, 7.4, 7.6
2.4, 3.1
Price Adjustment
Price Index for totalpopulation
Description
Based on 1990 Census. All ages.
Allocated and Age, Sex, AdjustedBeds per 1000 of Total Population
Allocated and Age, Sex, AdjustedFull Time Equivalent HospitalEmployees per 1000 of TotalPopulation
Allocated and Age, Sex, AdjustedRegistered Nurses per 1000 ofTotal Population
Price Adjusted, Allocated, andAge, Sex Adjusted Total HospitalExpenditures per Capita for theTotal Population
Variable
Total Population
Adjusted Beds per 1000
Adjusted FTE per 1000
Adjusted RNs per 1000
Adjusted TotalExpenditures per Capita

161
TABLE ONE
Acute Care Hospital Resources Allocated to Hospital Referral Regions
(Rates for 1993)*
San Mateo Co. 723,533 2.0 10.0 2.5 791
Santa Barbara 374,609 2.3 8.6 2.3 665
Santa Cruz 240,944 1.9 7.2 2.0 667
Santa Rosa 393,669 2.0 8.4 2.4 714
Stockton 413,152 2.6 12.7 3.4 1,007
Ventura 700,513 2.1 10.0 2.6 700
Colorado
Boulder 212,469 2.1 12.1 3.2 818
Colorado Springs 561,723 3.0 13.3 3.2 929
Denver 1,904,201 3.0 13.4 3.5 1,018
Fort Collins 238,089 2.6 10.5 2.5 838
Grand Junction 201,585 2.6 12.1 3.3 973
Greeley 227,007 2.9 13.9 3.7 1,062
Pueblo 133,475 3.0 12.6 2.8 875
Connecticut
Bridgeport 629,535 2.7 12.5 2.8 837
Hartford 1,393,087 2.7 13.5 3.2 916
New Haven 1,349,858 2.5 12.6 2.8 851
Delaware
Wilmington 635,637 3.1 16.4 4.2 1,166
District of Columbia
Washington 2,153,979 3.3 15.5 4.0 1,063
Florida
Bradenton 197,705 2.9 7.9 1.9 698
Clearwater 450,255 2.8 8.9 2.3 749
Fort Lauderdale 1,927,706 3.0 11.2 2.9 893
Fort Myers 627,321 3.0 11.8 2.8 997
Gainesville 407,508 3.1 12.3 2.9 1,007
Hudson 287,224 3.0 9.9 2.3 846
Jacksonville 1,137,244 3.5 15.1 3.8 1,159
Lakeland 279,997 2.3 10.3 2.6 853
Miami 2,365,502 3.5 13.8 3.4 993
Ocala 292,949 2.5 10.5 2.6 880
Orlando 2,251,255 3.0 12.8 3.0 952
Ormond Beach 268,338 2.9 11.1 2.7 875
Panama City 161,325 3.4 14.6 3.3 1,069
Pensacola 588,018 4.1 13.5 3.3 1,026
Sarasota 317,728 2.6 10.1 2.2 848
St Petersburg 401,404 3.5 12.6 3.2 918
Alabama
Birmingham 1,983,947 4.3 16.3 4.0 1,228
Dothan 328,197 4.3 14.2 3.3 1,170
Huntsville 472,826 3.7 13.6 3.6 970
Mobile 680,935 4.3 16.2 4.1 1,223
Montgomery 398,081 3.6 13.7 3.5 985
Tuscaloosa 228,294 3.8 16.4 3.6 1,169
Alaska
Anchorage 546,182 3.8 17.3 4.8 1,232
Arizona
Mesa 683,368 1.9 8.0 2.4 670
Phoenix 1,937,465 2.8 12.4 3.1 1,005
Sun City 133,419 2.8 9.3 2.3 780
Tucson 838,882 2.4 10.8 2.6 856
Arkansas
Fort Smith 303,027 3.9 12.5 2.8 877
Jonesboro 200,076 3.4 11.9 2.8 953
Little Rock 1,321,705 4.1 15.2 3.7 1,148
Springdale 295,913 2.9 13.7 3.0 862
Texarkana 245,516 4.5 14.9 3.4 1,215
California
Orange Co. 2,561,917 2.6 10.1 2.9 808
Bakersfield 753,777 2.5 12.3 3.0 984
Chico 247,777 2.3 12.9 3.6 1,032
Contra Costa Co. 776,882 2.1 9.7 2.7 837
Fresno 870,093 2.3 12.2 2.7 960
Los Angeles 8,891,233 3.0 12.4 3.2 970
Modesto 642,363 2.8 11.7 3.0 1,015
Napa 237,369 2.8 13.6 3.0 1,064
Alameda Co. 1,307,511 2.3 10.5 2.8 898
Palm Spr/Rancho Mir 214,236 2.6 12.1 2.5 1,114
Redding 291,627 2.7 12.2 3.9 1,098
Sacramento 1,826,537 2.1 10.7 2.9 866
Salinas 340,435 2.1 10.4 2.4 1,024
San Bernardino 2,052,460 2.6 11.3 3.1 891
San Diego 2,767,527 2.1 9.8 2.5 764
San Francisco 1,281,325 2.6 12.9 3.1 1,038
San Jose 1,463,526 2.1 9.3 2.7 788
San Luis Obispo 205,889 2.5 9.6 2.8 711
TABLES
Hospit
al Refe
rral R
egion
Reside
nt Pop
ulatio
n
Acute
Care Bed
s
per 1
000
Hospit
al Emplo
yees
per 1
000
Hospit
al-ba
sed R
egist
ered
Nurses
per 1
000
Expen
diture
s per
capit
a
Hospit
al Refe
rral R
egion
Reside
nt Pop
ulatio
n
Acute
Care Bed
s
per 1
000
Hospit
al Emplo
yees
per 1
000
Hospit
al-ba
sed R
egist
ered
Nurses
per 1
000
Expen
diture
s per
capit
a

162 THE DARTMOUTH ATLAS OF HEALTH CARE
Tallahassee 628,832 3.8 14.4 2.9 990
Tampa 876,408 3.1 11.9 3.2 967
Georgia
Albany 200,455 4.1 14.9 3.0 1,063
Atlanta 3,700,835 3.4 14.9 3.8 1,112
Augusta 548,493 4.2 17.3 3.8 1,278
Columbus 301,665 4.9 13.7 2.7 1,060
Macon 597,635 4.1 16.5 3.4 1,211
Rome 220,157 3.6 13.6 3.4 1,015
Savannah 601,416 3.9 16.7 3.3 1,253
Hawaii
Honolulu 1,108,229 2.4 13.6 3.1 992
Idaho
Boise 517,555 2.6 12.4 3.4 896
Idaho Falls 166,131 3.1 12.3 3.4 930
Illinois
Aurora 181,602 2.7 9.8 2.6 719
Blue Island 805,400 3.5 15.5 3.7 1,164
Chicago 2,680,712 4.6 21.0 5.0 1,475
Elgin 522,152 2.6 11.3 3.0 874
Evanston 861,134 2.8 14.1 3.8 991
Hinsdale 341,601 2.5 12.1 3.4 932
Joliet 438,832 3.8 15.8 3.6 1,107
Melrose Park 1,189,327 3.0 14.2 3.7 1,077
Peoria 601,129 3.5 16.1 3.8 1,208
Rockford 623,702 3.2 13.7 3.7 1,004
Springfield 820,868 3.8 15.6 3.4 1,095
Urbana 429,114 3.0 12.9 3.3 995
Bloomington 163,421 2.6 13.8 3.0 1,138
Indiana
Evansville 646,627 4.0 15.3 3.9 1,061
Fort Wayne 767,226 3.2 13.2 3.3 978
Gary 485,735 4.5 17.1 3.6 1,319
Indianapolis 2,324,142 3.5 17.0 4.1 1,220
Lafayette 197,673 2.8 13.7 3.4 977
Muncie 171,507 3.3 12.6 2.6 1,034
Munster 296,292 4.6 19.1 4.7 1,476
South Bend 611,180 2.9 12.6 3.6 992
Terre Haute 176,806 3.6 15.0 4.0 1,077
Iowa
Cedar Rapids 252,695 3.9 14.9 4.7 1,011
Davenport 486,583 3.9 14.0 3.8 1,072
Des Moines 928,747 3.9 15.1 3.5 1,121
Dubuque 147,879 3.4 14.0 3.9 937
Iowa City 308,514 3.5 15.3 4.2 1,122
Mason City 143,369 2.1 6.5 1.6 503
Sioux City 252,103 3.8 13.9 3.6 1,055
Waterloo 205,443 3.6 14.6 3.6 1,043
Kansas
Topeka 421,682 3.2 11.9 3.3 826
Wichita 1,169,518 4.1 14.6 3.6 1,051
Kentucky
Covington 316,933 3.3 14.7 4.0 975
Lexington 1,290,244 3.9 14.4 3.6 1,071
Louisville 1,464,748 3.8 14.5 3.8 1,104
Owensboro 131,949 4.2 15.9 3.7 1,143
Paducah 342,954 4.3 16.8 3.9 1,206
Louisiana
Alexandria 277,018 4.4 17.2 3.7 1,256
Baton Rouge 734,846 3.8 14.8 3.5 1,110
Houma 245,201 4.1 16.2 3.0 1,220
Lafayette 535,796 4.6 16.5 3.1 1,172
Lake Charles 258,157 4.6 17.3 3.5 1,261
Metairie 396,726 4.6 18.3 4.1 1,404
Monroe 266,139 5.3 24.0 4.4 1,356
New Orleans 838,284 5.2 21.2 4.4 1,646
Shreveport 646,435 4.3 15.5 3.1 1,228
Slidell 140,609 4.3 15.8 3.7 1,147
Maine
Bangor 396,634 3.3 15.5 4.1 1,066
Portland 948,869 2.9 13.2 3.3 939
Maryland
Baltimore 2,247,761 3.3 16.7 4.2 1,116
Salisbury 305,907 3.2 15.2 3.7 998
Takoma Park 778,169 2.5 10.7 3.1 703
Massachusetts
Boston 4,418,982 3.1 16.7 3.7 1,202
Springfield 727,784 2.8 13.0 3.1 953
Worcester 711,982 2.7 13.4 3.1 908
Michigan
Ann Arbor 1,192,620 2.8 14.1 3.2 1,015
Dearborn 524,139 3.5 15.8 3.4 1,085
Detroit 1,937,050 3.7 18.8 4.3 1,263
Flint 550,338 4.0 17.0 3.7 1,226
Grand Rapids 954,534 2.5 12.0 3.3 865
Kalamazoo 620,043 2.8 13.0 3.4 1,022
Lansing 647,965 3.1 15.3 3.5 1,088
Marquette 202,537 3.9 14.2 2.8 1,094
Muskegon 241,421 3.2 12.2 2.8 1,000
Petoskey 148,605 3.3 12.7 3.5 942
Pontiac 391,240 3.1 15.5 3.6 1,082
Royal Oak 650,771 2.7 17.7 4.0 1,105
Saginaw 628,840 3.6 16.3 3.6 1,147
St Joseph 145,896 3.2 16.4 3.7 1,086
Hospit
al Refe
rral R
egion
Reside
nt Pop
ulatio
n
Acute
Care Bed
s
per 1
000
Hospit
al Emplo
yees
per 1
000
Hospit
al-ba
sed R
egist
ered
Nurses
per 1
000
Expen
diture
s per
capit
a
Hospit
al Refe
rral R
egion
Reside
nt Pop
ulatio
n
Acute
Care Bed
s
per 1
000
Hospit
al Emplo
yees
per 1
000
Hospit
al-ba
sed R
egist
ered
Nurses
per 1
000
Expen
diture
s per
capit
a

163
Traverse City 177,508 3.4 15.7 3.7 1,148
Minnesota
Duluth 323,298 3.4 12.4 2.8 988
Minneapolis 2,614,660 2.8 11.2 2.8 916
Rochester 363,251 3.2 10.4 3.1 796
St Cloud 205,700 3.0 11.6 2.5 915
St Paul 840,098 2.8 11.0 2.9 982
Mississippi
Gulfport 175,723 4.5 15.5 4.7 1,190
Hattiesburg 252,292 4.8 17.2 4.0 1,190
Jackson 979,993 4.7 15.3 3.2 989
Meridian 192,396 5.0 18.4 4.3 1,252
Oxford 129,317 4.9 17.0 3.2 1,138
Tupelo 349,277 4.4 15.5 3.5 1,086
Missouri
Cape Girardeau 253,402 3.4 14.5 3.4 1,038
Columbia 587,088 3.7 15.9 3.6 1,230
Joplin 311,296 4.0 15.5 3.8 1,139
Kansas City 2,025,703 3.3 14.6 3.7 1,072
Springfield 619,065 3.4 14.5 3.7 1,010
St Louis 3,134,871 4.0 17.4 4.1 1,246
Montana
Billings 463,221 3.4 13.6 3.2 1,050
Great Falls 148,937 4.3 18.2 3.6 1,292
Missoula 288,550 3.1 13.1 3.2 1,042
Nebraska
Lincoln 508,894 3.6 12.2 2.8 909
Omaha 1,119,894 3.8 15.2 3.6 1,172
Nevada
Las Vegas 794,033 3.1 10.3 2.9 907
Reno 483,100 3.0 13.2 3.3 1,079
New Hampshire
Lebanon 363,701 3.3 14.4 3.7 1,282
Manchester 740,593 2.5 11.7 3.1 900
New Jersey
Camden 2,454,954 3.5 15.0 3.8 1,018
Hackensack 1,129,751 3.7 14.7 3.8 912
Morristown 878,642 3.1 12.6 2.8 816
New Brunswick 838,495 3.2 13.9 3.3 849
Newark 1,466,813 4.7 19.0 4.4 1,241
Paterson 364,246 3.6 15.3 3.6 946
Ridgewood 379,311 2.9 12.0 3.3 752
New Mexico
Albuquerque 1,254,781 3.1 15.5 3.9 1,205
New York
Albany 1,721,696 3.4 13.9 3.3 893
Binghamton 376,954 2.9 13.4 3.0 911
Bronx 1,211,361 4.9 26.4 5.4 1,682
Buffalo 1,437,600 3.6 16.4 3.8 979
Elmira 344,696 3.3 14.5 3.6 932
East Long Island 4,242,448 3.3 14.7 3.6 936
New York 4,568,777 4.6 22.3 4.8 1,467
Rochester 1,243,904 3.1 15.4 3.4 914
Syracuse 1,074,023 3.1 13.7 3.2 882
White Plains 1,025,646 3.5 13.9 3.8 884
North Carolina
Asheville 490,407 2.9 13.5 3.5 958
Charlotte 1,558,895 3.1 13.8 3.6 989
Durham 1,044,489 3.2 16.2 3.2 1,169
Greensboro 473,708 2.9 13.4 3.8 912
Greenville 696,239 3.3 14.0 3.7 1,024
Hickory 236,085 3.3 14.3 4.1 1,056
Raleigh 1,279,158 3.0 13.2 3.3 966
Wilmington 277,569 3.5 16.2 3.9 1,129
Winston-Salem 883,657 3.3 14.4 3.8 985
North Dakota
Bismarck 201,983 5.2 17.0 4.5 1,318
Fargo Moorhead -Mn 464,935 3.4 12.4 3.3 975
Grand Forks 179,647 4.1 15.8 3.5 1,099
Minot 127,785 4.9 16.0 3.5 1,236
Ohio
Akron 668,249 3.4 16.4 4.4 1,280
Canton 602,501 3.3 12.7 3.2 975
Cincinnati 1,509,444 3.4 16.3 4.1 1,278
Cleveland 2,086,998 3.6 16.0 3.9 1,155
Columbus 2,525,830 3.2 14.7 3.7 1,146
Dayton 1,111,678 3.6 15.9 4.2 1,123
Elyria 241,159 3.7 14.4 3.7 978
Kettering 360,768 3.1 13.4 3.6 961
Toledo 982,485 3.7 17.4 4.7 1,317
Youngstown 688,740 4.0 16.8 4.3 1,325
Oklahoma
Lawton 192,373 3.5 13.4 2.3 974
Oklahoma City 1,565,094 3.8 14.8 3.2 1,031
Tulsa 1,140,749 3.6 14.4 3.1 964
Oregon
Bend 121,666 2.9 11.9 4.2 954
Eugene 604,042 2.2 10.6 3.1 875
Medford 338,364 2.4 11.3 2.6 857
Portland 1,894,661 2.2 10.5 3.2 856
Salem 227,361 2.0 10.1 3.1 727
Pennsylvania
Allentown 985,564 3.2 13.7 3.8 918
Altoona 297,507 3.1 13.9 3.4 1,066
TABLES
Hospit
al Refe
rral R
egion
Reside
nt Pop
ulatio
n
Acute
Care Bed
s
per 1
000
Hospit
al Emplo
yees
per 1
000
Hospit
al-ba
sed R
egist
ered
Nurses
per 1
000
Expen
diture
s per
capit
a
Hospit
al Refe
rral R
egion
Reside
nt Pop
ulatio
n
Acute
Care Bed
s
per 1
000
Hospit
al Emplo
yees
per 1
000
Hospit
al-ba
sed R
egist
ered
Nurses
per 1
000
Expen
diture
s per
capit
a

164 THE DARTMOUTH ATLAS OF HEALTH CARE
Danville 536,017 3.5 14.3 3.5 1,053
Erie 732,505 4.0 14.4 3.7 1,065
Harrisburg 879,941 2.8 12.8 3.2 939
Johnstown 241,968 3.8 19.0 4.9 1,411
Lancaster 529,921 2.6 12.1 2.9 817
Philadelphia 3,921,220 3.9 17.9 4.6 1,295
Pittsburgh 3,055,252 4.0 17.5 4.5 1,315
Reading 510,057 2.9 12.6 3.1 859
Sayre 191,385 3.4 13.3 3.6 899
Scranton 300,457 3.3 13.9 3.6 1,025
Wilkes-Barre 258,306 3.7 13.7 3.5 975
York 340,946 2.4 12.6 2.9 879
Rhode Island
Providence 1,151,761 2.8 13.5 3.1 896
South Carolina
Charleston 742,214 3.6 15.5 4.0 1,303
Columbia 980,780 3.2 14.4 3.8 1,077
Florence 333,436 3.9 16.8 3.8 1,326
Greenville 682,364 2.7 11.9 2.8 1,038
Spartanburg 306,233 3.8 14.8 3.5 1,100
South Dakota
Rapid City 184,008 4.1 16.4 3.5 1,231
Sioux Falls 699,852 4.2 13.7 3.7 1,079
Tennessee
Chattanooga 563,958 3.5 15.6 4.3 1,231
Jackson 287,699 4.0 13.9 3.3 1,038
Johnson City 217,622 4.0 13.8 3.5 1,127
Kingsport 464,124 4.2 15.7 3.5 1,250
Knoxville 1,067,260 3.8 16.0 3.5 1,225
Memphis 1,597,501 4.2 16.5 3.6 1,247
Nashville 1,944,017 4.1 15.1 3.7 1,230
Texas
Abilene 278,103 3.4 13.5 3.1 975
Amarillo 386,240 4.1 15.2 3.7 1,128
Austin 870,567 2.3 9.0 2.3 750
Beaumont 425,872 4.7 17.6 3.7 1,299
Bryan 184,248 2.4 9.8 2.1 903
Corpus Christi 492,319 3.7 15.4 3.0 1,076
Dallas 3,070,082 3.3 13.7 3.6 1,047
El Paso 811,036 2.9 12.0 2.9 1,034
Fort Worth 1,429,666 3.0 13.0 3.4 1,070
Harlingen 377,065 3.2 12.5 2.5 1,037
Houston 4,195,450 4.2 17.3 4.2 1,354
Longview 182,480 2.8 12.5 3.5 930
Lubbock 634,031 4.8 15.8 3.4 1,293
McAllen 324,820 2.7 9.3 2.7 843
Odessa 306,783 3.5 13.8 3.6 1,072
San Angelo 150,062 4.0 15.3 3.3 1,086
San Antonio 1,795,095 3.0 12.4 2.9 933
Temple 323,119 2.6 11.9 2.4 729
Tyler 425,534 3.4 15.1 3.3 1,180
Victoria 133,472 4.5 15.1 3.1 1,039
Waco 279,913 2.9 10.7 2.3 807
Wichita Falls 194,271 3.7 12.3 2.3 868
Utah
Ogden 307,965 3.0 13.7 3.4 977
Provo 312,598 2.7 12.6 3.1 1,026
Salt Lake City 1,376,597 2.8 15.7 4.0 1,069
Vermont
Burlington 593,348 3.2 13.6 3.4 948
Virginia
Arlington 1,516,813 2.2 9.1 2.5 651
Charlottesville 431,219 3.0 16.3 4.4 1,159
Lynchburg 213,943 2.8 11.9 3.2 833
Newport News 470,475 3.1 12.0 2.7 886
Norfolk 1,124,582 3.1 13.1 3.5 947
Richmond 1,247,486 3.5 14.5 3.8 1,028
Roanoke 655,809 3.7 15.1 3.5 1,105
Winchester 294,525 3.3 14.5 3.6 897
Washington
Everett 430,246 2.0 9.6 2.7 823
Olympia 264,075 2.6 10.2 2.6 920
Seattle 2,151,656 2.2 11.1 2.9 914
Spokane 1,083,197 3.0 11.2 3.0 915
Tacoma 589,030 2.3 11.6 2.3 911
Yakima 224,261 2.6 11.4 3.3 951
West Virginia
Charleston 856,149 4.1 15.8 3.7 1,257
Huntington 349,438 4.2 15.0 4.1 1,161
Morgantown 376,117 3.3 15.2 3.7 1,238
Wisconsin
Appleton 269,657 2.9 11.2 2.7 847
Green Bay 446,098 2.7 11.9 3.1 890
La Crosse 320,536 3.0 11.6 3.1 840
Madison 875,793 2.9 12.8 3.3 992
Marshfield 342,484 3.4 11.0 2.8 922
Milwaukee 2,326,759 3.0 13.6 3.6 1,042
Neenah 201,177 3.2 13.2 3.3 946
Wausau 167,971 3.0 11.8 2.9 895
Wyoming
Casper 164,307 5.0 16.6 4.6 1127
United States
US 248,652,605 3.3 14.3 3.5 1,053
Hospit
al Refe
rral R
egion
Reside
nt Pop
ulatio
n
Acute
Care Bed
s
per 1
000
Hospit
al Emplo
yees
per 1
000
Hospit
al-ba
sed R
egist
ered
Nurses
per 1
000
Expen
diture
s per
capit
a
Hospit
al Refe
rral R
egion
Reside
nt Pop
ulatio
n
Acute
Care Bed
s
per 1
000
Hospit
al Emplo
yees
per 1
000
Hospit
al-ba
sed R
egist
ered
Nurses
per 1
000
Expen
diture
s per
capit
a

165TABLES
*All rates are age and sex adjusted and corrected for
out of area use. Expenditures per capita are also price
adjusted. Estimates for numbers of hospital employ-
ees and hospital-based registered nurses are for full
time equivalents. See Part Nine, Section 2 for details
on the methods used for estimating populations and
adjusting rates, and for other details concerning the
rates in this table.
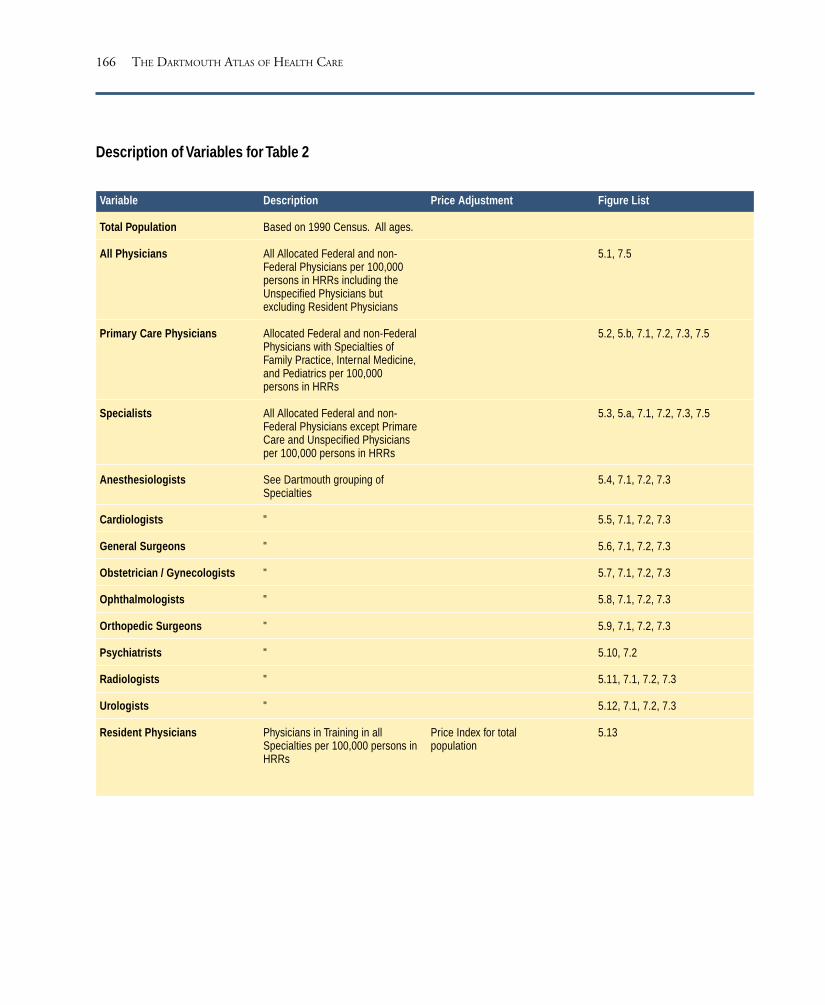
166 THE DARTMOUTH ATLAS OF HEALTH CARE
Description of Variables for Table 2
Figure List
5.1, 7.5
5.2, 5.b, 7.1, 7.2, 7.3, 7.5
5.3, 5.a, 7.1, 7.2, 7.3, 7.5
5.4, 7.1, 7.2, 7.3
5.5, 7.1, 7.2, 7.3
5.6, 7.1, 7.2, 7.3
5.7, 7.1, 7.2, 7.3
5.8, 7.1, 7.2, 7.3
5.9, 7.1, 7.2, 7.3
5.10, 7.2
5.11, 7.1, 7.2, 7.3
5.12, 7.1, 7.2, 7.3
5.13
Price Adjustment
Price Index for totalpopulation
Description
Based on 1990 Census. All ages.
All Allocated Federal and non-Federal Physicians per 100,000persons in HRRs including theUnspecified Physicians butexcluding Resident Physicians
Allocated Federal and non-FederalPhysicians with Specialties ofFamily Practice, Internal Medicine,and Pediatrics per 100,000persons in HRRs
All Allocated Federal and non-Federal Physicians except PrimareCare and Unspecified Physiciansper 100,000 persons in HRRs
See Dartmouth grouping ofSpecialties
"
"
"
"
"
"
"
"
Physicians in Training in allSpecialties per 100,000 persons inHRRs
Variable
Total Population
All Physicians
Primary Care Physicians
Specialists
Anesthesiologists
Cardiologists
General Surgeons
Obstetrician / Gynecologists
Ophthalmologists
Orthopedic Surgeons
Psychiatrists
Radiologists
Urologists
Resident Physicians

167
TABLE TWO
Clinically Active Physician Workforce Serving Residents of Hospital Referral Regions
(Physicians per 100,000 Residents, 1993)*
Alabama
Birmingham 1,983,947 154.9 55.4 98.2 7.5 4.8 10.0 10.2 4.3 5.8 6.4 8.2 3.2 35.9
Dothan 328,197 137.6 52.1 84.4 6.1 3.5 9.4 10.5 5.6 6.0 4.6 5.9 3.3 9.6
Huntsville 472,826 138.4 52.6 85.5 7.1 2.7 8.5 10.8 2.9 5.8 6.0 6.3 2.9 15.5
Mobile 680,935 160.0 52.3 106.5 8.0 4.0 10.5 14.2 4.6 7.5 7.1 8.2 2.8 33.7
Montgomery 398,081 139.4 49.1 89.6 5.8 3.7 11.2 10.7 4.5 5.6 5.5 5.8 3.3 8.8
Tuscaloosa 228,294 148.3 55.4 90.6 5.0 3.3 9.4 8.5 3.7 5.1 11.8 7.5 2.8 22.7
Alaska
Anchorage 546,182 183.0 76.0 105.4 8.0 3.7 10.0 8.7 7.0 10.8 10.6 6.7 3.1 12.2
Arizona
Mesa 683,368 145.5 50.2 94.1 10.1 4.5 7.1 10.8 5.1 5.7 7.2 6.2 2.7 17.6
Phoenix 1,937,465 188.5 63.1 124.3 12.3 5.8 8.6 12.3 6.0 8.0 10.7 8.8 2.7 24.9
Sun City 133,419 256.2 80.0 174.5 16.9 5.2 13.1 25.6 8.9 15.2 13.2 11.4 3.5 25.0
Tucson 838,882 205.1 66.7 136.8 12.4 5.3 9.6 13.4 6.2 8.5 14.5 10.8 3.0 44.1
Arkansas
Fort Smith 303,027 137.6 55.4 80.6 9.0 4.5 7.9 8.5 3.0 6.3 3.0 6.7 3.1 8.3
Jonesboro 200,076 130.0 53.2 75.8 5.3 2.9 8.0 8.8 3.5 5.3 4.8 7.0 3.4 14.2
Little Rock 1,321,705 159.8 58.7 99.0 7.4 3.9 8.6 9.5 5.5 6.7 9.3 8.0 2.8 34.8
Springdale 295,913 151.2 60.5 90.0 6.6 2.9 10.1 8.0 4.7 6.8 8.6 8.6 3.5 13.1
Texarkana 245,516 129.7 48.6 80.7 6.8 2.9 6.8 11.2 4.0 5.2 5.1 8.7 2.7 9.5
California
Orange Co. 2,561,917 215.2 71.8 141.3 13.0 7.6 9.5 14.2 6.9 10.2 12.3 9.6 3.4 26.2
Bakersfield 753,777 154.7 55.4 98.2 9.8 4.5 8.0 11.4 6.6 6.8 6.1 7.2 2.8 15.2
Chico 247,777 182.3 59.5 122.0 11.4 4.0 9.5 13.4 6.4 9.5 7.8 11.3 3.6 9.0
Contra Costa Co. 776,882 232.0 76.2 153.8 12.7 5.8 11.7 16.0 7.4 8.9 16.5 11.9 4.4 27.2
Fresno 870,093 159.3 57.3 100.6 10.0 4.8 10.6 9.9 5.7 5.7 8.3 7.9 2.3 20.4
Los Angeles 8,891,233 209.5 70.9 136.2 10.9 7.6 9.2 12.1 6.9 7.8 15.7 9.0 3.6 36.2
Modesto 642,363 161.2 56.9 103.0 10.8 4.6 9.5 11.4 5.2 7.2 6.3 7.7 2.8 13.9
Napa 237,369 264.3 90.9 170.8 12.7 5.4 16.0 17.7 7.6 12.4 29.7 15.7 4.2 14.5
Alameda Co. 1,307,511 244.2 86.8 154.9 10.3 6.3 9.6 14.0 7.7 8.9 20.4 11.2 3.6 31.7
Palm Spr/Rancho Mir. 214,236 229.4 63.7 163.6 15.0 6.9 10.1 18.9 5.4 13.5 14.4 12.5 3.9 22.0
Redding 291,627 199.9 75.4 121.1 12.4 2.4 9.2 11.0 6.6 10.9 7.8 11.1 3.9 12.0
Sacramento 1,826,537 193.8 68.0 123.8 11.2 5.1 8.5 12.9 6.5 9.1 11.1 8.9 3.1 29.0
Salinas 340,435 186.7 59.5 126.2 9.5 5.3 10.8 11.6 8.4 9.8 12.3 8.4 4.6 18.4
San Bernardino 2,052,460 157.6 55.0 101.0 8.8 4.7 8.4 10.5 4.9 7.1 8.8 7.2 3.0 25.5
San Diego 2,767,527 206.0 65.3 138.1 12.9 6.3 8.1 11.6 7.4 9.4 14.9 8.8 3.9 32.0
San Francisco 1,281,325 317.2 116.6 196.8 13.1 8.9 11.4 12.6 8.3 10.7 38.4 14.2 3.6 65.3
San Jose 1,463,526 200.4 71.0 127.1 9.3 7.2 8.9 14.6 6.8 8.4 12.8 7.5 3.5 28.3
San Luis Obispo 205,889 242.4 82.2 159.0 13.0 5.9 11.2 12.8 8.1 11.9 29.3 13.3 3.0 7.4
Hospit
al Refe
rral R
egion
Reside
nt Pop
ulatio
n
All Phy
sician
s
Primary
Care
Physic
ians
Specia
lists
Anesth
esiol
ogist
s
Cardiol
ogist
s
Genera
l Surg
eons
Obstet
rician
/
Gynec
ologis
ts
Ophtha
lmolo
gists
Orthop
edic
Surgeo
ns
Psych
iatris
ts
Radiol
ogist
s
Urolog
ists
Reside
nt Phy
sician
s
TABLES

168 THE DARTMOUTH ATLAS OF HEALTH CARE
San Mateo Co. 723,533 241.9 79.6 160.1 11.2 8.2 9.0 12.9 7.2 8.4 26.7 10.7 2.9 49.9
Santa Barbara 374,609 219.9 72.3 146.3 12.2 7.3 11.3 11.9 7.4 10.6 16.4 10.9 4.1 15.2
Santa Cruz 240,944 209.6 64.5 142.7 13.9 4.9 8.3 14.9 7.1 9.5 14.3 8.0 5.0 12.0
Santa Rosa 393,669 241.3 93.6 145.5 12.9 5.7 9.0 13.2 7.8 12.3 19.5 10.5 4.1 19.2
Stockton 413,152 159.3 56.6 101.1 10.1 6.7 7.9 11.9 5.1 7.3 7.9 6.9 2.5 15.3
Ventura 700,513 200.3 68.1 130.3 11.2 6.2 8.7 12.1 7.1 9.9 15.3 7.8 3.7 14.9
Colorado
Boulder 212,469 217.7 77.4 139.0 12.5 3.8 8.3 11.9 8.3 9.5 19.8 6.6 2.9 16.7
Colorado Springs 561,723 180.5 63.1 116.4 8.7 4.6 10.5 11.0 6.6 9.9 10.8 7.3 3.4 11.2
Denver 1,904,201 217.6 74.6 141.3 11.6 6.2 8.5 13.0 7.6 9.1 16.5 9.8 3.1 49.0
Fort Collins 238,089 170.2 63.3 106.5 9.7 4.9 8.4 8.6 8.7 8.1 8.8 6.9 4.4 15.7
Grand Junction 201,585 187.1 75.5 109.6 14.1 1.7 11.0 8.0 6.5 12.5 7.6 8.4 3.4 12.6
Greeley 227,007 181.5 67.2 113.6 10.8 3.5 12.0 12.0 7.3 9.9 6.5 7.3 4.1 17.5
Pueblo 133,475 186.7 68.1 117.8 8.9 3.2 9.3 11.2 7.3 9.8 13.2 6.2 2.6 15.7
Connecticut
Bridgeport 629,535 239.1 75.4 162.3 10.7 6.1 10.5 18.3 8.9 9.3 22.5 10.5 3.9 44.5
Hartford 1,393,087 214.7 67.6 145.2 11.6 6.9 9.9 14.8 6.7 9.0 22.3 11.0 3.3 45.6
New Haven 1,349,858 231.2 73.8 155.4 10.9 7.0 10.3 14.2 7.5 8.9 25.2 10.7 3.4 61.0
Delaware
Wilmington 635,637 198.2 69.6 127.4 7.9 6.4 10.3 11.2 6.1 6.6 14.3 10.2 3.1 33.9
District of Columbia
Washington 2,153,979 291.1 89.6 198.9 12.7 9.2 12.6 17.5 9.6 8.7 29.5 12.5 5.0 68.7
Florida
Bradenton 197,705 167.6 48.3 117.3 10.5 6.0 8.2 15.1 4.7 6.5 9.1 8.3 2.5 12.1
Clearwater 450,255 192.5 64.4 126.7 9.5 4.3 7.0 13.9 5.0 8.1 11.8 11.7 2.8 19.2
Fort Lauderdale 1,927,706 227.8 72.4 154.0 11.8 7.2 9.9 18.8 7.2 9.8 13.0 10.6 4.2 18.5
Fort Myers 627,321 191.3 58.9 131.0 10.4 4.8 9.3 18.4 5.7 8.1 9.9 10.8 3.1 12.5
Gainesville 407,508 201.8 66.1 133.0 12.6 6.4 9.0 9.7 5.0 7.0 13.7 11.5 3.6 92.6
Hudson 287,224 181.1 60.5 119.3 8.4 5.5 8.2 15.5 4.8 8.6 10.1 9.5 3.2 18.4
Jacksonville 1,137,244 186.0 62.2 122.5 10.7 7.5 9.7 11.8 5.6 6.9 8.8 9.0 3.8 29.2
Lakeland 279,997 139.3 46.1 92.2 8.4 4.5 7.9 11.3 4.3 5.1 6.8 6.5 2.4 12.2
Miami 2,365,502 237.8 83.0 151.5 11.3 10.1 11.4 13.9 7.9 7.4 16.7 9.9 4.2 42.7
Ocala 292,949 163.9 47.4 115.0 10.0 4.8 8.3 14.3 4.0 6.5 10.9 11.4 3.2 21.6
Orlando 2,251,255 169.1 56.6 111.4 9.9 5.4 8.2 13.6 5.1 8.2 7.6 8.8 3.8 15.0
Ormond Beach 268,338 162.4 56.9 104.4 8.6 3.5 7.4 11.0 5.4 9.5 8.6 9.4 2.9 13.6
Panama City 161,325 149.2 53.1 95.4 6.0 3.0 10.1 10.7 5.3 5.6 7.7 7.0 4.2 7.3
Pensacola 588,018 170.1 54.7 114.2 9.5 4.2 10.6 11.9 6.3 7.3 8.6 9.6 2.6 24.4
Sarasota 317,728 216.5 65.3 149.3 13.2 6.5 9.2 17.5 6.9 9.7 15.2 11.3 4.3 13.9
St Petersburg 401,404 201.1 67.2 132.3 10.9 5.5 7.8 13.8 5.2 8.2 9.8 11.8 3.0 27.5
Tallahassee 628,832 152.2 56.9 94.4 7.7 3.3 9.6 9.6 4.9 5.1 10.3 7.3 3.2 11.6
Tampa 876,408 185.1 60.4 123.3 9.2 6.4 7.3 11.5 5.9 6.7 12.2 9.8 3.3 38.4
Georgia
Albany 200,455 120.3 39.1 80.2 5.7 2.7 7.4 11.2 3.3 5.1 5.2 7.0 3.4 6.8
Atlanta 3,700,835 178.7 58.3 119.3 10.2 6.0 9.3 13.7 5.8 7.1 10.5 8.1 4.0 28.1
Augusta 548,493 201.5 64.9 134.5 8.1 6.7 11.0 12.8 4.9 6.2 16.3 10.3 3.4 72.6
Columbus 301,665 137.7 49.6 86.8 6.5 3.4 6.8 9.6 3.7 9.2 9.2 7.1 3.0 21.9
Hospit
al Refe
rral R
egion
Reside
nt Pop
ulatio
n
All Phy
sician
s
Primary
Care
Physic
ians
Specia
lists
Anesth
esiol
ogist
s
Cardiol
ogist
s
Genera
l Surg
eons
Obstet
rician
/
Gynec
ologis
ts
Ophtha
lmolo
gists
Orthop
edic
Surgeo
ns
Psych
iatris
ts
Radiol
ogist
s
Urolog
ists
Reside
nt Phy
sician
s

169
Macon 597,635 164.1 56.2 106.4 9.8 3.1 11.6 14.0 5.1 6.4 8.9 8.3 3.4 21.2
Rome 220,157 151.5 59.1 90.9 8.1 3.6 10.2 13.3 4.3 4.6 5.0 8.2 3.3 19.0
Savannah 601,416 158.1 53.2 103.8 8.3 3.4 11.5 14.3 4.8 6.5 8.0 7.6 3.8 22.7
Hawaii
Honolulu 1,108,229 214.2 77.7 134.6 10.1 5.1 11.4 14.7 7.6 7.1 15.9 8.6 3.2 38.2
Idaho
Boise 517,555 160.8 54.3 106.0 8.3 2.9 9.9 10.9 5.4 9.2 8.4 8.0 3.5 14.8
Idaho Falls 166,131 131.3 41.7 87.9 9.0 3.3 9.8 11.2 5.5 7.9 6.1 6.0 1.8 8.4
Illinois
Aurora 181,602 137.4 49.5 87.7 6.4 4.0 10.3 8.3 5.0 8.1 5.5 5.2 3.7 11.9
Blue Island 805,400 182.1 64.3 115.9 11.2 6.9 10.4 14.3 5.1 6.6 8.7 7.9 2.7 37.1
Chicago 2,680,712 227.5 85.9 139.3 9.6 8.2 10.1 13.3 6.0 5.5 20.0 8.9 2.8 98.7
Elgin 522,152 151.0 53.0 96.4 10.1 4.5 8.2 10.3 6.6 6.1 8.5 4.7 3.0 17.9
Evanston 861,134 245.9 84.3 159.4 15.2 7.3 10.0 18.3 7.1 9.2 18.3 11.9 3.7 51.8
Hinsdale 341,601 219.7 73.9 143.9 20.4 7.6 8.9 12.2 5.9 5.9 11.6 12.7 4.1 41.9
Joliet 438,832 152.2 52.5 98.9 10.7 4.7 10.0 12.4 4.2 5.4 7.8 6.1 2.7 17.9
Melrose Park 1,189,327 213.8 77.9 133.9 11.7 7.2 9.9 14.3 6.7 6.9 11.1 8.6 3.6 63.7
Peoria 601,129 147.9 50.3 97.0 8.8 4.7 8.5 9.9 3.7 5.0 5.9 9.0 2.9 22.9
Rockford 623,702 153.1 54.3 98.0 10.1 4.3 8.7 10.3 4.9 6.3 7.0 6.7 3.0 13.2
Springfield 820,868 137.2 50.5 85.7 7.2 3.5 8.4 8.6 4.2 4.9 5.5 7.7 2.5 22.0
Urbana 429,114 147.0 56.2 90.4 6.9 3.9 8.4 8.3 3.6 5.0 9.2 6.4 3.0 17.1
Bloomington 163,421 139.6 48.8 90.6 8.6 4.7 9.1 7.6 7.0 4.3 4.8 7.4 2.3 9.1
Indiana
Evansville 646,627 135.3 53.7 80.8 7.8 3.7 7.4 8.3 2.9 5.4 6.4 6.8 2.8 9.4
Fort Wayne 767,226 126.1 48.5 76.8 7.7 4.1 8.3 6.4 3.7 5.8 4.8 7.6 2.5 9.0
Gary 485,735 148.6 52.9 94.6 9.3 5.4 8.5 9.4 4.6 5.3 6.0 8.3 2.1 10.4
Indianapolis 2,324,142 164.7 59.2 104.8 10.8 5.4 8.3 9.2 4.6 6.2 9.0 8.1 2.8 39.4
Lafayette 197,673 139.3 49.9 87.7 10.5 3.9 5.7 6.7 3.9 5.2 7.7 5.9 2.2 11.5
Muncie 171,507 138.8 50.4 87.2 10.4 2.7 7.4 6.9 4.6 6.1 4.1 6.5 3.0 27.6
Munster 296,292 162.9 56.7 104.8 9.2 4.6 10.1 12.1 5.6 6.2 7.0 8.0 2.8 16.5
South Bend 611,180 141.2 54.3 86.4 10.2 2.7 8.4 8.7 3.9 5.7 6.4 7.3 2.5 12.6
Terre Haute 176,806 134.1 50.2 83.6 9.7 3.6 8.0 9.2 5.0 4.9 7.3 6.1 3.3 16.1
Iowa
Cedar Rapids 252,695 141.3 53.1 87.8 9.2 2.6 5.7 6.1 4.7 7.3 8.9 7.0 2.2 24.8
Davenport 486,583 148.4 52.6 94.7 9.0 3.1 8.5 10.5 6.3 6.6 6.4 7.1 2.7 21.4
Des Moines 928,747 150.2 61.7 87.8 9.0 3.9 8.5 7.9 4.1 5.1 5.9 7.3 2.3 20.7
Dubuque 147,879 141.8 50.3 90.8 5.0 2.4 8.7 7.9 6.8 6.8 5.0 7.4 2.6 16.9
Iowa City 308,514 169.1 59.0 109.3 9.7 4.7 7.9 9.0 5.7 5.5 8.4 10.5 3.1 107.8
Mason City 143,369 140.2 63.0 76.3 5.6 2.8 8.0 6.8 3.5 6.3 5.6 6.9 2.6 28.2
Sioux City 252,103 119.0 49.7 68.1 5.6 3.1 7.7 5.4 2.7 5.0 7.1 5.1 2.7 18.2
Waterloo 205,443 142.6 57.4 85.0 10.3 2.9 7.3 7.8 4.3 5.7 8.3 5.5 2.5 25.5
Kansas
Topeka 421,682 154.3 54.2 99.0 5.1 3.4 6.8 8.2 4.2 5.9 21.7 7.9 2.8 17.1
Wichita 1,169,518 142.9 62.0 80.2 6.7 3.5 8.8 7.8 3.5 5.4 6.8 7.8 2.6 20.3
Kentucky
Covington 316,933 154.6 57.3 96.6 9.2 2.8 7.7 13.2 3.5 6.7 9.2 6.4 3.4 33.5
Hospit
al Refe
rral R
egion
Reside
nt Pop
ulatio
n
All Phy
sician
s
Primary
Care
Physic
ians
Specia
lists
Anesth
esiol
ogist
s
Cardiol
ogist
s
Genera
l Surg
eons
Obstet
rician
/
Gynec
ologis
ts
Ophtha
lmolo
gists
Orthop
edic
Surgeo
ns
Psych
iatris
ts
Radiol
ogist
s
Urolog
ists
Reside
nt Phy
sician
s
TABLES

170 THE DARTMOUTH ATLAS OF HEALTH CARE
Lexington 1,290,244 155.5 60.4 93.6 7.2 4.2 9.6 9.4 4.6 4.7 8.7 7.9 3.1 33.0
Louisville 1,464,748 167.6 59.8 106.4 10.9 4.6 10.4 10.0 4.6 6.4 10.4 8.0 2.9 32.6
Owensboro 131,949 132.4 46.5 85.8 8.8 3.7 10.0 8.6 3.5 6.5 5.6 5.8 3.8 8.4
Paducah 342,954 129.8 46.4 82.4 5.5 2.4 9.6 11.0 3.6 5.5 3.4 8.2 3.2 13.4
Louisiana
Alexandria 277,018 142.6 50.1 90.7 6.0 5.1 11.5 10.8 5.7 5.5 8.8 5.0 3.4 12.6
Baton Rouge 734,846 152.3 55.2 96.8 7.1 4.5 9.0 11.3 6.2 5.8 6.1 6.0 3.3 15.3
Houma 245,201 122.9 36.3 85.9 5.4 6.7 11.3 10.4 4.6 6.6 4.5 4.5 5.0 15.2
Lafayette 535,796 136.4 49.8 85.7 6.6 2.9 9.4 11.4 5.1 5.8 4.6 7.1 3.4 9.1
Lake Charles 258,157 121.5 41.8 78.9 3.9 4.0 6.6 12.0 4.8 6.5 3.3 6.8 2.7 12.9
Metairie 396,726 231.3 65.8 164.7 12.3 7.1 14.2 19.7 11.1 7.4 16.0 10.8 4.7 67.7
Monroe 266,139 133.3 48.5 83.3 7.3 2.1 7.7 9.6 3.6 5.5 4.3 6.6 3.1 8.9
New Orleans 838,284 223.8 61.1 161.0 9.6 8.4 11.9 13.7 8.5 9.5 19.1 12.1 4.5 76.7
Shreveport 646,435 151.1 49.4 100.6 8.9 4.7 9.2 11.5 4.6 6.8 5.9 7.2 3.8 38.8
Slidell 140,609 162.7 47.5 114.8 12.9 5.0 10.4 15.6 6.3 7.5 9.2 7.1 3.6 20.3
Maine
Bangor 396,634 169.8 69.0 100.4 7.8 3.3 11.4 10.5 5.3 7.6 9.3 7.9 2.5 12.6
Portland 948,869 197.4 72.6 124.2 9.2 5.1 10.7 11.7 5.2 10.0 13.9 9.0 2.6 22.8
Maryland
Baltimore 2,247,761 251.0 82.6 166.9 13.0 8.0 13.5 17.7 7.7 8.3 22.1 11.3 3.5 78.4
Salisbury 305,907 181.9 60.8 120.5 10.3 6.4 12.0 14.4 6.5 8.2 9.3 8.9 3.6 15.7
Takoma Park 778,169 268.7 89.4 175.6 11.7 9.6 13.1 17.7 8.7 7.9 20.3 11.2 5.4 94.0
Massachusetts
Boston 4,418,982 256.0 82.9 171.0 12.0 8.2 11.3 14.0 6.9 8.7 30.5 13.0 3.1 77.1
Springfield 727,784 193.7 67.3 125.5 10.7 5.9 11.2 12.0 5.6 7.1 16.0 9.4 2.9 30.7
Worcester 711,982 210.7 79.9 129.3 10.3 7.8 9.0 11.1 5.2 7.6 14.6 9.0 3.3 62.6
Michigan
Ann Arbor 1,192,620 195.0 66.6 126.9 8.0 7.1 9.1 10.7 5.8 4.9 18.6 10.6 3.5 78.8
Dearborn 524,139 174.9 64.2 109.6 7.6 4.8 9.0 14.7 6.2 5.8 9.1 8.7 3.1 56.5
Detroit 1,937,050 176.2 61.7 113.4 6.9 5.7 9.7 12.7 5.3 5.2 9.7 9.0 2.5 61.4
Flint 550,338 159.0 70.0 87.3 7.9 4.6 9.8 8.0 4.9 3.4 5.9 8.2 2.5 47.2
Grand Rapids 954,534 147.7 54.6 92.5 7.6 2.6 8.9 10.0 4.8 6.5 7.2 6.9 2.9 32.8
Kalamazoo 620,043 165.8 61.3 103.3 7.0 4.7 10.3 9.7 4.5 6.1 11.0 7.1 2.6 19.0
Lansing 647,965 165.4 65.8 98.4 7.9 5.0 7.6 9.5 4.4 6.4 9.1 7.6 2.7 41.5
Marquette 202,537 157.1 61.1 95.3 5.5 3.8 11.4 11.6 4.4 5.7 6.4 7.8 2.4 18.3
Muskegon 241,421 155.0 60.4 94.1 8.2 3.1 6.8 8.1 4.8 7.1 6.6 7.3 3.4 14.2
Petoskey 148,605 165.8 64.9 99.6 8.0 3.5 11.0 8.9 4.1 7.2 6.5 8.0 3.5 10.9
Pontiac 391,240 204.1 69.2 134.1 10.8 6.4 11.1 13.2 5.6 5.1 18.0 11.1 2.8 58.2
Royal Oak 650,771 254.2 88.3 164.6 9.1 7.7 10.2 17.0 7.5 6.9 22.8 14.0 3.2 88.5
Saginaw 628,840 148.7 58.7 89.2 8.9 3.8 9.4 9.5 4.5 5.0 5.3 8.1 2.9 21.2
St Joseph 145,896 155.6 55.1 98.4 9.2 7.4 12.1 10.1 4.9 6.2 8.0 9.2 2.0 12.3
Traverse City 177,508 192.0 71.9 119.2 9.1 3.6 11.7 11.0 5.0 7.4 12.6 11.7 2.9 14.7
Minnesota
Duluth 323,298 165.9 71.4 93.0 6.3 2.7 8.9 8.2 4.9 6.3 7.3 6.8 2.8 17.3
Minneapolis 2,614,660 172.6 70.9 100.6 7.6 4.1 7.8 8.9 5.5 7.0 9.5 7.5 2.6 33.9
Rochester 363,251 218.7 78.3 139.7 8.0 12.0 7.5 7.6 4.7 6.4 9.4 11.8 2.3 113.0
Hospit
al Refe
rral R
egion
Reside
nt Pop
ulatio
n
All Phy
sician
s
Primary
Care
Physic
ians
Specia
lists
Anesth
esiol
ogist
s
Cardiol
ogist
s
Genera
l Surg
eons
Obstet
rician
/
Gynec
ologis
ts
Ophtha
lmolo
gists
Orthop
edic
Surgeo
ns
Psych
iatris
ts
Radiol
ogist
s
Urolog
ists
Reside
nt Phy
sician
s
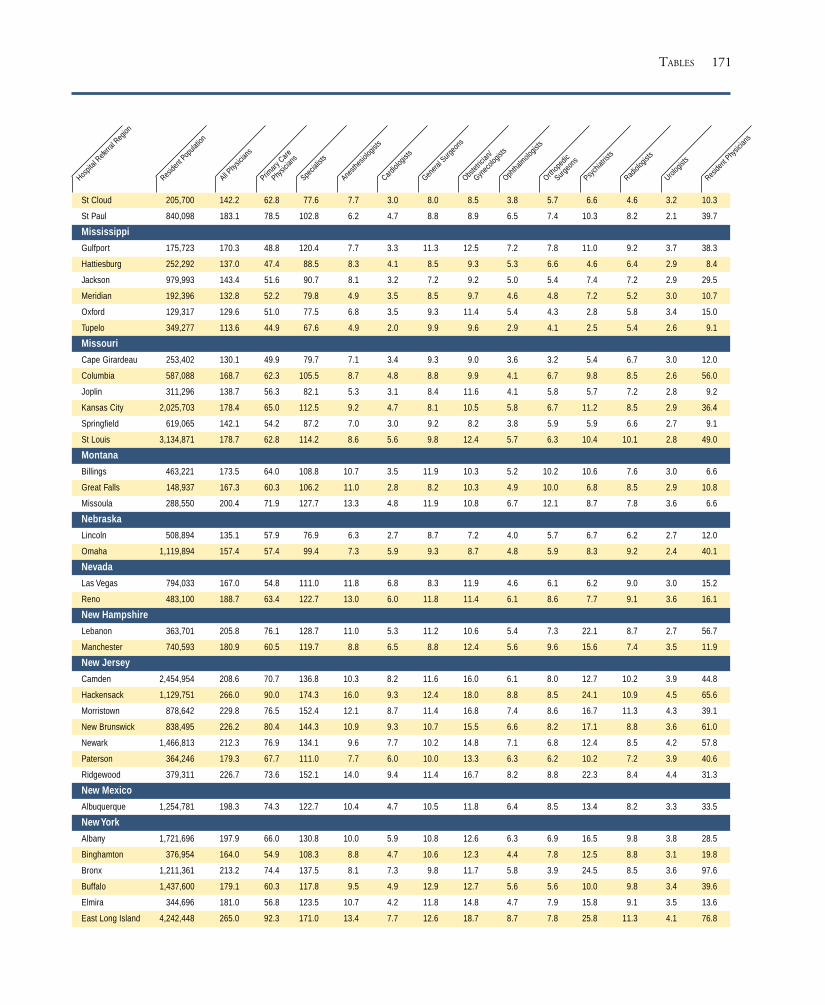
171
St Cloud 205,700 142.2 62.8 77.6 7.7 3.0 8.0 8.5 3.8 5.7 6.6 4.6 3.2 10.3
St Paul 840,098 183.1 78.5 102.8 6.2 4.7 8.8 8.9 6.5 7.4 10.3 8.2 2.1 39.7
Mississippi
Gulfport 175,723 170.3 48.8 120.4 7.7 3.3 11.3 12.5 7.2 7.8 11.0 9.2 3.7 38.3
Hattiesburg 252,292 137.0 47.4 88.5 8.3 4.1 8.5 9.3 5.3 6.6 4.6 6.4 2.9 8.4
Jackson 979,993 143.4 51.6 90.7 8.1 3.2 7.2 9.2 5.0 5.4 7.4 7.2 2.9 29.5
Meridian 192,396 132.8 52.2 79.8 4.9 3.5 8.5 9.7 4.6 4.8 7.2 5.2 3.0 10.7
Oxford 129,317 129.6 51.0 77.5 6.8 3.5 9.3 11.4 5.4 4.3 2.8 5.8 3.4 15.0
Tupelo 349,277 113.6 44.9 67.6 4.9 2.0 9.9 9.6 2.9 4.1 2.5 5.4 2.6 9.1
Missouri
Cape Girardeau 253,402 130.1 49.9 79.7 7.1 3.4 9.3 9.0 3.6 3.2 5.4 6.7 3.0 12.0
Columbia 587,088 168.7 62.3 105.5 8.7 4.8 8.8 9.9 4.1 6.7 9.8 8.5 2.6 56.0
Joplin 311,296 138.7 56.3 82.1 5.3 3.1 8.4 11.6 4.1 5.8 5.7 7.2 2.8 9.2
Kansas City 2,025,703 178.4 65.0 112.5 9.2 4.7 8.1 10.5 5.8 6.7 11.2 8.5 2.9 36.4
Springfield 619,065 142.1 54.2 87.2 7.0 3.0 9.2 8.2 3.8 5.9 5.9 6.6 2.7 9.1
St Louis 3,134,871 178.7 62.8 114.2 8.6 5.6 9.8 12.4 5.7 6.3 10.4 10.1 2.8 49.0
Montana
Billings 463,221 173.5 64.0 108.8 10.7 3.5 11.9 10.3 5.2 10.2 10.6 7.6 3.0 6.6
Great Falls 148,937 167.3 60.3 106.2 11.0 2.8 8.2 10.3 4.9 10.0 6.8 8.5 2.9 10.8
Missoula 288,550 200.4 71.9 127.7 13.3 4.8 11.9 10.8 6.7 12.1 8.7 7.8 3.6 6.6
Nebraska
Lincoln 508,894 135.1 57.9 76.9 6.3 2.7 8.7 7.2 4.0 5.7 6.7 6.2 2.7 12.0
Omaha 1,119,894 157.4 57.4 99.4 7.3 5.9 9.3 8.7 4.8 5.9 8.3 9.2 2.4 40.1
Nevada
Las Vegas 794,033 167.0 54.8 111.0 11.8 6.8 8.3 11.9 4.6 6.1 6.2 9.0 3.0 15.2
Reno 483,100 188.7 63.4 122.7 13.0 6.0 11.8 11.4 6.1 8.6 7.7 9.1 3.6 16.1
New Hampshire
Lebanon 363,701 205.8 76.1 128.7 11.0 5.3 11.2 10.6 5.4 7.3 22.1 8.7 2.7 56.7
Manchester 740,593 180.9 60.5 119.7 8.8 6.5 8.8 12.4 5.6 9.6 15.6 7.4 3.5 11.9
New Jersey
Camden 2,454,954 208.6 70.7 136.8 10.3 8.2 11.6 16.0 6.1 8.0 12.7 10.2 3.9 44.8
Hackensack 1,129,751 266.0 90.0 174.3 16.0 9.3 12.4 18.0 8.8 8.5 24.1 10.9 4.5 65.6
Morristown 878,642 229.8 76.5 152.4 12.1 8.7 11.4 16.8 7.4 8.6 16.7 11.3 4.3 39.1
New Brunswick 838,495 226.2 80.4 144.3 10.9 9.3 10.7 15.5 6.6 8.2 17.1 8.8 3.6 61.0
Newark 1,466,813 212.3 76.9 134.1 9.6 7.7 10.2 14.8 7.1 6.8 12.4 8.5 4.2 57.8
Paterson 364,246 179.3 67.7 111.0 7.7 6.0 10.0 13.3 6.3 6.2 10.2 7.2 3.9 40.6
Ridgewood 379,311 226.7 73.6 152.1 14.0 9.4 11.4 16.7 8.2 8.8 22.3 8.4 4.4 31.3
New Mexico
Albuquerque 1,254,781 198.3 74.3 122.7 10.4 4.7 10.5 11.8 6.4 8.5 13.4 8.2 3.3 33.5
New York
Albany 1,721,696 197.9 66.0 130.8 10.0 5.9 10.8 12.6 6.3 6.9 16.5 9.8 3.8 28.5
Binghamton 376,954 164.0 54.9 108.3 8.8 4.7 10.6 12.3 4.4 7.8 12.5 8.8 3.1 19.8
Bronx 1,211,361 213.2 74.4 137.5 8.1 7.3 9.8 11.7 5.8 3.9 24.5 8.5 3.6 97.6
Buffalo 1,437,600 179.1 60.3 117.8 9.5 4.9 12.9 12.7 5.6 5.6 10.0 9.8 3.4 39.6
Elmira 344,696 181.0 56.8 123.5 10.7 4.2 11.8 14.8 4.7 7.9 15.8 9.1 3.5 13.6
East Long Island 4,242,448 265.0 92.3 171.0 13.4 7.7 12.6 18.7 8.7 7.8 25.8 11.3 4.1 76.8
Hospit
al Refe
rral R
egion
Reside
nt Pop
ulatio
n
All Phy
sician
s
Primary
Care
Physic
ians
Specia
lists
Anesth
esiol
ogist
s
Cardiol
ogist
s
Genera
l Surg
eons
Obstet
rician
/
Gynec
ologis
ts
Ophtha
lmolo
gists
Orthop
edic
Surgeo
ns
Psych
iatris
ts
Radiol
ogist
s
Urolog
ists
Reside
nt Phy
sician
s
TABLES

172 THE DARTMOUTH ATLAS OF HEALTH CARE
New York 4,568,777 265.7 88.6 175.6 9.9 9.3 12.1 14.1 8.5 5.7 35.5 10.5 4.1 111.1
Rochester 1,243,904 185.0 70.0 113.9 9.9 4.6 9.3 13.2 6.3 6.5 14.7 8.9 2.9 53.4
Syracuse 1,074,023 163.4 56.0 106.5 9.6 5.1 9.2 11.5 5.4 7.5 11.3 8.8 3.4 38.5
White Plains 1,025,646 303.8 93.7 208.6 15.7 8.4 14.4 19.7 10.9 8.9 43.9 13.4 4.9 74.2
North Carolina
Asheville 490,407 177.5 68.9 107.9 8.4 2.5 9.6 10.1 4.7 8.8 10.5 9.2 4.0 12.3
Charlotte 1,558,895 149.0 50.3 98.0 6.4 4.0 8.8 12.5 5.3 6.9 6.9 7.8 3.8 18.7
Durham 1,044,489 189.9 59.5 129.0 9.4 5.6 8.7 11.4 5.4 7.0 17.6 12.1 4.0 87.4
Greensboro 473,708 157.1 54.3 102.3 7.1 5.0 7.6 11.4 6.3 6.8 7.3 8.3 3.7 23.4
Greenville 696,239 153.9 52.7 99.9 6.2 4.8 10.4 12.8 4.9 6.5 8.2 7.5 2.9 41.3
Hickory 236,085 124.9 44.8 79.2 5.4 2.9 9.0 10.8 3.3 5.7 4.5 7.5 3.3 10.4
Raleigh 1,279,158 154.9 55.8 98.1 5.5 4.7 8.8 10.2 4.7 5.3 12.0 7.4 3.6 27.3
Wilmington 277,569 175.2 57.0 117.4 9.0 4.0 11.6 13.9 5.6 8.1 8.3 8.7 4.0 28.5
Winston-Salem 883,657 146.9 49.4 96.9 7.7 4.5 8.3 10.6 4.1 5.3 8.5 8.5 3.1 41.0
North Dakota
Bismarck 201,983 150.9 54.6 96.1 12.0 3.8 9.3 8.7 3.5 4.9 4.7 7.5 2.7 14.2
Fargo Moorhead -Mn 464,935 145.7 63.8 80.9 4.8 2.8 8.3 7.0 5.1 5.6 10.5 6.4 2.2 18.1
Grand Forks 179,647 136.7 62.5 71.5 4.7 1.8 8.3 6.5 3.3 6.5 4.2 4.5 2.2 32.9
Minot 127,785 149.3 57.5 91.5 8.2 2.1 9.5 9.3 4.0 6.9 7.9 9.1 3.9 22.0
Ohio
Akron 668,249 182.1 67.2 112.9 8.5 4.3 9.6 11.4 4.8 8.7 8.2 8.1 3.2 52.6
Canton 602,501 139.9 52.4 86.5 7.7 3.4 7.9 10.8 5.1 6.2 5.2 6.9 2.4 23.7
Cincinnati 1,509,444 190.6 66.0 123.7 10.1 5.3 8.9 12.9 5.2 7.3 13.8 8.2 3.2 46.3
Cleveland 2,086,998 213.0 71.2 140.5 12.9 7.3 11.3 12.4 6.3 7.4 12.7 12.0 2.7 70.8
Columbus 2,525,830 153.6 57.1 95.5 8.4 4.6 8.2 9.5 4.7 6.0 8.1 6.7 2.9 33.8
Dayton 1,111,678 147.4 56.9 89.8 7.4 4.2 8.6 9.1 3.5 5.3 5.5 6.7 2.9 26.2
Elyria 241,159 152.8 57.5 94.6 9.4 4.9 8.7 9.3 3.9 6.3 6.3 8.0 2.9 19.0
Kettering 360,768 189.6 69.0 119.3 11.1 4.4 7.4 10.4 6.1 7.2 9.1 10.1 3.7 47.1
Toledo 982,485 172.9 61.2 111.3 11.1 4.8 10.2 11.6 5.4 6.3 7.0 8.5 3.7 37.3
Youngstown 688,740 168.6 65.2 102.9 9.2 3.9 11.4 10.8 4.2 6.1 6.8 10.5 2.4 32.6
Oklahoma
Lawton 192,373 138.5 56.4 80.8 5.4 2.4 8.3 7.9 3.0 5.8 7.9 7.3 3.1 18.0
Oklahoma City 1,565,094 162.3 60.0 100.4 8.7 5.0 8.8 9.6 4.5 6.2 9.0 8.0 3.5 31.6
Tulsa 1,140,749 159.6 62.5 96.1 8.6 5.2 8.4 10.4 4.4 6.1 7.0 8.1 3.0 22.2
Oregon
Bend 121,666 170.0 61.4 107.6 11.0 2.6 10.2 11.9 6.6 5.9 6.4 10.1 4.8 6.6
Eugene 604,042 179.7 68.3 110.3 10.8 2.7 8.9 11.7 6.1 9.7 8.8 6.5 3.1 6.7
Medford 338,364 180.1 67.0 111.4 9.2 3.5 9.0 12.1 6.6 12.1 7.0 8.5 3.8 7.6
Portland 1,894,661 202.4 71.2 130.2 12.5 5.2 9.1 13.3 6.6 8.3 12.3 9.1 3.3 30.0
Salem 227,361 181.8 63.8 115.9 11.3 2.2 9.9 10.8 7.7 9.6 11.9 8.9 3.1 7.8
Pennsylvania
Allentown 985,564 180.5 65.7 113.8 9.5 6.5 10.1 11.7 5.7 6.9 8.9 9.4 3.3 23.9
Altoona 297,507 147.0 54.2 92.5 6.9 3.8 8.4 11.2 3.8 5.9 5.5 9.1 2.5 17.2
Danville 536,017 169.0 58.9 109.2 8.7 4.8 8.7 8.0 4.6 5.8 6.8 11.0 2.9 28.8
Erie 732,505 154.8 53.7 100.5 7.5 3.6 11.4 9.1 4.5 7.7 7.6 9.0 3.2 16.8
Harrisburg 879,941 167.6 65.4 101.4 9.0 4.3 7.8 10.9 4.7 7.1 8.4 8.9 3.2 37.0
Hospit
al Refe
rral R
egion
Reside
nt Pop
ulatio
n
All Phy
sician
s
Primary
Care
Physic
ians
Specia
lists
Anesth
esiol
ogist
s
Cardiol
ogist
s
Genera
l Surg
eons
Obstet
rician
/
Gynec
ologis
ts
Ophtha
lmolo
gists
Orthop
edic
Surgeo
ns
Psych
iatris
ts
Radiol
ogist
s
Urolog
ists
Reside
nt Phy
sician
s

173
Johnstown 241,968 163.0 61.2 100.2 9.0 3.9 9.2 11.9 4.5 5.7 6.4 9.5 3.0 36.8
Lancaster 529,921 160.1 61.9 97.7 9.5 6.1 6.4 8.3 5.3 6.6 8.4 9.1 2.9 20.1
Philadelphia 3,921,220 259.4 89.3 168.5 10.8 9.8 10.5 14.9 7.1 7.8 24.7 13.6 3.6 77.8
Pittsburgh 3,055,252 186.3 62.9 122.4 10.1 6.2 10.3 11.5 4.8 6.1 11.4 11.8 2.8 48.6
Reading 510,057 162.4 62.6 98.9 9.1 3.8 7.9 10.8 5.0 6.5 8.2 9.1 2.8 23.0
Sayre 191,385 148.8 55.0 93.3 7.8 4.4 8.2 7.4 4.3 6.2 5.5 8.0 3.5 18.8
Scranton 300,457 184.1 67.3 116.4 8.4 5.0 11.0 11.0 5.0 6.4 11.7 9.8 2.6 17.5
Wilkes-Barre 258,306 196.0 75.3 120.3 6.5 6.1 9.2 14.0 6.3 4.8 9.0 11.9 5.0 22.1
York 340,946 153.8 62.5 91.1 10.6 3.4 6.6 9.7 4.2 6.3 4.6 7.3 3.5 29.9
Rhode Island
Providence 1,151,761 197.6 67.8 128.0 8.5 6.2 12.7 12.0 5.4 8.6 15.1 9.8 3.4 48.3
South Carolina
Charleston 742,214 189.7 60.3 127.7 10.3 4.1 11.2 11.7 7.1 7.3 13.4 8.4 4.7 63.6
Columbia 980,780 157.1 54.6 101.8 7.6 4.6 9.8 10.4 5.8 6.0 13.4 6.8 2.9 29.2
Florence 333,436 130.7 53.7 76.0 6.4 2.4 9.7 10.2 3.4 4.5 4.5 6.5 3.6 17.2
Greenville 682,364 154.5 57.2 96.6 8.7 2.5 9.4 10.7 5.2 7.9 7.3 7.7 3.5 22.1
Spartanburg 306,233 144.9 51.9 92.6 7.2 3.1 13.1 11.2 3.5 7.1 3.6 8.5 3.8 23.3
South Dakota
Rapid City 184,008 156.8 63.7 91.0 4.2 2.5 12.3 6.3 4.6 5.7 9.2 10.3 2.4 12.8
Sioux Falls 699,852 139.4 62.6 75.8 5.1 2.7 8.5 7.3 4.0 5.9 5.5 6.2 2.9 19.3
Tennessee
Chattanooga 563,958 160.9 54.3 105.6 10.4 3.4 9.0 11.3 4.5 6.8 8.3 8.5 2.6 17.9
Jackson 287,699 125.4 54.4 70.6 5.1 2.1 8.8 8.8 3.3 4.4 4.5 6.2 3.7 13.2
Johnson City 217,622 188.9 73.9 114.4 8.5 4.0 11.2 12.2 5.1 8.5 8.7 8.1 3.8 46.2
Kingsport 464,124 159.2 63.0 94.9 5.8 3.9 11.8 10.3 3.6 6.6 5.4 8.1 3.2 13.4
Knoxville 1,067,260 160.5 58.6 101.1 8.0 4.7 8.1 11.7 4.2 6.1 7.7 8.8 2.9 15.5
Memphis 1,597,501 150.4 50.7 98.8 8.9 4.5 9.3 10.3 4.2 4.7 7.1 8.2 3.3 34.4
Nashville 1,944,017 166.2 57.2 108.3 8.4 4.3 10.5 11.1 5.3 6.7 8.7 9.5 3.9 35.5
Texas
Abilene 278,103 146.4 54.9 90.9 7.9 3.8 7.7 11.8 3.9 5.5 5.9 6.7 2.3 12.2
Amarillo 386,240 139.5 50.1 88.5 8.4 4.1 11.4 11.4 3.0 5.5 5.6 6.8 2.7 15.6
Austin 870,567 180.9 65.3 114.7 8.8 4.0 8.1 10.7 6.8 7.6 17.3 6.1 3.3 15.9
Beaumont 425,872 160.9 57.8 102.4 9.7 5.2 8.7 11.1 5.0 6.6 7.0 7.4 4.0 19.5
Bryan 184,248 136.4 56.5 79.2 6.4 3.3 7.1 8.4 4.5 4.9 6.5 7.1 3.0 13.6
Corpus Christi 492,319 156.1 58.7 96.3 11.6 3.6 7.8 10.3 5.3 5.8 5.4 7.3 2.8 19.2
Dallas 3,070,082 170.7 56.2 113.6 11.0 5.3 9.8 12.2 5.9 7.1 9.7 8.0 3.3 35.3
El Paso 811,036 142.0 43.4 96.7 8.4 5.1 8.0 8.9 4.6 7.1 7.1 5.0 2.4 30.4
Fort Worth 1,429,666 154.4 53.9 99.5 9.6 4.0 8.6 11.2 5.1 6.6 6.7 7.2 2.3 18.2
Harlingen 377,065 101.8 35.4 65.5 5.2 2.6 8.0 7.7 5.2 3.5 3.7 4.4 2.4 8.0
Houston 4,195,450 175.2 56.2 117.7 10.3 7.4 8.6 10.8 5.8 6.0 10.3 7.8 3.1 52.1
Longview 182,480 130.5 48.2 81.7 7.6 2.9 6.2 11.2 4.6 5.4 4.4 6.2 3.3 9.5
Lubbock 634,031 153.4 56.5 95.4 9.3 3.8 11.6 9.3 4.7 7.6 6.8 7.5 3.1 29.9
McAllen 324,820 92.5 36.0 56.3 5.9 3.0 5.3 6.8 3.5 3.3 3.4 3.3 1.6 11.8
Odessa 306,783 118.9 39.1 78.7 6.2 2.9 7.7 11.4 4.4 5.6 5.3 4.6 3.2 10.2
San Angelo 150,062 146.6 44.9 101.5 11.7 4.5 9.2 10.4 4.5 7.3 5.7 7.6 3.7 8.7
San Antonio 1,795,095 184.8 57.9 125.1 12.2 4.8 9.4 10.5 6.6 7.1 12.5 8.8 3.2 56.6
Hospit
al Refe
rral R
egion
Reside
nt Pop
ulatio
n
All Phy
sician
s
Primary
Care
Physic
ians
Specia
lists
Anesth
esiol
ogist
s
Cardiol
ogist
s
Genera
l Surg
eons
Obstet
rician
/
Gynec
ologis
ts
Ophtha
lmolo
gists
Orthop
edic
Surgeo
ns
Psych
iatris
ts
Radiol
ogist
s
Urolog
ists
Reside
nt Phy
sician
s
TABLES

174 THE DARTMOUTH ATLAS OF HEALTH CARE
Temple 323,119 165.0 60.4 102.9 6.9 5.2 9.0 8.5 6.2 5.5 9.5 8.8 3.2 44.0
Tyler 425,534 159.2 56.5 102.2 9.8 3.1 10.5 11.9 5.4 6.2 7.7 8.2 3.5 13.6
Victoria 133,472 148.6 53.7 93.9 9.4 2.5 7.0 10.2 3.6 5.9 7.7 9.2 2.3 14.2
Waco 279,913 149.8 56.2 92.6 8.9 2.8 7.0 8.8 4.7 6.2 10.9 7.2 3.6 19.9
Wichita Falls 194,271 163.0 56.6 104.0 7.9 2.6 10.3 11.6 3.7 7.2 16.6 8.6 3.0 21.0
Utah
Ogden 307,965 145.2 46.3 97.6 10.6 3.2 8.6 13.0 5.4 7.1 6.7 6.1 2.5 15.9
Provo 312,598 140.9 48.7 92.1 8.7 2.9 6.3 10.8 5.0 7.0 9.4 5.2 3.2 10.1
Salt Lake City 1,376,597 181.0 56.4 123.9 13.6 5.4 10.2 12.4 5.7 8.9 10.8 8.1 3.2 36.6
Vermont
Burlington 593,348 191.0 73.1 116.0 8.3 5.2 11.9 10.5 5.6 6.2 15.5 8.5 3.9 38.9
Virginia
Arlington 1,516,813 199.0 66.3 131.0 8.6 6.5 8.5 13.9 6.9 8.1 15.9 8.5 3.7 41.6
Charlottesville 431,219 209.3 76.4 130.6 9.5 4.7 11.9 11.0 5.5 6.8 16.3 11.2 3.6 61.7
Lynchburg 213,943 153.6 58.7 94.1 7.2 2.3 9.2 10.5 5.5 6.9 7.3 7.9 3.5 14.6
Newport News 470,475 178.3 62.0 115.0 8.8 5.5 8.9 13.7 5.9 7.2 12.6 7.1 3.4 24.7
Norfolk 1,124,582 192.2 62.1 128.8 10.0 5.4 11.6 13.7 5.8 7.3 11.5 8.2 4.7 40.9
Richmond 1,247,486 194.0 67.2 126.0 8.5 7.6 9.8 11.9 6.1 7.8 13.0 10.6 3.2 43.9
Roanoke 655,809 171.7 59.9 110.6 8.8 3.8 10.7 12.0 5.3 6.5 8.6 10.0 3.6 25.9
Winchester 294,525 158.0 54.3 102.7 8.4 4.4 10.9 10.8 6.0 8.1 7.5 6.9 4.3 12.7
Washington
Everett 430,246 194.3 75.9 116.7 12.2 4.3 9.2 12.5 6.0 9.2 9.5 8.3 3.8 15.3
Olympia 264,075 184.4 71.9 111.9 11.8 2.7 8.5 11.7 6.1 8.5 7.5 8.9 4.0 19.8
Seattle 2,151,656 239.3 88.3 149.5 14.2 4.9 9.4 11.9 6.9 10.2 16.7 11.0 4.1 44.2
Spokane 1,083,197 181.3 70.4 109.3 9.5 4.3 7.7 10.1 5.8 8.7 9.7 8.3 2.9 12.9
Tacoma 589,030 201.8 67.9 131.7 14.1 4.9 8.1 10.6 6.3 10.3 12.5 10.4 3.2 34.9
Yakima 224,261 171.5 69.2 101.8 7.0 4.2 7.5 11.7 5.1 9.3 9.2 6.9 4.4 10.7
West Virginia
Charleston 856,149 160.3 64.3 94.5 5.9 4.0 11.6 10.6 4.0 5.2 5.7 6.9 3.5 23.7
Huntington 349,438 155.9 54.4 99.9 5.9 5.1 10.9 11.0 4.4 5.2 8.4 8.0 3.6 31.8
Morgantown 376,117 173.4 65.1 107.5 7.4 3.7 9.0 9.2 4.8 6.3 7.5 9.9 3.9 54.3
Wisconsin
Appleton 269,657 140.9 60.1 80.2 7.4 4.5 7.1 7.8 4.0 5.1 4.2 7.2 1.9 11.8
Green Bay 446,098 135.4 51.5 82.7 6.1 3.3 9.0 8.7 4.8 5.7 5.4 7.4 2.9 9.3
La Crosse 320,536 158.6 62.4 95.8 6.7 3.8 8.8 6.7 4.8 6.9 7.8 10.0 2.5 28.9
Madison 875,793 180.9 70.6 109.4 8.5 4.1 7.2 7.5 6.8 7.1 12.5 9.5 2.2 51.4
Marshfield 342,484 169.3 65.8 103.1 8.4 3.7 8.6 8.7 5.5 6.9 6.5 8.7 2.7 15.7
Milwaukee 2,326,759 182.8 61.1 120.8 11.7 5.2 8.6 10.9 5.8 7.9 12.0 10.0 3.0 41.0
Neenah 201,177 155.4 55.1 99.9 7.7 3.8 8.1 6.8 4.7 8.3 11.4 10.9 3.1 17.6
Wausau 167,971 173.9 68.9 104.4 8.2 4.8 9.4 9.3 5.6 7.7 7.7 11.1 3.1 12.1
Wyoming
Casper 164,307 179.9 72.7 107.0 11.5 2.8 11.5 10.5 5.5 10.7 6.3 9.3 3.9 17.6
Large HMO
HMO 125.2 56.2 69.0 7.8 2.3 4.5 8.8 4.5 4.5 2.9 8.7 2.8
United States
US 248,652,605 189.0 66.0 121.7 9.8 5.7 9.7 12.1 5.9 7.2 13.0 9.0 3.3 39.0
Hospit
al Refe
rral R
egion
Reside
nt Pop
ulatio
n
All Phy
sician
s
Primary
Care
Physic
ians
Specia
lists
Anesth
esiol
ogist
s
Cardiol
ogist
s
Genera
l Surg
eons
Obstet
rician
/
Gynec
ologis
ts
Ophtha
lmolo
gists
Orthop
edic
Surgeo
ns
Psych
iatris
ts
Radiol
ogist
s
Urolog
ists
Reside
nt Phy
sician
s
175TABLES
*All rates are age and sex adjusted and corrected for
out of area use. See Part Nine, Section 5, for details.
Physicians in residency training programs, regardless
of specialty area, are grouped together. The count of
primary care physicians added to the count of special-
ists does not equal the count of all physicians; the
difference (about 1%) is attributable to the count of
those in the All Physicians category whose specialty
areas were identified as “unspecified.”

176 THE DARTMOUTH ATLAS OF HEALTH CARE
Description of Variables for Table 3
Figure List
6.1, 6.3
6.2, 6.3
6.3
6.7
6.8
6.4
6.5
6.6
3.3, 3.7
3.5, 3.7
3.6, 3.7
3.4, 3.7
3.8
6.9
Description
Approximately Double the actual MedicarePopulation, this is the denominator forcalculating procedure rates from two years ofMedicare Discharge Records
The Medicare Population in 1993 used as thedenominator for Part B Rates.
Discharge Rate for CABG Surgery per 1000Medicare Enrollees in HRRs
Discharge Rate for PTCA per 1000 MedicareEnrollees in HRRs
Discharge Rate for Coronary Angiographyper 1000 Medicare Enrollees in HRRs
Incidence of Prostate Biopsy per 1000Medicare Male Enrollees from 1993 Part BClaims Records
Discharge Rate for Radical Prostatectomyper 1000 Medicare Male Enrollees in HRRs
Incidence of Mammography per 1000Medicare Female Enrollees from 1993 Part BClaims Records
Percent of Breast Sparing Surgery per 1000Medicare Female Enrollees in HRRs
Discharge Rate for Back Surgery per 1000Medicare Enrollees in HRRs
Discharge Rate for Hip Fracture per 1000Medicare Enrollees in HRRs
Discharge Rate for High Variation MedicalConditions per 1000 Medicare Enrollees inHRRs
Percent of Deaths among Medicare Enrolleesthat occurred in the Hospital for HRRs
Surgical Discharge Rate per 1000 MedicareEnrollees in HRRs
Mortality Rate per 1000 Medicare Enrolleesin HRRs
TURP and BPH Rate per 1000 MaleMedicare Enrollees in HRRs
Variable
Medicare Population,1992 plus 1993
Medicare Population,1993
CABG Procedure Rate
PTCA Procedure Rate
Part A Angiography Rate
Part B Prostate BiopsyIncidence Rate
Radical ProstatectomyRate
Part B MammographyIncidence Rate
Part A Percent PartialMastectomies
Back Surgery Rate
Hip Fracture Rate
Rate for High VariationMedical Conditions
Percent In-HospitalMedicare Deaths
Rate for All SurgicalDischarges
Medicare Mortality Rate
TURP and BPH Rate
Price Adjustment
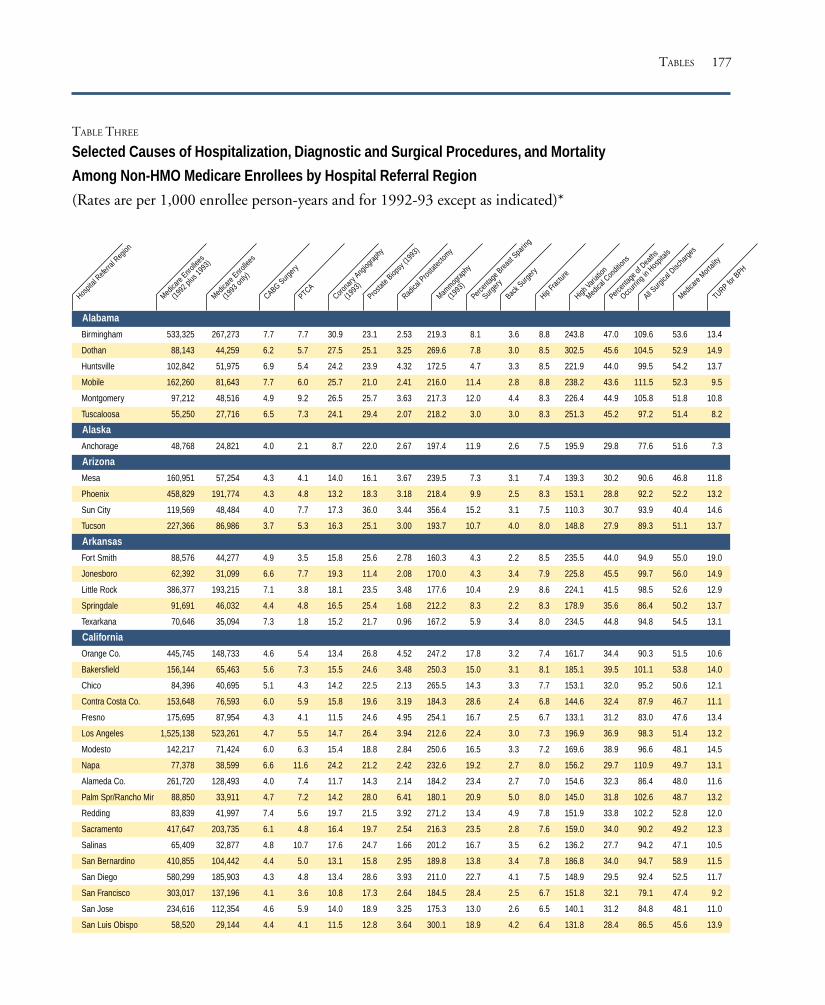
177
TABLE THREE
Selected Causes of Hospitalization, Diagnostic and Surgical Procedures, and Mortality
Among Non-HMO Medicare Enrollees by Hospital Referral Region
(Rates are per 1,000 enrollee person-years and for 1992-93 except as indicated)*
Alabama
Birmingham 533,325 267,273 7.7 7.7 30.9 23.1 2.53 219.3 8.1 3.6 8.8 243.8 47.0 109.6 53.6 13.4
Dothan 88,143 44,259 6.2 5.7 27.5 25.1 3.25 269.6 7.8 3.0 8.5 302.5 45.6 104.5 52.9 14.9
Huntsville 102,842 51,975 6.9 5.4 24.2 23.9 4.32 172.5 4.7 3.3 8.5 221.9 44.0 99.5 54.2 13.7
Mobile 162,260 81,643 7.7 6.0 25.7 21.0 2.41 216.0 11.4 2.8 8.8 238.2 43.6 111.5 52.3 9.5
Montgomery 97,212 48,516 4.9 9.2 26.5 25.7 3.63 217.3 12.0 4.4 8.3 226.4 44.9 105.8 51.8 10.8
Tuscaloosa 55,250 27,716 6.5 7.3 24.1 29.4 2.07 218.2 3.0 3.0 8.3 251.3 45.2 97.2 51.4 8.2
Alaska
Anchorage 48,768 24,821 4.0 2.1 8.7 22.0 2.67 197.4 11.9 2.6 7.5 195.9 29.8 77.6 51.6 7.3
Arizona
Mesa 160,951 57,254 4.3 4.1 14.0 16.1 3.67 239.5 7.3 3.1 7.4 139.3 30.2 90.6 46.8 11.8
Phoenix 458,829 191,774 4.3 4.8 13.2 18.3 3.18 218.4 9.9 2.5 8.3 153.1 28.8 92.2 52.2 13.2
Sun City 119,569 48,484 4.0 7.7 17.3 36.0 3.44 356.4 15.2 3.1 7.5 110.3 30.7 93.9 40.4 14.6
Tucson 227,366 86,986 3.7 5.3 16.3 25.1 3.00 193.7 10.7 4.0 8.0 148.8 27.9 89.3 51.1 13.7
Arkansas
Fort Smith 88,576 44,277 4.9 3.5 15.8 25.6 2.78 160.3 4.3 2.2 8.5 235.5 44.0 94.9 55.0 19.0
Jonesboro 62,392 31,099 6.6 7.7 19.3 11.4 2.08 170.0 4.3 3.4 7.9 225.8 45.5 99.7 56.0 14.9
Little Rock 386,377 193,215 7.1 3.8 18.1 23.5 3.48 177.6 10.4 2.9 8.6 224.1 41.5 98.5 52.6 12.9
Springdale 91,691 46,032 4.4 4.8 16.5 25.4 1.68 212.2 8.3 2.2 8.3 178.9 35.6 86.4 50.2 13.7
Texarkana 70,646 35,094 7.3 1.8 15.2 21.7 0.96 167.2 5.9 3.4 8.0 234.5 44.8 94.8 54.5 13.1
California
Orange Co. 445,745 148,733 4.6 5.4 13.4 26.8 4.52 247.2 17.8 3.2 7.4 161.7 34.4 90.3 51.5 10.6
Bakersfield 156,144 65,463 5.6 7.3 15.5 24.6 3.48 250.3 15.0 3.1 8.1 185.1 39.5 101.1 53.8 14.0
Chico 84,396 40,695 5.1 4.3 14.2 22.5 2.13 265.5 14.3 3.3 7.7 153.1 32.0 95.2 50.6 12.1
Contra Costa Co. 153,648 76,593 6.0 5.9 15.8 19.6 3.19 184.3 28.6 2.4 6.8 144.6 32.4 87.9 46.7 11.1
Fresno 175,695 87,954 4.3 4.1 11.5 24.6 4.95 254.1 16.7 2.5 6.7 133.1 31.2 83.0 47.6 13.4
Los Angeles 1,525,138 523,261 4.7 5.5 14.7 26.4 3.94 212.6 22.4 3.0 7.3 196.9 36.9 98.3 51.4 13.2
Modesto 142,217 71,424 6.0 6.3 15.4 18.8 2.84 250.6 16.5 3.3 7.2 169.6 38.9 96.6 48.1 14.5
Napa 77,378 38,599 6.6 11.6 24.2 21.2 2.42 232.6 19.2 2.7 8.0 156.2 29.7 110.9 49.7 13.1
Alameda Co. 261,720 128,493 4.0 7.4 11.7 14.3 2.14 184.2 23.4 2.7 7.0 154.6 32.3 86.4 48.0 11.6
Palm Spr/Rancho Mir 88,850 33,911 4.7 7.2 14.2 28.0 6.41 180.1 20.9 5.0 8.0 145.0 31.8 102.6 48.7 13.2
Redding 83,839 41,997 7.4 5.6 19.7 21.5 3.92 271.2 13.4 4.9 7.8 151.9 33.8 102.2 52.8 12.0
Sacramento 417,647 203,735 6.1 4.8 16.4 19.7 2.54 216.3 23.5 2.8 7.6 159.0 34.0 90.2 49.2 12.3
Salinas 65,409 32,877 4.8 10.7 17.6 24.7 1.66 201.2 16.7 3.5 6.2 136.2 27.7 94.2 47.1 10.5
San Bernardino 410,855 104,442 4.4 5.0 13.1 15.8 2.95 189.8 13.8 3.4 7.8 186.8 34.0 94.7 58.9 11.5
San Diego 580,299 185,903 4.3 4.8 13.4 28.6 3.93 211.0 22.7 4.1 7.5 148.9 29.5 92.4 52.5 11.7
San Francisco 303,017 137,196 4.1 3.6 10.8 17.3 2.64 184.5 28.4 2.5 6.7 151.8 32.1 79.1 47.4 9.2
San Jose 234,616 112,354 4.6 5.9 14.0 18.9 3.25 175.3 13.0 2.6 6.5 140.1 31.2 84.8 48.1 11.0
San Luis Obispo 58,520 29,144 4.4 4.1 11.5 12.8 3.64 300.1 18.9 4.2 6.4 131.8 28.4 86.5 45.6 13.9
TURP for B
PH
Hospit
al Refe
rral R
egion
Medica
re Enro
llees
(1992
plus
1993
)
Medica
re Enro
llees
(1993
only)
CABG Surgery
PTCACoro
nary
Angiog
raphy
(1993
)
Prostat
e Biop
sy (1
993)
Radica
l Pros
tatec
tomy
Mammog
raphy
(1993
)
Percen
tage B
reast
Sparin
g
Surgery
Back S
urgery
Hip Fra
cture
High Vari
ation
Medica
l Con
dition
s
Percen
tage o
f Dea
ths
Occurr
ing in
Hos
pitals
All Surg
ical D
ischa
rges
Medica
re Mort
ality
TABLES

178 THE DARTMOUTH ATLAS OF HEALTH CARE
San Mateo Co. 167,078 71,053 4.1 4.9 11.9 14.8 2.47 227.1 19.2 2.5 6.5 122.4 26.7 80.8 48.4 9.9
Santa Barbara 91,120 39,885 4.3 4.8 11.8 25.3 3.59 205.8 12.8 4.6 6.9 126.4 28.9 88.2 46.8 10.1
Santa Cruz 50,013 24,868 4.4 8.0 14.5 10.1 3.22 257.4 13.5 3.6 6.1 133.5 28.8 86.2 48.0 13.4
Santa Rosa 104,504 52,191 4.0 6.4 13.1 19.0 2.69 225.2 24.2 2.3 6.7 146.6 27.9 87.0 47.9 9.4
Stockton 85,687 42,941 5.9 12.8 23.0 17.3 1.68 262.0 20.1 2.2 6.9 162.0 38.4 97.6 50.2 9.7
Ventura 129,125 48,138 4.6 5.2 12.5 29.4 5.29 251.3 17.2 4.5 6.8 144.4 31.8 93.2 48.4 14.8
Colorado
Boulder 34,094 14,906 3.1 3.0 8.3 13.8 6.70 214.6 13.3 4.4 8.8 145.3 27.4 88.7 46.8 13.4
Colorado Springs 117,417 56,562 4.8 4.6 14.0 14.4 1.73 186.7 10.2 3.0 8.3 150.9 30.7 85.1 46.7 12.7
Denver 380,137 163,270 3.1 4.5 13.5 23.2 3.65 193.8 17.2 3.2 8.0 161.0 29.5 90.1 50.7 13.2
Fort Collins 46,391 23,445 4.5 6.0 15.5 22.6 4.40 279.6 4.7 5.5 7.8 150.8 30.8 97.9 45.9 13.5
Grand Junction 57,417 29,020 2.1 3.8 8.9 22.1 3.13 145.5 14.8 3.5 7.3 139.7 24.2 87.7 45.5 7.1
Greeley 57,263 28,585 4.6 3.6 12.9 21.9 4.44 180.2 13.1 6.1 7.5 168.7 33.9 101.7 45.6 12.4
Pueblo 40,855 19,628 3.5 3.1 12.5 7.3 0.84 143.1 5.8 3.7 7.8 155.6 36.7 91.5 44.0 12.5
Connecticut
Bridgeport 176,034 88,105 3.9 5.0 16.3 25.0 1.45 210.8 28.4 3.1 6.9 152.7 38.9 88.6 47.3 12.2
Hartford 375,616 188,277 5.7 3.7 14.1 25.3 1.81 243.9 28.1 2.2 7.1 153.1 36.9 91.8 48.0 10.4
New Haven 350,286 175,454 5.4 5.5 17.4 17.5 1.45 230.6 21.8 2.0 6.8 155.2 35.1 90.4 48.7 9.4
Delaware
Wilmington 146,322 73,666 4.6 5.6 17.4 26.5 2.06 252.9 13.4 2.7 7.4 187.5 39.1 102.2 55.0 16.5
District of Columbia
Washington 424,100 212,972 4.7 4.9 14.4 32.9 2.67 240.9 17.5 2.9 7.2 196.7 42.0 97.2 49.5 13.8
Florida
Bradenton 97,119 48,677 6.2 3.9 17.2 26.6 2.29 280.9 19.9 3.9 7.5 132.4 36.7 89.6 45.0 11.1
Clearwater 217,939 96,789 5.0 5.2 17.4 31.0 4.10 326.9 28.3 4.0 7.9 165.7 37.4 100.3 45.3 14.0
Fort Lauderdale 842,301 333,215 6.3 6.4 17.2 38.1 2.49 341.7 27.0 2.9 7.8 162.7 35.9 95.2 43.7 12.9
Fort Myers 310,935 157,591 5.4 5.5 17.4 37.5 4.55 283.1 14.1 5.5 7.1 157.3 35.5 99.1 42.1 10.7
Gainesville 105,665 53,306 5.8 3.8 15.9 16.3 2.15 248.8 16.4 3.2 8.0 191.3 32.9 91.8 53.0 15.9
Hudson 192,235 86,583 7.2 5.0 17.7 47.1 3.23 302.1 10.3 4.5 7.4 189.4 41.3 104.8 46.8 17.5
Jacksonville 255,066 128,785 6.6 5.7 21.9 35.0 2.38 226.8 12.4 2.7 8.2 206.6 38.2 99.1 53.2 10.6
Lakeland 85,927 41,935 5.2 7.6 19.5 43.3 2.83 258.4 12.2 3.4 8.4 149.9 35.9 88.0 48.3 12.2
Miami 651,143 236,134 4.9 4.8 14.3 34.2 2.21 242.0 19.5 1.4 8.1 198.8 42.2 91.1 47.4 11.7
Ocala 159,246 81,014 6.4 5.2 16.3 47.2 3.66 279.0 14.0 3.3 6.9 139.9 33.1 93.0 45.0 11.7
Orlando 735,288 346,135 5.7 6.5 18.0 40.4 3.98 258.2 11.3 2.8 7.6 166.1 36.8 97.5 47.3 13.3
Ormond Beach 125,122 45,451 4.5 5.7 13.3 35.5 5.73 216.8 11.7 2.7 8.1 139.8 37.9 98.1 49.4 18.1
Panama City 41,831 21,241 4.8 5.4 23.3 24.0 1.60 241.2 3.8 2.4 8.2 231.0 44.5 100.1 54.5 14.6
Pensacola 141,193 71,683 5.7 4.7 18.7 21.9 3.64 204.0 11.2 3.9 8.1 214.7 42.1 97.4 51.9 8.9
Sarasota 186,748 93,972 6.5 5.8 17.9 32.3 5.76 337.9 9.9 3.6 7.9 136.3 33.0 99.6 42.0 13.6
St Petersburg 172,097 72,798 4.7 3.7 15.2 32.5 4.64 266.0 17.9 3.9 8.7 174.5 40.6 109.0 50.5 13.8
Tallahassee 143,433 71,944 4.8 3.1 14.3 33.2 2.51 205.2 6.7 3.2 8.3 210.4 39.2 95.8 53.5 18.3
Tampa 229,592 94,672 5.5 5.0 16.7 28.6 2.20 214.3 14.7 3.3 8.0 168.8 38.7 96.1 50.8 14.0
Georgia
Albany 44,002 22,092 4.7 2.4 13.0 24.0 2.65 232.0 14.1 2.2 8.5 196.5 43.8 101.6 52.2 17.0
Atlanta 681,050 343,564 5.3 6.4 19.7 32.1 3.20 199.7 14.2 2.4 8.8 222.9 41.4 99.5 53.1 11.9
Augusta 121,770 61,150 5.5 9.9 21.7 15.8 1.37 203.6 6.9 2.7 8.0 213.3 41.9 93.5 57.0 6.5
Columbus 66,225 33,178 5.6 5.1 14.9 18.8 2.22 166.4 7.2 2.2 8.8 190.6 41.8 99.3 55.9 19.6
TURP for B
PH
Hospit
al Refe
rral R
egion
Medica
re Enro
llees
(1992
plus
1993
)
Medica
re Enro
llees
(1993
only)
CABG Surgery
PTCACoro
nary
Angiog
raphy
(1993
)
Prostat
e Biop
sy (1
993)
Radica
l Pros
tatec
tomy
Mammog
raphy
(1993
)
Percen
tage B
reast
Sparin
g
Surgery
Back S
urgery
Hip Fra
cture
High Vari
ation
Medica
l Con
dition
s
Percen
tage o
f Dea
ths
Occurr
ing in
Hos
pitals
All Surg
ical D
ischa
rges
Medica
re Mort
ality

179
Macon 144,152 72,254 6.5 5.1 22.6 21.9 2.03 196.3 11.6 2.9 8.6 240.0 43.9 104.6 55.9 14.3
Rome 60,002 30,054 8.1 8.3 27.4 45.5 1.26 159.3 7.4 2.6 9.4 243.0 41.2 98.9 59.5 12.1
Savannah 136,605 68,864 6.3 5.2 19.2 31.2 2.79 231.5 13.8 4.4 7.8 227.8 44.0 99.4 51.8 10.1
Hawaii
Honolulu 249,501 91,283 3.4 3.7 8.2 21.1 1.88 176.4 21.3 1.4 5.2 122.5 37.7 63.3 43.1 8.0
Idaho
Boise 136,451 68,514 4.2 4.2 11.5 22.5 2.77 135.5 12.6 4.8 6.7 134.0 26.8 88.9 47.6 11.2
Idaho Falls 31,980 16,155 4.1 2.9 11.2 11.1 3.71 154.5 5.3 3.7 6.6 131.9 26.9 81.1 48.7 14.6
Illinois
Aurora 33,092 16,567 5.3 4.1 17.1 12.3 1.20 142.7 23.3 2.8 7.6 174.0 36.4 96.2 51.4 12.8
Blue Island 208,834 96,480 6.2 5.1 19.8 25.4 2.88 157.3 18.0 2.4 7.3 227.7 37.4 101.3 57.2 13.6
Chicago 555,335 252,551 5.4 5.0 18.5 17.0 1.27 157.7 18.3 1.7 6.9 234.7 40.4 96.4 53.9 14.7
Elgin 83,405 40,361 4.7 5.5 16.0 21.0 1.78 128.0 14.5 3.4 7.5 194.0 35.6 95.1 54.3 14.0
Evanston 231,368 108,566 5.7 6.1 16.6 24.4 2.39 246.6 33.0 2.6 7.1 190.7 35.0 95.0 47.1 13.2
Hinsdale 61,934 30,199 7.5 5.4 20.0 32.5 3.52 199.6 22.0 3.0 7.0 174.0 32.2 93.9 50.3 10.3
Joliet 95,883 47,952 8.5 4.8 20.7 25.7 2.85 196.6 13.3 2.3 6.7 249.0 44.3 102.5 54.3 12.4
Melrose Park 289,360 134,345 6.7 5.0 19.9 17.0 1.66 175.3 19.3 2.4 6.9 190.4 35.0 94.8 52.4 13.7
Peoria 189,075 94,601 5.5 5.3 17.9 33.5 2.92 228.0 10.6 1.9 7.7 183.1 37.1 93.6 49.4 12.3
Rockford 169,883 85,221 4.2 6.1 16.5 20.7 3.07 176.6 11.8 2.0 7.5 179.5 34.8 90.9 48.7 11.3
Springfield 259,570 129,574 5.9 5.0 19.5 20.2 2.13 169.8 13.2 3.2 7.7 221.9 37.7 100.3 49.9 13.7
Urbana 112,448 56,222 5.1 4.1 14.5 21.7 2.00 241.8 16.8 2.6 7.4 190.9 35.1 91.0 52.1 13.8
Bloomington 37,816 18,958 7.8 2.9 19.1 30.1 2.09 232.3 3.0 2.9 7.7 191.3 34.4 94.2 50.8 11.7
Indiana
Evansville 197,282 98,732 5.7 5.0 17.5 19.9 2.13 166.4 15.1 3.2 8.1 233.9 37.2 90.7 54.0 11.7
Fort Wayne 194,099 97,436 4.9 5.8 16.4 13.9 1.92 154.7 10.0 3.3 7.5 160.7 32.4 88.0 51.4 9.9
Gary 112,583 56,602 7.1 6.4 22.1 28.0 1.92 133.3 7.3 3.4 6.8 233.5 39.7 106.6 56.6 18.9
Indianapolis 572,482 285,128 4.9 6.6 16.7 18.5 2.24 179.6 18.5 2.5 8.2 207.7 38.8 95.4 54.3 12.3
Lafayette 45,501 22,767 5.7 7.3 20.4 6.6 2.61 106.8 9.1 2.9 7.4 160.8 32.6 87.9 52.8 11.8
Muncie 45,674 22,925 4.2 5.9 12.6 24.4 2.77 178.1 12.8 2.9 8.7 200.9 38.0 92.6 54.6 13.0
Munster 83,001 40,981 6.3 11.1 27.4 20.1 2.59 153.2 10.4 2.3 6.5 231.3 44.1 110.9 56.4 17.6
South Bend 165,290 83,059 5.8 3.1 13.3 18.1 1.72 143.9 7.7 2.4 7.2 158.0 32.6 87.6 51.5 10.9
Terre Haute 55,263 27,493 5.4 8.6 20.2 15.5 2.48 123.0 11.2 3.0 8.1 190.9 38.6 93.7 56.4 9.0
Iowa
Cedar Rapids 70,096 35,134 6.8 3.6 17.1 32.6 3.53 172.5 8.1 3.1 7.7 159.5 35.7 99.3 46.0 11.2
Davenport 138,262 69,196 5.2 4.8 14.8 23.2 3.56 172.9 9.8 2.5 8.0 187.8 38.3 94.2 51.7 8.7
Des Moines 279,629 139,263 5.0 8.5 20.2 20.8 2.37 201.0 8.0 2.4 7.9 190.3 36.2 100.1 47.1 11.1
Dubuque 42,821 21,508 3.6 5.7 12.8 7.2 2.42 148.0 7.4 3.4 7.6 174.9 31.0 94.1 50.6 12.9
Iowa City 84,837 42,355 6.0 3.9 15.1 13.2 2.05 187.0 12.1 1.9 7.5 180.9 34.2 89.7 48.6 8.6
Mason City 54,183 27,052 6.6 5.1 17.4 7.5 2.05 206.1 6.3 4.1 7.4 154.2 29.2 97.6 45.3 14.9
Sioux City 80,675 40,261 3.5 5.4 14.2 22.4 2.08 200.4 7.0 2.8 7.8 165.5 31.8 97.9 46.6 15.5
Waterloo 64,146 32,055 4.5 3.0 11.4 26.4 4.48 180.6 12.4 2.4 7.9 175.7 33.1 93.4 48.7 11.0
Kansas
Topeka 110,532 55,327 4.5 6.1 15.8 35.4 4.27 192.6 9.6 1.8 8.2 158.1 32.9 95.8 46.7 18.4
Wichita 352,720 173,960 5.9 6.2 19.8 25.8 3.18 199.1 11.4 3.0 8.3 203.6 37.3 100.9 46.7 16.5
Kentucky
Covington 72,402 36,323 6.7 4.1 19.5 21.6 2.46 139.9 9.1 2.5 8.5 234.6 38.7 89.5 57.7 9.7
TABLES
TURP for B
PH
Hospit
al Refe
rral R
egion
Medica
re Enro
llees
(1992
plus
1993
)
Medica
re Enro
llees
(1993
only)
CABG Surgery
PTCACoro
nary
Angiog
raphy
(1993
)
Prostat
e Biop
sy (1
993)
Radica
l Pros
tatec
tomy
Mammog
raphy
(1993
)
Percen
tage B
reast
Sparin
g
Surgery
Back S
urgery
Hip Fra
cture
High Vari
ation
Medica
l Con
dition
s
Percen
tage o
f Dea
ths
Occurr
ing in
Hos
pitals
All Surg
ical D
ischa
rges
Medica
re Mort
ality

180 THE DARTMOUTH ATLAS OF HEALTH CARE
Lexington 297,538 149,367 5.5 2.8 13.8 16.6 1.91 161.7 7.0 1.6 8.3 263.1 43.1 80.3 56.8 12.9
Louisville 371,995 184,422 6.1 4.0 17.1 18.7 1.47 184.1 10.5 2.5 8.1 240.5 41.7 93.8 55.0 12.5
Owensboro 35,548 17,827 6.6 5.0 18.7 20.1 3.17 214.5 9.2 3.9 7.6 246.8 44.2 101.2 55.9 23.7
Paducah 113,578 56,798 6.3 3.9 23.3 17.7 2.45 223.5 19.7 3.0 8.8 257.6 45.1 102.0 51.9 12.7
Louisiana
Alexandria 68,740 33,956 4.7 9.9 26.8 22.1 1.14 119.7 12.1 2.8 7.3 273.9 47.1 100.3 55.2 9.9
Baton Rouge 141,214 70,303 5.3 6.3 16.0 42.7 4.20 178.1 11.2 2.3 8.3 216.5 42.8 93.7 53.7 12.9
Houma 44,643 22,428 7.4 10.2 37.5 48.7 3.37 168.8 8.4 3.1 7.6 248.8 45.5 122.0 53.3 12.9
Lafayette 114,996 57,451 5.8 9.2 23.3 14.5 0.64 156.4 4.5 2.3 6.2 230.2 42.0 102.0 51.9 14.4
Lake Charles 50,898 25,554 4.8 7.2 21.2 22.6 1.80 173.5 10.2 3.1 7.0 278.4 49.2 102.0 54.3 12.0
Metairie 90,629 45,778 6.6 7.0 23.1 33.9 3.00 158.3 22.0 2.5 8.1 236.6 42.4 105.8 53.8 12.2
Monroe 69,164 33,888 5.6 3.9 17.7 23.8 1.90 159.9 11.1 3.8 8.2 323.8 45.5 102.3 52.9 17.9
New Orleans 183,269 91,028 6.4 7.5 22.4 18.4 2.13 145.6 15.1 2.2 7.6 221.7 39.2 106.1 54.2 11.1
Shreveport 169,892 83,987 4.8 5.9 20.0 24.4 2.15 145.0 6.1 3.5 7.9 219.4 42.5 95.5 51.0 16.3
Slidell 30,100 15,398 7.1 4.7 24.9 11.8 2.72 192.3 14.9 3.6 8.4 286.7 43.5 110.1 58.3 10.5
Maine
Bangor 108,853 54,720 4.5 3.1 13.8 17.6 1.41 234.1 17.3 1.9 6.7 220.9 41.6 92.0 52.2 13.7
Portland 254,192 127,579 4.6 4.0 14.9 18.8 1.58 246.9 22.1 2.4 6.9 189.7 39.6 91.9 50.6 11.5
Maryland
Baltimore 548,831 274,625 5.6 5.2 16.2 33.2 3.18 256.3 17.0 3.4 7.5 230.8 40.9 113.5 53.5 15.9
Salisbury 101,048 51,104 4.5 7.5 21.7 26.7 1.27 234.8 19.4 2.3 6.6 205.9 37.0 101.0 53.9 13.0
Takoma Park 128,043 64,654 4.6 7.1 17.7 27.9 1.83 238.3 10.4 2.8 7.3 179.5 41.5 97.8 48.6 11.8
Massachusetts
Boston 1,177,153 578,227 4.6 3.6 13.5 20.0 2.17 251.4 31.7 1.9 7.2 220.9 41.4 95.9 49.1 14.3
Springfield 206,398 102,782 3.8 2.8 9.5 20.9 1.44 189.2 25.5 2.0 7.0 177.8 39.1 85.0 50.7 9.9
Worcester 191,634 78,247 4.3 2.9 10.5 18.8 1.69 223.3 26.8 2.0 7.2 221.8 41.9 94.4 52.5 15.1
Michigan
Ann Arbor 255,856 128,729 5.5 5.6 15.5 27.9 2.64 300.3 25.8 2.4 6.9 182.2 35.9 94.0 52.2 12.6
Dearborn 144,988 72,348 6.8 5.7 15.3 43.5 2.97 273.3 13.8 1.7 6.3 189.7 43.4 94.6 54.5 12.0
Detroit 471,035 233,448 5.9 5.7 15.8 37.5 2.76 296.1 18.5 2.1 6.7 198.9 41.4 95.1 54.8 13.4
Flint 112,112 56,620 6.8 5.8 14.3 34.3 4.19 344.6 19.1 2.4 6.8 209.2 44.4 105.9 56.5 15.9
Grand Rapids 220,365 110,852 4.4 3.3 10.7 29.6 3.42 301.7 17.9 4.4 7.3 137.4 28.4 87.6 48.3 14.4
Kalamazoo 152,079 76,422 5.7 9.6 15.5 29.1 4.04 238.3 15.5 3.6 7.2 148.8 31.6 100.0 52.0 12.2
Lansing 130,755 62,071 6.1 4.5 14.0 22.4 3.98 347.0 22.4 3.3 7.1 176.0 35.8 99.7 51.9 12.0
Marquette 65,474 32,731 5.8 4.1 12.2 18.8 2.97 274.2 9.1 2.4 7.0 176.8 32.9 91.6 50.4 11.9
Muskegon 67,929 34,125 4.5 3.3 9.7 26.8 4.05 336.5 11.0 3.4 7.3 133.0 30.5 92.5 51.2 12.4
Petoskey 48,593 24,459 5.6 4.9 13.2 15.1 2.76 295.7 20.7 3.3 6.2 164.6 30.3 93.5 50.2 11.7
Pontiac 67,263 34,300 5.4 5.1 16.4 45.7 3.02 304.9 23.7 3.8 7.5 213.0 38.1 95.0 57.0 13.2
Royal Oak 159,500 80,077 5.9 6.8 17.0 46.6 3.32 355.6 25.2 2.7 6.9 173.1 39.7 93.7 48.3 14.0
Saginaw 185,287 93,134 7.2 7.9 17.4 32.5 3.44 303.5 11.3 3.7 6.0 194.6 35.5 106.3 50.6 15.3
St Joseph 38,816 19,488 5.6 9.2 19.6 39.4 3.69 334.9 8.9 3.4 6.3 154.7 37.6 92.5 51.6 7.3
Traverse City 60,606 30,614 7.0 6.2 16.5 23.7 1.77 319.8 14.8 3.8 7.0 179.7 32.7 102.5 48.5 11.9
Minnesota
Duluth 110,860 55,265 3.8 4.0 11.9 19.3 1.53 164.4 5.0 2.4 6.8 173.7 34.8 93.2 47.7 19.4
Minneapolis 630,496 278,212 4.4 4.5 13.9 16.5 3.31 159.9 13.2 2.6 7.1 169.1 29.2 91.5 46.3 12.1
Rochester 110,641 55,172 4.3 5.0 15.5 15.3 3.53 183.4 14.5 1.9 7.2 172.1 30.4 90.4 45.1 11.6
TURP for B
PH
Hospit
al Refe
rral R
egion
Medica
re Enro
llees
(1992
plus
1993
)
Medica
re Enro
llees
(1993
only)
CABG Surgery
PTCACoro
nary
Angiog
raphy
(1993
)
Prostat
e Biop
sy (1
993)
Radica
l Pros
tatec
tomy
Mammog
raphy
(1993
)
Percen
tage B
reast
Sparin
g
Surgery
Back S
urgery
Hip Fra
cture
High Vari
ation
Medica
l Con
dition
s
Percen
tage o
f Dea
ths
Occurr
ing in
Hos
pitals
All Surg
ical D
ischa
rges
Medica
re Mort
ality

181
St Cloud 50,192 25,133 4.3 3.9 11.8 17.2 3.25 219.1 15.9 3.0 6.5 172.3 28.0 85.2 44.2 11.8
St Paul 185,089 71,704 4.2 4.3 11.8 20.8 4.95 188.1 13.0 2.6 7.4 183.5 27.1 94.3 48.4 12.2
Mississippi
Gulfport 36,690 18,555 4.9 4.7 18.2 12.7 2.25 206.2 3.4 2.5 7.9 280.6 46.2 109.4 59.0 12.3
Hattiesburg 63,460 31,739 4.2 4.1 17.7 33.6 5.51 190.2 8.9 2.6 8.2 284.9 50.2 107.4 54.9 14.6
Jackson 240,661 119,625 4.2 2.7 12.4 26.5 4.12 189.7 9.3 2.6 8.1 250.1 45.5 88.4 51.9 13.4
Meridian 53,603 26,687 4.3 2.6 13.3 33.0 2.85 235.4 11.5 1.7 7.7 290.6 48.9 86.9 50.2 10.8
Oxford 34,523 17,195 5.8 4.5 21.4 21.0 1.26 114.9 5.0 3.5 8.8 278.5 49.2 101.0 49.2 14.9
Tupelo 89,043 44,485 4.6 2.4 15.3 22.3 1.58 155.8 2.8 2.9 8.2 249.2 48.6 88.2 51.3 11.0
Missouri
Cape Girardeau 77,388 38,572 5.7 6.5 17.4 28.9 2.03 121.4 5.4 3.3 7.8 167.1 39.3 87.9 52.8 13.4
Columbia 178,080 88,769 6.9 7.3 20.3 30.2 3.50 127.9 8.0 3.3 7.7 180.4 34.9 100.2 50.0 14.1
Joplin 105,302 52,556 5.1 6.3 19.6 19.1 2.59 161.5 4.9 2.6 8.5 235.5 38.3 101.6 53.5 17.3
Kansas City 507,563 241,129 5.1 6.7 18.6 26.4 4.80 179.7 13.5 2.6 8.7 190.6 34.7 97.2 51.8 13.9
Springfield 211,518 106,164 5.3 9.0 23.8 33.3 3.88 184.3 6.8 2.9 8.4 178.8 33.0 97.6 50.5 18.3
St Louis 837,617 418,988 6.1 5.2 18.0 28.3 4.81 165.8 13.8 2.8 8.1 202.1 37.7 99.5 52.6 12.4
Montana
Billings 120,822 60,821 5.4 4.1 13.0 34.2 5.74 189.7 16.9 3.8 8.0 193.5 29.9 94.5 48.2 8.5
Great Falls 39,696 19,886 4.4 5.6 15.6 28.2 3.57 209.4 15.5 2.2 7.6 230.3 33.9 91.3 48.0 9.5
Missoula 82,422 41,374 4.1 9.4 18.4 29.5 3.29 169.1 9.6 3.0 7.8 195.0 29.3 98.9 49.7 14.9
Nebraska
Lincoln 158,565 79,126 4.9 3.2 11.2 17.2 2.98 176.7 12.3 2.3 7.3 133.9 30.3 89.0 46.3 12.9
Omaha 308,292 151,270 5.0 5.1 15.6 25.9 3.68 168.2 9.9 3.1 7.9 165.9 34.3 95.6 48.7 13.7
Nevada
Las Vegas 207,303 86,110 5.4 5.8 15.9 40.4 2.74 171.5 10.6 2.8 7.7 159.1 40.4 95.9 57.9 12.5
Reno 118,820 59,800 4.0 4.0 12.5 21.7 3.18 162.2 17.6 2.4 7.9 149.6 31.6 80.7 52.4 7.5
New Hampshire
Lebanon 106,343 53,424 3.3 2.0 8.2 20.8 1.68 219.9 14.9 2.3 6.9 163.8 32.7 78.7 49.7 11.6
Manchester 164,646 82,822 5.2 3.5 15.3 18.7 1.82 192.6 21.9 2.6 7.2 159.7 34.6 85.7 50.1 10.6
New Jersey
Camden 711,959 357,129 5.1 3.9 17.7 29.4 1.35 206.8 21.7 1.7 7.1 219.3 50.8 100.4 52.2 13.1
Hackensack 316,870 158,231 4.7 3.9 14.1 28.2 1.92 164.2 30.9 1.5 6.9 187.6 49.8 99.1 48.2 17.4
Morristown 204,182 102,808 4.3 3.8 15.0 39.8 3.31 203.5 23.8 1.8 7.4 189.1 44.2 94.8 49.0 14.7
New Brunswick 190,802 96,187 4.7 5.1 19.4 31.4 2.57 186.6 31.6 2.2 7.0 204.7 50.3 98.2 52.1 13.0
Newark 360,757 179,074 4.6 4.7 18.9 27.1 1.58 161.8 21.4 1.2 6.8 226.1 53.5 100.8 52.7 17.9
Paterson 82,760 41,470 4.5 4.0 15.9 31.7 1.54 167.6 37.8 1.5 6.7 197.9 48.3 96.0 53.1 16.0
Ridgewood 87,371 43,825 5.0 3.4 12.5 37.0 2.76 202.9 34.8 1.6 7.1 185.1 43.6 90.5 49.8 11.9
New Mexico
Albuquerque 264,319 117,763 2.7 2.9 10.4 24.9 3.48 142.2 15.7 2.5 8.0 160.2 29.3 80.2 46.0 10.3
New York
Albany 480,393 240,305 5.3 2.4 10.2 23.6 1.76 208.6 28.4 1.8 7.3 186.4 42.3 87.9 51.5 12.5
Binghamton 110,194 55,190 4.5 3.2 13.3 30.6 1.76 259.2 22.9 2.4 7.0 198.8 40.2 87.4 50.4 11.2
Bronx 231,446 109,294 3.5 2.6 11.5 21.5 1.36 164.2 31.5 1.1 6.7 203.2 50.6 92.0 50.8 14.2
Buffalo 430,720 210,491 5.0 1.6 12.3 27.1 1.83 243.0 16.9 1.7 6.8 181.8 48.7 88.0 53.6 12.5
Elmira 111,156 55,460 5.2 3.6 14.5 35.6 1.84 283.0 23.4 1.5 7.0 198.7 41.4 85.5 52.0 11.2
East Long Island 1,075,989 508,296 4.7 3.7 13.3 26.9 1.48 213.8 30.4 1.2 6.8 181.9 52.7 90.2 50.0 12.9
TABLES
TURP for B
PH
Hospit
al Refe
rral R
egion
Medica
re Enro
llees
(1992
plus
1993
)
Medica
re Enro
llees
(1993
only)
CABG Surgery
PTCACoro
nary
Angiog
raphy
(1993
)
Prostat
e Biop
sy (1
993)
Radica
l Pros
tatec
tomy
Mammog
raphy
(1993
)
Percen
tage B
reast
Sparin
g
Surgery
Back S
urgery
Hip Fra
cture
High Vari
ation
Medica
l Con
dition
s
Percen
tage o
f Dea
ths
Occurr
ing in
Hos
pitals
All Surg
ical D
ischa
rges
Medica
re Mort
ality

182 THE DARTMOUTH ATLAS OF HEALTH CARE
New York 1,012,093 475,687 4.4 2.8 12.3 27.2 1.15 213.8 29.3 1.2 6.8 178.1 51.8 90.8 47.7 12.8
Rochester 311,540 148,825 4.8 2.5 12.2 17.9 1.97 264.8 25.5 2.1 7.3 174.3 40.4 90.8 51.6 12.2
Syracuse 267,579 134,058 4.0 2.8 10.8 20.5 2.28 289.1 18.1 1.5 6.8 175.1 40.8 86.9 51.9 10.4
White Plains 265,574 131,886 3.8 2.5 10.0 25.2 2.32 208.5 30.1 1.7 6.9 196.3 46.0 92.1 47.2 13.9
North Carolina
Asheville 176,098 88,828 3.9 2.4 9.9 22.5 4.24 200.5 8.5 3.4 8.3 166.7 35.9 84.5 48.6 12.2
Charlotte 372,100 187,765 4.9 4.6 17.6 30.7 3.39 156.3 10.9 3.0 9.3 157.9 40.1 87.1 53.5 10.9
Durham 280,019 141,273 5.7 4.5 18.6 21.9 3.74 210.0 12.3 2.7 8.3 163.1 39.0 86.5 52.5 12.2
Greensboro 121,709 61,470 5.5 6.9 19.8 21.5 3.18 189.4 8.5 3.4 8.9 164.4 36.3 94.1 52.7 12.8
Greenville 159,535 80,765 6.2 4.7 15.8 16.8 2.06 196.5 9.4 2.9 8.5 182.9 40.8 91.2 54.9 8.5
Hickory 58,787 29,765 5.5 4.2 15.8 26.9 3.54 163.3 3.4 3.2 8.7 164.7 38.9 88.4 52.0 9.0
Raleigh 253,253 128,251 5.3 4.3 14.7 21.9 2.86 187.2 9.5 3.6 8.3 177.1 43.0 91.3 54.3 10.5
Wilmington 77,736 39,504 5.5 3.9 13.3 24.6 2.74 183.4 8.2 2.9 8.4 186.0 40.4 94.0 55.0 9.5
Winston-Salem 237,676 119,943 5.5 4.5 17.2 25.6 3.55 176.9 5.9 2.9 8.7 188.8 43.3 95.1 52.8 14.1
North Dakota
Bismarck 61,250 30,726 6.0 3.9 13.6 25.8 3.91 255.6 6.2 4.1 6.4 218.4 34.1 99.9 44.6 13.3
Fargo Moorhead -Mn 144,770 72,408 4.9 4.1 12.3 24.2 2.77 213.6 4.5 2.4 7.0 170.4 33.8 93.4 44.9 12.6
Grand Forks 49,928 24,851 5.6 4.4 16.3 21.4 1.83 152.6 6.1 2.3 7.3 179.0 30.5 86.4 48.3 11.6
Minot 39,390 19,663 6.6 5.4 15.2 36.2 7.11 260.4 6.5 2.5 7.8 183.5 31.5 98.9 41.9 19.7
Ohio
Akron 178,666 88,492 6.4 5.5 19.2 21.5 1.78 210.3 11.5 3.0 7.8 215.6 43.0 98.4 54.0 10.1
Canton 169,709 85,218 5.3 3.5 13.8 16.8 1.52 194.2 10.8 2.7 7.6 172.6 35.0 87.0 52.4 11.3
Cincinnati 364,410 182,646 5.8 5.4 17.7 21.4 2.37 174.1 14.9 2.9 8.0 198.6 35.1 94.7 54.1 14.2
Cleveland 601,249 287,654 5.9 4.0 15.5 23.0 2.16 213.1 23.0 2.8 7.1 203.6 38.3 100.3 52.2 12.3
Columbus 589,377 296,162 4.7 5.9 18.4 24.0 2.59 180.9 11.6 2.1 7.9 202.1 36.3 97.2 54.8 13.6
Dayton 279,090 140,131 6.8 6.2 20.1 18.5 2.19 184.5 12.8 3.1 7.9 188.7 33.4 99.4 53.2 11.2
Elyria 58,453 29,207 5.5 9.1 21.9 29.4 1.58 209.5 48.0 2.7 6.8 220.8 34.3 114.0 53.2 13.5
Kettering 90,751 45,859 6.3 4.6 17.7 24.7 3.68 183.1 15.1 2.3 8.3 166.7 34.3 95.6 51.1 12.6
Toledo 248,902 124,817 4.3 4.4 13.6 34.9 2.32 188.7 13.4 3.4 7.8 209.3 37.0 105.3 53.7 13.5
Youngstown 230,392 115,687 5.5 4.1 15.2 30.3 2.29 242.6 20.3 2.5 7.1 226.1 41.1 103.9 53.4 17.0
Oklahoma
Lawton 48,282 24,123 5.9 4.4 13.5 20.8 1.64 145.3 14.3 3.3 8.6 178.4 40.3 88.2 50.8 9.9
Oklahoma City 413,680 204,818 5.6 6.0 18.5 28.3 4.70 131.2 11.7 3.2 8.6 204.0 43.8 102.7 52.4 15.5
Tulsa 302,808 146,680 4.5 5.5 15.9 22.7 2.49 182.7 8.1 3.3 8.9 182.4 39.1 90.4 52.6 12.4
Oregon
Bend 37,767 18,970 4.3 6.2 13.4 29.2 4.57 178.6 9.6 6.1 8.1 115.5 22.8 107.3 46.2 19.5
Eugene 175,298 84,848 4.0 3.9 10.5 24.8 4.51 203.6 18.9 5.2 7.7 135.2 24.6 90.6 49.6 14.0
Medford 123,096 61,774 4.3 2.4 9.9 15.0 2.52 207.2 8.0 4.1 7.0 126.1 24.5 82.6 48.2 11.2
Portland 492,638 168,475 4.2 3.8 10.5 20.7 4.44 181.1 17.1 4.4 7.4 135.8 22.8 84.9 55.2 11.5
Salem 66,808 28,785 4.4 4.0 10.2 20.7 3.72 164.1 15.3 4.1 7.3 108.1 29.0 82.3 50.3 9.2
Pennsylvania
Allentown 307,630 153,538 5.3 4.6 19.0 33.6 1.79 225.6 18.7 2.1 6.9 212.6 43.1 107.7 51.2 16.6
Altoona 95,138 47,695 6.1 2.5 13.8 20.1 0.88 188.3 20.4 2.1 7.3 219.1 40.9 92.1 53.6 15.3
Danville 156,618 78,692 4.7 2.8 13.2 24.2 2.05 241.9 17.8 2.8 7.0 208.1 38.8 96.9 52.5 14.6
Erie 224,883 112,798 4.6 4.2 13.8 22.6 2.20 217.3 19.8 2.3 7.6 220.1 39.1 94.2 52.6 13.2
Harrisburg 247,967 124,918 5.3 4.9 16.8 34.9 3.44 259.0 15.6 2.6 7.4 180.7 38.2 95.8 51.6 10.9
TURP for B
PH
Hospit
al Refe
rral R
egion
Medica
re Enro
llees
(1992
plus
1993
)
Medica
re Enro
llees
(1993
only)
CABG Surgery
PTCACoro
nary
Angiog
raphy
(1993
)
Prostat
e Biop
sy (1
993)
Radica
l Pros
tatec
tomy
Mammog
raphy
(1993
)
Percen
tage B
reast
Sparin
g
Surgery
Back S
urgery
Hip Fra
cture
High Vari
ation
Medica
l Con
dition
s
Percen
tage o
f Dea
ths
Occurr
ing in
Hos
pitals
All Surg
ical D
ischa
rges
Medica
re Mort
ality

183
Johnstown 88,606 44,399 6.0 5.5 20.8 25.7 1.82 169.2 32.2 2.6 6.7 273.5 43.4 105.4 52.3 13.3
Lancaster 137,147 69,132 6.0 5.9 23.4 33.5 4.44 207.5 16.4 4.3 7.0 168.4 30.4 100.0 47.7 12.5
Philadelphia 1,088,052 522,192 5.4 4.3 18.5 24.0 1.99 222.3 30.6 2.0 7.5 227.1 45.0 107.0 52.7 14.6
Pittsburgh 1,046,066 523,354 5.6 5.8 20.5 26.6 2.21 198.0 31.7 2.6 7.3 260.7 43.5 107.3 54.1 13.2
Reading 170,594 85,239 5.5 5.0 21.2 23.4 1.79 176.6 15.5 3.0 6.7 187.9 41.3 98.2 52.8 12.9
Sayre 55,790 28,008 4.0 3.0 14.6 20.7 0.90 210.3 14.1 2.1 7.2 215.2 40.0 92.0 50.6 9.7
Scranton 116,239 58,229 4.9 3.5 14.4 25.0 1.04 169.3 18.4 2.3 7.3 213.2 46.0 96.0 54.9 11.6
Wilkes-Barre 99,035 49,540 5.4 2.2 14.5 24.2 1.17 158.6 16.3 1.8 6.4 227.9 44.1 95.8 55.1 12.4
York 95,174 47,991 4.7 2.3 10.6 25.4 1.45 215.2 11.1 1.9 7.1 150.8 32.7 92.4 48.9 15.0
Rhode Island
Providence 323,129 152,455 4.3 3.2 11.5 20.2 1.21 189.6 22.4 1.6 7.0 189.1 37.6 89.9 50.6 12.6
South Carolina
Charleston 149,532 76,139 4.8 5.5 17.3 29.2 3.75 226.4 7.8 3.4 7.4 180.1 42.3 97.9 51.6 15.4
Columbia 215,258 108,229 5.3 4.9 17.6 21.8 2.14 141.8 6.8 2.2 7.8 160.1 40.6 85.7 52.8 10.1
Florence 76,879 38,625 5.1 7.3 20.4 31.1 0.89 234.4 8.3 2.7 8.6 249.6 44.4 100.4 56.7 15.1
Greenville 170,890 86,153 5.7 3.5 14.7 22.3 2.51 137.7 12.3 2.6 8.9 156.0 40.4 89.4 51.6 15.4
Spartanburg 83,215 41,804 4.2 4.0 15.1 28.4 4.41 136.4 5.8 2.1 9.5 173.7 43.1 88.7 54.9 15.0
South Dakota
Rapid City 43,988 22,138 5.2 3.2 11.5 8.5 3.24 208.4 1.4 2.7 6.9 177.1 29.6 92.2 48.9 19.3
Sioux Falls 235,367 117,471 5.3 5.3 16.2 26.3 3.82 167.5 10.9 2.6 6.6 185.5 32.9 98.5 44.3 14.8
Tennessee
Chattanooga 145,807 73,291 6.3 4.2 16.0 16.2 1.84 198.2 10.5 1.9 9.0 227.7 41.3 93.3 53.9 12.2
Jackson 92,838 46,308 6.6 3.9 20.0 15.5 4.22 126.5 9.5 2.9 8.9 213.9 46.3 89.5 53.7 13.4
Johnson City 60,397 30,336 4.7 3.8 16.0 13.2 1.94 167.0 15.8 1.6 8.1 214.6 43.7 84.4 52.0 11.4
Kingsport 129,915 65,304 3.9 2.9 14.7 19.3 0.95 170.9 6.8 1.1 8.5 284.3 51.0 80.1 54.8 9.7
Knoxville 295,620 148,780 5.5 4.1 16.9 19.0 2.76 149.7 8.4 2.0 9.4 245.7 45.3 92.3 54.7 13.2
Memphis 370,246 184,400 7.7 5.7 23.1 19.6 2.15 139.5 8.6 2.5 8.7 212.2 46.7 96.7 54.5 13.9
Nashville 473,628 238,276 5.6 3.4 17.7 16.9 3.05 145.5 10.7 3.6 8.9 252.1 40.5 96.6 54.2 13.2
Texas
Abilene 88,663 44,193 6.4 5.2 16.9 25.4 3.25 157.0 6.8 2.1 8.5 209.4 41.5 94.4 52.2 11.2
Amarillo 103,486 51,880 5.3 3.8 14.0 22.9 2.03 155.6 9.7 4.0 9.1 176.5 30.1 94.7 51.5 13.7
Austin 152,576 76,747 4.9 4.2 16.0 27.5 3.66 157.4 6.9 2.4 8.1 150.7 34.8 87.6 48.6 13.1
Beaumont 116,776 58,697 7.1 5.7 25.7 18.9 2.54 197.8 7.2 2.5 8.4 266.0 46.5 103.5 53.1 17.1
Bryan 36,591 18,365 5.3 4.3 16.1 16.4 2.64 213.1 14.3 4.0 7.8 156.2 32.2 79.0 51.0 5.8
Corpus Christi 106,690 48,764 6.1 4.5 18.0 32.2 1.26 191.3 4.9 2.1 8.0 229.3 41.7 102.4 53.3 19.4
Dallas 570,414 284,100 5.0 6.3 15.3 29.6 2.73 144.9 12.8 2.5 8.9 171.6 35.7 94.8 53.1 13.7
El Paso 149,077 75,702 4.5 3.9 12.9 19.8 1.62 117.5 6.1 2.1 7.1 162.3 38.7 82.2 48.3 14.8
Fort Worth 268,000 133,237 5.2 3.6 12.7 29.7 3.47 142.5 10.5 3.3 9.2 166.5 32.7 91.9 54.7 13.8
Harlingen 75,129 37,984 5.5 5.3 16.6 24.6 0.92 113.9 6.4 1.6 6.6 177.2 42.5 89.6 46.0 10.7
Houston 701,110 354,234 5.4 5.6 18.0 24.3 1.88 165.1 13.4 2.8 8.0 192.5 36.7 99.7 53.0 14.9
Longview 45,796 22,929 4.7 4.0 16.2 32.5 5.31 202.7 12.9 3.6 8.9 190.4 42.5 97.2 51.9 13.5
Lubbock 150,437 75,365 6.2 9.6 31.8 36.7 5.61 184.8 16.7 1.5 9.4 222.3 43.7 120.1 50.9 16.5
McAllen 60,689 30,892 6.7 7.0 21.0 8.3 1.23 143.5 17.6 2.0 6.1 149.2 44.0 94.7 43.7 17.3
Odessa 61,124 30,942 5.3 6.4 16.0 21.0 1.72 91.6 7.1 2.1 9.4 177.7 40.5 95.4 52.6 16.2
San Angelo 41,775 20,900 6.3 4.0 15.5 26.6 2.04 168.7 8.1 5.6 8.1 202.4 38.5 102.2 50.7 15.6
San Antonio 396,618 173,173 4.8 3.1 13.5 19.2 2.21 155.4 10.7 2.1 7.8 178.4 37.4 91.8 50.2 13.9
TABLES
TURP for B
PH
Hospit
al Refe
rral R
egion
Medica
re Enro
llees
(1992
plus
1993
)
Medica
re Enro
llees
(1993
only)
CABG Surgery
PTCACoro
nary
Angiog
raphy
(1993
)
Prostat
e Biop
sy (1
993)
Radica
l Pros
tatec
tomy
Mammog
raphy
(1993
)
Percen
tage B
reast
Sparin
g
Surgery
Back S
urgery
Hip Fra
cture
High Vari
ation
Medica
l Con
dition
s
Percen
tage o
f Dea
ths
Occurr
ing in
Hos
pitals
All Surg
ical D
ischa
rges
Medica
re Mort
ality
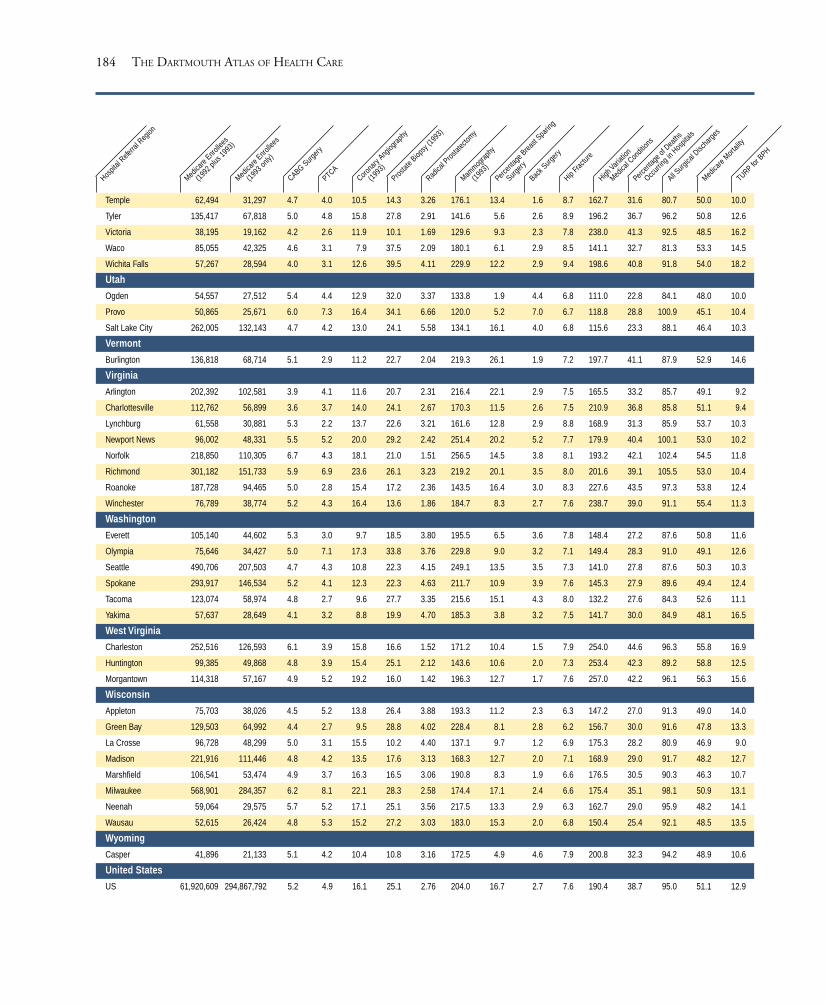
184 THE DARTMOUTH ATLAS OF HEALTH CARE
Temple 62,494 31,297 4.7 4.0 10.5 14.3 3.26 176.1 13.4 1.6 8.7 162.7 31.6 80.7 50.0 10.0
Tyler 135,417 67,818 5.0 4.8 15.8 27.8 2.91 141.6 5.6 2.6 8.9 196.2 36.7 96.2 50.8 12.6
Victoria 38,195 19,162 4.2 2.6 11.9 10.1 1.69 129.6 9.3 2.3 7.8 238.0 41.3 92.5 48.5 16.2
Waco 85,055 42,325 4.6 3.1 7.9 37.5 2.09 180.1 6.1 2.9 8.5 141.1 32.7 81.3 53.3 14.5
Wichita Falls 57,267 28,594 4.0 3.1 12.6 39.5 4.11 229.9 12.2 2.9 9.4 198.6 40.8 91.8 54.0 18.2
Utah
Ogden 54,557 27,512 5.4 4.4 12.9 32.0 3.37 133.8 1.9 4.4 6.8 111.0 22.8 84.1 48.0 10.0
Provo 50,865 25,671 6.0 7.3 16.4 34.1 6.66 120.0 5.2 7.0 6.7 118.8 28.8 100.9 45.1 10.4
Salt Lake City 262,005 132,143 4.7 4.2 13.0 24.1 5.58 134.1 16.1 4.0 6.8 115.6 23.3 88.1 46.4 10.3
Vermont
Burlington 136,818 68,714 5.1 2.9 11.2 22.7 2.04 219.3 26.1 1.9 7.2 197.7 41.1 87.9 52.9 14.6
Virginia
Arlington 202,392 102,581 3.9 4.1 11.6 20.7 2.31 216.4 22.1 2.9 7.5 165.5 33.2 85.7 49.1 9.2
Charlottesville 112,762 56,899 3.6 3.7 14.0 24.1 2.67 170.3 11.5 2.6 7.5 210.9 36.8 85.8 51.1 9.4
Lynchburg 61,558 30,881 5.3 2.2 13.7 22.6 3.21 161.6 12.8 2.9 8.8 168.9 31.3 85.9 53.7 10.3
Newport News 96,002 48,331 5.5 5.2 20.0 29.2 2.42 251.4 20.2 5.2 7.7 179.9 40.4 100.1 53.0 10.2
Norfolk 218,850 110,305 6.7 4.3 18.1 21.0 1.51 256.5 14.5 3.8 8.1 193.2 42.1 102.4 54.5 11.8
Richmond 301,182 151,733 5.9 6.9 23.6 26.1 3.23 219.2 20.1 3.5 8.0 201.6 39.1 105.5 53.0 10.4
Roanoke 187,728 94,465 5.0 2.8 15.4 17.2 2.36 143.5 16.4 3.0 8.3 227.6 43.5 97.3 53.8 12.4
Winchester 76,789 38,774 5.2 4.3 16.4 13.6 1.86 184.7 8.3 2.7 7.6 238.7 39.0 91.1 55.4 11.3
Washington
Everett 105,140 44,602 5.3 3.0 9.7 18.5 3.80 195.5 6.5 3.6 7.8 148.4 27.2 87.6 50.8 11.6
Olympia 75,646 34,427 5.0 7.1 17.3 33.8 3.76 229.8 9.0 3.2 7.1 149.4 28.3 91.0 49.1 12.6
Seattle 490,706 207,503 4.7 4.3 10.8 22.3 4.15 249.1 13.5 3.5 7.3 141.0 27.8 87.6 50.3 10.3
Spokane 293,917 146,534 5.2 4.1 12.3 22.3 4.63 211.7 10.9 3.9 7.6 145.3 27.9 89.6 49.4 12.4
Tacoma 123,074 58,974 4.8 2.7 9.6 27.7 3.35 215.6 15.1 4.3 8.0 132.2 27.6 84.3 52.6 11.1
Yakima 57,637 28,649 4.1 3.2 8.8 19.9 4.70 185.3 3.8 3.2 7.5 141.7 30.0 84.9 48.1 16.5
West Virginia
Charleston 252,516 126,593 6.1 3.9 15.8 16.6 1.52 171.2 10.4 1.5 7.9 254.0 44.6 96.3 55.8 16.9
Huntington 99,385 49,868 4.8 3.9 15.4 25.1 2.12 143.6 10.6 2.0 7.3 253.4 42.3 89.2 58.8 12.5
Morgantown 114,318 57,167 4.9 5.2 19.2 16.0 1.42 196.3 12.7 1.7 7.6 257.0 42.2 96.1 56.3 15.6
Wisconsin
Appleton 75,703 38,026 4.5 5.2 13.8 26.4 3.88 193.3 11.2 2.3 6.3 147.2 27.0 91.3 49.0 14.0
Green Bay 129,503 64,992 4.4 2.7 9.5 28.8 4.02 228.4 8.1 2.8 6.2 156.7 30.0 91.6 47.8 13.3
La Crosse 96,728 48,299 5.0 3.1 15.5 10.2 4.40 137.1 9.7 1.2 6.9 175.3 28.2 80.9 46.9 9.0
Madison 221,916 111,446 4.8 4.2 13.5 17.6 3.13 168.3 12.7 2.0 7.1 168.9 29.0 91.7 48.2 12.7
Marshfield 106,541 53,474 4.9 3.7 16.3 16.5 3.06 190.8 8.3 1.9 6.6 176.5 30.5 90.3 46.3 10.7
Milwaukee 568,901 284,357 6.2 8.1 22.1 28.3 2.58 174.4 17.1 2.4 6.6 175.4 35.1 98.1 50.9 13.1
Neenah 59,064 29,575 5.7 5.2 17.1 25.1 3.56 217.5 13.3 2.9 6.3 162.7 29.0 95.9 48.2 14.1
Wausau 52,615 26,424 4.8 5.3 15.2 27.2 3.03 183.0 15.3 2.0 6.8 150.4 25.4 92.1 48.5 13.5
Wyoming
Casper 41,896 21,133 5.1 4.2 10.4 10.8 3.16 172.5 4.9 4.6 7.9 200.8 32.3 94.2 48.9 10.6
United States
US 61,920,609 294,867,792 5.2 4.9 16.1 25.1 2.76 204.0 16.7 2.7 7.6 190.4 38.7 95.0 51.1 12.9
TURP for B
PH
Hospit
al Refe
rral R
egion
Medica
re Enro
llees
(1992
plus
1993
)
Medica
re Enro
llees
(1993
only)
CABG Surgery
PTCACoro
nary
Angiog
raphy
(1993
)
Prostat
e Biop
sy (1
993)
Radica
l Pros
tatec
tomy
Mammog
raphy
(1993
)
Percen
tage B
reast
Sparin
g
Surgery
Back S
urgery
Hip Fra
cture
High Vari
ation
Medica
l Con
dition
s
Percen
tage o
f Dea
ths
Occurr
ing in
Hos
pitals
All Surg
ical D
ischa
rges
Medica
re Mort
ality

185TABLES
*All rates are age, sex, and race adjusted. With the exception
of “Percentage of Deaths Occurring in Hospitals” and “Per-
centage Breast Sparing Surgery,” rates are per 1,000 enrollees;
the rates for surgery are for 1992-93, using a two-year “per-
son-year” denominator as given in the column labeled
“Medicare Enrollees (1992 plus 1993).” The apparent dis-
crepancy (e.g., in certain California hospital referral regions)
between the two-year and the 1993 counts is explained by the
rapid growth of enrollment in risk bearing health mainte-
nance organizations in some hospital referral regions. Rates
for mammography and prostate biopsies are for 1993 and are
sex-specific. For mammography, prostate biopsy, and coro-
nary angiography, only one procedure per person is counted;
i.e., the numerator is individuals with one or more procedures
in 1993. To convert to percentages, move the decimal one
place to the left. Data exclude Medicare enrollees who are
members of risk bearing health maintenance organizations.
For benchmarking, two-year Medicare enrollee counts should
be used for 1992-93 rates; 1993 counts should be used for
1993 rates. CABG = coronary artery bypass grafting; PTCA =
percutaneous transluminal coronary angioplasty. “Percentage
Breast Sparing Surgery” is the percentage of all inpatient
breast cancer surgery (radical, complete, and partial mastec-
tomies, and lumpectomies) that were partial mastectomies or
lumpectomies; “Percentage of Deaths Occurring in Hospi-
tals” is the percentage of all Medicare deaths in hospital
referral regions in 1992-93 that occurred in hospitals. TURP
for BPH = transurethral prostatectomy for patients with be-
nign prostatic hyperplasia. Specific codes used to define the
numerator for rates, and methods of age, sex, and race adjust-
ment are given in Part Nine, Sections 3 and 6.

186 THE DARTMOUTH ATLAS OF HEALTH CARE
Description of Variables for Table 4
Figure List
7.4
3.2, 4.3, 4.6, 4.7
7.4
4.2, 4.7
5.4, 5.5
7.4, 7.6
4.1
7.4
4.5
7.4
4.4, 4.6
Description
The Medicare Population in 1993
Part A Short Stay Reimbursementsper Medicare Enrollee obtainedfrom the 5% CHMS
Price Adjusted Part A Short StayReimbursements per MedicareEnrollee obtained from the 5%CHMS
Part B Reimbursement Rates forProfessional and Lab Servicesobtained from the 5% CHMS
Price Adjusted Part B Reimburse-ment Rates for Professional andLab Services obtained from the5% CHMS
Price Adjusted Part B Reimburse-ment Rates for Physicians’ Medicaland Surgical Services obtainedfrom the 5% CHMS
Total Part A and Part B Reim-bursement Rates for all Servicesobtained from the 5% CHMS
Price Adjusted Total Part A andPart B Reimbursement Rates forall Services obtained from the 5%CHMS
Reimbursement Rates for HomeHealth Care obtained from the 5%CHMS
Price Adjusted Part A Reimburse-ment Rates for Home Health Careobtained from the 5% CHMS
Reimbursement Rates forOutpatient Facilities obtained fromthe 5% CHMS
Price Adjusted Part B Reimburse-ment Rates for Outpatient Facilitiesobtained from the 5% CHMS
Variable
Medicare Population, 1993
Part A Short StayReimbursements
Dartmouth Price AdjustedPart A Short StayReimbursements
Part B Reimbursementsfor Professional and LabServices
HCFA Price Adjusted PartB Professional and LabServices
HCFA Price Adjusted PartB Medical and SurgicalServices
Total Part A and Part BReimbursements
Dartmouth Price AdjustedTotal A and B Reimburse-ments
Home Health CareReimbursements
Dartmouth Price AdjustedHome Health CareReimbursements
Outpatient FacilitiesReimbursements
Dartmouth Price AdjustedOutpatient FacilitiesReimbursements
Price Adjustment
Price Index for Medicare Population, 1993
Price Index for Medicare Population, 1993
Price Index for Medicare Population, 1993
Price Index for Medicare Population, 1993was used for the Physician components ofthe total while the Dartmouth Price Indexfor Medicare Population, 1993 was used forthe rest.
Price Index for Medicare Population, 1993
Price Index for Medicare Population, 1993
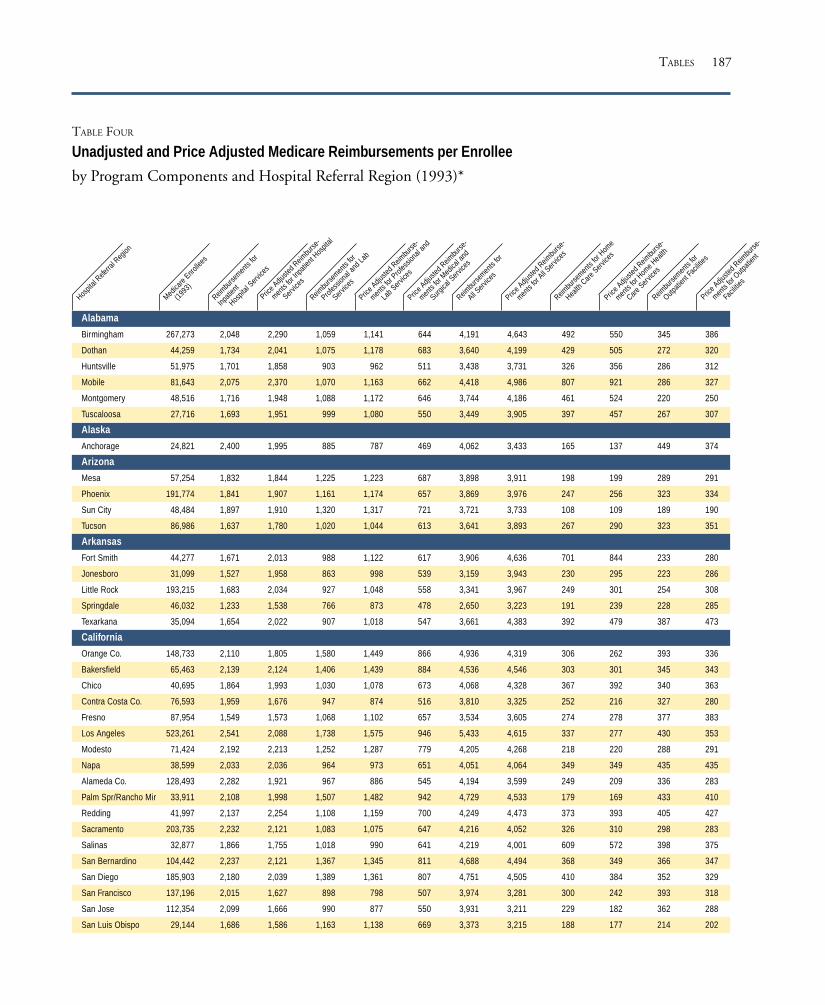
187
TABLE FOUR
Unadjusted and Price Adjusted Medicare Reimbursements per Enrollee
by Program Components and Hospital Referral Region (1993)*
Alabama
Birmingham 267,273 2,048 2,290 1,059 1,141 644 4,191 4,643 492 550 345 386
Dothan 44,259 1,734 2,041 1,075 1,178 683 3,640 4,199 429 505 272 320
Huntsville 51,975 1,701 1,858 903 962 511 3,438 3,731 326 356 286 312
Mobile 81,643 2,075 2,370 1,070 1,163 662 4,418 4,986 807 921 286 327
Montgomery 48,516 1,716 1,948 1,088 1,172 646 3,744 4,186 461 524 220 250
Tuscaloosa 27,716 1,693 1,951 999 1,080 550 3,449 3,905 397 457 267 307
Alaska
Anchorage 24,821 2,400 1,995 885 787 469 4,062 3,433 165 137 449 374
Arizona
Mesa 57,254 1,832 1,844 1,225 1,223 687 3,898 3,911 198 199 289 291
Phoenix 191,774 1,841 1,907 1,161 1,174 657 3,869 3,976 247 256 323 334
Sun City 48,484 1,897 1,910 1,320 1,317 721 3,721 3,733 108 109 189 190
Tucson 86,986 1,637 1,780 1,020 1,044 613 3,641 3,893 267 290 323 351
Arkansas
Fort Smith 44,277 1,671 2,013 988 1,122 617 3,906 4,636 701 844 233 280
Jonesboro 31,099 1,527 1,958 863 998 539 3,159 3,943 230 295 223 286
Little Rock 193,215 1,683 2,034 927 1,048 558 3,341 3,967 249 301 254 308
Springdale 46,032 1,233 1,538 766 873 478 2,650 3,223 191 239 228 285
Texarkana 35,094 1,654 2,022 907 1,018 547 3,661 4,383 392 479 387 473
California
Orange Co. 148,733 2,110 1,805 1,580 1,449 866 4,936 4,319 306 262 393 336
Bakersfield 65,463 2,139 2,124 1,406 1,439 884 4,536 4,546 303 301 345 343
Chico 40,695 1,864 1,993 1,030 1,078 673 4,068 4,328 367 392 340 363
Contra Costa Co. 76,593 1,959 1,676 947 874 516 3,810 3,325 252 216 327 280
Fresno 87,954 1,549 1,573 1,068 1,102 657 3,534 3,605 274 278 377 383
Los Angeles 523,261 2,541 2,088 1,738 1,575 946 5,433 4,615 337 277 430 353
Modesto 71,424 2,192 2,213 1,252 1,287 779 4,205 4,268 218 220 288 291
Napa 38,599 2,033 2,036 964 973 651 4,051 4,064 349 349 435 435
Alameda Co. 128,493 2,282 1,921 967 886 545 4,194 3,599 249 209 336 283
Palm Spr/Rancho Mir 33,911 2,108 1,998 1,507 1,482 942 4,729 4,533 179 169 433 410
Redding 41,997 2,137 2,254 1,108 1,159 700 4,249 4,473 373 393 405 427
Sacramento 203,735 2,232 2,121 1,083 1,075 647 4,216 4,052 326 310 298 283
Salinas 32,877 1,866 1,755 1,018 990 641 4,219 4,001 609 572 398 375
San Bernardino 104,442 2,237 2,121 1,367 1,345 811 4,688 4,494 368 349 366 347
San Diego 185,903 2,180 2,039 1,389 1,361 807 4,751 4,505 410 384 352 329
San Francisco 137,196 2,015 1,627 898 798 507 3,974 3,281 300 242 393 318
San Jose 112,354 2,099 1,666 990 877 550 3,931 3,211 229 182 362 288
San Luis Obispo 29,144 1,686 1,586 1,163 1,138 669 3,373 3,215 188 177 214 202
TABLES
Hospit
al Refe
rral R
egion
Medica
re Enro
llees
(1993
)
Reimbu
rsemen
ts for
Inpati
ent
Hospit
al Serv
ices
Price A
djuste
d Reim
burse
-
ments
for In
patie
nt Hos
pital
Service
s
Reimbu
rsemen
ts for
Profes
siona
l and
Lab
Service
s
Price A
djuste
d Reim
burse
-
ments
for Prof
essio
nal a
nd
Lab S
ervice
s
Price A
djuste
d Reim
burse
-
ments
for M
edica
l and
Surgica
l Serv
ices
Reimbu
rsemen
ts for
All Serv
ices
Price A
djuste
d Reim
burse
-
ments
for All S
ervice
s
Reimbu
rsemen
ts for
Hom
e
Health
Care
Service
s
Reimbu
rsemen
ts for
Outpati
ent F
acilit
ies
Price A
djuste
d Reim
burse
-
ments
for H
ome H
ealth
Care S
ervice
s
Price A
djuste
d Reim
burse
-
ments
for O
utpati
ent
Facil
ities

188 THE DARTMOUTH ATLAS OF HEALTH CARE
San Mateo Co. 71,053 1,955 1,541 814 714 480 3,526 2,852 181 143 343 270
Santa Barbara 39,885 1,580 1,434 1,190 1,129 684 3,704 3,412 226 206 295 268
Santa Cruz 24,868 2,183 1,972 1,088 1,021 642 4,283 3,906 483 437 290 262
Santa Rosa 52,191 1,843 1,667 1,053 999 629 3,871 3,548 326 294 278 252
Stockton 42,941 2,118 2,072 1,168 1,170 747 4,141 4,077 174 170 379 371
Ventura 48,138 2,115 1,845 1,499 1,389 826 4,588 4,082 303 265 368 321
Colorado
Boulder 14,906 1,553 1,609 778 794 442 3,343 3,450 325 336 281 291
Colorado Springs 56,562 1,618 1,798 803 859 468 3,399 3,745 252 280 321 357
Denver 163,270 1,870 1,939 866 893 504 3,779 3,914 329 341 366 380
Fort Collins 23,445 1,795 1,998 894 953 540 3,785 4,171 315 350 428 477
Grand Junction 29,020 1,232 1,472 521 572 300 2,495 2,933 226 271 307 367
Greeley 28,585 1,537 1,750 776 833 482 3,076 3,451 232 264 288 327
Pueblo 19,628 1,612 1,856 757 823 420 3,454 3,928 390 449 302 347
Connecticut
Bridgeport 88,105 1,743 1,419 1,089 967 560 3,822 3,192 475 386 364 296
Hartford 188,277 1,915 1,647 1,025 946 574 3,913 3,429 342 294 390 335
New Haven 175,454 2,025 1,669 1,138 1,017 599 4,109 3,465 348 287 385 318
Delaware
Wilmington 73,666 2,321 2,134 1,180 1,144 681 4,228 3,948 224 206 359 330
District of Columbia
Washington 212,972 2,291 2,068 1,152 1,091 660 4,155 3,803 181 163 388 351
Florida
Bradenton 48,677 1,676 1,810 1,234 1,243 701 3,610 3,808 269 291 211 228
Clearwater 96,789 1,612 1,715 1,335 1,346 769 3,948 4,127 405 431 201 214
Fort Lauderdale 333,215 1,824 1,755 1,670 1,559 913 4,597 4,375 434 418 351 337
Fort Myers 157,591 1,722 1,903 1,407 1,427 823 4,129 4,427 390 431 305 337
Gainesville 53,306 1,633 1,856 1,131 1,173 637 3,992 4,425 590 671 360 410
Hudson 86,583 1,877 1,998 1,497 1,509 853 4,427 4,621 559 595 254 270
Jacksonville 128,785 1,930 2,102 1,350 1,384 799 4,284 4,579 394 430 347 378
Lakeland 41,935 1,344 1,518 1,073 1,116 640 3,113 3,418 281 317 232 262
Miami 236,134 2,440 2,297 2,635 2,380 1,034 6,429 5,966 650 612 427 401
Ocala 81,014 1,320 1,546 1,218 1,282 697 3,342 3,758 338 396 256 300
Orlando 346,135 1,809 1,932 1,384 1,395 784 4,295 4,501 509 543 285 304
Ormond Beach 45,451 1,696 1,893 1,158 1,190 710 3,827 4,166 400 446 349 389
Panama City 21,241 2,295 2,674 1,427 1,513 862 4,931 5,596 523 609 315 367
Pensacola 71,683 1,914 2,200 1,097 1,163 692 4,161 4,686 564 648 357 410
Sarasota 93,972 1,393 1,509 1,223 1,234 718 3,491 3,689 414 448 241 260
St Petersburg 72,798 1,754 1,867 1,314 1,325 762 4,242 4,443 472 502 311 331
Tallahassee 71,944 1,567 1,787 977 1,035 591 3,526 3,943 340 388 312 355
Tampa 94,672 1,864 1,984 1,301 1,311 744 4,148 4,340 396 422 255 271
Georgia
Albany 22,092 1,763 2,001 830 892 534 3,394 3,800 416 472 288 327
Atlanta 343,564 2,106 2,147 1,096 1,113 621 4,173 4,250 479 488 321 328
Augusta 61,150 2,066 2,245 1,010 1,070 585 4,126 4,453 412 447 339 369
Columbus 33,178 1,603 1,852 973 1,051 601 3,322 3,767 355 410 248 287
Hospit
al Refe
rral R
egion
Medica
re Enro
llees
(1993
)
Reimbu
rsemen
ts for
Inpati
ent
Hospit
al Serv
ices
Price A
djuste
d Reim
burse
-
ments
for In
patie
nt Hos
pital
Service
s
Reimbu
rsemen
ts for
Profes
siona
l and
Lab
Service
s
Price A
djuste
d Reim
burse
-
ments
for Prof
essio
nal a
nd
Lab S
ervice
s
Price A
djuste
d Reim
burse
-
ments
for M
edica
l and
Surgica
l Serv
ices
Reimbu
rsemen
ts for
All Serv
ices
Price A
djuste
d Reim
burse
-
ments
for All S
ervice
s
Reimbu
rsemen
ts for
Hom
e
Health
Care
Service
s
Reimbu
rsemen
ts for
Outpati
ent F
acilit
ies
Price A
djuste
d Reim
burse
-
ments
for H
ome H
ealth
Care S
ervice
s
Price A
djuste
d Reim
burse
-
ments
for O
utpati
ent
Facil
ities
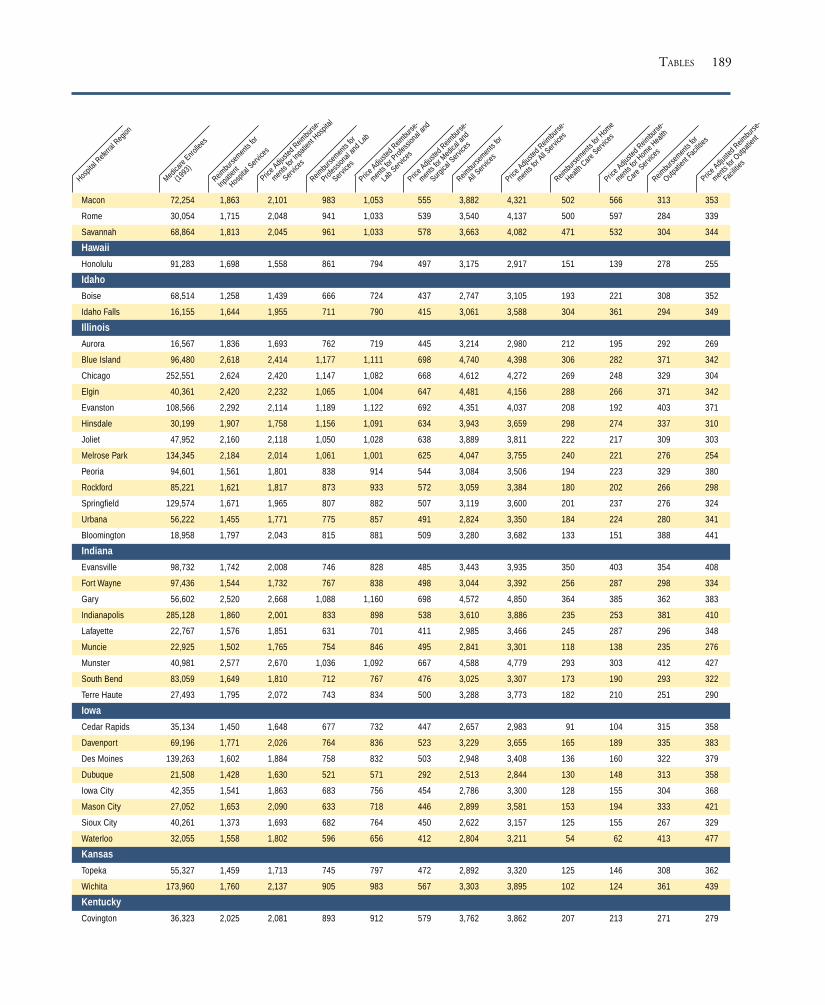
189
Macon 72,254 1,863 2,101 983 1,053 555 3,882 4,321 502 566 313 353
Rome 30,054 1,715 2,048 941 1,033 539 3,540 4,137 500 597 284 339
Savannah 68,864 1,813 2,045 961 1,033 578 3,663 4,082 471 532 304 344
Hawaii
Honolulu 91,283 1,698 1,558 861 794 497 3,175 2,917 151 139 278 255
Idaho
Boise 68,514 1,258 1,439 666 724 437 2,747 3,105 193 221 308 352
Idaho Falls 16,155 1,644 1,955 711 790 415 3,061 3,588 304 361 294 349
Illinois
Aurora 16,567 1,836 1,693 762 719 445 3,214 2,980 212 195 292 269
Blue Island 96,480 2,618 2,414 1,177 1,111 698 4,740 4,398 306 282 371 342
Chicago 252,551 2,624 2,420 1,147 1,082 668 4,612 4,272 269 248 329 304
Elgin 40,361 2,420 2,232 1,065 1,004 647 4,481 4,156 288 266 371 342
Evanston 108,566 2,292 2,114 1,189 1,122 692 4,351 4,037 208 192 403 371
Hinsdale 30,199 1,907 1,758 1,156 1,091 634 3,943 3,659 298 274 337 310
Joliet 47,952 2,160 2,118 1,050 1,028 638 3,889 3,811 222 217 309 303
Melrose Park 134,345 2,184 2,014 1,061 1,001 625 4,047 3,755 240 221 276 254
Peoria 94,601 1,561 1,801 838 914 544 3,084 3,506 194 223 329 380
Rockford 85,221 1,621 1,817 873 933 572 3,059 3,384 180 202 266 298
Springfield 129,574 1,671 1,965 807 882 507 3,119 3,600 201 237 276 324
Urbana 56,222 1,455 1,771 775 857 491 2,824 3,350 184 224 280 341
Bloomington 18,958 1,797 2,043 815 881 509 3,280 3,682 133 151 388 441
Indiana
Evansville 98,732 1,742 2,008 746 828 485 3,443 3,935 350 403 354 408
Fort Wayne 97,436 1,544 1,732 767 838 498 3,044 3,392 256 287 298 334
Gary 56,602 2,520 2,668 1,088 1,160 698 4,572 4,850 364 385 362 383
Indianapolis 285,128 1,860 2,001 833 898 538 3,610 3,886 235 253 381 410
Lafayette 22,767 1,576 1,851 631 701 411 2,985 3,466 245 287 296 348
Muncie 22,925 1,502 1,765 754 846 495 2,841 3,301 118 138 235 276
Munster 40,981 2,577 2,670 1,036 1,092 667 4,588 4,779 293 303 412 427
South Bend 83,059 1,649 1,810 712 767 476 3,025 3,307 173 190 293 322
Terre Haute 27,493 1,795 2,072 743 834 500 3,288 3,773 182 210 251 290
Iowa
Cedar Rapids 35,134 1,450 1,648 677 732 447 2,657 2,983 91 104 315 358
Davenport 69,196 1,771 2,026 764 836 523 3,229 3,655 165 189 335 383
Des Moines 139,263 1,602 1,884 758 832 503 2,948 3,408 136 160 322 379
Dubuque 21,508 1,428 1,630 521 571 292 2,513 2,844 130 148 313 358
Iowa City 42,355 1,541 1,863 683 756 454 2,786 3,300 128 155 304 368
Mason City 27,052 1,653 2,090 633 718 446 2,899 3,581 153 194 333 421
Sioux City 40,261 1,373 1,693 682 764 450 2,622 3,157 125 155 267 329
Waterloo 32,055 1,558 1,802 596 656 412 2,804 3,211 54 62 413 477
Kansas
Topeka 55,327 1,459 1,713 745 797 472 2,892 3,320 125 146 308 362
Wichita 173,960 1,760 2,137 905 983 567 3,303 3,895 102 124 361 439
Kentucky
Covington 36,323 2,025 2,081 893 912 579 3,762 3,862 207 213 271 279
TABLES
Hospit
al Refe
rral R
egion
Medica
re Enro
llees
(1993
)
Reimbu
rsemen
ts for
Inpati
ent
Hospit
al Serv
ices
Price A
djuste
d Reim
burse
-
ments
for In
patie
nt Hos
pital
Service
s
Reimbu
rsemen
ts for
Profes
siona
l and
Lab
Service
s
Price A
djuste
d Reim
burse
-
ments
for Prof
essio
nal a
nd
Lab S
ervice
s
Price A
djuste
d Reim
burse
-
ments
for M
edica
l and
Surgica
l Serv
ices
Reimbu
rsemen
ts for
All Serv
ices
Price A
djuste
d Reim
burse
-
ments
for All S
ervice
s
Reimbu
rsemen
ts for
Hom
e
Health
Care
Service
s
Reimbu
rsemen
ts for
Outpati
ent F
acilit
ies
Price A
djuste
d Reim
burse
-
ments
for H
ome H
ealth
Care S
ervice
s
Price A
djuste
d Reim
burse
-
ments
for O
utpati
ent
Facil
ities

190 THE DARTMOUTH ATLAS OF HEALTH CARE
Lexington 149,367 1,725 2,029 871 958 503 3,408 3,943 287 337 294 346
Louisville 184,422 1,943 2,156 1,004 1,084 623 3,897 4,294 275 305 288 320
Owensboro 17,827 1,914 2,285 876 971 579 3,483 4,083 286 341 293 350
Paducah 56,798 1,626 1,993 979 1,097 626 3,314 3,958 240 294 283 347
Louisiana
Alexandria 33,956 1,988 2,383 969 1,065 564 4,023 4,721 568 681 277 332
Baton Rouge 70,303 2,014 2,259 1,187 1,275 643 4,910 5,446 920 1,032 338 379
Houma 22,428 2,271 2,669 1,350 1,477 791 4,850 5,592 736 865 354 417
Lafayette 57,451 1,972 2,318 1,125 1,235 600 3,926 4,528 386 453 291 342
Lake Charles 25,554 2,251 2,539 935 1,000 552 4,124 4,597 442 499 318 358
Metairie 45,778 2,572 2,701 1,317 1,364 787 5,320 5,569 708 743 419 440
Monroe 33,888 2,072 2,489 1,072 1,180 649 4,574 5,377 803 964 294 353
New Orleans 91,028 2,556 2,623 1,279 1,310 742 5,262 5,391 682 700 395 406
Shreveport 83,987 1,824 2,111 933 1,012 584 3,655 4,161 308 356 345 399
Slidell 15,398 2,682 2,956 1,246 1,332 802 5,139 5,625 427 471 501 552
Maine
Bangor 54,720 1,618 1,827 733 780 450 2,997 3,336 331 374 270 305
Portland 127,579 1,680 1,788 825 849 507 3,211 3,389 293 312 300 319
Maryland
Baltimore 274,625 2,803 2,656 1,234 1,200 691 4,890 4,664 203 193 499 473
Salisbury 51,104 2,096 2,240 1,024 1,070 659 3,785 4,020 126 134 360 385
Takoma Park 64,654 2,613 2,239 1,353 1,241 723 4,689 4,100 174 150 376 322
Massachusetts
Boston 578,227 2,467 2,188 1,086 1,009 569 4,763 4,269 474 420 418 371
Springfield 102,782 2,000 1,972 857 843 510 3,755 3,702 307 303 347 343
Worcester 78,247 2,336 2,061 1,011 938 557 4,417 3,943 409 361 411 362
Michigan
Ann Arbor 128,729 2,453 2,299 1,277 1,169 677 4,619 4,300 251 235 461 432
Dearborn 72,348 2,283 2,052 1,473 1,296 747 4,677 4,167 274 246 465 418
Detroit 233,448 2,427 2,181 1,480 1,302 730 4,715 4,212 231 208 410 369
Flint 56,620 2,561 2,426 1,408 1,337 715 4,857 4,603 277 263 451 428
Grand Rapids 110,852 1,480 1,545 831 822 472 2,980 3,066 181 189 317 331
Kalamazoo 76,422 1,982 2,073 920 913 521 3,631 3,747 172 180 348 364
Lansing 62,071 1,938 2,020 993 981 577 3,624 3,722 208 217 350 364
Marquette 32,731 1,680 1,890 739 758 465 3,224 3,555 418 470 333 374
Muskegon 34,125 1,413 1,462 797 784 489 2,942 3,003 216 224 365 378
Petoskey 24,459 1,452 1,634 845 866 521 3,078 3,378 288 325 333 375
Pontiac 34,300 2,446 2,199 1,496 1,315 709 4,769 4,253 232 208 441 397
Royal Oak 80,077 2,299 2,066 1,552 1,365 743 4,753 4,240 283 254 439 395
Saginaw 93,134 2,009 2,098 984 980 562 3,736 3,853 224 234 379 396
St Joseph 19,488 1,783 1,910 1,000 1,003 606 3,531 3,714 222 238 356 381
Traverse City 30,614 1,782 2,005 889 912 546 3,417 3,756 255 286 368 415
Minnesota
Duluth 55,265 1,697 1,891 510 546 328 2,875 3,184 196 218 291 325
Minneapolis 278,212 1,640 1,758 555 585 349 2,794 2,984 95 102 298 319
Rochester 55,172 1,618 1,791 624 671 389 2,639 2,900 46 51 239 265
Hospit
al Refe
rral R
egion
Medica
re Enro
llees
(1993
)
Reimbu
rsemen
ts for
Inpati
ent
Hospit
al Serv
ices
Price A
djuste
d Reim
burse
-
ments
for In
patie
nt Hos
pital
Service
s
Reimbu
rsemen
ts for
Profes
siona
l and
Lab
Service
s
Price A
djuste
d Reim
burse
-
ments
for Prof
essio
nal a
nd
Lab S
ervice
s
Price A
djuste
d Reim
burse
-
ments
for M
edica
l and
Surgica
l Serv
ices
Reimbu
rsemen
ts for
All Serv
ices
Price A
djuste
d Reim
burse
-
ments
for All S
ervice
s
Reimbu
rsemen
ts for
Hom
e
Health
Care
Service
s
Reimbu
rsemen
ts for
Outpati
ent F
acilit
ies
Price A
djuste
d Reim
burse
-
ments
for H
ome H
ealth
Care S
ervice
s
Price A
djuste
d Reim
burse
-
ments
for O
utpati
ent
Facil
ities

191
St Cloud 25,133 1,411 1,602 595 646 385 2,474 2,779 106 120 251 285
St Paul 71,704 1,754 1,723 605 609 351 3,098 3,057 145 143 326 320
Mississippi
Gulfport 18,555 2,335 2,639 1,070 1,169 681 4,582 5,142 718 812 327 370
Hattiesburg 31,739 1,927 2,409 1,001 1,136 647 3,812 4,646 526 658 242 302
Jackson 119,625 1,547 1,835 880 971 525 3,503 4,076 598 710 258 306
Meridian 26,687 1,444 1,805 854 969 562 3,063 3,727 371 463 197 246
Oxford 17,195 1,767 2,209 771 875 531 3,533 4,314 598 747 207 259
Tupelo 44,485 1,587 1,981 719 815 483 3,123 3,812 408 509 263 328
Missouri
Cape Girardeau 38,572 1,344 1,726 708 794 478 2,667 3,311 187 240 333 428
Columbia 88,769 1,802 2,260 767 846 506 3,444 4,203 286 359 387 485
Joplin 52,556 1,580 1,993 750 839 483 3,106 3,810 278 350 325 411
Kansas City 241,129 1,797 1,973 974 1,011 582 3,738 4,045 266 291 371 407
Springfield 106,164 1,568 1,932 762 841 494 3,135 3,764 215 265 380 469
St Louis 418,988 1,947 2,107 877 911 533 3,662 3,924 272 294 348 377
Montana
Billings 60,821 1,594 1,896 753 827 444 3,010 3,511 179 213 324 386
Great Falls 19,886 1,836 2,225 765 847 454 3,337 3,965 227 275 365 443
Missoula 41,374 1,486 1,816 680 754 425 2,766 3,304 187 228 269 329
Nebraska
Lincoln 79,126 1,111 1,413 632 723 432 2,208 2,729 100 127 295 375
Omaha 151,270 1,427 1,741 736 827 497 2,814 3,365 157 192 375 458
Nevada
Las Vegas 86,110 1,889 1,822 1,531 1,512 822 4,488 4,356 501 483 241 232
Reno 59,800 1,667 1,680 1,056 1,059 591 3,531 3,549 264 266 275 277
New Hampshire
Lebanon 53,424 1,595 1,726 655 679 403 3,022 3,240 322 348 369 399
Manchester 82,822 1,657 1,553 784 750 454 3,133 2,952 237 222 292 273
New Jersey
Camden 357,129 2,364 2,127 1,275 1,206 730 4,382 4,002 192 173 343 308
Hackensack 158,231 2,050 1,666 1,246 1,113 696 3,936 3,299 167 136 322 262
Morristown 102,808 2,256 1,846 1,214 1,099 660 4,145 3,497 171 140 317 260
New Brunswick 96,187 2,380 1,962 1,231 1,114 670 4,214 3,573 168 139 261 215
Newark 179,074 2,631 2,155 1,260 1,145 725 4,514 3,810 176 144 331 271
Paterson 41,470 2,487 2,019 1,237 1,111 702 4,324 3,616 158 128 279 226
Ridgewood 43,825 2,124 1,747 1,232 1,097 674 4,040 3,407 135 111 337 277
New Mexico
Albuquerque 117,763 1,256 1,407 756 809 453 2,871 3,178 172 193 384 430
New York
Albany 240,305 1,667 1,653 941 947 555 3,186 3,173 189 187 256 254
Binghamton 55,190 1,586 1,669 790 827 520 2,935 3,083 166 175 291 306
Bronx 109,294 3,157 2,476 1,362 1,158 726 5,346 4,279 249 195 406 319
Buffalo 210,491 1,568 1,601 880 909 515 3,027 3,100 204 209 276 282
Elmira 55,460 1,787 1,940 898 950 562 3,129 3,371 98 106 275 299
East Long Island 508,296 2,581 2,001 1,461 1,227 736 4,739 3,769 244 189 292 226
TABLES
Hospit
al Refe
rral R
egion
Medica
re Enro
llees
(1993
)
Reimbu
rsemen
ts for
Inpati
ent
Hospit
al Serv
ices
Price A
djuste
d Reim
burse
-
ments
for In
patie
nt Hos
pital
Service
s
Reimbu
rsemen
ts for
Profes
siona
l and
Lab
Service
s
Price A
djuste
d Reim
burse
-
ments
for Prof
essio
nal a
nd
Lab S
ervice
s
Price A
djuste
d Reim
burse
-
ments
for M
edica
l and
Surgica
l Serv
ices
Reimbu
rsemen
ts for
All Serv
ices
Price A
djuste
d Reim
burse
-
ments
for All S
ervice
s
Reimbu
rsemen
ts for
Hom
e
Health
Care
Service
s
Reimbu
rsemen
ts for
Outpati
ent F
acilit
ies
Price A
djuste
d Reim
burse
-
ments
for H
ome H
ealth
Care S
ervice
s
Price A
djuste
d Reim
burse
-
ments
for O
utpati
ent
Facil
ities

192 THE DARTMOUTH ATLAS OF HEALTH CARE
New York 475,687 3,038 2,382 1,558 1,325 789 5,331 4,285 265 208 379 297
Rochester 148,825 1,863 1,855 770 780 456 3,244 3,244 228 227 295 294
Syracuse 134,058 1,825 1,891 898 928 523 3,252 3,366 132 137 265 275
White Plains 131,886 2,359 1,900 1,263 1,090 680 4,214 3,466 162 130 280 226
North Carolina
Asheville 88,828 1,363 1,597 804 893 520 2,918 3,369 278 326 306 358
Charlotte 187,765 1,763 1,931 848 910 526 3,420 3,726 317 347 306 335
Durham 141,273 1,828 2,057 762 833 486 3,197 3,572 229 258 270 303
Greensboro 61,470 1,901 2,089 843 909 522 3,355 3,671 146 160 245 269
Greenville 80,765 1,751 2,089 823 921 540 3,163 3,713 209 249 272 324
Hickory 29,765 1,996 2,291 813 894 519 3,534 4,023 218 250 281 322
Raleigh 128,251 2,066 2,295 910 986 573 3,742 4,132 281 312 329 366
Wilmington 39,504 1,942 2,176 981 1,066 607 3,810 4,236 414 463 284 318
Winston-Salem 119,943 1,677 1,874 776 844 483 3,091 3,431 176 197 262 292
North Dakota
Bismarck 30,726 1,717 2,134 709 803 476 3,014 3,668 179 223 316 393
Fargo Moorhead -Mn 72,408 1,476 1,782 596 666 386 2,556 3,032 129 156 230 277
Grand Forks 24,851 1,456 1,774 591 661 396 2,780 3,328 126 153 366 446
Minot 19,663 1,621 2,090 718 825 510 3,005 3,774 126 162 357 460
Ohio
Akron 88,492 2,202 2,258 998 1,016 608 3,977 4,070 228 234 360 369
Canton 85,218 1,774 1,994 949 1,009 613 3,265 3,611 146 164 252 283
Cincinnati 182,646 2,016 2,099 966 992 604 3,760 3,900 163 170 407 423
Cleveland 287,654 2,275 2,274 1,091 1,097 681 4,176 4,182 220 220 388 388
Columbus 296,162 1,887 2,083 880 925 551 3,451 3,764 183 202 307 339
Dayton 140,131 1,987 2,141 938 978 604 3,586 3,832 168 181 299 322
Elyria 29,207 2,358 2,335 1,155 1,156 753 4,216 4,188 153 151 340 336
Kettering 45,859 1,921 2,003 979 1,004 605 3,624 3,762 210 218 293 306
Toledo 124,817 2,280 2,423 1,044 1,068 671 4,131 4,348 207 220 416 442
Youngstown 115,687 2,417 2,705 1,215 1,295 766 4,388 4,846 223 250 367 411
Oklahoma
Lawton 24,123 1,629 1,940 785 885 506 2,905 3,409 161 191 250 298
Oklahoma City 204,818 1,770 2,037 867 959 530 3,499 3,988 392 451 271 312
Tulsa 146,680 1,711 1,964 904 998 533 3,545 4,029 473 543 315 361
Oregon
Bend 18,970 1,549 1,792 822 894 538 3,254 3,710 405 469 262 304
Eugene 84,848 1,431 1,632 824 885 509 2,849 3,194 188 214 240 274
Medford 61,774 1,284 1,423 744 791 465 2,724 2,983 265 294 302 335
Portland 168,475 1,602 1,686 700 729 442 3,120 3,276 221 233 340 357
Salem 28,785 1,424 1,584 700 745 452 2,868 3,157 316 352 252 280
Pennsylvania
Allentown 153,538 2,291 2,286 1,241 1,255 744 4,372 4,379 275 274 316 316
Altoona 47,695 1,880 2,164 825 901 509 3,727 4,243 379 436 361 416
Danville 78,692 1,904 2,126 906 976 607 3,589 3,972 189 211 415 463
Erie 112,798 1,890 2,141 979 1,060 621 3,651 4,087 220 249 354 401
Harrisburg 124,918 2,103 2,237 988 1,034 616 3,887 4,118 165 176 352 375
Hospit
al Refe
rral R
egion
Medica
re Enro
llees
(1993
)
Reimbu
rsemen
ts for
Inpati
ent
Hospit
al Serv
ices
Price A
djuste
d Reim
burse
-
ments
for In
patie
nt Hos
pital
Service
s
Reimbu
rsemen
ts for
Profes
siona
l and
Lab
Service
s
Price A
djuste
d Reim
burse
-
ments
for Prof
essio
nal a
nd
Lab S
ervice
s
Price A
djuste
d Reim
burse
-
ments
for M
edica
l and
Surgica
l Serv
ices
Reimbu
rsemen
ts for
All Serv
ices
Price A
djuste
d Reim
burse
-
ments
for All S
ervice
s
Reimbu
rsemen
ts for
Hom
e
Health
Care
Service
s
Reimbu
rsemen
ts for
Outpati
ent F
acilit
ies
Price A
djuste
d Reim
burse
-
ments
for H
ome H
ealth
Care S
ervice
s
Price A
djuste
d Reim
burse
-
ments
for O
utpati
ent
Facil
ities

193
Johnstown 44,399 2,339 2,741 898 996 585 4,176 4,841 296 346 448 525
Lancaster 69,132 1,618 1,662 988 1,006 622 3,220 3,298 116 120 353 363
Philadelphia 522,192 2,624 2,379 1,392 1,309 784 4,837 4,434 204 185 368 333
Pittsburgh 523,354 2,669 2,786 1,180 1,239 719 4,873 5,096 356 372 390 407
Reading 85,239 1,782 1,851 1,001 1,035 633 3,511 3,642 187 195 277 287
Sayre 28,008 1,890 2,129 747 805 496 3,201 3,572 178 200 253 285
Scranton 58,229 1,889 2,072 1,138 1,220 724 4,129 4,501 420 461 285 313
Wilkes-Barre 49,540 2,061 2,245 1,199 1,282 764 4,447 4,821 447 487 356 388
York 47,991 1,517 1,629 840 884 553 3,016 3,221 162 174 272 292
Rhode Island
Providence 152,455 2,084 1,930 1,011 946 541 3,997 3,711 374 346 343 318
South Carolina
Charleston 76,139 1,898 2,109 954 1,042 624 3,751 4,150 322 358 363 404
Columbia 108,229 1,553 1,742 818 900 518 2,986 3,331 226 253 233 261
Florence 38,625 1,926 2,226 932 1,038 573 3,554 4,068 256 296 290 335
Greenville 86,153 1,791 1,988 826 908 510 3,321 3,678 192 213 314 349
Spartanburg 41,804 1,646 1,837 795 875 492 3,092 3,439 232 259 289 323
South Dakota
Rapid City 22,138 1,267 1,599 617 706 407 2,456 3,027 206 260 226 286
Sioux Falls 117,471 1,410 1,798 646 738 425 2,492 3,092 71 90 273 348
Tennessee
Chattanooga 73,291 1,942 2,132 921 998 539 4,639 5,081 1,177 1,292 378 415
Jackson 46,308 1,746 2,069 924 1,034 576 3,891 4,548 722 856 354 419
Johnson City 30,336 1,865 2,142 829 920 497 3,689 4,208 547 629 282 324
Kingsport 65,304 1,979 2,274 801 888 470 3,714 4,240 445 511 293 337
Knoxville 148,780 1,855 2,116 895 988 547 4,006 4,542 855 975 297 339
Memphis 184,400 1,878 2,132 968 1,058 600 3,749 4,209 506 574 243 276
Nashville 238,276 1,940 2,205 900 984 525 4,245 4,785 850 966 314 357
Texas
Abilene 44,193 1,705 2,051 883 980 526 3,561 4,200 514 619 282 340
Amarillo 51,880 1,639 1,887 864 941 512 3,429 3,895 461 530 266 307
Austin 76,747 1,466 1,536 965 992 541 3,454 3,600 383 401 269 282
Beaumont 58,697 2,447 2,644 1,272 1,321 701 5,145 5,505 714 771 333 360
Bryan 18,365 1,551 1,855 915 1,000 501 3,230 3,772 284 340 300 359
Corpus Christi 48,764 2,369 2,650 1,213 1,305 734 4,986 5,528 711 795 336 375
Dallas 284,100 1,812 1,863 1,086 1,112 589 3,997 4,105 399 411 356 366
El Paso 75,702 1,703 1,937 936 1,010 544 3,597 4,037 353 401 317 360
Fort Worth 133,237 1,840 1,953 1,007 1,043 540 4,038 4,261 415 441 303 321
Harlingen 37,984 2,410 2,889 1,069 1,181 653 4,373 5,145 435 521 333 399
Houston 354,234 2,331 2,347 1,173 1,170 660 4,603 4,624 348 350 421 423
Longview 22,929 1,961 2,243 1,000 1,089 583 3,773 4,262 348 398 349 399
Lubbock 75,365 2,097 2,496 1,129 1,236 677 4,160 4,844 387 460 370 441
McAllen 30,892 1,961 2,332 1,145 1,266 634 3,912 4,553 357 425 339 403
Odessa 30,942 1,966 2,167 1,085 1,163 640 4,009 4,389 427 471 258 285
San Angelo 20,900 1,800 2,207 954 1,061 588 3,467 4,143 276 339 317 389
San Antonio 173,173 1,700 1,906 1,111 1,190 635 3,992 4,420 525 589 372 417
TABLES
Hospit
al Refe
rral R
egion
Medica
re Enro
llees
(1993
)
Reimbu
rsemen
ts for
Inpati
ent
Hospit
al Serv
ices
Price A
djuste
d Reim
burse
-
ments
for In
patie
nt Hos
pital
Service
s
Reimbu
rsemen
ts for
Profes
siona
l and
Lab
Service
s
Price A
djuste
d Reim
burse
-
ments
for Prof
essio
nal a
nd
Lab S
ervice
s
Price A
djuste
d Reim
burse
-
ments
for M
edica
l and
Surgica
l Serv
ices
Reimbu
rsemen
ts for
All Serv
ices
Price A
djuste
d Reim
burse
-
ments
for All S
ervice
s
Reimbu
rsemen
ts for
Hom
e
Health
Care
Service
s
Reimbu
rsemen
ts for
Outpati
ent F
acilit
ies
Price A
djuste
d Reim
burse
-
ments
for H
ome H
ealth
Care S
ervice
s
Price A
djuste
d Reim
burse
-
ments
for O
utpati
ent
Facil
ities

194 THE DARTMOUTH ATLAS OF HEALTH CARE
Temple 31,297 1,687 1,916 620 667 346 3,014 3,386 228 259 328 372
Tyler 67,818 1,775 2,070 1,045 1,142 593 3,896 4,468 406 474 422 492
Victoria 19,162 1,607 1,813 819 889 488 3,151 3,521 265 299 281 318
Waco 42,325 1,282 1,505 741 811 421 2,673 3,082 194 228 289 339
Wichita Falls 28,594 1,522 1,848 951 1,054 545 3,488 4,135 398 483 276 335
Utah
Ogden 27,512 1,617 1,764 645 693 394 3,141 3,422 422 461 266 291
Provo 25,671 1,862 2,194 745 824 485 3,545 4,127 412 486 313 369
Salt Lake City 132,143 1,482 1,655 691 748 401 3,080 3,419 418 467 287 320
Vermont
Burlington 68,714 1,797 1,935 741 776 503 3,204 3,429 219 235 361 389
Virginia
Arlington 102,581 1,800 1,543 1,086 996 584 3,680 3,218 244 209 352 302
Charlottesville 56,899 1,820 1,973 764 812 484 3,245 3,502 149 162 371 402
Lynchburg 30,881 1,548 1,712 620 673 435 2,562 2,821 95 105 222 245
Newport News 48,331 1,508 1,586 911 959 604 3,109 3,270 217 228 323 340
Norfolk 110,305 1,908 2,050 1,037 1,105 668 3,647 3,909 205 220 344 370
Richmond 151,733 1,802 1,794 930 953 569 3,321 3,335 162 162 318 316
Roanoke 94,465 1,704 1,941 768 841 481 3,189 3,599 245 279 311 354
Winchester 38,774 1,794 1,857 727 749 450 3,135 3,243 158 164 307 318
Washington
Everett 44,602 1,627 1,664 826 840 496 3,328 3,399 244 249 404 413
Olympia 34,427 1,854 1,972 922 959 552 3,635 3,844 284 302 334 356
Seattle 207,503 1,661 1,650 887 886 501 3,387 3,370 231 230 325 323
Spokane 146,534 1,605 1,769 860 916 512 3,155 3,445 186 205 300 330
Tacoma 58,974 1,642 1,691 895 915 528 3,334 3,427 196 201 317 326
Yakima 28,649 1,455 1,601 853 901 496 2,960 3,218 191 210 312 344
West Virginia
Charleston 126,593 1,938 2,251 802 869 500 3,427 3,920 217 252 292 340
Huntington 49,868 2,000 2,286 933 1,009 584 3,611 4,072 165 189 218 249
Morgantown 57,167 2,027 2,444 814 896 516 3,698 4,374 223 269 349 421
Wisconsin
Appleton 38,026 1,352 1,527 621 657 413 2,491 2,770 59 67 283 320
Green Bay 64,992 1,502 1,704 718 759 456 2,807 3,127 117 133 321 365
La Crosse 48,299 1,417 1,664 578 626 373 2,424 2,793 123 144 215 252
Madison 111,446 1,600 1,779 643 671 389 2,871 3,148 172 192 254 282
Marshfield 53,474 1,501 1,764 727 782 451 2,744 3,154 199 233 200 235
Milwaukee 284,357 1,909 1,952 886 892 542 3,477 3,542 134 137 327 335
Neenah 29,575 1,450 1,633 685 724 440 2,718 3,013 104 117 309 348
Wausau 26,424 1,234 1,431 766 819 503 2,618 2,966 159 184 268 311
Wyoming
Casper 21,133 1,977 2,269 781 848 447 3,584 4,069 366 420 322 370
United States
US 29,486,792 1,985 2,018 1,055 1,057 613 3,901 3,962 302 313 333 342
Hospit
al Refe
rral R
egion
Medica
re Enro
llees
(1993
)
Reimbu
rsemen
ts for
Inpati
ent
Hospit
al Serv
ices
Price A
djuste
d Reim
burse
-
ments
for In
patie
nt Hos
pital
Service
s
Reimbu
rsemen
ts for
Profes
siona
l and
Lab
Service
s
Price A
djuste
d Reim
burse
-
ments
for Prof
essio
nal a
nd
Lab S
ervice
s
Price A
djuste
d Reim
burse
-
ments
for M
edica
l and
Surgica
l Serv
ices
Reimbu
rsemen
ts for
All Serv
ices
Price A
djuste
d Reim
burse
-
ments
for All S
ervice
s
Reimbu
rsemen
ts for
Hom
e
Health
Care
Service
s
Reimbu
rsemen
ts for
Outpati
ent F
acilit
ies
Price A
djuste
d Reim
burse
-
ments
for H
ome H
ealth
Care S
ervice
s
Price A
djuste
d Reim
burse
-
ments
for O
utpati
ent
Facil
ities

195TABLES
*The data are age, sex, and race adjusted for Medicare
enrollees who were not members of risk bearing
health maintenance organizations on June 30, 1993.
See Part Nine, Section 4, for details on constructing
rates and adjusting for price.


Strategies and MethodsPART NINE

198 THE DARTMOUTH ATLAS OF HEALTH CARE
1. The Geography of Health Care in The United States
1.1 Files Used in the AtlasThe Atlas depends on the integrated use of a large number of databases provided by
the American Hospital Association (AHA), the American Medical Association, the
American Osteopathic Association, and several federal agencies, including the
Agency for Health Care Policy and Research, the Bureau of the Census, the Health
Care Financing Administration, the National Center for Health Statistics, and the
Department of Veterans Affairs. Table 1 lists these files and provides a short descrip-
tion of the uses made of them in the Atlas.
Description and Use in Analyses
Contains one record for each Medicare beneficiary, and includes demographic infor-
mation (age, sex, race), residence (ZIP Code), program eligibility and mortality. Used
to determine denominators for utilization and expenditure rates and to determine
mortality.
One record for each hospital stay by Medicare beneficiaries. Includes data on dates
of admission / discharge, diagnoses, procedures and Medicare reimbursements to
the hospital. Used for (1) defining health care markets (2) allocation of acute care re-
sources and physicians, (3) numerators for utilization rates.
Contains records of physician and supplier claims submitted under the Part B pro-
gram. Physician records include a beneficiary identifier, dates, procedure codes and
payments. Used to define numerators for certain procedure rates.
Includes a record for each beneficiary in a 5% sample for each year. Includes sum-
mary expenditure data. Used to estimate Medicare spending by program
component.
Includes a record for each hospital eligible to provide inpatient care through Medi-
care. Includes location and resource data. Used in measuring acute care resource
investments.
Includes a record for each hospital and provides detailed accounting data for the
specified year. Used in measuring acute care resource investments.
Source / Provider
HCFA
HCFA
HCFA
HCFA
HCFA
HCFA
Year Used(Sample)
1992 & 1993
(100%)
1992 & 1993
(100%)
1993
(5%)
1993
(5%)
1993
1991 & 1992
File
Medicare FilesDenominator File
MEDPAR File
Part B File
Continuous Medicare History
Sample File
Medicare Provider of Services File
Medicare Cost Reports
Table 1. Data Files Used in Analysis
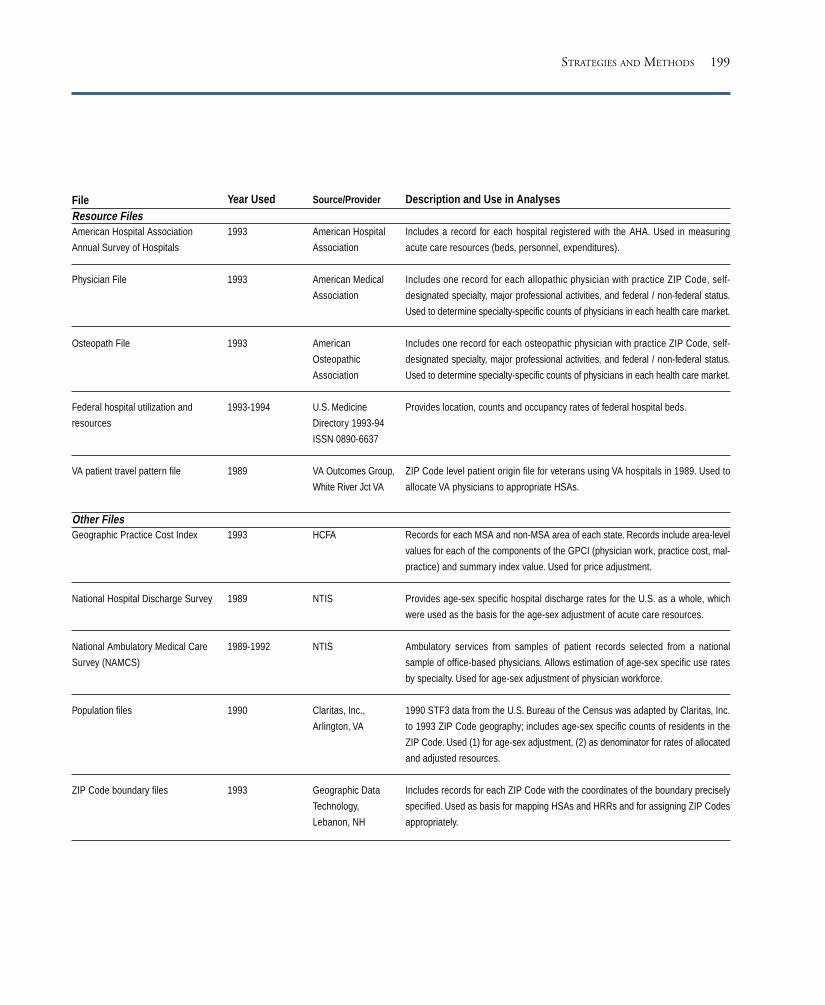
199STRATEGIES AND METHODS
FileResource FilesAmerican Hospital Association
Annual Survey of Hospitals
Physician File
Osteopath File
Federal hospital utilization and
resources
VA patient travel pattern file
Other FilesGeographic Practice Cost Index
National Hospital Discharge Survey
National Ambulatory Medical Care
Survey (NAMCS)
Population files
ZIP Code boundary files
Year Used
1993
1993
1993
1993-1994
1989
1993
1989
1989-1992
1990
1993
Source/Provider
American Hospital
Association
American Medical
Association
American
Osteopathic
Association
U.S. Medicine
Directory 1993-94
ISSN 0890-6637
VA Outcomes Group,
White River Jct VA
HCFA
NTIS
NTIS
Claritas, Inc.,
Arlington, VA
Geographic Data
Technology,
Lebanon, NH
Description and Use in Analyses
Includes a record for each hospital registered with the AHA. Used in measuring
acute care resources (beds, personnel, expenditures).
Includes one record for each allopathic physician with practice ZIP Code, self-
designated specialty, major professional activities, and federal / non-federal status.
Used to determine specialty-specific counts of physicians in each health care market.
Includes one record for each osteopathic physician with practice ZIP Code, self-
designated specialty, major professional activities, and federal / non-federal status.
Used to determine specialty-specific counts of physicians in each health care market.
Provides location, counts and occupancy rates of federal hospital beds.
ZIP Code level patient origin file for veterans using VA hospitals in 1989. Used to
allocate VA physicians to appropriate HSAs.
Records for each MSA and non-MSA area of each state. Records include area-level
values for each of the components of the GPCI (physician work, practice cost, mal-
practice) and summary index value. Used for price adjustment.
Provides age-sex specific hospital discharge rates for the U.S. as a whole, which
were used as the basis for the age-sex adjustment of acute care resources.
Ambulatory services from samples of patient records selected from a national
sample of office-based physicians. Allows estimation of age-sex specific use rates
by specialty. Used for age-sex adjustment of physician workforce.
1990 STF3 data from the U.S. Bureau of the Census was adapted by Claritas, Inc.
to 1993 ZIP Code geography; includes age-sex specific counts of residents in the
ZIP Code. Used (1) for age-sex adjustment, (2) as denominator for rates of allocated
and adjusted resources.
Includes records for each ZIP Code with the coordinates of the boundary precisely
specified. Used as basis for mapping HSAs and HRRs and for assigning ZIP Codes
appropriately.

200 THE DARTMOUTH ATLAS OF HEALTH CARE
1.2 Defining Hospital Service AreasHospital Service Areas (HSAs) represent local health care markets for community-
based inpatient care. HSAs were defined in three steps. First, all acute care hospitals
in the 50 states and the District of Columbia were identified from the American
Hospital Association Annual Survey of Hospitals and the Medicare Provider of Ser-
vices files and assigned to a location within a town or city. The list of towns or cities
with at least one acute care hospital (N=3,953) defined the maximum number of
possible HSAs. Second, all 1992 and 1993 acute care hospitalizations of the Medi-
care population were analyzed according to ZIP Code to determine the proportion
of residents’ hospital stays that occurred in each of the 3,953 candidate HSAs. ZIP
Codes were initially assigned to the HSA where the greatest proportion (plurality)
of residents were hospitalized. Approximately 500 of the candidate HSAs did not
qualify as independent HSAs because the plurality of patients resident in those
HSAs were hospitalized in other HSAs.
The third step required visual examination of the ZIP Codes used to define each
HSA. Maps of ZIP Code boundaries were made using files obtained from Geo-
graphic Data Technologies (GDT) and each HSA’s component ZIP Codes were
examined. In order to achieve contiguity of the component ZIP Codes for each
HSA, “island” ZIP Codes were reassigned to the enclosing HSA, and/or HSAs were
grouped into larger HSAs . (See Part One for an illustration.) Certain ZIP Codes
used in the Medicare files were restricted in their use to specific institutions (e.g., a
nursing home) or a post office. These “point ZIPs” were assigned to their enclosing
ZIP Code based on the ZIP Code boundary map.
This process resulted in the identification of 3,436 HSAs, ranging in total popula-
tion from 866 (Hoven, South Dakota) to 2,680,712 (Chicago, Illinois). In most
HSAs, the majority of Medicare hospitalizations occurred in a hospital or hospitals
located within the HSA. See Part One for further details.
201
1.3 Defining Hospital Referral RegionsHospital referral regions (HRRs) represent health care markets for tertiary medical
care. As defined here, each HRR contained at least one HSA that had a hospital or
hospitals that performed major cardiovascular procedures and neurosurgery in
1992-93. Three steps were taken to define HRRs.
First, the candidate hospitals and HRRs were identified. A total of 862 hospitals
performed at least 10 major cardiovascular procedures (DRGs 103-107) on Medi-
care enrollees in both years. These hospitals were located within 458 HSAs, thereby
defining the maximum number of possible HRRs. Further checks verified that all
458 HSAs included at least one hospital performing the specified major neurosur-
gical procedures (DRGs 1-3 and 484).
Second, we calculated in each of the 3,436 HSAs in the United States the propor-
tion of major cardiovascular procedures performed in each of the 458 candidate
HRRs in 1992-93. Each HSA was then assigned provisionally to the candidate
HRR where most patients went for these services.
Third, HSAs were reassigned or further grouped to achieve (a) geographic contigu-
ity, unless major travel routes (e.g., interstate highways) justified separation (this
occurred in only two cases, the New Haven, Connecticut, and Elmira, New York,
HRRs); (b) a minimum population size of 120,000; and (c) a high localization in-
dex – at least 65% of all the hospitalizations of HRR patients were to hospitals
located within the HRR. Because of the large number of hospitals providing cardio-
vascular services in California, several candidate California HRRs met the above
criteria but were found to perform small numbers of cardiovascular procedures.
These HRRs were further aggregated according to county boundaries to achieve
stability of cardiovascular surgery rates within the areas.
The process resulted in the definition of 306 hospital referral regions which ranged
in size from 121,666 (Bend, Oregon) to 8,891,233 (Los Angeles). See Part One for
further details.
STRATEGIES AND METHODS

202 THE DARTMOUTH ATLAS OF HEALTH CARE
1.4 Populations of HSAs and HRRsTotal population counts were estimated for residents of all ages in each HSA using
ZIP Code level files obtained from Claritas, Inc. The Claritas file is based on the
1990 U.S. Census STF3B ZIP Code file, updated to account for changes in ZIP
Code definitions. Population counts for HRRs are the sum of the counts of the
constituent HSAs. These serve as the denominator for estimating rates for hospital
and physician workforce allocations (Part Two and Part Five). For rates that apply
to the Medicare population for the years 1992-93 (Parts Three and Six), enrollee
counts were obtained from the Medicare Denominator file. The 1992 and 1993
Medicare enrollee population included those alive and age 65 to age 99 on June 30,
1992 and 1993, respectively. For Medicare reimbursement rates (Part Four), and for
diagnostic procedure rates based on Part B claims (Part Six), the enrollee counts are
based on a 5% sample of Medicare enrollees for 1993 (selected on the basis of Social
Security numbers that end in 05, 20, 45, 70 or 95). For most of the rates presented
in this analysis, the numerator and the denominator counts exclude those who were
enrolled in risk bearing HMOs on June 30.
Acute care resources consist of hospital beds, personnel and expenditures. Three
tasks were required to estimate the rates presented in Part Two. First, the resources
for each hospital had to be determined; second, resources had to be allocated to
populations, proportionate to their rates of use; third, rates had to be constructed
and adjusted to take into account differences in age, sex and, in the case of expen-
ditures, the price of care, between regions.
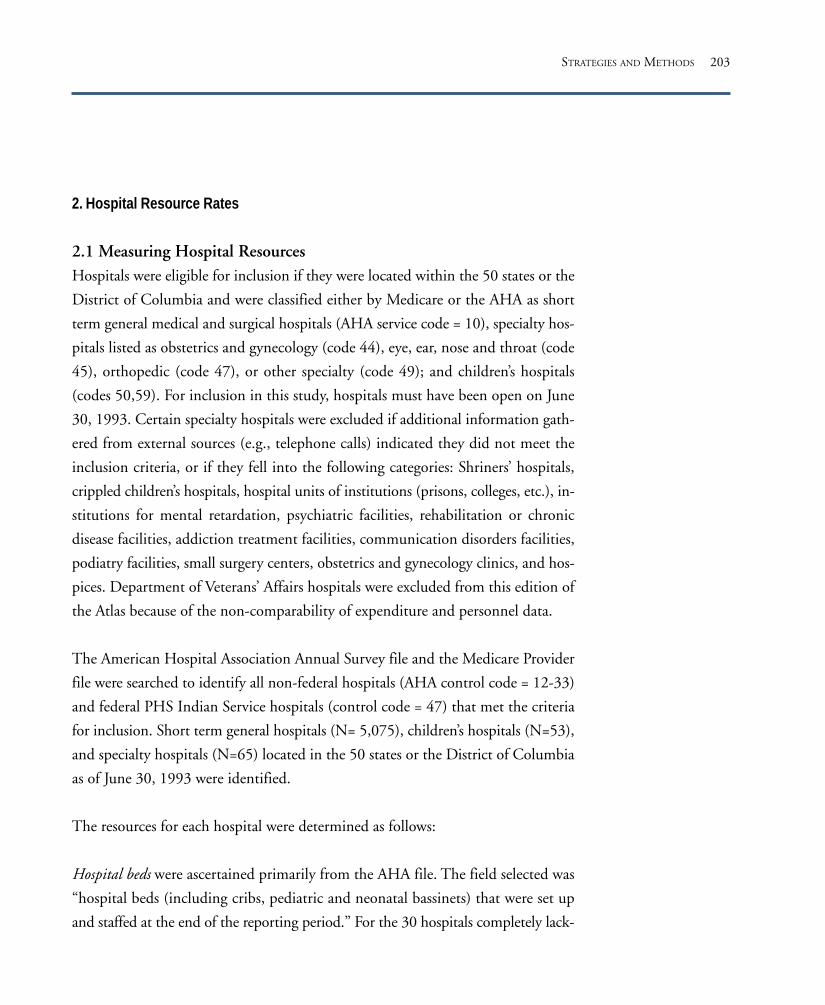
203
2. Hospital Resource Rates
2.1 Measuring Hospital ResourcesHospitals were eligible for inclusion if they were located within the 50 states or the
District of Columbia and were classified either by Medicare or the AHA as short
term general medical and surgical hospitals (AHA service code = 10), specialty hos-
pitals listed as obstetrics and gynecology (code 44), eye, ear, nose and throat (code
45), orthopedic (code 47), or other specialty (code 49); and children’s hospitals
(codes 50,59). For inclusion in this study, hospitals must have been open on June
30, 1993. Certain specialty hospitals were excluded if additional information gath-
ered from external sources (e.g., telephone calls) indicated they did not meet the
inclusion criteria, or if they fell into the following categories: Shriners’ hospitals,
crippled children’s hospitals, hospital units of institutions (prisons, colleges, etc.), in-
stitutions for mental retardation, psychiatric facilities, rehabilitation or chronic
disease facilities, addiction treatment facilities, communication disorders facilities,
podiatry facilities, small surgery centers, obstetrics and gynecology clinics, and hos-
pices. Department of Veterans’ Affairs hospitals were excluded from this edition of
the Atlas because of the non-comparability of expenditure and personnel data.
The American Hospital Association Annual Survey file and the Medicare Provider
file were searched to identify all non-federal hospitals (AHA control code = 12-33)
and federal PHS Indian Service hospitals (control code = 47) that met the criteria
for inclusion. Short term general hospitals (N= 5,075), children’s hospitals (N=53),
and specialty hospitals (N=65) located in the 50 states or the District of Columbia
as of June 30, 1993 were identified.
The resources for each hospital were determined as follows:
Hospital beds were ascertained primarily from the AHA file. The field selected was
“hospital beds (including cribs, pediatric and neonatal bassinets) that were set up
and staffed at the end of the reporting period.” For the 30 hospitals completely lack-
STRATEGIES AND METHODS

204 THE DARTMOUTH ATLAS OF HEALTH CARE
ing AHA data, and for the 378 hospitals that were non-reporting in 1993, we used
data from the Medicare Cost Reports for “total beds available in the hospital.” The
remaining 15 non-reporting hospitals (all PHS Indian Service hospitals) also lacked
cost report data, so AHA data were used to measure all resources, even though the
data came from a prior year’s Annual Survey.
Full time equivalent hospital personnel were defined as the sum of full time employees
and 1/2 of the part time employees. Hospital employees do not include medical or
dental interns or residents or trainees. For the 30 hospitals lacking AHA data com-
pletely and for 378 of the 392 hospitals that were non-reporting in 1993, the
Medicare Cost Report value for “average number of employees, hospital total” was
used to estimate hospital personnel at these hospitals.
Full time equivalent registered nurses were defined as the sum of full time nurses and
1/2 of the part time nurses. For the 30 hospitals lacking AHA data completely and
for 378 of the 392 hospitals that were non-reporting for 1993, the Medicare Pro-
vider of Services file count of “licensed registered nurses” was used to estimate the
number of registered nurses at these hospitals.
Hospital expenditures were defined using the 1993 AHA Annual Survey estimate of
total hospital expenses, which includes both payroll and non-payroll components,
plus non-operating losses (where payroll expenses include all salaries and wages ex-
cept those paid to medical and dental interns and residents and other trainees, e.g.,
medical technology trainees, X-ray therapy trainees, administrative residents, etc.).
For the 30 hospitals lacking AHA data, and for 378 of the 392 non-reporting hos-
pitals, total facility costs were estimated from Medicare Cost Report data (and were
annualized where necessary).
2.2 Allocation of Hospital ResourcesIn order to account for the use of care by patients who live in one HSA but obtain
care in another, hospital resources for acute care short-term hospitals have been al-

205
located to the HSAs in proportion to the actual patterns of use. This was accom-
plished using the proportion of all Medicare patient days (1992-93) provided by
each specific hospital to each HSA. For example, if 60% of total Medicare inpatient
days at a hospital were used by residents of the HSA where the hospital was located,
then 60% of that hospital’s resources would be assigned to its HSA. If 20% of the
Medicare patient days provided by that hospital were used by a neighboring HSA,
20% of the hospital’s resources would be assigned to that neighboring HSA.
Children’s hospitals and specialty hospitals were found to have too little actual uti-
lization data in the Medicare files to allow their allocation based on hospital-specific
proportionate utilization. These hospitals were allocated according to the utilization
patterns of all Medicare enrollees residing in the HSA. In other words, if 80% of the
patient days in an HSA were provided by hospitals within the HSA, then 80% of
the resources of any specialty or children’s hospital located within that HSA would
be assigned to it.
The use of Medicare data to estimate resources allocated to populations of all ages
is justified by studies which show that the geographic patterns of use of hospital care
by patients under and over sixty-five years of age are similar. Our own analyses of
data from both New York and New England revealed that travel patterns for those
under age 65 are nearly identical to those over age 65. Radany and Luft (1993)
found similar results in California.
Once each of the hospital resources had been allocated to HSAs, the allocated re-
sources were summed. For example, the allocated beds of each HSA were equal to
the sum of allocated acute short-term beds and allocated specialty/children’s beds.
For the HSAs located in a given HRR, resources were further summed to obtain the
total for the HRR. Crude rates were then calculated for HRRs using the 1990
population for all ages described in section 1.4.
STRATEGIES AND METHODS

206 THE DARTMOUTH ATLAS OF HEALTH CARE
2.3 Calculation of Adjusted Per Capita ResourcesThe resource allocation rates presented in Part Two of the Atlas were adjusted for
differences in age and sex using the indirect method. Since the national age-sex
specific bed supply rates are not available, these were estimated using the national
age and sex specific patient day rates obtained from the 1989 National Hospital
Discharge Survey. These estimates were used to calculate the expected bed supply in
each HRR. Under the assumption that expenditures and employee allocations
across age and sex groups are also proportionate to patient days, a similar strategy
was used to adjust expenditures and employees.
Hospital expenditure rates were further adjusted to account for regional differences
in prices. Seeking to avoid a price adjustment that depended on physician or hos-
pital market conditions, we focused on cost of living indices using non-medical
regional price measures. We used the Geographic Practice Cost Index (GPCI) ap-
plicable to fiscal year 1995 Medicare physician claims. The index is the weighted
sum of three components: the relative cost of non-physician professional labor
across areas, the relative cost of physician practice inputs (principally rents and
wages to office employees) and the relative cost of malpractice. The weights are
based on the national proportions of these costs in physician services. We re-
weighted the index, excluding the malpractice costs. We also used the full
professional labor component in our revised index (HCFA used only one-quarter of
the professional labor component). While not perfectly exogenous to health care (as
it includes physician office expenses), the GPCI is both available at the level of geo-
graphic analysis needed in this study, and is preferable to the major alternative,
Medicare’s hospital wage index. (The hospital wage index is based on actual wages
paid to hospital employees in each area and is thus distorted by differences in occu-
pational mix and market conditions. Hospitals that hire more highly paid staff have
those costs reflected in the wage index.) The GPCI is discussed in greater detail by
the originators of the measure, Zuckerman, Welch and Pope (1990).
The modified GPCI (exclusive of malpractice costs) was available for each metro-
politan statistical area (MSA) and for non-MSA areas of each state. The values for

207
the area-specific modified GPCI were assigned to each HSA according to the loca-
tion of the principal city or town of each HSA.
To calculate HRR-level modified GPCIs, we calculated weighted sums of the HSA-
specific index, using the general population size of the HSA as the weight. The
index was then applied to adjust the allocated hospital expenditures. Area-specific
allocated expenditures were divided by the index for that area. New York’s modified
GPCI was 1.275, indicating that costs in that area are 27.5% higher than the na-
tional average. Allocated hospital expenditures per capita for New York were $1,871.
Dividing by New York’s modified GPCI gives an adjusted per capita expenditure of
$1,467, which is the figure presented in the maps and tables.
Adjusting for differences in the price level shifts the relative rankings of hospital
referral regions, in some cases by a large amount. Consider, for example, inpatient
acute care hospital expenditures. Table Two displays the per capita acute care hos-
pital expenditures for three hospital referral regions: Anchorage, Alaska, Lincoln,
Nebraska, and the Bronx, New York. Both unadjusted data and data after price
adjustment are included. In the case of Anchorage, the unadjusted measure of acute
care costs led to a ranking of 13th in the country, with average expenditures of
$798. After adjustment for the much higher cost of living in Anchorage, its rank
drops to 95th, with spending of $662. By contrast, adjusting for the lower average
prices in the Lincoln hospital referral region raises its relative ranking from 284th
to 233rd. Sometimes price adjustment makes little difference in the relative rank-
ing. Even after average acute care inpatient expenses in the Bronx hospital referral
region are adjusted downward from $1,266 to $993, it still ranks first in total ex-
penditures per resident.
Location Unadjusted Unadjusted Adjusted AdjustedExpenditures Rank Expenditures Rank
Anchorage, Alaska $798 13 $662 95
Lincoln, Nebraska $432 284 $540 233
The Bronx, New York $1,266 1 $993 1
Table 2. Acute Care Hospital Expenditures per Person, Adjusted for Price Differences
STRATEGIES AND METHODS

208 THE DARTMOUTH ATLAS OF HEALTH CARE
2.4 The Distribution GraphThe distribution graphs used in the Atlas provide a simple way to show the disper-
sion in particular rates of health care resources and utilization across the 306
hospital referral regions. For example, the graph below shows the distribution of
hospital beds per thousand residents for each of the 306 hospital referral regions.
The vertical axis shows the rate of hospital beds per thousand residents. The highest
point in the graph represents the hospital referral region with the largest number of
hospital beds per capita, Monroe, Louisiana, which has 5.3 beds per thousand resi-
dents. Bismarck, North Dakota, and New Orleans, Louisiana, which both have 5.2
beds per thousand, are represented by the next two points on the graph. Some ar-
eas which do not have precisely the same number of hospital beds per thousand
residents are arrayed on a single line because their rates fall into a “bin” between two
values.
Hosp
ital B
eds
per 1
,000
Res
iden
ts in
HRR
s
5.5
5.0
4.5
4.0
3.5
3.0
2.5
2.0
1.5
1.0
This chart summarizes two features of the data.
The first is a measure of dispersion; if the number
of beds per thousand (or whatever measure is on
the vertical axis) for the highest hospital referral
region is two or three times the number of beds
per thousand for the lowest hospital referral region,
it suggests substantial variation in health care re-
sources. Second, the distribution graph shows whe-
ther the variation is caused by just a few outliers –
hospital referral regions that for various reasons are
much different from the rest of the country – or
whether the variation is pervasive and widespread
across the country. In the example above, the
dispersion is not caused by just a few areas such
as Monroe and Bismarck; there is widespread
dispersion.

209
3. Hospital Utilization Rates
Rates represent counts of the number of events that occurred in a defined time pe-
riod (the numerator) for a specific population (the denominator). The rates in Part
Three are for 1992 and 1993. The counts of events are based on the MEDPAR files
for 1992-93. The denominator is the 1992-93 Medicare enrollee population (Sec-
tion 1.4). In order to assure that the events counted in the numerator correspond
to the denominator population, certain records were excluded, including Medicare
enrollees who were under age 65 or over age 99 on June 30, 1992 or 1993; Medi-
care enrollees who were enrolled in risk-bearing HMOs; MEDPAR records with a
length of stay over 365 days; hospitalizations in psychiatric, rehabilitation or long
term care units (provider codes = S, T, U or V; facility type not equal to S; third
digit of Medicare provider number not equal to 0).
3.1 Conditions examined in Part Three of the AtlasThe specific conditions or “numerator events” presented in Part Three, the data files
used to generate the counts, and the codes used to identify the event in the file are
given in Table 3.
Table 3. Definitions for Categories of Events in Part Three of the Atlas
Codes used to define condition
All records for eligible enrollees
Discharge status = B
Principal diagnosis = ICD 820.0 - 820.99
See Note 1
See Note 2
In-hospital deaths / all deaths in HRR
Eligible enrollees with date of death 1/1/92 - 12/31/93
Source File
MEDPAR
MEDPAR
MEDPAR
MEDPAR
MEDPAR
MEDPAR
Denominator
Condition
All discharges
In-hospital deaths
Hip fracture
Surgical admissions
High variation medical conditions
Percent dying in hospital
Deaths
NOTES:
1. Surgical DRGs are the following: 1-8, 36-42, 49-63, 75-77, 103-108, 110-120, 146-171, 191-201, 209-234, 257-270, 285-293, 302-315, 334-345, 353-365, 370, 371,
377, 392-394, 400-402, 406-408, 415, 424, 439-443, 458, 459, 461, 468, 471-472, 476-486, 488, 491, 493, 494
2. HVMC are those with the following DRGs: 9-13, 15-35, 43-48, 64-74, 78-102, 124-145, 172-173, 176-190, 202-208, 235-256, 271-284, 294-301, 316-333, 346-352,
366-369, 372, 373, 376, 378-391, 395-399, 403-405, 409-414, 416-423, 425-437, 444-457, 460, 462-467, 473, 475, 487, 489, 490, 492
STRATEGIES AND METHODS
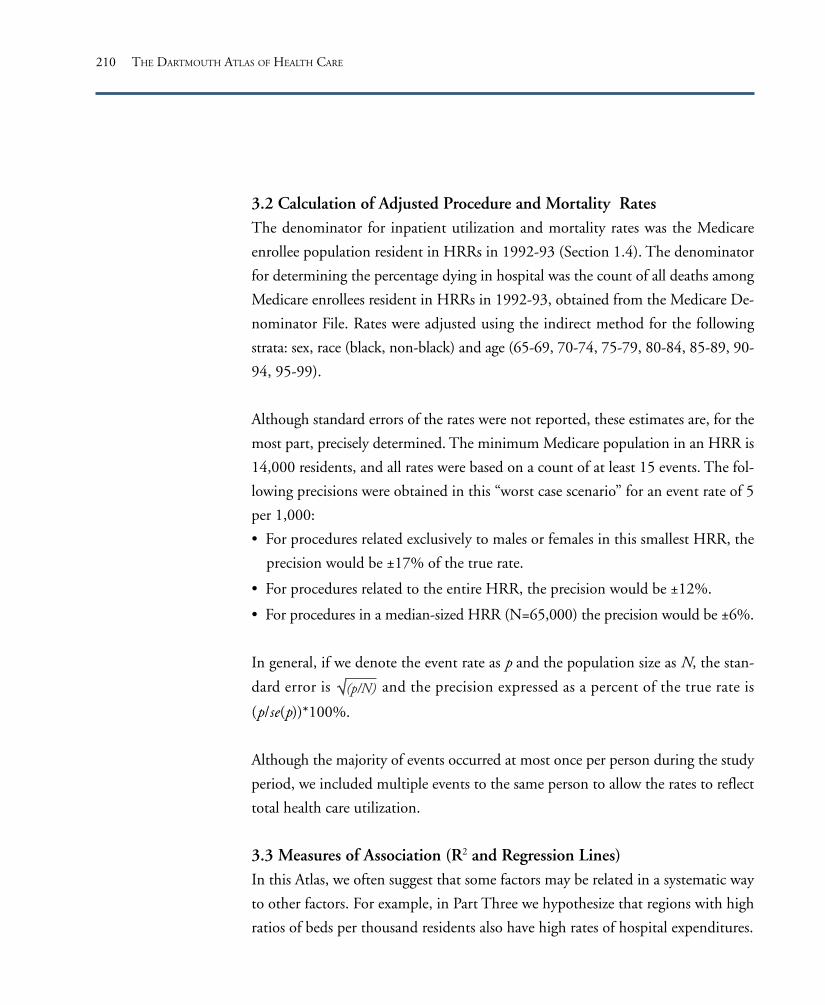
210 THE DARTMOUTH ATLAS OF HEALTH CARE
3.2 Calculation of Adjusted Procedure and Mortality RatesThe denominator for inpatient utilization and mortality rates was the Medicare
enrollee population resident in HRRs in 1992-93 (Section 1.4). The denominator
for determining the percentage dying in hospital was the count of all deaths among
Medicare enrollees resident in HRRs in 1992-93, obtained from the Medicare De-
nominator File. Rates were adjusted using the indirect method for the following
strata: sex, race (black, non-black) and age (65-69, 70-74, 75-79, 80-84, 85-89, 90-
94, 95-99).
Although standard errors of the rates were not reported, these estimates are, for the
most part, precisely determined. The minimum Medicare population in an HRR is
14,000 residents, and all rates were based on a count of at least 15 events. The fol-
lowing precisions were obtained in this “worst case scenario” for an event rate of 5
per 1,000:
• For procedures related exclusively to males or females in this smallest HRR, the
precision would be ±17% of the true rate.
• For procedures related to the entire HRR, the precision would be ±12%.
• For procedures in a median-sized HRR (N=65,000) the precision would be ±6%.
In general, if we denote the event rate as p and the population size as N, the stan-
dard error is and the precision expressed as a percent of the true rate is
(p/se(p))*100%.
Although the majority of events occurred at most once per person during the study
period, we included multiple events to the same person to allow the rates to reflect
total health care utilization.
3.3 Measures of Association (R2 and Regression Lines)In this Atlas, we often suggest that some factors may be related in a systematic way
to other factors. For example, in Part Three we hypothesize that regions with high
ratios of beds per thousand residents also have high rates of hospital expenditures.

211
To capture the degree and extent of the correlation between hospital beds and ex-
penditures in Figure 3.1, we put hospital beds per thousand residents on the
horizontal axis and hospital expenditures per capita on the vertical axis, and placed
a point on the graph for each of the 306 hospital referral regions. If hospital beds
and expenditures were negatively correlated, so that regions with higher beds per
thousand residents had lower per capita expenditures, then we might expect to see
the cloud of points tilted downward, running from northwest to southeast. Con-
versely, if they were positively correlated – as they in fact are – the cloud of points
would run from southwest to northeast on the graph, as seen in Figure 3.1.
It is sometimes difficult to discern from this cloud of points the relationship be-
tween two variables. A linear regression line provides the best fit of the data and
summarizes the relationships between them. A measure of the “goodness of fit” or
1.5 2.0 2.5 3.0 3.5 4.0 4.5 5.0 5.5
Hospital Beds per 1,000 Residents in HRRs
Price
Adju
sted
Hos
pita
l Exp
endi
ture
spe
r cap
itain
HRR
s (d
olla
rs)
1,800
1,600
1,400
1,200
1,000
800
600
400
the extent to which hospital beds per 1,000 predicts
expenditures per capita is the R2, which is defined as
the fraction of total variation in the vertical axis (ex-
penditures) that is explained by variation in the
horizontal axis (beds). It can range between 0 and 1,
where 1 is perfect correlation and 0 means that the
two variables are completely unrelated. In Figure 3.1,
the R2 is .57, which means that the two are closely
related – that 57% of the variation in price, age, and
sex adjusted expenditures per capita is related to the
age and sex adjusted bed supply.
The regression lines and R2 statistics given in the text
are not weighted for the size of the population.
Weighted and unweighted R2 statistics were similar.
STRATEGIES AND METHODS

212 THE DARTMOUTH ATLAS OF HEALTH CARE
4. Medicare Program Reimbursement Rates
The numerators for Medicare reimbursement rates in Part Four of the Atlas are
from the 1993 Continuous Medicare History Sample (CHMS), which documents
reimbursements by calendar year for each component of the Medicare program. The
data are for a 5% sample of Medicare enrollees selected on the basis of the terminal
digits in the Social Security number (05, 20, 45, 70 or 95). The denominator for rates
is the corresponding 5% sample of the enrollment file (see Part Nine, Section 3.1).
4.1 Categories of Medicare Reimbursement Examined in Part Four of theAtlasCategories of Medicare reimbursement in the Atlas are listed in Table 4 with their
definitions from the CHMS file.
4.2 Calculation of Adjusted Medicare Program RatesAdjustments were made for age, sex, and race as described in Section 3.2. Adjust-
ments for differences in price were made using the method described in Section 2.3,
with two differences. First, in order to calculate the HRR-level modified GPCI, we
used the number of Medicare enrollees in each HRR as the weight, rather than the
general population. Second, because Medicare Part B payments compensate for only
one-quarter of the difference in professional wage adjustments across areas and in-
clude an adjustment for malpractice insurance costs, the same adjustment was made
in reverse to recover the original value of Part B billings.

213
Category of Reimbursement
All Services
Professional and Laboratory Services
Acute Care Hospital Services
Outpatient Hospital Services
Home Health Care Services
For each service, the specified components were selected from the file and summed as indicated. All fields refer to
packed-decimal, variable length, EBCDIC, mainframe record layout locations.
File: Annual Data trailer
Part A Reimb, incl. passthru amts. cols. 14-17
Part B Reimb, incl. passthru amts. cols. 18-21Total Reimb. = Part A + Part B Reimb.
File: Payment trailer
1. Medical line items, cols. 12-13 (TOS=1, 3, Y, Z)
2. Medical Reimb., cols. 17-19
3. Surgical line items, cols. 20-21 (TOS=2, 8)
4. Surgical Reimb., cols. 25-27
5. Lab/X-ray line items, cols. 28-29 (TOS=4, 5)
6. Lab/X-ray Reimb., cols. 33-35
Total Reimb = 2+4+6
File: Short Stay trailer
Stays, cols. 4-5
LOS, cols. 8-9
Reimbursement, cols.18-21
Passthru amount, cols. 62-65
Outpatient trailer
Total bills, cols. 4-5
Total Reimb., cols. 9-11
Outpatient POS bills, cols. 12-13
Outpatient POS Reimb., cols. 17-19
Inpatient POS bills, cols. 20-21
Inpatient POS bills, cols. 25-27
HHA trailer
Part A Reimb., cols. 12-14
Part B Reimb., cols. 23-25
Total Reimb. = Part A + Part B
Table 4. Definitions for Categories of Reimbursement in Part Four of the Atlas
STRATEGIES AND METHODS

214 THE DARTMOUTH ATLAS OF HEALTH CARE
5. The Physician Workforce Rates
The methods for estimating the per capita rates of physicians serving HSAs and
HRRs are analogous to the methods used for estimating the allocation of hospital
resources (Section 2). The sources of information on physicians are the American
Medical Association (AMA; January 1, 1993) and the American Osteopathic Asso-
ciation (AOA; May 31, 1993) Physician Masterfiles. These files have been used
extensively to study physician supply and are the only comprehensive data available
on physician location, specialty and level of effort devoted to clinical practice. Both
the AMA and the AOA physician files classify physicians according to self-reported
level of effort devoted to clinical practice. In this study, we excluded physicians who
reported that they worked the majority of the time in medical teaching, adminis-
tration or research, and part time physicians working fewer than 20 hours a week
in clinical practice. Interns, residents and fellows training in specific specialties were
not included in the rates for specialists presented in Part Five. Both files also list ZIP
Code fields indicating the physician’s primary place of practice, which was complete
in more than 90% of records. When this information was not available, we used the
physician’s preferred professional address to indicate location. Based on these crite-
ria, 469,603 physicians resident in the 50 states and District of Columbia
constituted the clinically active physician workforce for 1993. There were also
96,887 physicians in residency or fellowship programs.
5.1 Physician Specialties Considered in Part Five of the AtlasThe AMA and AOA physician files include the physician’s primary self-designated
specialty from a list of 207 specialties. We grouped these into the categories in Table 5.

215
Age Adjustment
Family Practice
Internal Medicine
Pediatrics
Surgery
Cardiology
General Surgery
Ob/Gyn
Ophthalmology
Dartmouth Specialty
All Physicians
Primary Physicians
Specialty Physicians
Anesthesiology
Cardiology
General Surgery
Obstetrics/ Gynecology
Ophthalmology
AMA or AOA Specialty
All except Unspecified (Codes US, T)
Adolescent Medicine-GP
Family Practice
Geriatrics Medicine (Family Practice)
General Practice
Sports Medicine-GP
Internal Medicine-Emergency Medicine
Internal Medicine
Internal Medicine-Pediatrics
Pediatrics
All except Primary Physicians and
Unspecified (Codes US, T)
Anesthesiology
Cardiothoracic Anesthesiology
Obstetrics Anesthesiology
Pediatric Anesthesiology
Cardiology
Cardiovascular Diseases
Cardiac Electrophysiology
Abdominal Surgery
Colon and Rectal Surgery
General Surgery
Surgery-General
Gynecological Oncology
Gynecological Surgery
Gynecology
Maternal & Fetal Medicine
Obstetrics & Gynecology
Obstetrics
Obstetrics/Gynecology Surgery
Reproductive Endocrinology
Reproductive Endocrinology
Ophthalmology
AMA/AOACode
AGP
FP
FPG
FSM
GP
SGP
IEM
IM
IPD
PD
AN
CAN
OBA
PAN
C
CD
CVD
ICE
AS
CRS
GS
S
GO
GS
GYN
MFM
OBG
OBS
OGS
RE
REN
OPH
Allocation
Medical
Medical
Medical
Surgical
Medical
Surgical
Surgical
Surgical
Table 5. Categories of Clinically Active Physicians in Part Five of the Atlas
Classification of physician specialties and type of utilization used for allocation and age adjustment
STRATEGIES AND METHODS

216 THE DARTMOUTH ATLAS OF HEALTH CARE
Dartmouth Specialty
Orthopedic Surgery
Psychiatry
Radiology
Urology
AMA or AOA Specialty
Hand Surgery (Ortho Surgery)
Adult Reconstructive Orthopedics
Pediatric Orthopedics
Orthopedics
Orthopedic Surgery
Sports Medicine (Orthopedic Surgery)
Orthopedic Surgery - Spine
Orthopedic Trauma
Child Psychiatry
Psychiatry
Pediatric Psychiatry
Psychoanalysis
Geriatric Psychiatry
Psychosomatic Medicine
Angiography/Interventional Radiology
Diagnostic Radiology
Diagnostic Ultrasound
Nuclear Medicine
Nuclear Radiology
Neuroradiology
Pediatric Radiology
Radiology
Diagnostic Roentgenology
Urological Surgery
Urology
AMA/AOACode
HSO
OAR
OP
OR
ORS
OSM
OSS
OTR
CHP
P
PDP
PYA
PYG
PYM
ANG
DR
DUS
NM
NR
NRA
PDR
R
RTD
U
URS
Allocation
Surgical
Medical
All
Surgical
Age Adjustment
Orthopedic Surg
Psychiatry
not age adjusted
Urology

217
5.2 Allocation of Clinically Active PhysiciansClinically active physicians were assigned to the HSAs of their primary place of
practice or preferred professional address. Since physicians, like hospitals, provide
services to patients residing outside of the HSA in which their practices are located,
the physician workforce was allocated to adjust for patient migration. Unfortu-
nately, allocations could not be based on information about the travel patterns of
the patients of individual physicians or information about the use of care outside
acute hospitals. For clinically active non-federal physicians (N=456,030), the adjust-
ments are closely analogous to the method used for hospital resources, with an
important exception. Since the hospital affiliations of the physicians was not deter-
mined, the physicians were allocated on the basis of the patterns of inpatient care
of all the hospitals located in their HSAs. The MEDPAR records selected for allo-
cation, which depended on the physician’s specialty, are given in Table 5. For
example, primary physicians were allocated on the basis of medical DRGs. If an
HSA had 4 primary care physicians and if 25% of the medical DRG patient days
at the local hospital(s) in 1992-93 were for residents of a neighboring HSA, then
the four primary physicians would be estimated to contribute 1.0 FTE primary care
physician to the neighboring HSA.
We included clinically active federal physicians (N=13,573) in the study, since these
physicians serve populations counted by the U.S. census, such as veterans, residents
of Indian reservations, medically underserved areas, and military personnel and their
dependents. Federal physicians were assigned to either the Department of Defense/
Public Health Service (DoD/PHS) or the Department of Veterans Affairs (VA) in
proportion to the mix of staffed federal beds within each HSA (U.S. Medicine;
DoD technical document). All federal pediatricians and obstetrician/gynecologists
were assigned to the DoD/ PHS. DoD/PHS physicians were allocated to HSAs in
the same proportion as the non-federal physicians. Since VA utilization data were
available that were analogous to the Medicare Part A data, VA physicians were al-
located to areas in proportion to VA inpatient utilization (e.g., if 25% of the patient
days of VA hospitals in Manhattan were provided to veterans residing in the Bronx,
STRATEGIES AND METHODS

218 THE DARTMOUTH ATLAS OF HEALTH CARE
then 25% of the VA physicians in New York were assigned to the Bronx). If no fed-
eral inpatient facility (DoD, VAH, PHS, Indian Health Service) was present within
the HSA, then the physicians were assumed to represent primary care and were al-
located in the same proportion as non-federal primary care physicians (using
inpatient medical days).
When all physician specialty groups had been allocated to HSAs, their allocated
FTEs were summed. The primary care physicians allocated to an HSA represent the
total of all federal and non-federal FTE physicians allocated from local as well as
remote HSAs. For the HSAs in a given HRR, physician resources were further
summed to obtain the total for the HRR. Crude rates were then calculated for
HRRs using the 1990 population for all ages described in section 1.4.
Measures of physicians in residency training programs presented in the Atlas were
prepared using similar methods.
5.3 Calculation of Adjusted RatesThe allocation rates presented in Part Five of the Atlas were adjusted for age and sex
using the indirect method. Since age-sex specific physician utilization rates by spe-
cialty are not available for all medical care services, we used outpatient age, sex and
specialty specific physician visit rates from the combined 1989-1992 National
Ambulatory Care Survey (NAMCS) as the standard. NAMCS specialty categories
matched the AMA and AOA categories. Three specialties could not be age and sex
adjusted because of the low frequency of ambulatory visits: critical care, pathology,
and radiology.

219
6. Diagnostic and Surgical Procedure Rates
The rates of inpatient surgery in Part Six are based on the MEDPAR files for 1992
and 1993. To insure that the population included in the numerator corresponded
to the denominator population, restrictions were applied to exclude the following
records: Medicare enrollees under age 65 or over age 99 on June 30, 1992 or 1993;
Medicare enrollees in risk-bearing HMOs; MEDPAR records with a length of stay
over 365 days; and hospitalizations at psychiatric, rehabilitation or long term care
units (provider codes = S, T, U or V; facility type not equal to S; third digit of Medi-
care provider number not equal to 0). The rates of diagnostic procedures are based
on a 5% sample of the 1993 Physician (Part B) Claims file. The denominators are
the 1992-93 Medicare enrollee population and the 5% 1993 Medicare enrollee
population described in Section 1.4, respectively.
6.1 Procedures examined in Part Six of the AtlasThe procedure codes used in Part Six are listed in Table 6. The procedure codes used
in the MEDPAR file are based on the International Classification of Disease, ICD-
9-CM. For diagnostic procedures, the Current Procedure Terminology convention
was used. Selection of procedure codes was based on review of the literature and/or
consultation with clinical experts. No rate was based on a count of fewer than 15
events.
6.2 Calculation of Adjusted Procedure-Specific RatesIndirect-adjusted rates were computed as described in Section 3.2. All rates were
adjusted for age, sex, and race, except that sex-specific population estimates were
used for prostate and breast procedures. Rates were age and race adjusted as de-
scribed above (3.2).
STRATEGIES AND METHODS

220 THE DARTMOUTH ATLAS OF HEALTH CARE
Table 6. Definitions of Procedures and Conditions
Codes used to define condition
Procedure code (any position) 36.10 - 36.19
Procedure code (any position) 36.01, 36.02, 36.05
CPT code 93547 - 93553
CPT code 76090 - 76092
Procedure code (principal position) 85.20 - 85.23*
Procedure code 85.41, 85.43, 85.45, 85.47*(*must have diagnosis code 174 as well)
Procedure code 03.09, 80.5 - 80.59, 81.0 - 81.09
CPT 55700
Procedure code 60.5
Procedure code 60.2, 60.20 and
Diagnosis codes 600-601.4, 601.8, 601.9, 602-602.1, 602.3, 602.8, 602.9, or 788.2
Condition
Coronary Artery Disease
Coronary artery bypass surgery
PTCA
Coronary angiography
Breast Cancer (f)
Mammography
Partial mastectomy
Simple or radical mastectomy
Treatment of Back Pain
Laminectomy, spinal fusion
Early Prostate Cancer (m)
Needle biopsy
Radical prostatectomy
Benign Prostatic Hyperplasia (BPH) (m)
Transurethral resection for BPH
Source File
MEDPAR
MEDPAR
Part A
Part B
MEDPAR
MEDPAR
MEDPAR
Part B
MEDPAR
MEDPAR
Note: (f) refers to procedures for which counts of women served as the denominator; (m) refers to procedures for which counts of men served as the denominator

221
7. Benchmarking
The variations in per capita resource allocations and utilization among HRRs pro-
vide the basis for asking “What if?” questions. For example, if the numbers of
hospital beds per 1,000 residents in a particular HRR were the standard for the
United States, how many more or how many fewer beds would be required? Or, if
the numbers of primary care physicians per 100,000 residents observed for another
HRR were the standard for your HRR, how many more or how many fewer pri-
mary physicians would be needed?
Part Seven of the Atlas provides examples of how benchmarking can be applied to
answer such questions. For example, the physician supply in the United States was
compared to the physician workforce employed in a large staff model HMO and
the Minneapolis HRR. The HMO physician rates were obtained from an ongoing
study of HMO physician workforce market dynamics sponsored by the Robert
Wood Johnson Foundation (personal communication, David Kindig, M.D., Uni-
versity of Wisconsin). The study protocols were designed to take out-of-plan use
into account in estimating the per capita size of the workforce. In calculating the
HMO rate for primary physicians, we included emergency physicians because this
specialty provided much of the acute and after-hours primary care in the HMO.
The HMO workforce rates, like the rates for HRRs, were age and sex adjusted to
the U.S. population as described in Section 5.3. Thus, the rates can be compared
without concern that differences in age and sex structure might explain the observed
differences.
The strategies for benchmarking used in Part Seven permit comparisons of age and
sex adjusted rates across areas and provide estimates of the numbers of physicians in
excess or in deficit of the benchmark health plan or HRR. The rates referenced in
Table Two, Part Eight provide the data from which the information in Figure 7.1 –
the supply of physicians in the United States benchmarked to a large HMO – was
STRATEGIES AND METHODS

222 THE DARTMOUTH ATLAS OF HEALTH CARE
derived. For example, the ratio of U.S. rates for orthopedic surgeons (7.2 per
100,000 residents) to the HMO employment pattern (4.5 per 100,000 enrollees)
is 1.60, indicating a 60% surplus in the national supply, if the HMO was used as
the benchmark. According to this benchmark, the number of orthopedic physicians
in the U.S. in excess of “need” is obtained by evaluating:
(U.S. rate-HMO rate) x (U.S Population/100,000) = (7.2 - 4.5) x (2,486.5) = 6,706 physicians
Figure 7.3 benchmarks the experience of the HMO to a single city, Minneapolis.
For example, the ratio of Minneapolis rates for radiologists (7.52 per 100,000) com-
pared to the HMO employment pattern (8.70 per 100,000) is 0.86, indicating a
14% deficit in the Minneapolis supply, compared to the HMO employment rate.
According to the HMO benchmark, the number of radiologists serving the Minne-
apolis HRR is in undersupply:
(Minneapolis rate - HMO rate) x (Minneapolis Population/100,000) = (7.52-8.70) x (26.1) =
-30.8 FTE Radiologists
The data in the tables in Part Eight are adjusted to the U.S. population and can be
used to benchmark the experience in your own region to the region of your choice.
Find the rate in your own area for the resource allocation, hospitalization or proce-
dure rate of interest. Then identify the benchmark region to which you wish to
make the comparison. The ratio of the experience in your region to the benchmark
is obtained by dividing your rate by the rate in the benchmark region. The numbers
of hospital beds, personnel, expenditures, physicians, hospitalizations, or diagnos-
tic or surgical procedures above or below the benchmark is obtained by the
following formula:
(your HRR rate - benchmark rate) x (your HRR population/rate convention) = excess (+) or deficit
(-) in resources, hospitalizations, procedures, according to the selected benchmark

223
The “rate convention,” i.e., the denomination used for calculating population rates
in the tables presented in Part Eight, is: for expenditures and reimbursements, per
person; for procedures, hospitalizations and hospital beds and personnel, per 1,000;
for physician workforce, per 100,000.
Please note that data benchmarked using Medicare procedure rates per thousand
residents are for a two-year period, 1992-93; the appropriate population is the two-
year person-year estimate given in Table Three in Part Eight. For readability, the
rates in Tables One through Four have been rounded, usually to one place to the
right of the decimal point. Data displayed in the maps and in the figures in Parts
One through Eight are fully precise. As a result, calculations of the numbers in the
benchmark figures starting from the rounded numbers in the tables yield approxi-
mate, but not exactly the same, estimates. Despite the rounding, the precision in the
tables is sufficient for making comparisons between regions. The machine-readable
data base available with the Atlas can be used to achieve full precision.
STRATEGIES AND METHODS


225
Map Title Displayed Data Variable NameTable
Map List
MAP LIST
1.1
1.2
1.3
1.4
1.5
1.6
1.7
1.8
1.9
1.10
1.11
1.12
1.13
1.14
1.15
1.16
2.1
2.2
2.3
2.4
4.1
4.2
4.3
4.4
4.5
4.6
4.7
5.1
ZIP Codes Assigned to the Windsor, Vermont Hospital Service Area
Hospital Service Areas According to the Number of Acute CareHospitals
Hospital Service Areas According to Population Size
Hospital Service Areas Assigned to the Evansville, Indiana HospitalReferral Region
Hospital Referral Regions According to the Number of HospitalsPerforming Major Cardiovascular Surgery
New England Hospital Referral Regions
Northeast Hospital Referral Regions
South Atlantic Hospital Referral Regions
Southeast Hospital Referral Regions
South Central Hospital Referral Regions
Southwest Hospital Referral Regions
Great Lakes Hospital Referral Regions
Upper Midwest Hospital Referral Regions
Rocky Mountain Hospital Referral Regions
Pacific Northwest Hospital Referral Regions
Pacific Coast Hospital Referral Regions
Acute Care Hospital Beds
Acute Care Hospital Employees
Registered Nurses Employed in Acute Care Hospitals
Total Acute Care Hospital Expenditures
Price Adjusted Medicare Reimbursements for Traditional(Noncapitated) Medicare
Price Adjusted Medicare Reimbursements for Professional andLaboratory Services
Price Adjusted Medicare Reimbursements for Inpatient HospitalServices
Price Adjusted Medicare Reimbursements for Outpatient Facilities
Price Adjusted Medicare Reimbursements for Home Health CareServices
Medicare Enrollment in Capitated Managed Care Plans
Variations in Medicare Reimbursements
The Physician Workforce Active in Patient Care
1
1
1
1
4
4
4
4
4
2
Adjusted Beds per 1000
Adjusted FTE per 1000
Adjusted RNs per 1000
Adjusted Total Expenditures per Capita
Price Adjusted Total A and B Reimbursements
Price Adjusted Part B Professional and Lab Services
Price Adjusted Part A Short Stay Reimbursements
Price Adjusted Outpatient Facilities Reimbursements
Price Adjusted Home Health Reimbursements
All Physicians

226 THE DARTMOUTH ATLAS OF HEALTH CARE
Map Title Displayed Data Variable NameTable
5.2
5.3
5.a
5.4
5.5
5.6
5.7
5.8
5.9
5.10
5.11
5.12
5.13
6.1
6.2
6.3
6.4
6.5
6.6
6.7
6.8
6.9
Physicians in Primary Care
Specialist Physicians
The 50/50 Rule
Anesthesiologists
Cardiologists
General Surgeons
Obstetrician/Gynecologists
Ophthalmologists
Orthopedic Surgeons
Psychiatrists
Radiologists
Urologists
Physicians in Residency Training Programs
Coronary Artery Bypass Grafting
Percutaneous Transluminal Coronary Angioplasty
Coronary Angiography
Mammography
Breast Sparing Surgery
Back Surgery
Prostate Biopsy
Radical Prostatectomy
Transurethral Resection of the Prostate
2
2
2
2
2
2
2
2
2
2
2
2
3
3
3
3
3
3
3
3
3
Primary Care Physicians
Specialists
Anesthesiologists
Cardiologists
General Surgeons
Obstetrician/Gynecologists
Ophthalmologists
Orthopedic Surgeons
Psychiatrists
Radiologists
Urologists
Resident Physicians
CABG Procedure Rate
PTCA Procedure Rate
Part A Angiography Rate
Part B Mammography Incidence Rate
Part A Percent Partial Mastectomies
Back Surgery Rate
Part B Prostate Biopsy Incidence Rate
Radical Prostatectomy Rate
TURP and BPH Rate

227
Figure Title Ordinate Variable NameTable Table Abscissa Variable Name R 2
1.1
1.2
1.3
2.1
2.2
2.3
2.4
3.1
3.2
3.3
3.4
3.5
3.6
3.7
Cumulative Percentage of Population of theUnited States According to the HospitalService Area Localization Index(1992-93)
Cumulative Percentage of Population of theUnited States According to the PopulationSize of Hospital Service Areas (1990 Census)
Cumulative Percentage of Population of theUnited States According to the HospitalReferral Region Localization Index (1992-93)
Acute Care Hospital Beds Allocated toHospital Referral Regions (1993)
Hospital Employees Allocated to HospitalReferral Regions (1993)
Hospital-Based Registered Nurses Allocatedto Hospital Referral Regions (1993)
Price Adjusted Acute Care HospitalExpenditures Allocated to Hospital ReferralRegions (1993)
The Association Between Allocated HospitalBeds and Price Adjusted Hospital Expendi-tures (1993)
The Association Between Allocated HospitalEmployees and Price Adjusted MedicareReimbursements for Inpatient HospitalServices (1993)
The Association Between Allocated HospitalBeds and Medicare Hospitalizations for HipFractures (1992-93)
The Association Between Allocated HospitalBeds and Medicare Hospitalizations forSurgical Care (1992-93)
The Association Between Allocated HospitalBeds and Medicare Hospitalizations for HighVariation Medical Conditions (1992-93)
The Association Between Allocated HospitalBeds and the Percentage of Medicare DeathsThat Occurred in Hospitals (1992-93)
Summary of Effect of Hospital Capacity onUtilization (1992-93)
1
1
1
1
1
4
3
3
3
3
3
Adjusted Beds per 1000
Adjusted FTE per 1000
Adjusted RNs per 1000
Adjusted Total Expenditures per Capita
Adjusted Total Expenditures per Capita
Dartmouth Price Adjusted Part A ShortStay Reimbursements
Hip Fracture Rate
Rate for All Surgical Discharges
Rate for High Variation MedicalConditions
Percent In-Hospital Medicare Deaths
Hip Fracture Rate
Rate for High Variation MedicalConditions
Percent In-Hospital Medicare Deaths
Rate for All Surgical Discharges
1
1
1
1
1
1
1
Adjusted Beds per 1000
Adjusted FTE per 1000
Adjusted Beds per 1000
Adjusted Beds per 1000
Adjusted Beds per 1000
Adjusted Beds per 1000
Adjusted Beds per 1000
.57
.32
.07
.20
.57
.36
Figure List
FIGURE LIST

228 THE DARTMOUTH ATLAS OF HEALTH CARE
Figure Title Ordinate Variable NameTable Table Abscissa Variable Name R 2
The Association Between Allocated HospitalBeds and Population Based MedicareMortality
The Association Between Hospital Capacityand Medicare Hospitalization Rates for HighVariation Medical Conditions AmongPopulations, Stratified by Median Income inZIP Code of Residence
Price Adjusted Reimbursements forTraditional (Noncapitated) Medicare AmongHospital Referral Regions (1993)
Price Adjusted Part B Medicare Reimbursementsfor Professional and Laboratory ServicesAmong Hospital Referral Regions (1993)
Price Adjusted Reimbursements for InpatientHospital Services Among Hospital ReferralRegions (1993)
Price Adjusted Medicare Reimbursements forOutpatient Services Among Hospital ReferralRegions (1993)
Price Adjusted Medicare Reimbursements forHome Health Care Services Among HospitalReferral Regions (1993)
The Association Between Price AdjustedMedicare Reimbursements for Outpatient andInpatient Hospital Services (1993)
The Association Between Price AdjustedMedicare Reimbursements for Professionaland Laboratory Services and for InpatientHospital Services (1993)
The Association Between Price AdjustedMedicare Part B Reimbursements ProvidedOutside and Inside the Hospital (1993)
Physicians Allocated to Hospital ReferralRegions (1993)
Primary Care Physicians Allocated toHospital Referral Regions (1993)
Specialists Allocated to Hospital ReferralRegions (1993)
The Association Between the SpecialtyPhysician Workforce and Price AdjustedMedicare Medical and Surgical Reimburse-ments (1993)
The Association Between the Primary CarePhysician Workforce and Price AdjustedMedicare Medical and Surgical Reimburse-ments (1993)
Anesthesiologists Allocated to HospitalReferral Regions (1993)
3.8
3.9
4.1
4.2
4.3
4.4
4.5
4.6
4.7
4.8
5.1
5.2
5.3
5.a
5.b
5.4
3
4
4
4
4
4
4
4
2
2
2
4
4
2
Medicare Mortality Rate
Breakdown of High Variation MedicalConditions by Income is not in the Tables
Dartmouth Price Adjusted Total A and BReimbursements
HCFA Price Adjusted Part B Professionaland Lab Services
Dartmouth Price Adjusted Part A ShortStay Reimbursements
Dartmouth Price Adjusted OutpatientFacilities Reimbursements
Dartmouth Price Adjusted Home HealthCare Reimbursements
Dartmouth Price Adjusted Part A ShortStay Reimbursements
Dartmouth Price Adjusted Part A ShortStay Reimbursements
Physician Inpatient Services not includedin the Tables
All Physicians
Primary Care Physicians
Specialists
HCFA Price Adjusted Part B Medical andSurgical Services
HCFA Price Adjusted Part B Medical andSurgical Services
Anesthesiologists
1
4
4
2
2
Adjusted Beds per 1000
Dartmouth Price AdjustedOutpatient Facilities Reimburse-ments
HCFA Price Adjusted Part BProfessional and Lab Services
Physician Services not included inthe Tables
Specialists
Primary Care Physicians
.13
.17
.23
.52
.15
.01
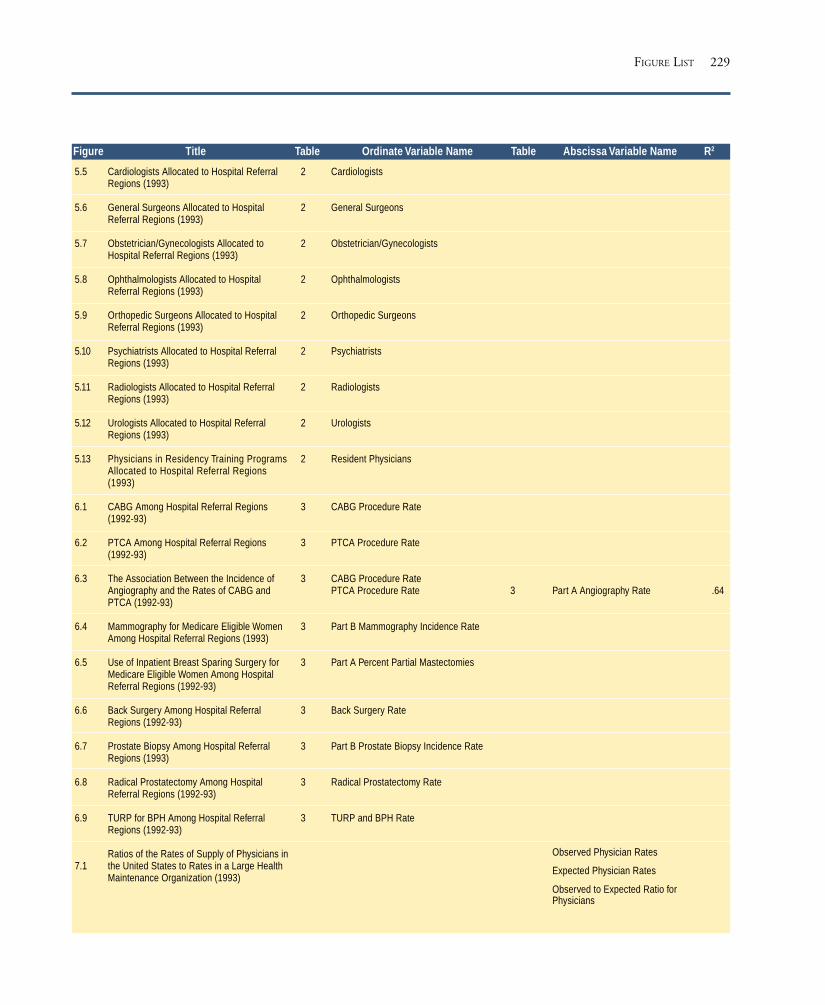
229
Figure Title Ordinate Variable NameTable Table Abscissa Variable Name R 2
Cardiologists Allocated to Hospital ReferralRegions (1993)
General Surgeons Allocated to HospitalReferral Regions (1993)
Obstetrician/Gynecologists Allocated toHospital Referral Regions (1993)
Ophthalmologists Allocated to HospitalReferral Regions (1993)
Orthopedic Surgeons Allocated to HospitalReferral Regions (1993)
Psychiatrists Allocated to Hospital ReferralRegions (1993)
Radiologists Allocated to Hospital ReferralRegions (1993)
Urologists Allocated to Hospital ReferralRegions (1993)
Physicians in Residency Training ProgramsAllocated to Hospital Referral Regions(1993)
CABG Among Hospital Referral Regions(1992-93)
PTCA Among Hospital Referral Regions(1992-93)
The Association Between the Incidence ofAngiography and the Rates of CABG andPTCA (1992-93)
Mammography for Medicare Eligible WomenAmong Hospital Referral Regions (1993)
Use of Inpatient Breast Sparing Surgery forMedicare Eligible Women Among HospitalReferral Regions (1992-93)
Back Surgery Among Hospital ReferralRegions (1992-93)
Prostate Biopsy Among Hospital ReferralRegions (1993)
Radical Prostatectomy Among HospitalReferral Regions (1992-93)
TURP for BPH Among Hospital ReferralRegions (1992-93)
Ratios of the Rates of Supply of Physicians inthe United States to Rates in a Large HealthMaintenance Organization (1993)
5.5
5.6
5.7
5.8
5.9
5.10
5.11
5.12
5.13
6.1
6.2
6.3
6.4
6.5
6.6
6.7
6.8
6.9
7.1
2
2
2
2
2
2
2
2
2
3
3
3
3
3
3
3
3
3
Cardiologists
General Surgeons
Obstetrician/Gynecologists
Ophthalmologists
Orthopedic Surgeons
Psychiatrists
Radiologists
Urologists
Resident Physicians
CABG Procedure Rate
PTCA Procedure Rate
CABG Procedure RatePTCA Procedure Rate
Part B Mammography Incidence Rate
Part A Percent Partial Mastectomies
Back Surgery Rate
Part B Prostate Biopsy Incidence Rate
Radical Prostatectomy Rate
TURP and BPH Rate
3 Part A Angiography Rate
Observed Physician Rates
Expected Physician Rates
Observed to Expected Ratio forPhysicians
.64
FIGURE LIST

230 THE DARTMOUTH ATLAS OF HEALTH CARE
Figure Title Ordinate Variable NameTable Table Abscissa Variable Name R 2
Ratios of the Rates of Supply of Physicians inthe United States to Rates in the MinneapolisHospital Referral Region (1993)
Ratios of the Rates of Supply of Physicians inMinneapolis to Rates in a Large HealthMaintenance Organization (1993)
Ratios of the Rates for Medicare Reimburse-ments and for Hospital Resource Allocationsin the United States to the Rates in theMinneapolis Hospital Referral Region (1993)
Ratios of the Rates of Physicians in SelectedHRRs to Rates in the Minneapolis HospitalReferral Region (1993)
Ratios of the Rates for Hospital Resourcesand Medicare Reimbursement in SelectedHRRs to Rates in the Minneapolis HospitalReferral Region (1993)
7.2
7.3
7.4
7.5
7.6
4
4
4
4
4
1
1
1
1
1
1
4
Observed Physician Rates
Expected Physician Rates
Observed to Expected Ratio forPhysicians
Observed Physician Rates
Expected Physician Rates
Observed to Expected Ratio forPhysicians
Total Part A and Part BReimbursements
Outpatient Facilities Reimburse-ments
Part A Short Stay Reimburse-ments
Part B Reimbursements forProfessional and Lab Services
Home Health Care Reimburse-ments
Adjusted Beds per 1000
Adjusted FTE per 1000
Adjusted RNs per 1000
Observed Physician Rates
Expected Physician Rates
Observed to Expected Ratio forPhysicians
Adjusted Beds per 1000
Adjusted FTE per 1000
Adjusted RNs per 1000
Total Part A and Part BReimbursements


The Dartmouth Atlas of Health Care is based, in part, on data supplied byThe American Hospital AssociationThe American Medical Association
The American Osteopathic AssociationThe Health Care Financing AdministrationThe National Center for Health Statistics
The United States CensusThe United States Department of Defense
Claritas, Incorporated
Data analyses were performed usingSoftware developed by the Center for the Evaluative Clinical Sciencesusing SAS® on HP® equipment running the UNIX® system software
Maps and map databases were generated usingMapInfo® software
Highway map coordinates from MapInfo®
ZIP Code map coordinates from GDT®
Claritas 3H. Custom Dataset for US ZIP Codes from Claritas®
Atlas design and print production by
Elizabeth Adams and Jonathan Sa'adah
Intermedia Print Communications, Hartford, Vermont