The Dark Art of Cement Bond Log Short Final - PETRONODE Yakimov_The Dark Art of... · • Basic...
56
The Dark Art of Cement Bond Log M.Yakimov 28-Sep-2012 Mikhail Yakimov, SEIC-TDD
Transcript of The Dark Art of Cement Bond Log Short Final - PETRONODE Yakimov_The Dark Art of... · • Basic...
The Dark Art of Cement Bond Log
M.YakimovM.Yakimov
28-Sep-2012
Mikhail Yakimov, SEIC-TDD

Overview
• Purposes of Cement Bond Logging
• Typical Cementing Problems
• Petrophysical Methods for Cement Bond Evaluation
• Acoustic Methods in Detail
• Log Quality Control• Log Quality Control
• Basic Cement Bond Log Interpretation
• Examples

Purposes Of Cement Bond Logging

Good cementing is needed for:
• Hydraulic isolation of the casing annulus and permeable intervals
• Casing mechanical support
• Perforation holes’ stability

Little testDo you have hydraulic isolation at the proposed perforation interval:
• ICV1 = 15m3, pumped 20m3 plus displacement volume, no returns at surface
• ICV = 15m3, pumped 20m3, 3m3 of returns, but the level has dropped as soon as the pump stopped dropped as soon as the pump stopped
• ICV = 15m3, pumped 20m3, 3m3 of returns, 3 days later –still solid
cement cake at surface
1 ICV – Integrated Cement Volume

Little test – answers…
Hydraulic isolation:
• ICV = 15m3, pumped 20m3 plus displacement volume, no returns at surface
Inconclusive (most likely, no)
• ICV = 15m3, pumped 20m3, 3m3 of returns, but the level has • ICV = 15m3, pumped 20m3, 3m3 of returns, but the level has dropped as soon as the pump stopped
Inconclusive (most likely, no)
• ICV = 15m3, pumped 20m3, 3m3 of returns, 3 days later –still solid cement cake at surface
Inconclusive (most likely, yes…
but would you bet your life on it?)

Cement Bond Logging
• Continuous downhole measurement over the entire cementing intervals
• Good quantitative measurement of cement quality and placement
• Allows to plan remediation work
• May provide clues for cementing programs’ improvements
• Solid conclusive answers if done properly
• Inconclusive or just wrong if any shortcuts are taken

Typical Cementing Problems

1. Incorrect volumes
• Too little / too much pre-wash, slurry, displacement
• Unexpected fluid losses (including the losses increase after the casing run)

What is wrong here?
2. Cement composition
• Too little / too much retardants
• Density
• Viscosity
• pH
• Water salinity• Water salinity
• Reactions with formation minerals (esp. clay minerals, limestone, dolomite)
• Reactions with mud components (esp. water-polymer mud systems)

3. Pumping procedure
• Flow rate is too slow / too fast
• Stop-overs or pump break-downs
• Stages and valves…
Effects (in order of significance):
• No cement behind casing
• Channeling
• Poor quality cement behind casing
• Poor formation bond
• Micro-annulus• Micro-annulus
• Cement mechanical degradation
• Cement chemical degradation

Volume effect:
• No cement behind casing:
– Not enough slurry
– Too much displacement fluid pumped
– Not enough displacement fluid pumped (so you fluid pumped (so you probably have some bigger problem here!)
• Cement / fluid return at surface is not a guarantee of proper cement placement

Placement effects:
• Channeling
– Physical effects (e.g. flow rate)
– Chemical effects (e.g. clay minerals)
– Insufficient pre-wash
• Poor formation bond
– Mostly chemical effects (e.g. clay minerals)– Mostly chemical effects (e.g. clay minerals)
– Insufficient pre-wash
• Micro-annulus
– “Aggressive” cementing programmes
– Low casing grades

Material effects:
• Poor quality cement behind casing
– Chemical effects (e.g. clay minerals, water-based polymers)
– Insufficient pre-wash
• Cement mechanical degradation
– Vibration– Vibration
– Perforation
• Cement chemical degradation
– Very unusual for modern slurries

Petrophysical Methods for Cement Bond Evaluation

Non-petrophysical methods
• Surface cement samples
• Pressure / rate / density record
• Returns observation
• Pressure tests
• LOT / FIT
• “Nullius in verba!” (Horace)

Petrophysical methods
• Temperature Log
• Neutron Log
• Acoustic Logs
– Sonic Log (CBL / VD or Sector CBL)
– Ultrasonic Log– Ultrasonic Log
– Combination Log

Acoustic Logs
• Tool response is related to Acoustic Impedance:
Z = ρ / S * 304.6 in MRay, 1Ray=kg/s/m2
S – slowness, µs/ft ρ – density, SG
Steel (bulk): S=51.4, ρ=7.80 Z=46.2 Steel (bulk): S=51.4, ρ=7.80 Z=46.2
Steel (pipe): S=57.3, ρ=7.80 Z=41.5
Cement: S=58-72, ρ=1.76-2.72 Z=7.46-14.3
Water/Brine: S=189, ρ≈1 Z=1.61
Mud: S≈200, ρ=1.03-1.8 Z=1.45-2.70
Formation: S=40-400, ρ=1.5-2.7 Z=1.2-21

Acoustic Logs (2)
• Reflection coefficient from Acoustic Impedance:
CR = (Z2-Z1) / (Z1+Z2)
• Transmission coefficient from Acoustic Impedance:
CT = 2*Z1 / (Z1+Z2)
• Note:
CR + CT = 1

Acoustic Logs (3)
• Due to the great contrast between fluids, steel and cement, sound reflections provide excellent way of determining the cement presence and quality
• De-facto industry standard
• Regulatory requirement in many countries • Regulatory requirement in many countries

Acoustic Methods in Detail

Acoustic Log (CBL-VDL)
• Cement Bond Log (CBL) – 3 ft
between the transmitter and the receiver
• Visual Density Log (VDL) – 5
ft between the transmitter and the receiver
• DSLT – Schlumberger Ltd.

Acoustic Log (Sector CBL)
• Cement Bond Log (CBL) – 3 ft
between the transmitter and the receiver
• Visual Density Log (VDL) – 5 ft
between the transmitter and the receiver
• 8 ”sectoral” piezoelectric receivers, providing rough cement image at 450 steps
• SBT – Weatherford International

Sound propagation in casing

Waveforms at receiver

Cement dissipates tube wave II
Impedancein lbs/uS/ft2
1 lbs/uS/ft2 =
= 4.881 MRay

CBL Log Components

CBL Log Components (2)
• VDL “wavetrain” provides means for qualitative interpretation
and log quality control
• CBL amplitude provides means for quantitative interpretation of content behind casing – the lower the CBL, the better the
cement.
• Transit time is the most important quality indicator • Transit time is the most important quality indicator

CBL Interpretation Charts (Cem-1, GN 8-7, etc)

CBL Uncertainty
• CBL is an “integrating” tool
• Same response for:
– 100% cemented pipe with low compressive strength cement OR
– Partially cemented pipe with high compressive strength cement (e.g. channels)
OR
– Micro-annulus

Sector CBL

Ultrasonic tools
• Resolve CBL uncertainty by metering 360o surrounding
• Schlumberger (USIT) or Weatherford URS – one Weatherford URS – one
rotating transducer
• Isolation Behind Casing Tool (IBC) – three rotating
transducers

Ultrasonic tool principle

Ultrasonic tool principle (2)

Ultrasonic Presentation (Cement)
Courtesy of Schlumberger Ltd.

Ultrasonic Presentation (C&C)

Ultrasonic limitations
• Have difficulty detecting formation bond
• May give false readings in high-viscosity mud
• Cannot distinguish between Micro-Annulus and absent cement
• Ideally, should always run in combination with CBL/VDL
• IBC can be run without CBL/VDL, but the service does not provide the standard 3’ and 5’ logs
– Combine with CBL/VDL if possible

Combination logs
“Nolite id cogere, cape malleum majorem”
-If it does not want to go, don’t force it.Just take bigger hammer.
Courtesy Schlumberger Ltd.

Log Quality Control

Tool positioning: centering
• Both Ultrasonic and CBL/VDL have to be perfectly centered (typically anything above 0.2” is unacceptable)
• Off-center effects:
– CBL shows lower amplitudes (e.g. “better cement”)
– VDL arrivals “smeared” (e.g. “bad cement”?)
– Ultrasonic shows “channels” in direction perpendicular to
offset and casing thickness increase in the same direction
• For both type of tools, eccentering is easy to see

Tool positioning: tilt
• Both Ultrasonic and CBL/VDL should not run “tilted” (that may
happen due to centraliser failure)
• Tilt effects:
– CBL shows lower amplitudes (e.g. “better cement”)
– VDL usually unaffected– VDL usually unaffected
– Ultrasonic shows “channels” in direction of tilt and casing
thickness increase in the same direction
• For Ultrasonic tuul, tilt, especially sporadic tilt due to jerky cable motion, may pass undetected, resulting in wrong interpretation

Transit Time should be right!
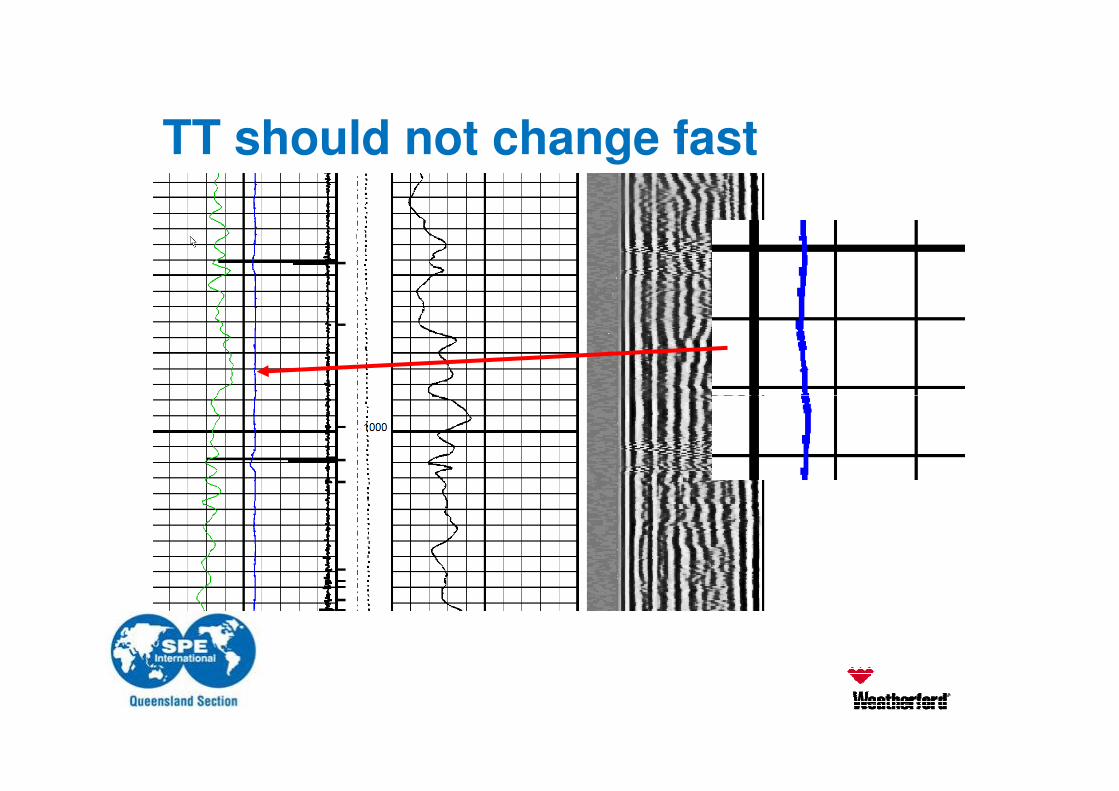
TT should not change fast

TT should not change fast (2)
• TT should be within ±0.5 µs on each of the casing segments
• Changes at the casing collars are expected
• Minor changes on casing jewellery are possible
• Gradual change from TD to surface is OK (Smud changes with temperature)
• Fast-changing TT indicates poor tool centering or sporadic tilt

CBL must be calibrated!
• If CBL reads above Free Pipe amplitude or below 100% amplitude – suspect poor tool calibration
• Fluid Compensation Factor (FCF) should be used with caution

Basic Cement Bond Log Interpretation

1. Calculate Min and Max amplitudes
• Casing Thickness
• Free Pipe CS = 0 MPa
• Fully cemented pipe:
– Normal 10 MPa
– Foamed 6 MPa
– OR: use lab data if available

2. Perform “CBL Triage”

3. Determine Formation Arrivals
• Prominent formation arrivals indicate channeling as opposed to weak cement or micro-annulus
• Decide to follow path 4a or 4b

4a. Calculate C.S.(from Cem-1)
Weak cement orMicro-annulus case
4b. Calculate % of coverage
Cement coverage = (Acbl-A100%)/(Afree-A 100%)
Channeling case

5. Micro-annulus or Weak Cement?
• Micro-annulus is caused by two factors:
– Aggressive cementing program (low retardants, high pumping rates) AND
– Low-grade casing
• CBL/VDL alone cannot distinguish • CBL/VDL alone cannot distinguish between micro-annulus or low compressive strength cement
• Micro-annulus can be positively resolved by SCBL-URS combo or by IBC

Cement Bond Interpretation (Recap)
Step 1: Determine CBL amplitude limits
Step 2: Perform CBL Triage
Step 3: Check formation arrivals
Step 4a: Calculate C.S. OR Step 4b: Calculate Coverage
Step 5: Distinguish between micro-annulus or low weak cement Step 5: Distinguish between micro-annulus or low weak cement (e.g. by sector bond)
Locate zones of interest and decide on hydraulic isolation

References
• Shell Production Handbook v3, The Hague, 1991
• P. Theys, Log data acquisition and quality control, 1999
• Schlumberger Log Interpretation charts, 2004
• Weatherford Log Interpretation charts, 2009