
The Dallas-Fort Worth Airport Earthquake Sequence ......The Dallas-Fort Worth Airport Earthquake...
11
The Dallas-Fort Worth Airport Earthquake Sequence: Seismicity Beyond Injection Period Paul O. Ogwari 1 , Heather R. DeShon 1 , and Matthew J. Hornbach 1 1 Department of Earth Science, Southern Methodist University, Dallas, TX, USA Abstract The 2008 Dallas-Fort Worth Airport earthquakes mark the beginning of seismicity rate changes linked to oil and gas operations in the central United States. We assess the spatial and temporal evolution of the sequence through December 2015 using template-based waveform correlation and relative location methods. We locate ~400 earthquakes spanning 2008–2015 along a basement fault mapped as the Airport fault. The sequence exhibits temporally variable b values, and small-magnitude (m < 3.4) earthquakes spread northeast along strike over time. Pore pressure diffusion models indicate that the high-volume brine injection well located within 1 km of the 2008 earthquakes, although only operating from September 2008 to August 2009, contributes most significantly to long-term pressure perturbations, and hence stress changes, along the fault; a second long-operating, low-volume injector located 10 km north causes insufficient pressure changes. High-volume injection for a short time period near a critically stressed fault can induce long-lasting seismicity. Plain Language Summary The 31 October 2008 earthquakes at the Dallas-Fort Worth International Airport were the first documented earthquakes in the Fort Worth Basin in the historic record and the first of multiple earthquake sequences in the basin associated with waste-fluid injection. Since the shut-in of the wastewater disposal well nearest to the initiation point of the sequence, seismicity has continued for more than 7 years over a 6 km long fault. We found that the high-volume brine injection well located within 1 km of the 2008 earthquakes, although only operating from September 2008 to August 2009, contributes most significantly to long-term pressure perturbations, and hence stress changes, along the fault. The high-volume injection for a short time period near a critically stressed fault can induce long-lasting seismicity. 1. Introduction Post-2008 earthquake rate increases in the central United States have been associated with large-scale subsurface disposal of waste-fluids from oil and gas operations (e.g., Ellsworth, 2013; Rubinstein & Mahani, 2015; Walsh & Zoback, 2015; Weingarten et al., 2015). The 31 October 2008 earthquakes at the Dallas-Fort Worth International Airport (hereafter, DFW Airport) were the first documented earthquakes in the Fort Worth Basin (FWB) in the historic record (Frohlich et al., 2010, 2011, 2016; Frohlich & Davis, 2002) and the first of multiple earthquake sequences in the basin associated with waste-fluid injection (Frohlich, 2012; Hornbach et al., 2015, 2016; Justinic et al., 2013; Lund Snee & Zoback, 2016; Reiter et al., 2012; Scales et al., 2017; Weingarten et al., 2015). As efforts to design mitigation strategies for induced earthquakes continues, questions regarding the temporal continuity in rates and magnitudes during and after reduction or cessation of subsurface injection remain unclear (Bommer et al., 2015). Understanding the spatiotemporal evolution of induced earthquake sequences like those in the FWB pro- vides data to inform mitigation strategies. Seismicity at the DFW Airport began on 31 October 2008 with a series of 8 m blg 2.6 to 3.0 earthquakes reported by the U.S. Geological Survey (USGS) National Earthquake Information Center (NEIC). Following the 31 October events, seismologists from Southern Methodist University (SMU) deployed six 3-component broadband seismographs and recorded 11 events of magnitude 1.7 to 2.3, including a cluster on 20 November not reported by the NEIC (Frohlich et al., 2010, 2011) (Figure 1). A m blg 3.3 in May 2009 prompted redeployment of four stations around the airport. Analysis indicated that the earthquakes were located within a 1 km radius of a Class II saltwater disposal (SWD) well that had begun injecting 7 weeks prior to the October earthquakes (Figure 2). Reflection data showed a regional NE-SW trending normal fault (Railroad Commission of Texas, 2015), now called the Airport fault, present at earthquake and injection depths. The south airport well (hereafter, S-well) ceased injecting in August 2009. Frohlich et al. (2011) OGWARI ET AL. 553 PUBLICATION S Journal of Geophysical Research: Solid Earth RESEARCH ARTICLE 10.1002/2017JB015003 Key Points: • Earthquakes associated with the 2008 Dallas-Fort Worth Airport sequence continued to migrate away from injection through 2015 • Pore pressure diffusion models indicate high-volume injection led to long-term stress changes that trigger earthquakes years after shut down • Even brief periods of high-volume wastewater injection can perturb stress and lead to years of seismicity Supporting Information: • Supporting Information S1 • Data Set S1 • Data Set S2 Correspondence to: P. O. Ogwari, [email protected] Citation: Ogwari, P. O., DeShon, H. R., & Hornbach, M. J. (2018). The Dallas-Fort Worth Airport earthquake sequence: Seismicity beyond injection period. Journal of Geophysical Research: Solid Earth, 123, 553–563. https://doi.org/ 10.1002/2017JB015003 Received 18 SEP 2017 Accepted 2 JAN 2018 Accepted article online 7 JAN 2018 Published online 26 JAN 2018 ©2018. American Geophysical Union. All Rights Reserved.
Transcript of The Dallas-Fort Worth Airport Earthquake Sequence ......The Dallas-Fort Worth Airport Earthquake...
The Dallas-Fort Worth Airport Earthquake Sequence:Seismicity Beyond Injection PeriodPaul O. Ogwari1 , Heather R. DeShon1 , and Matthew J. Hornbach1
1Department of Earth Science, Southern Methodist University, Dallas, TX, USA
Abstract The 2008 Dallas-Fort Worth Airport earthquakes mark the beginning of seismicity rate changeslinked to oil and gas operations in the central United States. We assess the spatial and temporal evolution ofthe sequence through December 2015 using template-based waveform correlation and relative locationmethods. We locate ~400 earthquakes spanning 2008–2015 along a basement fault mapped as the Airportfault. The sequence exhibits temporally variable b values, and small-magnitude (m < 3.4) earthquakesspread northeast along strike over time. Pore pressure diffusion models indicate that the high-volume brineinjection well located within 1 km of the 2008 earthquakes, although only operating from September 2008to August 2009, contributes most significantly to long-term pressure perturbations, and hence stresschanges, along the fault; a second long-operating, low-volume injector located 10 km north causesinsufficient pressure changes. High-volume injection for a short time period near a critically stressed faultcan induce long-lasting seismicity.
Plain Language Summary The 31 October 2008 earthquakes at the Dallas-Fort Worth InternationalAirport were the first documented earthquakes in the Fort Worth Basin in the historic record and the first ofmultiple earthquake sequences in the basin associated with waste-fluid injection. Since the shut-in of thewastewater disposal well nearest to the initiation point of the sequence, seismicity has continued for morethan 7 years over a 6 km long fault. We found that the high-volume brine injection well located within 1 km ofthe 2008 earthquakes, although only operating from September 2008 to August 2009, contributes mostsignificantly to long-term pressure perturbations, and hence stress changes, along the fault. The high-volumeinjection for a short time period near a critically stressed fault can induce long-lasting seismicity.
1. Introduction
Post-2008 earthquake rate increases in the central United States have been associated with large-scalesubsurface disposal of waste-fluids from oil and gas operations (e.g., Ellsworth, 2013; Rubinstein &Mahani, 2015; Walsh & Zoback, 2015; Weingarten et al., 2015). The 31 October 2008 earthquakes at theDallas-Fort Worth International Airport (hereafter, DFW Airport) were the first documented earthquakesin the Fort Worth Basin (FWB) in the historic record (Frohlich et al., 2010, 2011, 2016; Frohlich & Davis,2002) and the first of multiple earthquake sequences in the basin associated with waste-fluid injection(Frohlich, 2012; Hornbach et al., 2015, 2016; Justinic et al., 2013; Lund Snee & Zoback, 2016; Reiteret al., 2012; Scales et al., 2017; Weingarten et al., 2015). As efforts to design mitigation strategies forinduced earthquakes continues, questions regarding the temporal continuity in rates and magnitudesduring and after reduction or cessation of subsurface injection remain unclear (Bommer et al., 2015).Understanding the spatiotemporal evolution of induced earthquake sequences like those in the FWB pro-vides data to inform mitigation strategies.
Seismicity at the DFW Airport began on 31 October 2008 with a series of 8 mblg 2.6 to 3.0 earthquakesreported by the U.S. Geological Survey (USGS) National Earthquake Information Center (NEIC). Followingthe 31 October events, seismologists from Southern Methodist University (SMU) deployed six 3-componentbroadband seismographs and recorded 11 events of magnitude 1.7 to 2.3, including a cluster on 20November not reported by the NEIC (Frohlich et al., 2010, 2011) (Figure 1). Amblg 3.3 in May 2009 promptedredeployment of four stations around the airport. Analysis indicated that the earthquakes were locatedwithin a 1 km radius of a Class II saltwater disposal (SWD) well that had begun injecting 7 weeks prior tothe October earthquakes (Figure 2). Reflection data showed a regional NE-SW trending normal fault(Railroad Commission of Texas, 2015), now called the Airport fault, present at earthquake and injectiondepths. The south airport well (hereafter, S-well) ceased injecting in August 2009. Frohlich et al. (2011)
OGWARI ET AL. 553
PUBLICATIONSJournal of Geophysical Research: Solid Earth
RESEARCH ARTICLE10.1002/2017JB015003
Key Points:• Earthquakes associated with the 2008Dallas-Fort Worth Airport sequencecontinued to migrate away frominjection through 2015
• Pore pressure diffusion modelsindicate high-volume injection led tolong-term stress changes that triggerearthquakes years after shut down
• Even brief periods of high-volumewastewater injection can perturbstress and lead to years of seismicity
Supporting Information:• Supporting Information S1• Data Set S1• Data Set S2
Correspondence to:P. O. Ogwari,[email protected]
Citation:Ogwari, P. O., DeShon, H. R., & Hornbach,M. J. (2018). The Dallas-Fort WorthAirport earthquake sequence:Seismicity beyond injection period.Journal of Geophysical Research: SolidEarth, 123, 553–563. https://doi.org/10.1002/2017JB015003
Received 18 SEP 2017Accepted 2 JAN 2018Accepted article online 7 JAN 2018Published online 26 JAN 2018
©2018. American Geophysical Union.All Rights Reserved.
concluded that the DFW Airport earthquakes were probably triggered on apreexisting fault by subsurface stress changes due to waste-fluid injection.Reiter et al. (2012) reanalyzed the data collected during the SMU deploy-ment, were able to detect more events, and reached the same conclusionas Frohlich et al. (2011) regarding cause.
Beginning in 2009, temporary seismic stations were placed at the airportby Chesapeake Energy, which operated multiple production and twoClass II SWD wells on the property (see Figure 2 for injection well loca-tions). Janská and Eisner (2012)used these data to document a cluster ofearthquakes about 4 km north of the S-well beginning in May 2010through January 2012 (hypocenters approximated by green asterisks,Figure 1). Deployment of local seismic stations in the area by SMU, includ-ing redeployment of AFDAD in 2014, revealed small-magnitude earth-quakes continued at the airport; earthquakes from 2013 to present arereported in the SMU local earthquake catalog (blue asterisks, Figure 1)(Hornbach et al., 2015; Magnani et al., 2017; Scales et al., 2017).
We hypothesize that migration of the earthquakes along the Airport faultfollows diffusion of pore fluid pressure changes at depth due to injectionof waste fluids at the airport injectors. In order to provide amore consistentunderstanding of the spatial and temporal evolution of the sequence, wereanalyze local seismic data and long-running regional stations to developa spatially and temporally consistent earthquake catalog (Figure 1, inset).We use the NEIC and local earthquake catalogs as detection templatesfor cross correlation of continuous waveform data at regional stations thatrecorded from 2008 to 2015. We employ a novel relative location techni-que to constrain epicentral location using regional data. We model thepore pressure changes in the Ellenburger formation that is targeted forwaste-fluid injection and in the Precambrian crystalline basement overthe period of injection to December 2015 and consider pressure influencesfrom both the south and north injection wells located at the airport(Figure 2).
2. The Revised DFW Airport Catalog2.1. Template Earthquakes
Recording earthquakes at the DFW Airport illustrates one of the general challenges of studying inducedearthquakes in the central United States—namely, a space and time bias exists in network coverage that lim-its the ability to capture the initial onsets of the earthquake sequences and constrain sequence history. Priorto 2008, the nearest seismic station to the DFW Airport wasWMOK at a distance of 264 km (Figure 1), and onlyregional stations AMTX and ABTX provide high signal-to-noise broadband coverage of most of the DFWAirport sequence (Figure S1 in the supporting information). SMU and Chesapeake deployed seismometersin and around the airport, but operation times varied (Figure S1).
We analyze data from the SMU networks and CHKDFWS to build a revised local earthquake catalog specific tothe DFW airport sequence (Data Set S1). P and S phase onsets are manually identified, and earthquakes arelocated using GENLOC (generalized earthquake-location) algorithms (Pavlis et al., 2004) within theAntelope database management system (Kinemetrics, Inc.) combined with the 1-D velocity model used byFrohlich et al. (2011) derived from the Trigg well velocity log (Geotechnical Corporation, 1964). We reproducethe Frohlich et al. (2011) catalog and add 19 earthquakes ranging in depth between 2.8 and 5.0 km. Eightevents reported by Janská and Eisner (2012) study are detected but cannot be located because we did nothave access to all Chesepeake seismic stations. The revised local catalog totals 33 earthquakes. Crustal phases(Pg and Lg) at WMOK, ABTX, and AMTX for events in the revised local catalog recorded at regional distancesand all unique NEIC catalog events are manually picked, resulting in 38 template earthquakes (Data Set S2,denoted by an asterisk).
AFMOM
NLKTX
CPSTX
JPLTX
AFDAD
CHKDFWS
-97.2 -97.1 -97.0 -96.932.65
32.7
32.75
32.8
32.85
32.9
32.95 LKPGV
6 km1 20 4
Texas
WMOK
ABTX
AMTX
DFW Airport
CHKELS
Longitude
Lat
itud
e EULF3
EULF1
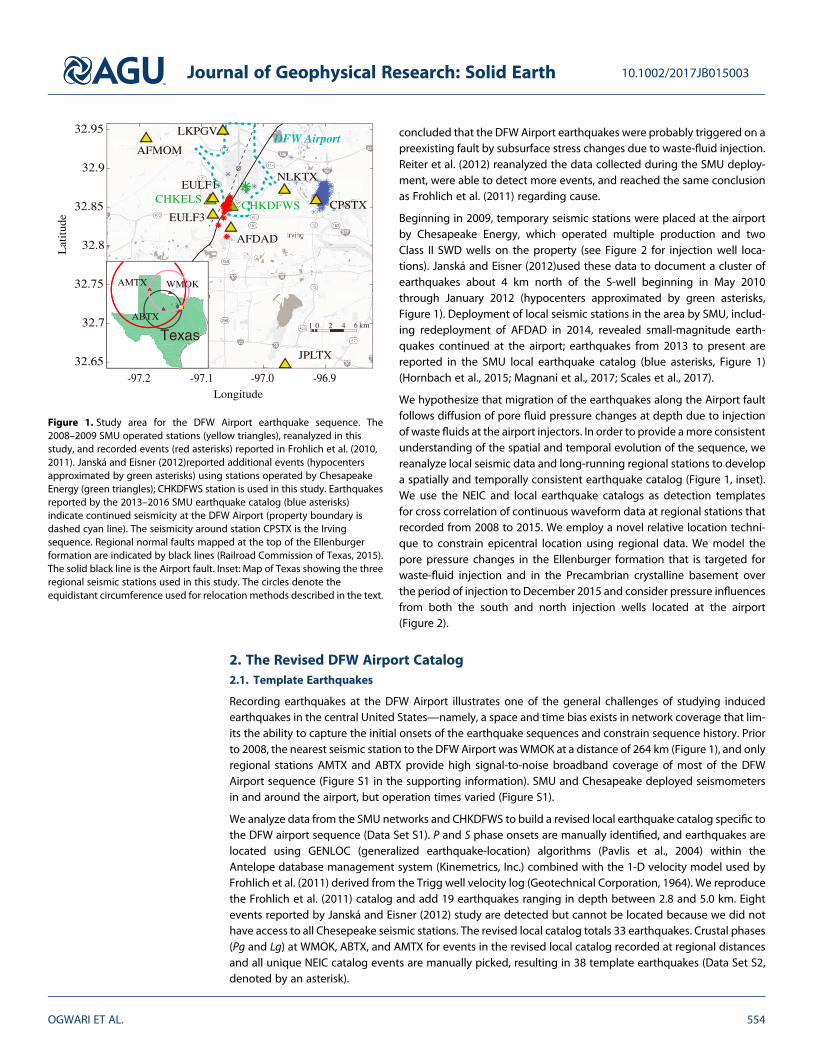
Figure 1. Study area for the DFW Airport earthquake sequence. The2008–2009 SMU operated stations (yellow triangles), reanalyzed in thisstudy, and recorded events (red asterisks) reported in Frohlich et al. (2010,2011). Janská and Eisner (2012)reported additional events (hypocentersapproximated by green asterisks) using stations operated by ChesapeakeEnergy (green triangles); CHKDFWS station is used in this study. Earthquakesreported by the 2013–2016 SMU earthquake catalog (blue asterisks)indicate continued seismicity at the DFW Airport (property boundary isdashed cyan line). The seismicity around station CPSTX is the Irvingsequence. Regional normal faults mapped at the top of the Ellenburgerformation are indicated by black lines (Railroad Commission of Texas, 2015).The solid black line is the Airport fault. Inset: Map of Texas showing the threeregional seismic stations used in this study. The circles denote theequidistant circumference used for relocation methods described in the text.
Journal of Geophysical Research: Solid Earth 10.1002/2017JB015003
OGWARI ET AL. 554
2.2. Matched-Filter Detection and Clustering Analysis
Lg phase templates are used in a matched-filter analysis applied to continuous horizontal data from WMOK,ABTX, and AMTX recorded between January 2008 and December 2015. The time window is set to 10 s beforeand 20 s after Lg onset, data are band-pass filtered between 0.5 and 5 Hz, and cross correlation is computedwithin the GISMO toolbox for MATLAB (Reyes & West, 2011). Initial detection of a new earthquake occurswhen both horizontal channels have identical trigger times and a correlation coefficient (CC) > 0.64. Thisminimum correlation threshold is set based on manual review that positive detections on the regional sta-tions are associated with P and/or S arrivals one at least one local station. However, we found the 0.64 CCthreshold still produces positive detections corresponding to events associated with the 2013–2014 Azle(Hornbach et al., 2015) and 2014 to present Irving-Dallas (Magnani et al., 2017) earthquake sequences. Inother words, at regional distances between 0.5 and 5 Hz, the DFW Airport earthquake Lg templates positivelycorrelate with Lg waves from earthquakes occurring at faults located 50 km west (Azle) and 12 km east(Irving-Dallas) of the Airport fault.
In order to distinguish the DFW Airport sequence from other sequences, we implement an additionalclustering analysis step using the CC coefficients. Spatial clusters are identified using a dendrogram-basedhierarchical pair-group clustering algorithm (Reyes & West, 2011, and references therein). Clusters ofhighly similar events are formed based on highest mean CC coefficient of the event or cluster pairs.We choose a correlation threshold of 0.85 based on visual inspection of the waveform attributes
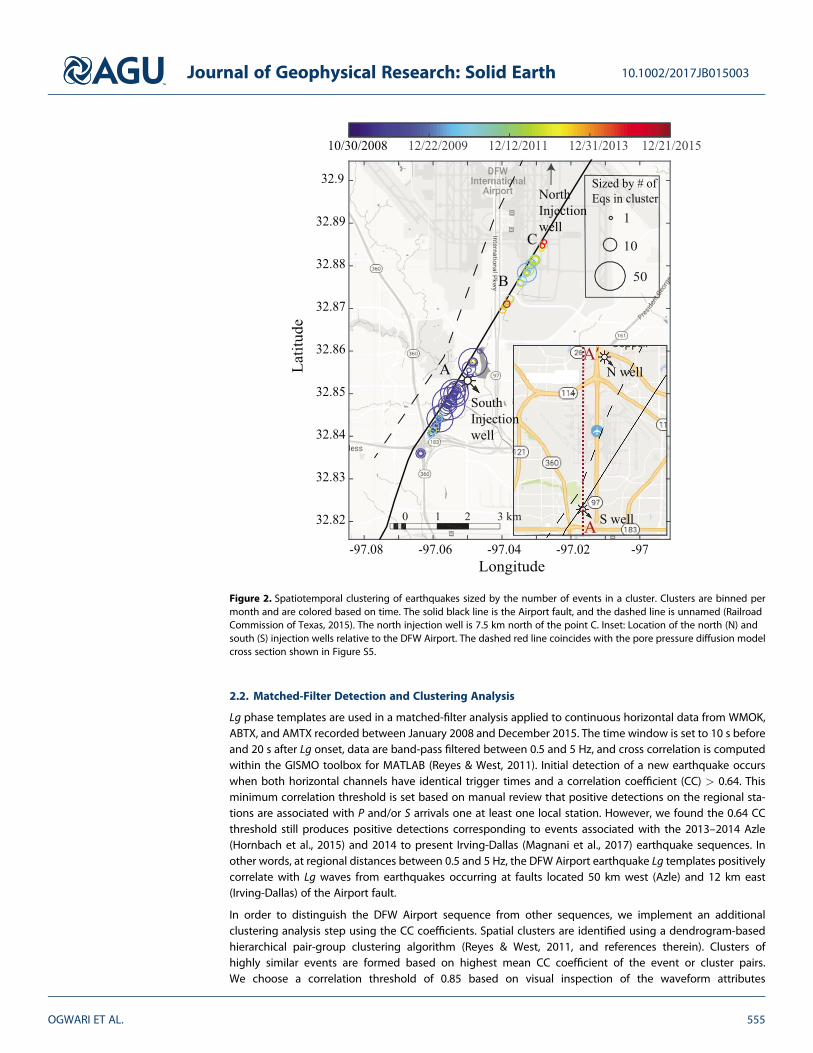
Figure 2. Spatiotemporal clustering of earthquakes sized by the number of events in a cluster. Clusters are binned permonth and are colored based on time. The solid black line is the Airport fault, and the dashed line is unnamed (RailroadCommission of Texas, 2015). The north injection well is 7.5 km north of the point C. Inset: Location of the north (N) andsouth (S) injection wells relative to the DFW Airport. The dashed red line coincides with the pore pressure diffusion modelcross section shown in Figure S5.
Journal of Geophysical Research: Solid Earth 10.1002/2017JB015003
OGWARI ET AL. 555
(Figure S2). Finally, we examine the clusters independently identified at the three regional stations to con-firm that the DFW Airport events separate from the Azle and Dallas-Irving sequences. This procedureresults in an additional 374 earthquakes, bringing the total data set to 412 events (Data Set S2). For earth-quakes identified via matched-filter approaches, we calculate a magnitude (M) based on the relativeamplitudes of the newly located events to those reported in the USGS catalog. The magnitude calculationis determined by regressing the logarithm of the peak horizontal amplitude at WMOK and ABTX sepa-rately (Figure S3) and applying the resulting function to the new events. For each event, magnitude pairsare compared the variance to ascertain the consistency in magnitude determination.
2.3. Earthquake Location Using Regional Differential Times
We apply a equal differential time (EDT) method as presented by Font et al. (2004) that is based on themaster station method by Zhou (1994). The technique has been modified to use a reference hypocenterin addition to a traditional reference station (here, WMOK) to take advantage of both station-pair andevent-pair differential time data. This enables location of earthquakes with undetermined origin timeand reduces location uncertainties by using prelocated reference events for calibration. Applying the con-cept of double-pair double difference location method (Guo & Zhang, 2017), for a given absolute locationof event i, the difference between the arrival time, A, of events i and j at stations l and k can be expressesas follows:
Ail � Aik� �� Ajl � Aj
k
� �¼ ∑3m¼1
∂Cil
∂xim� ∂Ci
k
∂xim
� �dxim � ∑3m¼1
∂Cjl
∂xjm� ∂Cj
k
∂xjm
!dxjm
!cal
¼ Dijlk
� �cal; (1)
where C is the calculated traveltime and Dcal is the calculated difference between the EDT surfaces forany event pair and station pair. The complete derivation of equation (1) is shown in Text S1. Due tothe limited number of station pairs for the DFW Airport sequence, the technique only results in relativeepicenters and depth cannot be sufficiently resolved. We therefore fix depth for all events to 4.4 kmbased on the mean depth in the local catalog and assume the event-pair differential times represent epi-central difference (see discussion in Text S1). Only earthquakes with Pg or Lg waves recorded at all threeregional stations, and hence having two equal station-pair differential times (Figure S4), can be relocatedrelative to the master hypocenter (Data Set S2, 111 earthquakes denoted with DF). We assign locations tothe remaining 302 very small earthquakes by taking advantage of the prior clustering analysis. Each of the111 relocated earthquakes participates in a cluster and is used to define the reference cluster location,then propagated to all unrelocated members of the cluster; if more than one relocated earthquake isassociated with a cluster, the mean epicenter of the relocated events is assigned as the reference clusterlocation (Data Set S2). Formal uncertainties are not calculated, but for clusters containing multiple relo-cated events, the largest epicentral difference is 0.52 km, which is taken as an estimate of locationuncertainty.
3. Pore Pressure Diffusion Model Methodology
We determine pore pressure effects in the subsurface generated by the injection of the two wells by devel-oping a 3-D pore pressure diffusion model that incorporates all first-order regional stratigraphy and mappedfaults (Figure S5). Themodel consists of a more permeable (5 × 10�14 m2) Ellenburger formation, where injec-tion occurs, situated between two comparatively less permeable formations—the Barnett shale(1 × 10�18 m2) above and granitic basement below (1 × 10�19 m2) (Hornbach et al., 2015; Loucks et al.,2009). Ellenburger thickness is defined by regional stratigraphy andwell logs. The fault width is approximatedto 10 m based on the approximate displacement in the regional faults that is in tens of meters (Magnani et al.,2017; Scales et al., 2017). Fault width has been found to be directly proportional to the fault displacement(Mitchell & Faulkner, 2009; Savage & Brodsky, 2011). The faults are assigned a uniform permeability in therange of 1 × 10�13 m2 and 1 × 10�14 m2 to test the influence of permeability of the fault and theEllenburger on pore pressure diffusion in the basement (Figure S6). The upper margin of fault permeabilityis set higher than the surrounding country rock to define a critically stressed fault (Barton et al., 1995) whilethe lower margin defines a sealed fault.
Journal of Geophysical Research: Solid Earth 10.1002/2017JB015003
OGWARI ET AL. 556
We compute the 3-D numerical model using MODFLOW-2005, a modular finite-difference code developedat the USGS that implements the partial differential equation of groundwater flow as (Harbaugh, 2005)
∂∂x
Kxx∂h∂x
� þ ∂∂y
Kyy∂h∂y
� þ ∂∂z
Kzz∂h∂z
� ¼ Ss
∂h∂t
�W; (2)
where Kxx, Kyy, and Kzz are the hydraulic conductivity values along the x, y, and z coordinate axis with thedimensions of length (L) divided by time (T), h is the hydraulic potential head (L), Ss is the specific storage(L�1) herein assigned as 7.3 × 10�6 m�1 (Hornbach et al., 2015), andW is the volumetric flux per unit volume(T�1). The model domain is 40 × 40 km in the horizontal plane with the surface grid discretization varyingbetween approximately 10 m in proximity of the injection wells and the main faults, to approximately150 m near the model boundaries with layer thickness discretization of 200–400 m. The model top is setto ground surface, while the base of the model is defined at 8 km (Figure S5). Flow across the lateral modelboundaries is simulated via head-dependent flux boundaries. We define the injection interval for northerninjector well (N-well) and the southern injector well (S-well) from 3,636 to 3,938 m and 3,124 to 4,184 mrespectively, based on the reported interval depths provided by the Railroad Commission of Texas H-10reports (see Text S2). Wastewater disposal at the south well began in September 2008 and averaged approxi-mately 50,000 m3 per month until August 2009 when the well was shut in. At the north well, injection beganin November 2007; peak monthly rates of 68,000 m3 per month were achieved in March 2008; since 2009injection rates have decreased and were at about 10,000 m3 per month at the end of 2015. We run the modelfor a 9 year period starting September 2007 and test the influence of hydrological properties of theEllenburger and the faults (see Figure S6).
4. Results4.1. Earthquake Location
Seismicity begins on 30 November 2008 southwest of the S-well and migrates northeast of the well over thenext 7 years (Figure 2). Detectable events occur in discrete clusters in time and space rather than continu-ously. The first cluster, consisting of 192 recorded earthquakes (the largest a mblg 2.8), occurs near point Abetween 30 October and 5 November 2008 and within 1 km of the S-well. Most events during this periodare located SW of the S-well where the spatial density of seismicity is more than double that of the areaNE of the well. The next earthquake clusters occur on 20 November 2008 (Frohlich et al., 2011), 26December 2008, and between 15 and19 May 2009. The first 7 months of seismic activity account for ~80%of the earthquakes in the expanded DFW Airport catalog, with all events located within 1 km of the S-well.
Starting 24 May 2010, however, the earthquakes migrate ~2 km to the northeast (point B in Figure 2) beforereoccurring again in October and November 2010 at the southern edge of the fault section where the firstcluster was located (point A). For each of these clusters, earthquakes align along the same fault system(Railroad Commission of Texas, 2015) but at greater distances from the injector site and the 2008 earthquakecluster. In September 2012, the area between the S-well and point B (~1.5 km to the northeast) experiencesseismicity, indicating continued seismicity northeast of the well. The largest event in the sequence reportedin the NEIC catalog asmblg 3.4 occurs on 30 September 2012 and is located midway between points B and C.By July 2015, the earthquakes have occurred along ~80% of the ~6 km long fault with the latest events (red inFigure 2) recorded by the SMU ZW network. Although all earthquakes generally occur in clusters, seismicityrates drop after May 2010, averaging 1 event per month compared to the 23 events per month in2008–2009 period.
4.2. Magnitude-Frequency Distribution
Earthquake magnitudes range from 0.5 to 3.4, and the expanded DFW Airport catalog exhibits a magnitudeof completeness (Mc) of 1.9 determined using the maximum curvature algorithm (Wiemer &Wyss, 2000). Thecatalog is dominated by the initial 2 months of earthquakes located within 1 km of the S-well that are char-acterized by low magnitudes (M < 2) (Figure 3). We therefore also analyze the first 2 months of seismicityseparately from the rest of the catalog. The first 2 months have a convex-type distribution due to deficiencyof larger earthquakes (M > 2.8) reported in the later period. On this data set we apply an upper-truncatedpower law (Utsu, 1978) with amagnitude bin size of 0.1 to determine the b value. The upper-truncated powerlaw describes a convex-type distribution of magnitude frequency where the linear Gutenberg-Richter
Journal of Geophysical Research: Solid Earth 10.1002/2017JB015003
OGWARI ET AL. 557
relationship does not fit the data set. For the later period and the entiredata set, we compute b values using the maximum-likelihood method(Aki, 1965; Bender, 1983) with a magnitude bin size of 0.1 (Figure 3),though we recognize that the total number of earthquakes is low for thisstatistical approach. The catalog exhibits a time-variant b value distribu-tion. The initial 2 months of the sequence has Mc of 1.8 and a b value of1.43 with σ = 0.0461 and a truncation magnitude of M = 2.75. Truncationmagnitude is defined herein as the maximum magnitude within a dataset. The remainder of the catalog has a Mc of 1.9 and a b value of 1.17 withσ = 0.1129. The b value is 1.3 for the entire data set with σ = 0.0709. The bvalues are consistent with the 1.3 estimate by Frohlich et al. (2011) basedon analysis of the initial 8 months of seismicity and the b value estimate of1.1 reported by Janská and Eisner (2012) based on earthquakes occurringbetween October 2009 and January 2012.
4.3. Pore Pressure Diffusion
We analyze model-predicted pore pressure change in the basement(4.4 km depth) at three areas along the fault based on the spatiotemporalmigration of seismicity. We present pore pressure change (Figure 4)around the well (point A) where the DFW Airport earthquakes initiate in2008, around the location of the May 2010 earthquakes (point B), and atthe northern edge of the seismicity (point C). Pore pressure increase alongthe faults in the basement occurs at varying rates depending on the dis-tance from the injection point, rate and timing of injection, and the
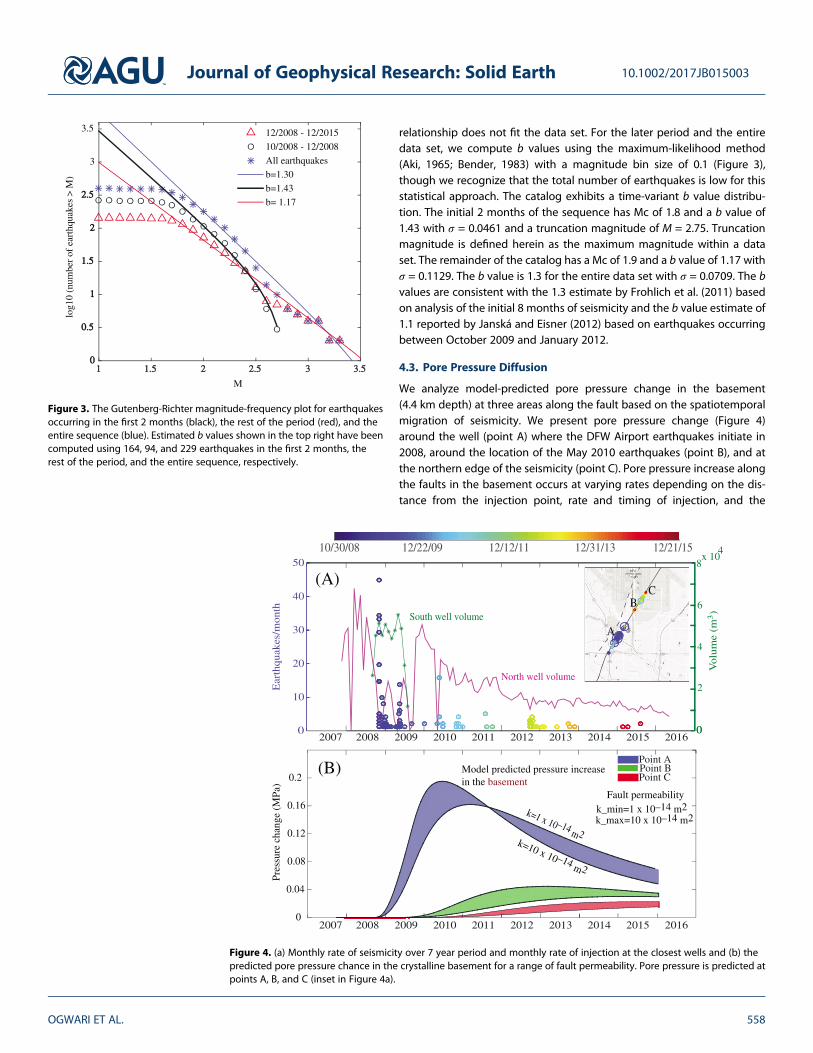
Figure 3. The Gutenberg-Richter magnitude-frequency plot for earthquakesoccurring in the first 2 months (black), the rest of the period (red), and theentire sequence (blue). Estimated b values shown in the top right have beencomputed using 164, 94, and 229 earthquakes in the first 2 months, therest of the period, and the entire sequence, respectively.
Point A
Point C
Pres
sure
cha
nge
(MPa
)
Model predicted pressure increasein the basement
k=1 x 10–14 m2k=10 x 10–14 m2
Fault permeability
Point B
k_min=1 x 10–14 m2k_max=10 x 10–14 m2
2008 2009 2010 2011 2012 2013 2014 2015 20160
10
20
30
40
50
0
8x 10
4
0
10/30/08 12/22/09 12/12/11 12/31/13 12/21/15
Ear
thqu
akes
/mon
th
Vol
ume
(m3)South well volume
North well volume
(A)
(B)
0
0.04
0.08
0.12
0.16
0.2
2007
6
4
2
A
C
2008 2009 2010 2011 2012 2013 2014 2015 20162007
B
Figure 4. (a) Monthly rate of seismicity over 7 year period and monthly rate of injection at the closest wells and (b) thepredicted pore pressure chance in the crystalline basement for a range of fault permeability. Pore pressure is predicted atpoints A, B, and C (inset in Figure 4a).
Journal of Geophysical Research: Solid Earth 10.1002/2017JB015003
OGWARI ET AL. 558
hydraulic permeability of the fault, where modeling indicates most of the pressure change is channeled. Thepore pressure increases at a higher rate around the injection point and the rate reduces with distance fromthe point of injection but shows the most significant change in pressure between the fault and the surround-ing country rock. Pore pressure increases faster and peaks higher in the more permeable fault with a fasterdecay rate than in the less permeable fault. For the permeability range defined on the fault, pore pressurechange around the S-well is 0.0008–0.0012 MPa at the start of seismicity and peaks between 0.18 and0.2 MPa approximately 2–2.5 years after start of injection in the S-well. At points B and C, the pore pressurepeak range is 0.03–0.044 MPa and 0.016–0.022 MPa, respectively, with pressures peaking 4.5 to 6.5 years(point B) and over 7 years (point C) after S-well injection begins.
5. Discussion
DFW Airport earthquakes begin in late October 2008 and extend through August 2015. Analysis of the regio-nal data at WMOK and AMTX indicates no earthquakes greater than magnitude 1.8 occurred within the basinbetween 1 January and 29 October 2008. We successful identify events reported by previous studies (e.g.,Frohlich et al., 2011; Janská & Eisner, 2012) and additionally expand the total number of reported earthquakesby nearly three times through incorporation of additional stations and template-matching approaches. Theexpanded DFW Airport catalog is a more complete data set that allows us to analyze the spatiotemporal evo-lution of seismicity on the Airport fault.
5.1. SW to NE Earthquake Migration
Spatiotemporal migration of earthquakes away from the injection point in a postinjection period is notunique to DFW Airport sequence. Such migration has previously been observed in the enhanced geothermalfield of Basel, Switzerland, but on a smaller temporal (days) and spatial (×100m) scale (Bachmann et al., 2011).One interpretation of migrating seismicity is that it indicates propagation of the triggering process along aseismogenic fault that is favorably oriented. The duration and the area of influence of postinjection seismicityis partly dependent on the diffusivity of the host formation andmagnitude of increased pore pressure. Similarto the DFW Airport seismicity, Hsieh and Bredehoeft (1981) documented seismic activity associated withinjection at the Rocky Mountain Arsenal to have continued at least 7 years following shut-in. Within14 months of the shut-in at the Rocky Mountain Arsenal, the Denver area experienced three Mw > 5 events,which were, in fact, the largest events of that sequence. Another comparable case is the Castor project inSpain, where the largest event (Mw 4.3) occurred about 2 months into the postinjection period (Gaite et al.,2016). Similarly, the largest event of the DFW Airport sequence, a mblg 3.4, occurred 3 years after injectionceased at S-well. Even though the duration of injection was shorter at the DFW Airport than at the RockyMountain Arsenal, the DFW Airport sequence continued for at least 6 years since injection at the south wellceased. In both instance, high rates of injection over short time periods (days to months) induced earth-quakes that continued years after injection ceased. Seismicity can be attributed to continued pressurediffusion along critically stressed faults combined with low diffusivity of the crystalline basement. This impliesthat even very brief periods of injection (months), as opposed to years as in the cases of Rocky MountainArsenal can result in years of seismicity in a region.
Not all cases of induced seismicity with a documented well shut-in have produced their largest event in theirpostinjection period. The Guy-Greenbrier Arkansas sequence had its largest event during its injection periodand, as in the Castor project, the postinjection seismic activity is constrained within the coinjection activezone (Horton, 2012).
5.2. Time-Dependent Magnitude-Frequency Relationship
The Gutenberg-Richter relationship has characteristic truncation magnitude observed from other studies ofinduced seismicity. The DFW Airport sequence has a truncation magnitude of 2.75 during the first 2 monthsof seismicity with the rest of the period having a maximummagnitude of 3.4. In Basel, Bachmann et al. (2011)found that the coinjection period exhibited characteristically lower truncation magnitude (~2) compared tothe postinjection data (~3). Similar truncation magnitude differences were observed in Castor, Spain (Cescaet al., 2014). This characteristic lower coinjection truncation magnitude has been attributed to the an unpro-portionally high rate of small earthquakes during the injection period (Segall & Lu, 2015). An increasedproportion of smaller earthquakes was also observed in Guy-Greenbrier sequence during wastewater
Journal of Geophysical Research: Solid Earth 10.1002/2017JB015003
OGWARI ET AL. 559
injection (Ogwari et al., 2016). In the three cases, the events producing lower truncation magnitude werelocated within hundreds of meters from the injection well where pressure is highest.
We postulate the lack of higher-magnitude events near the S-well during the initial period of injection is dueto high-rate pore pressure increase. The rate of pressurization in a high-rate injection well is highest near theinjection point and decreases with distance farther from the injection point. Higher pressurization rates havebeen found to lead to higher breakdown pressure in hydraulic fracturing process (Haimson & Zhao, 1991),which in turn have produced inversely proportional fracture lengths (Stoeckhert et al., 2015). Since themoment release of an earthquake is a function of the fault area, higher pressurization rates induce microse-isms that are constrained within the region of pressurization. The inverse implies that lower pressurizationrates could effectively distribute pore pressure increases over a larger area, thereby subjecting multiple faultsor a larger area on any given fault to the equal rates of pore pressure increase. Increasing pore pressure over alarger fault area could trigger relatively larger events on an already critically stressed fault.
The initial first 2 months of seismicity for the DFW Airport sequence produces a b value of 1.43, similar to thefirst 2 months of the Guy-Greenbrier sequence where the earthquakes were concentrated within 1 km radiusof the injection well (Mousavi et al., 2017). The overall b value of 1.3 is in the range values documented inenhanced geothermal systems (Albaric et al., 2014; Bachmann et al., 2011; Baria et al., 1999; Häring et al.,2008) where injection occurs at elevated pressures. However, it remains higher than values reported in otherwastewater disposal cases (Ake et al., 2005; Justinic et al., 2013; Ogwari et al., 2016) and lower than thoserecorded in hydraulic fracturing processes (Vermylen & Zoback, 2011; Zhou et al., 2013). At the later period,the b value reduces toward a unit value as experienced in postinjection period of the Basel sequence(Bachmann et al., 2011), an indication of low-rate pore pressure change.
5.3. Pore Pressure Diffusion
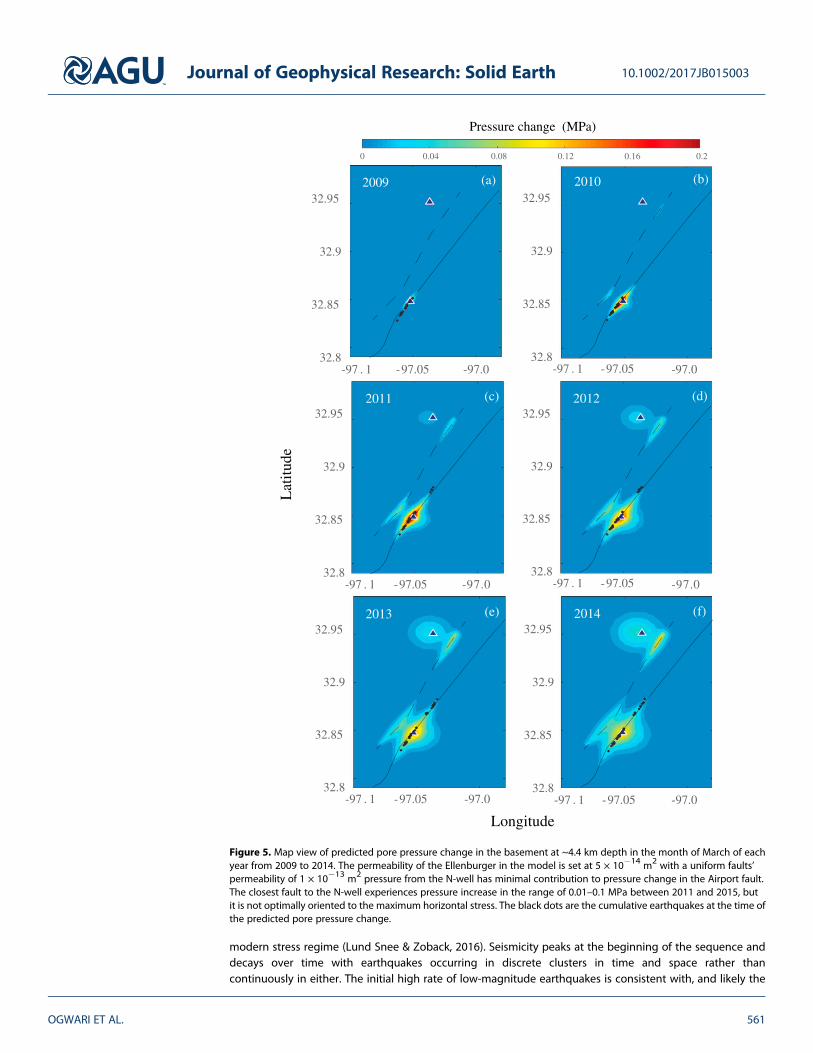
A combination of injection well proximity to a fault and fault orientation plays a major role in inducing theDFW Airport earthquakes. For the N-well, our modeling suggests that the ~3 km offset distance from theactive fault and lower injection pressure limits pressure communication to the crystalline basement and thusproduces no spatially associated earthquakes. The N-well operation starts 10months earlier than the S-well ata comparable rate but at less than half the injection pressure. Although injection at N-well continued at adecreasing rate over the duration of seismicity, the spatiotemporal occurrence of earthquakes fits the mod-eled pressure diffusion primarily contributed by the S-well (Figures 5 and S6). The nearest documented fault(~1 km) to the N-well is subparallel to the maximum horizontal stress, which is oriented at ~N020°E in theFWB (Lund Snee & Zoback, 2016). The orientation and location of this nearest fault is not consistent withthe location of seismicity but is optimally oriented for failure only from latitude N32.86 to N32.835. The bendin the Airport fault SE of the S-well results in an unfavorable orientation relative to the maximum horizontalstress, which explains the absence of continued SE migration during and after injection.
On the other hand, injection at a similar rate in the S-well over a short period near a critically stress fault leadsto earthquakes occurring over 7 years. Once the pore pressure has been elevated in the crystalline basement,the pressure decay and diffusion is dependent on the diffusivity in the basement. Over time, pore pressurescontinue to gradually increase away from the injection point at a lower rate and absolute value. Inducingearthquakes on a critically stressed fault may take as little as 0.001 MPa pressure increase (Rothert &Shapiro, 2007). The modeled pore pressure results for the range of permeabilities used are at least 1 orderof magnitude higher than the Rothert and Shapiro (2007) lower boundary and consistent with the range pre-dicted at similar induced seismicity sites in Texas (Hornbach et al., 2015, 2016). Thus, first-order modelingresults indicate seismicity occurring northeast of the S-well along years after injection represents a plausibleexplanation for these earthquakes.
6. Conclusions
The Dallas-Fort Worth Airport earthquakes have continued to occur since the first recorded event on 31October 2008. A combination of template matching, hierarchical clustering, and differential traveltimes haveproduced 412 earthquake epicenters that generally migrate from SW to NE over time, over 80% of a 6 kmlong fault. Earthquakes have migrated away from the S-well in both direction along the fault with time; how-ever, more seismicity has occurred toward the northeast, where the fault is best oriented for failure in the
Journal of Geophysical Research: Solid Earth 10.1002/2017JB015003
OGWARI ET AL. 560
modern stress regime (Lund Snee & Zoback, 2016). Seismicity peaks at the beginning of the sequence anddecays over time with earthquakes occurring in discrete clusters in time and space rather thancontinuously in either. The initial high rate of low-magnitude earthquakes is consistent with, and likely the
Figure 5. Map view of predicted pore pressure change in the basement at ~4.4 km depth in the month of March of eachyear from 2009 to 2014. The permeability of the Ellenburger in the model is set at 5 × 10�14 m2 with a uniform faults’permeability of 1 × 10�13 m2 pressure from the N-well has minimal contribution to pressure change in the Airport fault.The closest fault to the N-well experiences pressure increase in the range of 0.01–0.1 MPa between 2011 and 2015, butit is not optimally oriented to the maximum horizontal stress. The black dots are the cumulative earthquakes at the time ofthe predicted pore pressure change.
Journal of Geophysical Research: Solid Earth 10.1002/2017JB015003
OGWARI ET AL. 561
result of, elevated high-rate changes in injection pressure, similar to enhanced geothermal systems. Porepressure modeling indicates that the S-well, though injecting for only 12 months but at high volume andrates in close proximity to a near critically stressed fault, causes spatiotemporal pressure changes into thecrystalline basement most consistent with seismicity migration along the Airport fault. The modeling sug-gests that the high rate and volume S-well is the primary driver of seismicity and that the low- tomoderate-rate injector to the north (the N-well) has had less effect on pore pressures within the basement.We conclude that it is therefore possible to induce small-magnitude earthquakes on a critically stressed faultover a longer time period (7 years) and farther distances (6 km) than previously documented in the FWB, evenwhen the causative well is no longer injecting. The unfavorable orientation of the Airport fault south of thesequence limits migration of earthquakes to the SW. The observation that such a short period (12 months)of high injection triggers years of earthquakes is important as it suggests that even limited injection at highvolumes and rates can lead to years of fault reactivation that extends several kilometers away.
ReferencesAke, J., Mahrer, K., O’Connell, D., & Block, L. (2005). Deep-injection and closely monitored induced seismicity at Paradox Valley, Colorado.
Bulletin of the Seismological Society of America, 95(2), 664–683. https://doi.org/10.1785/0120040072Aki, K. (1965). Maximum likelihood estimate of b in the formula log(N)=a�bM and its confidence limits. Bulletin. Earthquake Research Institute,
University of Tokyo, 43, 237–239.Albaric, J., Oye, V., Langet, N., Hasting, M., Lecomte, I., Iranpour, K., … Reid, P. (2014). Monitoring of induced seismicity during the first
geothermal reservoir stimulation at Paralana, Australia. Geothermics, 52, 120–131. https://doi.org/10.1016/j.geothermics.2013.10.013Bachmann, C. E., Wiemer, S., Woessner, J., & Hainzl, S. (2011). Statistical analysis of the induced Basel 2006 earthquake sequence: Introducing
a probability-based monitoring approach for Enhanced Geothermal Systems. Geophysical Journal International, 186(2), 793–807. https://doi.org/10.1111/j.1365-246X.2011.05068.x
Baria, R., Baumgärtner, J., Gérard, A., Jung, R., & Garnish, J. (1999). European HDR research programme at Soultz-sous-Forêts (France)1987–1996. Geothermics, 28(4-5), 655–669. https://doi.org/10.1016/S0375-6505(99)00036-X
Barton, C. A., Zoback, M. D., & Moos, D. (1995). Fluid flow along potentially active faults in crystalline rock. Geology, 23(8), 683–686. https://doi.org/10.1130/0091-7613(1995)023%3C0683:FFAPAF%3E2.3.CO;2
Bender, B. (1983). Maximum likelihood estimation of b values for magnitude grouped data. Bulletin of the Seismological Society of America,73(3), 831–851.
Bommer, J. J., Crowley, H., & Pinho, R. (2015). A risk-mitigation approach to the management of induced seismicity. Journal of Seismology,19(2), 623–646. https://doi.org/10.1007/s1095
Cesca, S., Grigoli, F., Heimann, S., González, A., Buforn, E., Maghsoudi, S.,… Dahm, T. (2014). The 2013 September–October seismic sequenceoffshore Spain: A case of seismicity triggered by gas injection? Geophysical Journal International, 198(2), 941–953. https://doi.org/10.1093/gji/ggu172
Ellsworth, W. L. (2013). Injection-induced earthquakes. Science, 341(6142), 1225942. https://doi.org/10.1126/science.1225942Font, Y., Kao, H., Lallemand, S., Liu, C. S., & Chiao, L. Y. (2004). Hypocentre determination offshore of eastern Taiwan using the maximum
intersection method. Geophysical Journal International, 158(2), 655–675. https://doi.org/10.1111/j.1365-246X.2004.02317.xFrohlich, C. (2012). Two-year survey comparing earthquake activity and injection-well locations in the Barnett Shale, Texas. Proceedings of the
National Academy of Sciences of the United States of America, 109(35), 13,934–13,938. https://doi.org/10.1073/pnas.1207728109Frohlich, C., & Davis, S. D. (2002). Texas earthquakes (Vol. 2). University of Texas Press.Frohlich, C., Potter, E., Hayward, C., & Stump, B. (2010). Dallas-Fort Worth earthquakes coincident with activity associated with natural gas
production. The Leading Edge, 29(3), 270–275. https://doi.org/10.1190/1.3353720Frohlich, C., Hayward, C., Stump, B., & Potter, E. (2011). The Dallas–Fort Worth earthquake sequence: October 2008 through May 2009. Bulletin
of the Seismological Society of America, 101(1), 327–340. https://doi.org/10.1785/0120100131Frohlich, C., DeShon, H., Stump, B., Hayward, C., Hornbach, M., & Walter, J. I. (2016). A historical review of induced earthquakes in Texas.
Seismological Research Letters, 87(4), 1022–1038. https://doi.org/10.1785/0220160016Gaite, B., Ugalde, A., Villaseñor, A., & Blanch, E. (2016). Improving the location of induced earthquakes associated with an underground
gas storage in the Gulf of Valencia (Spain). Physics of the Earth and Planetary Interiors, 254, 46–59. https://doi.org/10.1016/j.pepi.2016.03.006
Geotechnical Corporation (1964). Deep-hole site report, Trigg no. 1, Dallas County, Texas, Geotechnical Corporation Technical Report 64–100.Guo, H., & Zhang, H. (2017). Development of double-pair double difference earthquake location algorithm for improving earthquake loca-
tions. Geophysical Journal International, 208(1), 333–348. https://doi.org/10.1093/gji/ggw397Haimson, B. C., & Zhao, Z. (1991). Effect of borehole size and pressurization rate on hydraulic fracturing breakdown pressure. In J.-C. Roegiers
(Ed.), Rock mechanics as a multidisciplinary science (pp. 191–199). Rotterdam: Balkema.Harbaugh, A. W. (2005). MODFLOW-2005, the US Geological Survey modular ground-water model: The ground-water flow process (p. 6-A16).
Reston, VA: US Department of the Interior, US Geological Survey.Häring, M. O., Schanz, U., Ladner, F., & Dyer, B. C. (2008). Characterisation of the Basel 1 enhanced geothermal system. Geothermics, 37(5),
469–495. https://doi.org/10.1016/j.geothermics.2008.06.002Hornbach, M. J., DeShon, H. R., Ellsworth, W. L., Stump, B. W., Hayward, C., Frohlich, C., … Luetgert, J. H. (2015). Causal factors for seismicity
near Azle, Texas. Nature Communications, 6, 6728. https://doi.org/10.1038/ncomms7728Hornbach, M. J., Jones, M., Scales, M., DeShon, H. R., Magnani, M. B., Frohlich, C., … Layton, M. (2016). Ellenburger wastewater injection and
seismicity in North Texas. Physics of the Earth and Planetary Interiors, 261, 54–68. https://doi.org/10.1016/j.pepi.2016.06.012Horton, S. (2012). Disposal of hydrofracking waste fluid by injection into subsurface aquifers triggers earthquake swarm in central Arkansas
with potential for damaging earthquake. Seismological Research Letters, 83(2), 250–260. https://doi.org/10.1785/gssrl.83.2.250Hsieh, P. A., & Bredehoeft, J. D. (1981). A reservoir analysis of the Denver earthquakes: A case of induced seismicity. Journal of Geophysical
Research, 86(B2), 903–920. https://doi.org/10.1029/JB086iB02p00903
Journal of Geophysical Research: Solid Earth 10.1002/2017JB015003
OGWARI ET AL. 562
AcknowledgmentsWaveforms from SMU operated net-works are archived at the IRIS DataManagement Center underInternational Federation of DigitalSeismic Network (FDSN) 2008-2009 X9(doi:10.7914/SN/X9_2008) and FDSN2013-2017 ZW (doi:10.7914/SN/ZW_2013). WMOK, AMTX, and ABTX arearchived at IRIS under U.S. NationalSeismic Network (doi:10.7914/SN/US) orTransportable Array (doi:10.7914/SN/TA). We thank Cliff Frohlich and BrianStump for critical reviews of early ver-sion of the manuscript. We also thankthe Associate Editor and two anon-ymous reviewers for their commentsand suggestions, which helped tostrongly improve the manuscript qual-ity. Research and data collection waspartially supported by United StatesGeological Survey Earthquake HazardsProgram Cooperative AgreementG15C00141 and G16AC00247 to H. R. D.and through the support of internalSMU funds.
Janská, E., & Eisner, L. (2012). Ongoing seismicity in the Dallas-Fort Worth area. The Leading Edge, 31(12), 1462–1468. https://doi.org/10.1190/tle31121462.1
Justinic, A. H., Stump, B., Hayward, C., & Frohlich, C. (2013). Analysis of the Cleburne, Texas, earthquake sequence from June 2009 to June2010. Bulletin of the Seismological Society of America, 103(6), 3083–3093. https://doi.org/10.1785/0120120336
Loucks, R. G., Reed, R. M., Ruppel, S. C., & Jarvie, D. M. (2009). Morphology, genesis, and distribution of nanometer-scale pores in siliceousmudstones of the Mississippian Barnett Shale. Journal of Sedimentary Research, 79(12), 848–861. https://doi.org/10.2110/jsr.2009.092
Lund Snee, J. E., & Zoback, M. D. (2016). State of stress in Texas: Implications for induced seismicity. Geophysical Research Letters, 43,10,208–10,214. https://doi.org/10.1002/2016GL070974
Magnani, M. B., Blanpied, M. L., DeShon, H. R., & Hornbach, M. J. (2017). Discriminating between natural vs. induced seismicity from long-termdeformation history of intraplate faults. Science Advances, 3(11), e1701593. https://doi.org/10.1126/sciadv.1701593
Mitchell, T. M., & Faulkner, D. R. (2009). The nature and origin of off-fault damage surrounding strike-slip fault zones with a wide range ofdisplacements: A field study from the Atacama fault system, northern Chile. Journal of Structural Geology, 31(8), 802–816. https://doi.org/10.1016/j.jsg.2009.05.002
Mousavi, S. M., Ogwari, P. O., Horton, S. P., & Langston, C. A. (2017). Spatio-temporal evolution of frequency-magnitude distribution andseismogenic index during initiation of induced seismicity at Guy-Greenbrier, Arkansas. Physics of the Earth and Planetary Interiors, 267,53–66. https://doi.org/10.1016/j.pepi.2017.04.005
Ogwari, P. O., Horton, S. P., & Ausbrooks, S. (2016). Characteristics of induced/triggered earthquakes during the startup phase of theGuy–Greenbrier earthquake sequence in North–Central Arkansas. Seismological Research Letters, 87(3), 620–630. https://doi.org/10.1785/0220150252
Pavlis, G. L., Vernon, F., Harvey, D., & Quinlan, D. (2004). The generalized earthquake-location (GENLOC) package: An earthquake-locationlibrary. Computers & Geosciences, 30(9-10), 1079–1091. https://doi.org/10.1016/j.cageo.2004.06.010
Railroad Commission of Texas (2015). Oil and Gas Docket No. 09-0296410, considering whether operation of the Enervest Operating LLC, iscausing or contributing to seismic activity in the vicinity of Reno, Parker County, Texas: TXO Exhibit No. 18. Retrieved from http://www.rrc.state.tx.us/media/31023/09-96411-sho-pfd.pdf
Reiter, D., Leidig, M., Yoo, S. H., & Mayeda, K. (2012). Source characteristics of seismicity associated with underground wastewater disposal: Acase study from the 2008 Dallas-Fort Worth earthquake sequence. The Leading Edge, 31(12), 1454–1460. https://doi.org/10.1190/tle31121454.1
Reyes, C. G., & West, M. E. (2011). The waveform suite: A robust platform for manipulating waveforms in MATLAB. Seismological ResearchLetters, 82(1), 104–110. https://doi.org/10.1785/gssrl.82.1.104
Rothert, E., & Shapiro, S. A. (2007). Statistics of fracture strength and fluid-induced microseismicity. Journal of Geophysical Research, 112,B04309. https://doi.org/10.1029/2005JB003
Rubinstein, J. L., & Mahani, A. B. (2015). Myths and facts on wastewater injection, hydraulic fracturing, enhanced oil recovery, and inducedseismicity. Seismological Research Letters, 86(4), 1060–1067. https://doi.org/10.1785/0220150067
Savage, H. M., & Brodsky, E. E. (2011). Collateral damage: Evolution with displacement of fracture distribution and secondary fault strands infault damage zones. Journal of Geophysical Research, 116, B03405. https://doi.org/10.1029/2010JB007665
Scales, M., DeShon, H. R., Magnani, M. B., Walter, J. I., Quinones, L., & Pratt, T. L. (2017). A decade of induced slip on the causative fault of theMw 4.0 2015 Venus earthquake, northeast Johnson County, Texas. Journal of Geophysical Research: Solid Earth, 122, 7879–7894. https://doi.org/10.1002/2017JB014460
Segall, P., & Lu, S. (2015). Injection-induced seismicity: Poroelastic and earthquake nucleation effects. Journal of Geophysical Research: SolidEarth, 120, 5082–5103. https://doi.org/10.1002/2015JB012060
Stoeckhert, F., Molenda, M., Brenne, S., & Alber, M. (2015). Fracture propagation in sandstone and slate—Laboratory experiments, acousticemissions and fracture mechanics. Journal of Rock Mechanics and Geotechnical Engineering, 7(3), 237–249. https://doi.org/10.1016/j.jrmge.2015.03.011
Utsu, T. (1978). Estimation of parameter values in formulas for magnitude-frequency relation of earthquake occurrence. Zisin (Journal of theSeismological Society of Japan), Series, 2(31), 367–382.
Vermylen, J., & Zoback, M. D. (2011). Hydraulic fracturing, microseismic magnitudes, and stress evolution in the Barnett Shale, Texas, USA. InSPE Hydraulic Fracturing Technology Conference. Society of Petroleum Engineers, doi:https://doi.org/10.2118/140507-MS
Walsh, F. R., & Zoback, M. D. (2015). Oklahoma’s recent earthquakes and saltwater disposal. Science Advances, 1(5), e1500195. https://doi.org/10.1126/sciadv.1500195
Weingarten, M., Ge, S., Godt, J. W., Bekins, B. A., & Rubinstein, J. L. (2015). High-rate injection is associated with the increase in US mid-continent seismicity. Science, 348(6241), 1336–1340. https://doi.org/10.1126/science.aab1345
Wiemer, S., & Wyss, M. (2000). Minimum magnitude of completeness in earthquake catalogs: Examples from Alaska, the western UnitedStates, and Japan. Bulletin of the Seismological Society of America, 90(4), 859–869. https://doi.org/10.1785/0119990114
Zhou, H. W. (1994). Rapid three-dimensional hypocentral determination using a master station method. Journal of Geophysical Research,99(B8), 15,439–15,455. https://doi.org/10.1029/94JB00934
Zhou, R., Huang, G. D., Snelling, P., Thornton, M. P., & Mueller, M. (2013). Magnitude calibration for microseismic events from hydraulicfracture monitoring. In SEG Technical Program Expanded Abstracts 2013 (pp. 2145–2149). Houston, TX: Society of ExplorationGeophysicists, 22–27 September. https://doi.org/10.1190/segam2013-0648.1
Journal of Geophysical Research: Solid Earth 10.1002/2017JB015003
OGWARI ET AL. 563