The Daft.ie Rental Report · The Daft.ie Rental Report An analysis of recent trends in the Irish...
14
The Daft.ie Rental Report An analysis of recent trends in the Irish rental market 2016 Q1 Introduction by Ronan Lyons, Economist at Trinity College Dublin and author of the Daft.ie Report
Transcript of The Daft.ie Rental Report · The Daft.ie Rental Report An analysis of recent trends in the Irish...

The Daft.ie Rental ReportAn analysis of recent trends in the Irish rental market 2016 Q1
Introduction by Ronan Lyons, Economist at Trinity
College Dublin and author of the Daft.ie Report

The figures in this latest Daft.ie rental report show an increase in the average rent nationwide of 9.3% in the year to March 2016.
This represents a remarkably persistent rate of
rental inflation, with the average annual increase
rents since the second quarter of 2014 being 9.6%.
Granted, there has been a shift in the composition
of rental inflation, away from Dublin and towards
the other cities in the rest of Leinster in particular.
Nonetheless, there is the danger that this very
high rate of inflation becomes something of a
new normal. There is nothing normal – or indeed
sustainable – about inflation in rents of 10%. This is
particularly the case, given that the rate of inflation
in the wider economy is close to 0%. In other
words, if this situation persisted into the future, the
average household would have to devote an ever
greater share of its income, just to pay its rent.
There rule of thumb about a household’s
accommodation costs is that their accommodation
costs, in the form of rents or mortgage payments,
should not be greater than roughly one third of
the household’s disposable income. If we take
a household whose gross income is €45,000,
this leaves them with roughly €3,000 a month in
their after-tax disposable income. This means a
household earning €45,000 should not be spending
more than €1,000 a month on its rent. It is worth
noting that an income of €45,000 is in the upper
half of the income distribution, in other words this
household is on an above-average income.
However, if we look at the rental market, we can see
a growing disconnect between household incomes
and prevailing rents. West Dublin, for example, is
typically viewed as one of the most affordable parts
of the rental market in the capital. The average rent
for a three-bedroom house in West Dublin, though,
has increased from less than €900 in 2012 to more
than €1,300 in early 2016. In other words, it is
becoming increasingly difficult, even for those with
above-average incomes, to house themselves in or
near the capital.
We know that investors involved in renting out
accommodation require a net yield, or annual
financial return, of at least 5%. The maths of finance
means that once we know this, we can scale up
from the monthly rent to construction costs.
A monthly rent of €1300 converts into upfront
construction cost of €260,000. And this brings up a
second and more worrying point about the supply
of homes in Ireland.
Even if the developer required land for free, it
is not possible to build either a two-bedroom
apartment or a three bed semi-detached house
in Ireland currently for €260,000. So even before
We need to escape10% rental inflation being the new normal
Ronan LyonsEconomist at Trinity College Dublin and authorof the Daft.ie Report.
The Daft.ie Rental Price Report – 2016 Q1 | 2

Ireland’s dysfunctional land market has its impact on
affordability – and therefore on the volume of new
construction – there is a fundamental problem in
construction costs in Ireland being too high relative
to our own incomes.
The formation, at last, of the new government
hopefully marks the start of a new chapter in
terms of housing policy in Ireland. It is widely
acknowledged that, along with healthcare and
possibly water charges, housing is the most pressing
issue facing the new government. However, housing
policy currently is dispersed across a number
of departments and government organisations,
including the Property Services Regulatory
Authority, the Central Bank, the Housing Agency, the
Department of Social Protection, the Department of
Finance, the Department of the Environment, and
local authorities, as well as others.
This means that no one government minister turns
up at Cabinet meetings with housing consistently
number one on their agenda, as happens routinely
with health and education. Therefore, a new Housing
Minister, or someone with similar responsibilities,
could bring much-needed focus to housing policy in
Ireland. And as the first item on their agenda needs
to be a government sponsored audit of construction
costs for the most common types of homes built in
Ireland.
I would suggest this involves establishing in a
transparent way the details of the costs involved
in building a two-bedroom apartment, a three-
bedroom semi-detached home, and four bed
bungalow. This should be done not only for Ireland
but also for other countries, including Northern
Ireland, England, Denmark, and other economic
peers. Comparisons should also be made to Ireland
10, 20 and 30 years ago, to see the impact on costs
of changes in regulations and specifications.
By doing this, and by doing it in a transparent way
that can be improved by industry experts or others
if better evidence emerges, this will firstly create a
consensus on what has been a contentious issue of
the past two years, namely the level of construction
costs. Perhaps more importantly, this will also
identify the three, four or five policy measures
that would have the greatest impact in bringing
construction costs back in line with real incomes.
Until this measure is taken, there will be no clarity in
housing policy around supply and more importantly
there will to be an increasing mismatch between the
new demand for homes of all forms, including rental,
and their supply.
3 | The Daft.ie Rental Price Report – 2016 Q1
9.3%(Year-on-year change in the average asking rent)
Rents Rise Nationally
2006 2007 2008 2009 2010 2011 2012 2013 2014 2015 2016
January 117.5 127.5 137.4 119.9 103.2 99.8 99.0 102.0 109.7 120.4 132.1
February 117.8 131.5 137.4 116.8 102.3 100.6 98.8 103.3 111.1 121.7 132.4
March 118.4 133.4 135.8 114.3 102.1 100.3 98.6 103.4 112.3 122.2 133.7
April 119.4 133.8 135.2 112.3 101.5 100.2 98.4 104.0 113.3 123.2 134.5
May 120.4 134.5 133.4 110.6 101.1 100.1 98.8 103.7 114.6 124.2
June 121.4 135.1 132.0 109.1 100.5 99.8 99.0 103.6 115.3 125.2
July 122.0 135.3 132.1 107.7 100.4 100.3 99.6 105.4 116.3 126.7
August 123.2 136.4 131.2 107.3 101.4 100.3 100.6 106.7 117.3 128.3
September 124.9 136.9 130.3 106.2 101.1 99.7 100.7 107.4 118.3 129.6
October 125.6 136.6 127.5 104.7 100.7 99.1 100.7 107.9 118.8 130.2
November 125.0 136.4 123.3 102.6 99.1 98.3 101.5 107.7 119.6 129.7
December 126.9 136.6 120.1 101.7 98.9 98.7 101.2 108.3 119.9 130.5
Daft.ie National Rental Index(2012 average = 100)
The Daft.ie Rental Price Report – 2016 Q1 | 4
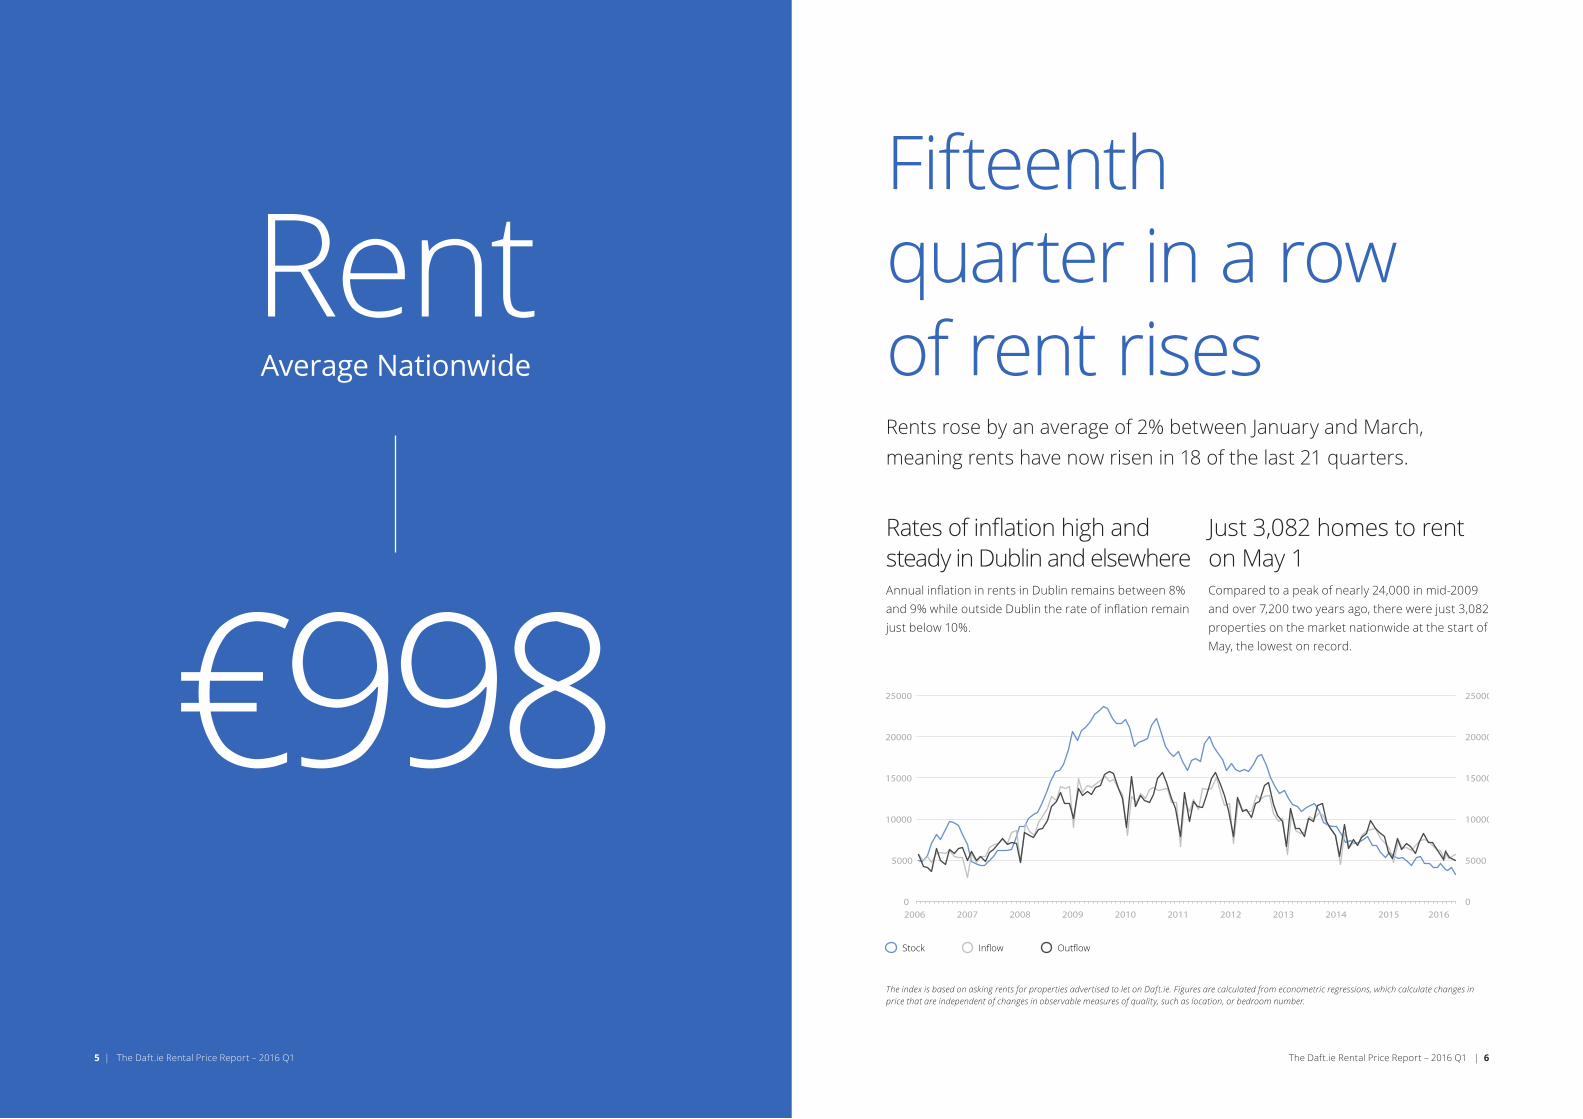
€998
Average Nationwide
RentFifteenth quarter in a row of rent risesRents rose by an average of 2% between January and March, meaning rents have now risen in 18 of the last 21 quarters.
The Daft.ie Rental Price Report – 2016 Q1 | 65 | The Daft.ie Rental Price Report – 2016 Q1
Stock of properties to rent on Daft.ie (start of month) and flow of new properties to rent, 2006-2015
Stock Inflow Outflow
0
5000
10000
15000
20000
25000
0
5000
10000
15000
20000
25000
2006 2007 2008 2009 2010 2011 2012 2013 2014 2015 2016
Rates of inflation high and steady in Dublin and elsewhereAnnual inflation in rents in Dublin remains between 8% and 9% while outside Dublin the rate of inflation remain just below 10%.
Just 3,082 homes to rent on May 1Compared to a peak of nearly 24,000 in mid-2009 and over 7,200 two years ago, there were just 3,082 properties on the market nationwide at the start of May, the lowest on record.
The index is based on asking rents for properties advertised to let on Daft.ie. Figures are calculated from econometric regressions, which calculate changes in price that are independent of changes in observable measures of quality, such as location, or bedroom number.

Cork City
Limerick City
Galway City
Waterford City
NationwideAverage rent by region and Y-on-Y change
DublinAverage rent and Y-on-Y change
The Daft.ie Rental Price Report – 2016 Q1 | 87 | The Daft.ie Rental Price Report – 2016 Q1
Rents up 34% since their lowest point in 2011The average rent nationwide has risen by just over one third
since bottoming out in late 2011 and is just 3% below the
early 2008 peak. In Dublin, rents are now an average of 1.3%
above their previous peak and in Dublin 4 and Dublin 16 are
5% above levels recorded eight years ago. In other cities, rents
are on average 1.2% below previous highs, while outside the
cities, the average rent remains 9.1% below peak levels.
North County€1,225 | 10.2%
North City€1,365 | 9.3%
City Centre€1,455 | 8.3%
South City€1,581 | 8.7%
South County€1,663 | 7.4%
West County€1,301 | 11.0%
C€713 9.7%
G€618 8.4%
L€641 6.3%
MH€926 14.8%
KE€994 11.2%
WW€1,029 7.4%
LH€835 14.2%
LD€496 12.2%
OY€646 10.1%
LS€659 10.8%
CW€692 6.5%
KK€706 8.5% WX
€626 6.3%
W€639 5.3%
KY€623 2.8%
CE€607 8.5%
T€629 4.2%
MO€557 3.6%
RN€537 5.1%
SO€575 3.8%
LM€473 6.6%
DL€519 3.2%
CN€555 12.5%
MN€593 8.5%
WH€671 11.3%
€900 | 12.7%
€792 | 12.4%
€1,003 | 16.0%
€687 | 11.1%

The Daft.ie Rental Price Report – 2016 Q1 | 109 | The Daft.ie Rental Price Report – 2016 Q1
LEIN
STER
MU
NST
ERCO
NN
ACH
TU
LSTE
R
OTH
ER C
ITIE
S
1 bed apartment 2 bed house 3 bed house 4 bed house 5 bed house
Dublin 1 €1,187 8.6% €1,443 7.4% €1,771 7.9% €2,188 7.1% €2,584 6.9%
Dublin 2 €1,407 3.5% €1,668 5.1% €2,017 5.8% €2,397 6.1% €3,297 18.3%
Dublin 3 €1,200 9.4% €1,397 8.1% €1,606 7.5% €1,875 8.6% €2,044 12.5%
Dublin 4 €1,548 9.0% €1,768 8.0% €2,066 6.5% €2,326 9.0% €2,468 8.7%
Dublin 5 €1,034 8.2% €1,191 9.5% €1,470 8.1% €1,579 7.2% €1,754 10.7%
Dublin 6 €1,297 5.2% €1,494 6.4% €1,844 5.1% €1,980 4.2% €2,200 7.6%
Dublin 6W €1,210 8.2% €1,393 9.5% €1,719 8.1% €1,846 7.2% €2,051 10.7%
Dublin 7 €1,099 7.0% €1,266 8.3% €1,563 6.9% €1,678 6.0% €1,864 9.4%
Dublin 8 €1,160 7.9% €1,336 9.2% €1,649 7.8% €1,770 6.9% €1,967 10.3%
Dublin 9 €1,057 7.4% €1,217 8.6% €1,502 7.3% €1,613 6.4% €1,792 9.8%
Dublin 10 €907 5.3% €1,044 6.5% €1,289 5.2% €1,384 4.3% €1,538 7.7%
Dublin 11 €990 9.4% €1,140 10.6% €1,407 9.2% €1,511 8.3% €1,679 11.8%
Dublin 12 €1,037 9.2% €1,194 10.5% €1,474 9.1% €1,583 8.2% €1,758 11.7%
Dublin 13 €1,062 9.8% €1,223 11.1% €1,510 9.6% €1,621 8.7% €1,801 12.2%
Dublin 14 €1,197 7.8% €1,379 9.1% €1,702 7.7% €1,827 6.8% €2,030 10.2%
Dublin 15 €956 7.9% €1,101 9.2% €1,359 7.8% €1,459 6.9% €1,621 10.3%
Dublin 16 €1,095 6.5% €1,261 7.7% €1,557 6.3% €1,671 5.5% €1,857 8.8%
Dublin 17 €908 -1.9% €1,045 -0.7% €1,290 -2.0% €1,385 -2.8% €1,539 0.3%
Dublin 18 €1,197 9.4% €1,379 10.7% €1,701 9.3% €1,827 8.4% €2,030 11.9%
Dublin 20 €1,036 9.4% €1,193 10.6% €1,472 9.2% €1,581 8.3% €1,756 11.8%
Dublin 22 €938 9.9% €1,081 11.2% €1,334 9.8% €1,432 8.9% €1,591 12.4%
Dublin 24 €955 8.9% €1,100 10.2% €1,358 8.8% €1,458 7.9% €1,620 11.3%
North Co Dublin €910 9.0% €1,047 10.3% €1,293 8.9% €1,388 8.0% €1,542 11.5%
South Co Dublin €1,253 6.4% €1,443 7.7% €1,781 6.3% €1,913 5.4% €2,125 8.8%
West Dublin €935 10.1% €1,077 11.3% €1,329 9.9% €1,427 9.0% €1,586 12.5%
Cork City €748 15.8% €848 17.3% €1,047 15.8% €1,124 14.9% €1,249 18.6%
Galway City €651 12.1% €738 13.6% €911 12.1% €978 11.2% €1,087 14.8%
Limerick City €571 12.2% €648 13.6% €799 12.2% €858 11.3% €953 14.8%
Waterford City €500 11.1% €567 12.6% €699 11.2% €751 10.2% €834 13.8%
1 bed apartment 2 bed house 3 bed house 4 bed house 5 bed house
Meath €641 12.1% €743 13.8% €917 12.3% €985 11.4% €1,095 15.0%
Kildare €696 8.7% €807 10.3% €996 8.9% €1,069 8.0% €1,188 11.5%
Wicklow €733 5.0% €850 6.5% €1,049 5.2% €1,127 4.3% €1,252 7.7%
Louth €579 11.1% €671 12.8% €829 11.3% €890 10.4% €989 14.0%
Longford €352 9.6% €408 11.2% €504 9.8% €541 8.9% €601 12.4%
Offaly €442 7.6% €513 9.2% €633 7.8% €680 6.9% €755 10.4%
Westmeath €464 8.8% €539 10.4% €665 9.0% €714 8.1% €793 11.6%
Laois €453 7.8% €526 9.4% €649 8.0% €697 7.1% €774 10.5%
Carlow €466 3.9% €541 5.4% €667 4.0% €717 3.2% €796 6.5%
Kilkenny €479 5.9% €556 7.5% €686 6.1% €737 5.3% €819 8.7%
Wexford €431 3.9% €500 5.5% €617 4.1% €663 3.3% €737 6.6%
Waterford Co €427 5.8% €493 5.6% €609 4.3% €654 3.5% €726 6.8%
Kerry €416 3.0% €481 2.9% €594 1.6% €638 0.7% €709 4.0%
Cork Co €485 10.1% €560 9.9% €691 8.5% €742 7.6% €825 11.1%
Clare €409 9.2% €473 9.1% €584 7.7% €627 6.8% €696 10.2%
Limerick Co €421 7.2% €486 7.0% €600 5.7% €645 4.8% €716 8.2%
Tipperary €421 4.6% €487 4.5% €601 3.1% €645 2.3% €717 5.6%
Galway Co €448 7.6% €500 7.8% €617 6.4% €663 5.6% €737 9.0%
Mayo €406 2.6% €453 2.8% €560 1.5% €601 0.6% €668 3.9%
Roscommon €387 3.9% €432 4.1% €533 2.8% €572 2.0% €636 5.2%
Sligo €429 1.9% €479 2.1% €591 0.8% €634 0.0% €705 3.2%
Leitrim €365 4.5% €407 4.7% €502 3.4% €539 2.6% €599 5.9%
Donegal €381 2.1% €425 2.3% €525 1.0% €564 0.1% €626 3.4%
Cavan €405 11.6% €452 11.8% €558 10.4% €600 9.5% €666 13.0%
Monaghan €442 7.7% €493 8.0% €608 6.6% €653 5.7% €726 9.1%
DU
BLIN
Daft.ie Snapshot of Rents Nationwide What can I ask for? Can I afford it?Average monthly rents across Ireland (€), and annual change (%), 2016 Q1

The Daft.ie Rental Price Report – 2016 Q1 | 1211 | The Daft.ie Rental Price Report – 2016 Q1
LEIN
STER
MU
NST
ERCO
NN
ACH
TU
LSTE
R
OTH
ER C
ITIE
S
1 bed apartment 2 bed house 3 bed house 4 bed house 5 bed house
Dublin 1 8.7% -0.1% 7.0% 0.2% 6.2% 0.2% 5.1% -0.0% 5.0% 0.3%
Dublin 2 7.6% 1.4% 6.5% 0.7% 5.5% 0.5% 4.3% 0.2% 5.2% 1.2%
Dublin 3 7.0% 0.3% 5.8% 0.2% 4.7% 0.1% 3.4% 0.0% 3.0% 0.1%
Dublin 4 6.7% 0.9% 5.3% 0.3% 4.3% 0.2% 2.8% 0.1% 2.5% 0.1%
Dublin 5 7.6% 1.0% 6.9% 0.9% 5.6% 0.3% 3.6% -0.0% 3.4% 0.2%
Dublin 6 5.6% 0.7% 5.0% 0.7% 4.1% 0.2% 2.6% -0.0% 2.5% 0.2%
Dublin 6W 6.4% 0.8% 5.8% 0.7% 4.7% 0.2% 3.1% -0.0% 2.9% 0.2%
Dublin 7 7.9% 0.7% 7.1% 0.7% 5.8% 0.1% 3.7% -0.2% 3.5% 0.1%
Dublin 8 8.0% 0.6% 7.2% 0.6% 5.9% 0.0% 3.8% -0.2% 3.6% 0.1%
Dublin 9 7.4% 0.7% 6.8% 0.7% 5.5% 0.1% 3.5% -0.2% 3.4% 0.1%
Dublin 10 10.2% 0.4% 9.2% 0.4% 7.5% -0.3% 4.8% -0.5% 4.6% -0.1%
Dublin 11 9.4% 0.8% 8.5% 0.8% 6.9% 0.1% 4.5% -0.2% 4.2% 0.1%
Dublin 12 8.6% 1.0% 7.8% 0.9% 6.3% 0.3% 4.1% -0.1% 3.9% 0.2%
Dublin 13 7.4% 1.0% 6.7% 0.9% 5.4% 0.3% 3.5% -0.0% 3.3% 0.2%
Dublin 14 6.6% 0.7% 6.0% 0.7% 4.8% 0.2% 3.1% -0.1% 3.0% 0.2%
Dublin 15 8.7% 1.1% 7.9% 1.0% 6.4% 0.4% 4.1% -0.0% 3.9% 0.3%
Dublin 16 6.9% 1.1% 6.3% 1.0% 5.1% 0.4% 3.3% 0.1% 3.1% 0.3%
Dublin 17 9.4% 0.0% 8.5% 0.0% 6.9% -0.6% 4.5% -0.7% 4.2% -0.3%
Dublin 18 6.7% 1.1% 6.1% 1.0% 4.9% 0.5% 3.2% 0.1% 3.0% 0.3%
Dublin 20 8.3% 1.1% 7.5% 1.0% 6.1% 0.4% 3.9% 0.0% 3.7% 0.3%
Dublin 22 10.3% 0.9% 9.3% 0.9% 7.6% 0.1% 4.9% -0.2% 4.6% 0.1%
Dublin 24 9.9% 0.8% 9.0% 0.8% 7.2% 0.1% 4.7% -0.3% 4.4% 0.1%
North Co Dublin 8.1% 1.1% 7.4% 1.0% 6.0% 0.4% 3.9% -0.0% 3.7% 0.3%
South Co Dublin 5.9% 0.8% 5.4% 0.7% 4.4% 0.3% 2.8% 0.0% 2.7% 0.2%
West Dublin 8.4% 1.2% 7.7% 1.1% 6.2% 0.4% 4.0% 0.0% 3.8% 0.3%
Cork City 9.2% 0.6% 8.6% 0.1% 6.1% -0.4% 3.8% -0.3% 3.4% 0.1%
Galway City 8.9% 0.3% 8.3% -0.2% 5.9% -0.6% 3.6% -0.5% 3.3% -0.1%
Limerick City 10.5% 0.1% 9.8% -0.5% 7.0% -0.9% 4.3% -0.7% 3.8% -0.2%
Waterford City 10.7% -0.0% 9.9% -0.6% 7.1% -1.0% 4.3% -0.7% 3.9% -0.2%
1 bed apartment 2 bed house 3 bed house 4 bed house 5 bed house
Meath 9.8% 1.0% 9.2% 0.6% 7.5% -0.2% 4.0% -0.0% 4.1% 0.3%
Kildare 9.8% 0.9% 9.2% 0.5% 7.4% -0.3% 4.0% -0.1% 4.1% 0.2%
Wicklow 8.2% 0.7% 7.7% 0.3% 6.2% -0.3% 3.4% -0.1% 3.4% 0.1%
Louth 10.1% 0.8% 9.5% 0.4% 7.7% -0.4% 4.2% -0.1% 4.2% 0.2%
Longford 12.2% 1.5% 11.4% 1.0% 9.3% -0.0% 5.0% 0.1% 5.1% 0.4%
Offaly 10.1% 1.1% 9.5% 0.7% 7.7% -0.2% 4.2% 0.0% 4.2% 0.3%
Westmeath 9.9% 0.7% 9.3% 0.3% 7.6% -0.5% 4.1% -0.2% 4.2% 0.1%
Laois 10.1% 0.5% 9.5% 0.1% 7.7% -0.6% 4.2% -0.3% 4.2% 0.0%
Carlow 10.6% 1.1% 9.9% 0.6% 8.1% -0.2% 4.4% -0.0% 4.4% 0.3%
Kilkenny 9.1% 0.5% 8.5% 0.1% 6.9% -0.6% 3.7% -0.2% 3.8% 0.0%
Wexford 9.1% 0.3% 8.6% -0.1% 6.9% -0.7% 3.8% -0.3% 3.8% -0.1%
Waterford Co 8.1% -0.2% 7.7% -0.4% 6.2% -0.7% 3.3% -0.4% 3.3% -0.1%
Kerry 8.9% -0.2% 8.5% -0.4% 6.8% -0.8% 3.6% -0.4% 3.7% -0.1%
Cork Co 9.1% -0.0% 8.7% -0.3% 7.0% -0.7% 3.7% -0.3% 3.8% -0.1%
Clare 9.1% -0.2% 8.7% -0.4% 7.0% -0.8% 3.7% -0.4% 3.8% -0.1%
Limerick Co 10.1% 0.1% 9.6% -0.1% 7.7% -0.6% 4.1% -0.3% 4.1% 0.0%
Tipperary 9.7% 0.1% 9.3% -0.1% 7.4% -0.6% 4.0% -0.3% 4.0% 0.0%
Galway Co 10.1% -0.4% 10.1% -0.6% 8.2% -1.2% 4.3% -0.4% 4.2% -0.0%
Mayo 10.3% -0.1% 10.4% -0.3% 8.4% -0.9% 4.4% -0.3% 4.3% 0.1%
Roscommon 12.0% -0.3% 12.0% -0.6% 9.8% -1.3% 5.1% -0.5% 5.0% 0.0%
Sligo 11.3% 0.2% 11.3% 0.0% 9.1% -0.7% 4.7% -0.2% 4.7% 0.2%
Leitrim 10.7% -1.0% 10.7% -1.2% 8.7% -1.8% 4.5% -0.8% 4.4% -0.3%
Donegal 9.8% -0.6% 9.9% -0.7% 8.0% -1.3% 4.2% -0.5% 4.1% -0.1%
Cavan 10.6% -0.4% 10.7% -0.6% 8.6% -1.2% 4.5% -0.5% 4.4% -0.0%
Monaghan 10.3% 0.1% 10.3% -0.1% 8.3% -0.8% 4.3% -0.3% 4.3% 0.2%
Average 8.9% 0.5% 8.5% 0.2% 7.0% -0.5% 4.0% -0.3% 3.9% 0.0%
DU
BLIN
Daft.ie Snapshot of YieldsThe yield is the ratio of annual rents to the price of the property. It is comparable to an interest rate and is frequently used as a measure of how healthy the property market is. Gross annual yields across Ireland (%), and year-on-year change (in percentage points), 2016 Q1.
NAT
ION
AL

The Daft.ie Rental Price Report – 2016 Q1 | 1413 | The Daft.ie Rental Price Report – 2016 Q1
OTH
ER C
ITIE
S
1 bed apartment 2 bed house 3 bed house 4 bed house 5 bed house
Mortgage (4.3%)
Mortgage+2%
Rent Mortgage (4.3%)
Mortgage+2%
Rent Mortgage (4.3%)
Mortgage+2%
Rent Mortgage (4.3%)
Mortgage+2%
Rent Mortgage (4.3%)
Mortgage+2%
Rent
Dublin 1 €686 €858 €1,187 €1,039 €1,299 €1,443 €1,450 €1,814 €1,771 €2,151 €2,690 €2,188 €2,619 €3,276 €2,584
Dublin 2 €930 €1,164 €1,407 €1,293 €1,618 €1,668 €1,853 €2,318 €2,017 €2,825 €3,533 €2,397 €3,201 €4,004 €3,297
Dublin 3 €864 €1,081 €1,200 €1,218 €1,523 €1,397 €1,711 €2,141 €1,606 €2,787 €3,486 €1,875 €3,488 €4,363 €2,044
Dublin 4 €1,173 €1,467 €1,548 €1,674 €2,094 €1,768 €2,449 €3,063 €2,066 €4,127 €5,162 €2,326 €5,034 €6,296 €2,468
Dublin 5 €689 €862 €1,034 €873 €1,092 €1,191 €1,332 €1,666 €1,470 €2,211 €2,765 €1,579 €2,592 €3,241 €1,754
Dublin 6 €1,180 €1,475 €1,297 €1,494 €1,869 €1,494 €2,279 €2,851 €1,844 €3,782 €4,731 €1,980 €4,434 €5,546 €2,200
Dublin 6W €950 €1,188 €1,210 €1,203 €1,504 €1,393 €1,835 €2,295 €1,719 €3,045 €3,808 €1,846 €3,569 €4,464 €2,051
Dublin 7 €706 €884 €1,099 €895 €1,119 €1,266 €1,365 €1,707 €1,563 €2,265 €2,833 €1,678 €2,655 €3,321 €1,864
Dublin 8 €734 €918 €1,160 €930 €1,163 €1,336 €1,419 €1,774 €1,649 €2,354 €2,945 €1,770 €2,760 €3,452 €1,967
Dublin 9 €718 €898 €1,057 €909 €1,137 €1,217 €1,386 €1,734 €1,502 €2,301 €2,878 €1,613 €2,697 €3,374 €1,792
Dublin 10 €451 €564 €907 €571 €714 €1,044 €871 €1,090 €1,289 €1,446 €1,808 €1,384 €1,695 €2,120 €1,538
Dublin 11 €532 €666 €990 €674 €844 €1,140 €1,029 €1,287 €1,407 €1,707 €2,136 €1,511 €2,002 €2,503 €1,679
Dublin 12 €608 €761 €1,037 €770 €963 €1,194 €1,175 €1,469 €1,474 €1,950 €2,439 €1,583 €2,286 €2,859 €1,758
Dublin 13 €728 €910 €1,062 €922 €1,153 €1,223 €1,406 €1,758 €1,510 €2,333 €2,918 €1,621 €2,735 €3,421 €1,801
Dublin 14 €918 €1,148 €1,197 €1,163 €1,454 €1,379 €1,773 €2,218 €1,702 €2,943 €3,681 €1,827 €3,450 €4,316 €2,030
Dublin 15 €554 €693 €956 €702 €877 €1,101 €1,070 €1,338 €1,359 €1,776 €2,221 €1,459 €2,082 €2,604 €1,621
Dublin 16 €802 €1,003 €1,095 €1,016 €1,270 €1,261 €1,549 €1,938 €1,557 €2,571 €3,216 €1,671 €3,014 €3,770 €1,857
Dublin 17 €489 €612 €908 €620 €775 €1,045 €945 €1,182 €1,290 €1,569 €1,962 €1,385 €1,839 €2,300 €1,539
Dublin 18 €903 €1,129 €1,197 €1,143 €1,430 €1,379 €1,744 €2,181 €1,701 €2,894 €3,620 €1,827 €3,393 €4,244 €2,030
Dublin 20 €632 €791 €1,036 €801 €1,001 €1,193 €1,221 €1,528 €1,472 €2,027 €2,535 €1,581 €2,376 €2,972 €1,756
Dublin 22 €461 €577 €938 €584 €730 €1,081 €891 €1,114 €1,334 €1,478 €1,849 €1,432 €1,733 €2,167 €1,591
Dublin 24 €490 €612 €955 €620 €776 €1,100 €946 €1,183 €1,358 €1,570 €1,963 €1,458 €1,840 €2,301 €1,620
North Co Dublin €564 €706 €910 €715 €894 €1,047 €1,091 €1,364 €1,293 €1,810 €2,264 €1,388 €2,122 €2,654 €1,542
South Co Dublin €1,065 €1,332 €1,253 €1,349 €1,687 €1,443 €2,057 €2,573 €1,781 €3,414 €4,270 €1,913 €4,002 €5,005 €2,125
West Dublin €560 €700 €935 €709 €886 €1,077 €1,081 €1,352 €1,329 €1,794 €2,244 €1,427 €2,103 €2,631 €1,586
Cork City €409 €512 €748 €497 €622 €848 €859 €1,075 €1,047 €1,510 €1,889 €1,124 €1,862 €2,328 €1,249
Galway City €370 €463 €651 €449 €562 €738 €777 €972 €911 €1,366 €1,708 €978 €1,684 €2,106 €1,087
Limerick City €276 €345 €571 €335 €419 €648 €579 €725 €799 €1,018 €1,274 €858 €1,255 €1,570 €953
Waterford City €237 €296 €500 €287 €360 €567 €407 €622 €699 €874 €1,093 €751 €1,077 €1,347 €834
DU
BLIN
To buy or to rent?Using the Daft.ie House Price and Rental reports, it is possible to calculate the average mortgage payment as well as the average rent, for properties around the country.Current mortgage repayments based off the following parameters: 4.3% variable mortgage, for a term of 30 years, with 85% LTV, while a figure is also given for the case wheremortgage rates rise by two percentage points. Average mortgage and rent payments compared, across Ireland, 2016 Q1.

The Daft.ie Rental Price Report – 2016 Q1 | 1615 | The Daft.ie Rental Price Report – 2016 Q1
ULS
TER
1 bed apartment 2 bed house 3 bed house 4 bed house 5 bed house
Mortgage (4.3%)
Mortgage+2%
Rent Mortgage (4.3%)
Mortgage+2%
Rent Mortgage (4.3%)
Mortgage+2%
Rent Mortgage (4.3%)
Mortgage+2%
Rent Mortgage (4.3%)
Mortgage+2%
Rent
Meath €329 €412 €641 €407 €509 €743 €619 €774 €917 €1,229 €1,538 €985 €1,342 €1,679 €1,095
Kildare €359 €450 €696 €445 €556 €807 €675 €845 €996 €1,342 €1,679 €1,069 €1,465 €1,833 €1,188
Wicklow €453 €567 €733 €561 €701 €850 €852 €1,065 €1,049 €1,692 €2,117 €1,127 €1,847 €2,311 €1,252
Louth €289 €362 €579 €358 €447 €671 €543 €680 €829 €1,080 €1,351 €890 €1,179 €1,474 €989
Longford €146 €183 €352 €181 €226 €408 €274 €343 €504 €545 €682 €541 €595 €744 €601
Offaly €221 €277 €442 €274 €342 €513 €416 €520 €633 €826 €1,033 €680 €902 €1,128 €755
Westmeath €236 €295 €464 €292 €365 €539 €443 €554 €665 €880 €1,101 €714 €961 €1,202 €793
Laois €226 €282 €453 €279 €349 €526 €424 €530 €649 €843 €1,054 €697 €920 €1,150 €774
Carlow €222 €277 €466 €274 €343 €541 €417 €521 €667 €828 €1,036 €717 €904 €1,131 €796
Kilkenny €267 €334 €479 €330 €413 €556 €501 €627 €686 €996 €1,246 €737 €1,087 €1,360 €819
Wexford €239 €299 €431 €295 €369 €500 €449 €561 €617 €891 €1,115 €663 €973 €1,217 €737
Waterford Co €267 €334 €427 €324 €405 €493 €497 €622 €609 €1,002 €1,253 €654 €1,102 €1,379 €726
Kerry €236 €295 €416 €286 €358 €481 €440 €550 €594 €886 €1,108 €638 €975 €1,219 €709
Cork Co €269 €336 €485 €326 €408 €560 €501 €626 €691 €1,009 €1,262 €742 €1,110 €1,388 €825
Clare €227 €284 €409 €275 €344 €473 €422 €528 €584 €851 €1,065 €627 €936 €1,171 €696
Limerick Co €211 €264 €421 €256 €320 €486 €393 €492 €600 €793 €991 €645 €872 €1,091 €716
Tipperary €219 €274 €421 €266 €332 €487 €408 €510 €601 €822 €1,028 €645 €904 €1,131 €717
Galway Co €224 €280 €448 €249 €311 €500 €379 €474 €617 €784 €981 €663 €882 €1,104 €737
Mayo €198 €248 €406 €221 €276 €453 €336 €421 €560 €696 €870 €601 €783 €979 €668
Roscommon €163 €204 €387 €181 €227 €432 €276 €345 €533 €571 €714 €572 €642 €803 €636
Sligo €192 €241 €429 €214 €268 €479 €326 €408 €591 €675 €844 €634 €759 €949 €705
Leitrim €173 €216 €365 €192 €240 €407 €293 €366 €502 €605 €757 €539 €681 €852 €599
Donegal €195 €244 €381 €217 €272 €425 €331 €414 €525 €685 €857 €564 €771 €964 €626
Cavan €192 €241 €405 €214 €268 €452 €326 €408 €558 €674 €843 €600 €759 €949 €666
Monaghan €217 €271 €442 €241 €302 €493 €368 €460 €608 €761 €952 €653 €856 €1,071 €726
LEIN
STER
MU
NST
ERCO
NN
ACH
T
To buy or to rent?Using the Daft.ie House Price and Rental reports, it is possible to calculate the average mortgage payment as well as the average rent, for properties around the country.Current mortgage repayments based off the following parameters: 4.3% variable mortgage, for a term of 30 years, with 85% LTV, while a figure is also given for the case where mortgage rates rise by two percentage points.Average mortgage and rent payments compared, across Ireland, 2016 Q1.

DublinRents in Dublin now 1.3% above their previous highs in 2007.
North CityAverage rent: €1,310Qtr-on-qtr change: 3.0%Year-on-year change: 9.3%Change from trough: 40.6%
City CentreAverage rent: €1,408Qtr-on-qtr change: 3.0%Year-on-year change: 9.8%Change from trough: 43.5%
South CityAverage rent: €1,520Qtr-on-qtr change: 3.0%Year-on-year change: 7.9%Change from trough: 39.0%
North CountyAverage rent: €1,178
Qtr-on-qtr change: 3.4%Year-on-year change: 11.1%Change from trough: 37.0%
West CountyAverage rent: €1,243
Qtr-on-qtr change: 3.5%Year-on-year change: 10.6%Change from trough: 38.0%
South CountyAverage rent: €1,604
Qtr-on-qtr change: 2.4%Year-on-year change: 7.2%
Change from trough: 34.8%
Dublin trends Q1 2016
Dublin City Centre North Dublin City South Dublin City North County Dublin South County Dublin West County Dublin
Q12006
Q12007
Q12008
Q12009
Q12010
Q12011
Q12012
Q12013
Q12014
Q12015
€1,800
€1,700
€1,600
€1,500
€1,400
€1,300
€1,200
€1,100
€1,000
€900
€800
Average house price by area, 2006-2016.
Q12016
The Daft.ie Rental Price Report – 2016 Q1 | 1817 | The Daft.ie Rental Price Report – 2016 Q1
West Dublin rents growing fastestFor the second quarter in a row, rents in West Dublin are rising faster than in other regions of the capital.
Supply reaches new losJust 1,100 properties were available to rent in the capital on May 1, a new record low for the series which started in 2006.
Room costs rise againRent-a-room costs per month rose by an average of 9% in the year to March, in line with the broader rental market.
Roughly 2% rise in rents in early 2016Across Dublin, rents rose by between 1.5% and 2.5% between January and March and are now nearly 9% higher than a year ago.
Double BedRENTAL AREAS
Dublin City CentreNorth Dublin CitySouth Dublin CityNorth Co. DublinSouth Co. DublinWest Co. Dublin
AVG. RENT
€ 563€ 453€ 487€ 405€ 481€ 383
YR/YR CHANGE
8.1%9.7%8.0%18.1%8.6%5.8%
AVG. RENT
€ 668€ 555€ 628€ 496€ 596€ 508
YR/YR CHANGE
6.2% 9.9%8.5%8.8%7.2%8.8%
Single Bed
Rent-a-Room Trends Q1 2016
North CityAverage rent: €1,365Qtr-on-qtr: 2.2%Year-on-year: 9.3%Change from trough: 46.7%
City CentreAverage rent: €1,455Qtr-on-qtr: 1.5%Year-on-year: 8.3%Change from trough: 48.2%
South CityAverage rent: €1,581Qtr-on-qtr: 2.2%Year-on-year: 8.7%Change from trough: 45.8%
North CountyAverage rent: €1,225
Qtr-on-qtr: 2.3%Year-on-year: 10.2%
Change from trough: 42.4%
West CountyAverage rent: €1,301
Qtr-on-qtr: 2.5%Year-on-year: 11.0%
Change from trough: 44.6%
South CountyAverage rent: €1,663
Qtr-on-qtr: 2.3%Year-on-year: 7.4%
Change from trough: 42.0%

LeinsterRents in Leinster just 5% below 2007 highs.
LouthAverage rent: €793Qtr-on-qtr change: 4.3%Year-on-year change: 13.3%Change from trough: 29.9%
MeathAverage rent: €878Qtr-on-qtr change: 4.4%Year-on-year change: 14.5%Change from trough: 35.9%
KildareAverage rent: €950Qtr-on-qtr change: 3.1%Year-on-year change: 11.3%Change from trough: 35.3%
WicklowAverage rent: €1,002Qtr-on-qtr change: 2.2%Year-on-year change: 8.1%Change from trough: 29.7%
WexfordAverage rent: €613Qtr-on-qtr change: 2.2%Year-on-year change: 5.3%Change from trough: 13.2%
LongfordAverage rent: €476
Qtr-on-qtr change: 3.5%Year-on-year change: 11.8%Change from trough: 18.0%
WestmeathAverage rent: €643
Qtr-on-qtr change: 3.5%Year-on-year change: 9.5%
Change from trough: 22.0%
OffalyAverage rent: €626
Qtr-on-qtr change: 3.6%Year-on-year change: 8.2%
Change from trough: 18.5%
LaoisAverage rent: €636
Qtr-on-qtr change: 3.3%Year-on-year change: 11.4%Change from trough: 26.3%
KilkennyAverage rent: €688
Qtr-on-qtr change: 2.8%Year-on-year change: 8.7%
Change from trough: 20.5%
CarlowAverage rent: €679
Qtr-on-qtr change: 2.3%Year-on-year change: 7.0%
From trough: 14.6%
Leinster trends Q1 2016
Dublin Commuter Counties West Leinster South-East Leinster
Q12006
Q12007
Q12008
Q12009
Q12010
Q12011
Q12012
Q12013
Q12014
Q12015
€1,100
€1,000
€900
€800
€700
€600
€500
€400
Average house price by area, 2006-2016.
Q12016
The Daft.ie Rental Price Report – 2016 Q1 | 2019 | The Daft.ie Rental Price Report – 2016 Q1
Softer increases in the South-EastThe smallest increases in rents in the last 12 months have been in counties Wicklow, Carlow and Wexford (between 6.3% and 7.4%).
Just 700 homes on the marketSlightly more than 700 homes were available to rent in Leinster on May 1st, the lowest figure on record since the series began in 2006.
Double-room rentals increase stronglyWhile single room costs increased by no more than 5% on average in the last year, double-room costs have increased by nearly 10%.
Rents in Meath and Louth again fastest growingFor the second quarter in a row, the biggest annual increases in rents in Leinster have been in Meath and Louth (above 14%).
Double BedRENTAL AREAS
Dublin Commuter CountiesWest LeinsterSouth East Leinster
AVG. RENT
€ 332€ 246€ 274
YR/YR CHANGE
4.7%0.5%
4.5%
AVG. RENT
€ 418€ 294€ 336
YR/YR CHANGE
10.0% 9.2%8.7%
Single Bed
Rent-a-Room Trends Q1 2016
LouthAverage rent: €835Qtr-on-qtr: 3.0%Year-on-year: 14.2%Change from trough: 36.8%
MeathAverage rent: €926Qtr-on-qtr: 3.5%Year-on-year: 14.8%Change from trough: 43.3%
KildareAverage rent: €994Qtr-on-qtr: 3.1%Year-on-year: 11.2%Change from trough: 41.5%
WicklowAverage rent: €1,029Qtr-on-qtr: 2.4%Year-on-year: 7.4%Change from trough: 33.2%
WexfordAverage rent: €626Qtr-on-qtr: 1.7%Year-on-year: 6.3%Change from trough: 15.5%
LongfordAverage rent: €496
Qtr-on-qtr: 3.1%Year-on-year: 12.2%
Change from trough: 23.0%
WestmeathAverage rent: €671
Qtr-on-qtr: 2.7%Year-on-year: 11.3%
Change from trough: 27.3%
OffalyAverage rent: €646
Qtr-on-qtr: 2.0%Year-on-year: 10.1%
Change from trough: 22.1%
LaoisAverage rent: €659
Qtr-on-qtr: 2.4%Year-on-year: 10.8%
Change from trough: 30.8%
KilkennyAverage rent: €706
Qtr-on-qtr: 2.1%Year-on-year: 8.5%
Change from trough: 23.7%
CarlowAverage rent: €692
Qtr-on-qtr: 1.5%Year-on-year: 6.5%
Change from trough: 16.7%

MunsterUrban-rural gap in Munster rent inflation once again.
TipperaryAverage rent: €629Qtr-on-qtr change: 1.7%Year-on-year change: 6.0%Change from trough: 11.5%
Limerick CityAverage rent: €761Qtr-on-qtr change: 6.1%Year-on-year change: 11.4%Change from trough: 25.1%
Waterford CountyAverage rent: €633Qtr-on-qtr change: 1.5%Year-on-year change: 7.1%Change from trough: 11.2%
Waterford CityAverage rent: €661Qtr-on-qtr change: 5.2%Year-on-year change: 9.6%Change from trough: 17.8%
ClareAverage rent: €591
Qtr-on-qtr change: 2.7%Year-on-year change: 7.1%
Change from trough: 12.2%
Limerick CountyAverage rent: €631
Qtr-on-qtr change: 1.9%Year-on-year change: 6.7%
Change from trough: 12.0%
KerryAverage rent: €623
Qtr-on-qtr change: 0.9%Year-on-year change: 4.8%
Change from trough: 13.7%
Cork CountyAverage rent: €691
Qtr-on-qtr change: 2.7%Year-on-year change: 10.2%Change from trough: 18.6%
Cork CityAverage rent: €950
Qtr-on-qtr change: 6.9%Year-on-year change: 13.5%Change from trough: 33.1%
Munster trends Q1 2016
Cork City Limerick City Waterford City Rest-of-Munster
Q12006
Q12007
Q12008
Q12009
Q12010
Q12011
Q12012
Q12013
Q12014
Q12015
Q12016
€1,100
€1,000
€900
€800
€700
€600
€500
€400
Average house price by area, 2006-2016.
The Daft.ie Rental Price Report – 2016 Q1 | 2221 | The Daft.ie Rental Price Report – 2016 Q1
More moderate inflation in rural countiesWhile urban rents have risen up to 40% in since their lowest point, increases in rural Munster remain far more modest, with rents up by 11.5% from their lowest point in Tipperary.
Just 700 homes on the market Fewer than 700 homes were available to rent in Munster on May 1st, the lowest figure since early 2006.
Urban room costs continue to riseThe monthly cost of renting a room in Munster rose strongly in the year to March, with double-digit gains in many urban segments.
City rents record strong growthAll three Munster cities saw double-digit increases in the year to March, with Cork rents now just 0.7% below their previous peak in 2007.
Double BedRENTAL AREAS
Cork City Centre Cork City Suburbs Cork Commuter Towns Limerick City Centre Limerick City Suburbs Waterford City Centre Rest of Munster
AVG. RENT
€ 348€ 337€ 328€ 278€ 271€ 265€ 242
YR/YR CHANGE
8.7%9.1%
12.3%13.0%
4.2%11.8%
4.2%
AVG. RENT
€ 450€ 414€ 390€ 337€ 297€ 299€ 277
YR/YR CHANGE
20.0%13.1%14.0%12.3%
5.7%7.6%2.0%
Single Bed
Rent-a-Room Trends Q1 2016
TipperaryAverage rent: €629Qtr-on-qtr: -0.5%Year-on-year: 4.2%Change from trough: 11.5%
Limerick CityAverage rent: €792Qtr-on-qtr: 1.9%Year-on-year: 12.4%Change from trough: 30.2%
Waterford CountyAverage rent: €639Qtr-on-qtr: 0.2%Year-on-year: 5.3%Change from trough: 12.3%
Waterford CityAverage rent: €687Qtr-on-qtr: 2.1%Year-on-year: 11.1%Change from trough: 22.4%
Cork CityAverage rent: €1,003
Qtr-on-qtr: 2.6%Year-on-year: 16.0%
Change from trough: 40.5%
ClareAverage rent: €607
Qtr-on-qtr: 0.8%Year-on-year: 8.5%
Change from trough: 15.2%
Limerick CountyAverage rent: €641
Qtr-on-qtr: 0.4%Year-on-year: 6.3%
Change from trough: 13.7%
KerryAverage rent: €623
Qtr-on-qtr: -0.2%Year-on-year: 2.8%
Change from trough: 13.8%
Cork CountyAverage rent: €713
Qtr-on-qtr: 1.1%Year-on-year: 9.7%
Change from trough: 22.3%
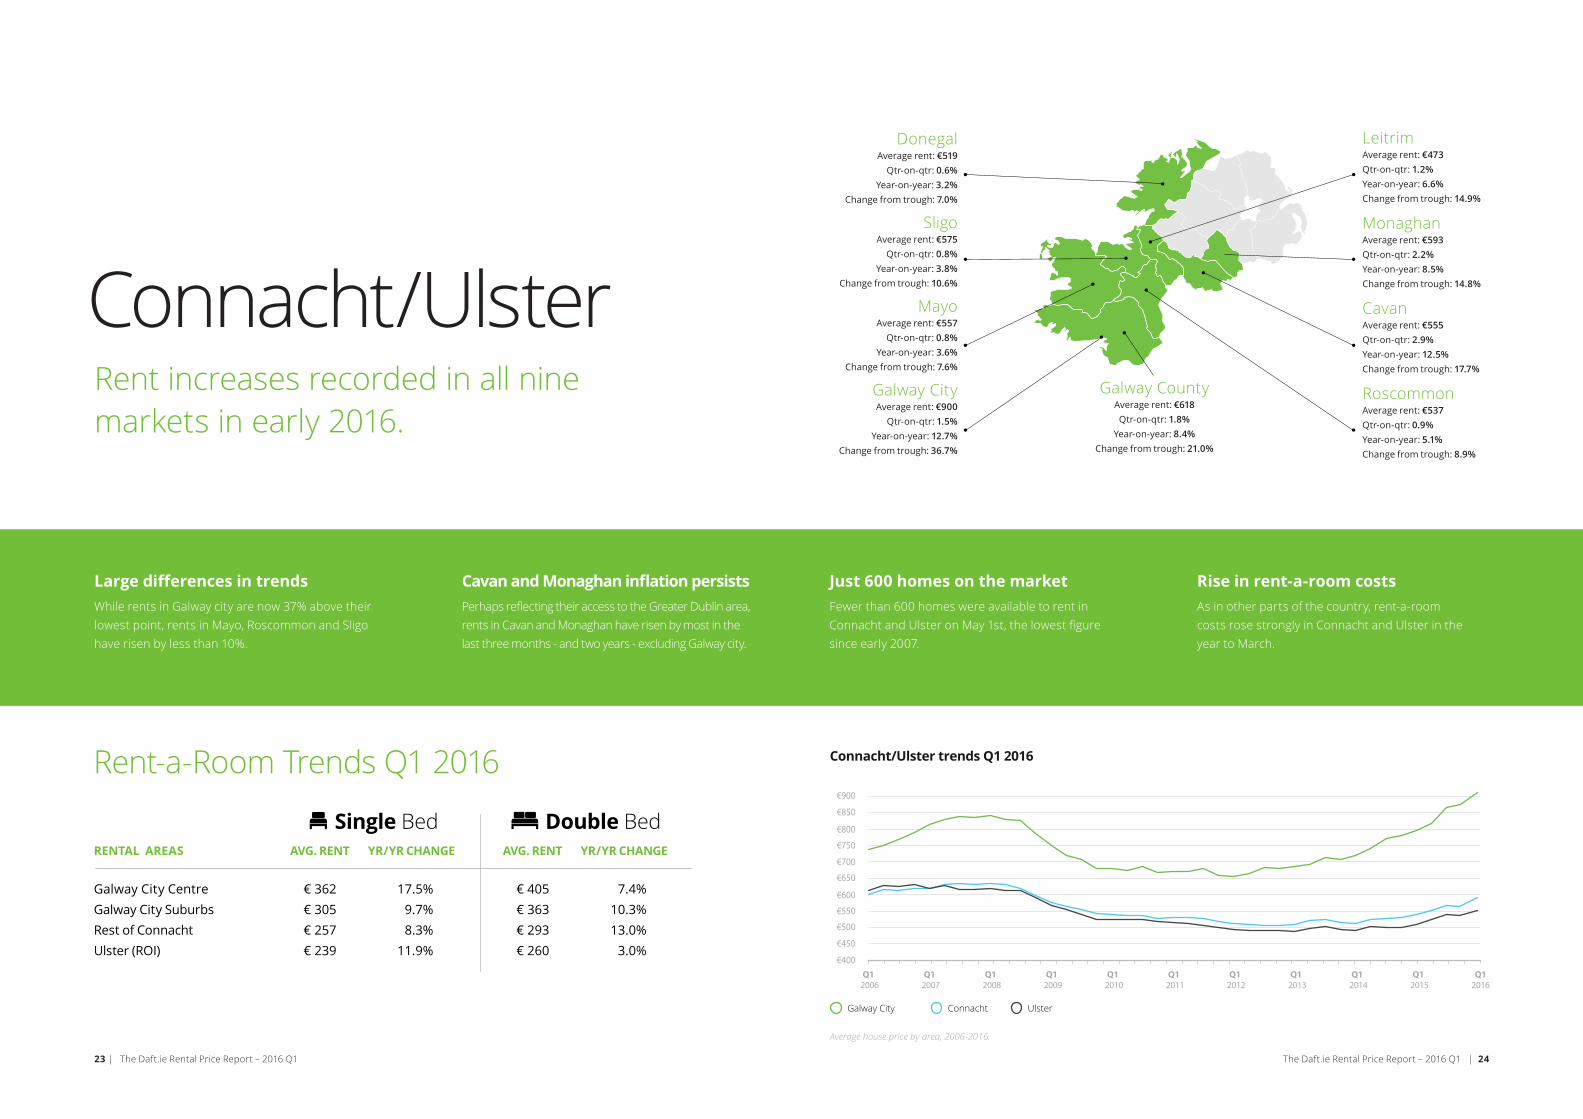
Connacht/UlsterRent increases recorded in all nine markets in early 2016.
LeitrimAverage rent: €470Qtr-on-qtr change: 3.0%Year-on-year change: 8.2%Change from trough: 14.0%
MonaghanAverage rent: €580Qtr-on-qtr change: 3.1%Year-on-year change: 6.8%Change from trough: 12.3%
CavanAverage rent: €534Qtr-on-qtr change: 4.0%Year-on-year change: 10.0%Change from trough: 13.3%
RoscommonAverage rent: €534Qtr-on-qtr change: 2.3%Year-on-year change: 6.6%Change from trough: 8.3%
DonegalAverage rent: €525
Qtr-on-qtr change: 2.0%Year-on-year change: 6.0%Change from trough: 8.2%
SligoAverage rent: €576
Qtr-on-qtr change: 1.8%Year-on-year change: 6.7%
Change from trough: 10.8%
MayoAverage rent: €560
Qtr-on-qtr change: 1.9%Year-on-year change: 4.7%Change from trough: 8.0%
Galway CityAverage rent: €868
Qtr-on-qtr change: 6.0%Year-on-year change: 12.2%Change from trough: 31.8%
Galway CountyAverage rent: €611
Qtr-on-qtr change: 3.6%Year-on-year change: 10.8%Change from trough: 19.7%
Average house price by area, 2006-2016.
Connacht/Ulster trends Q1 2016
Galway City Connacht Ulster
Q12006
Q12007
Q12008
Q12009
Q12010
Q12011
Q12012
Q12013
Q12014
Q12015
Q12016
€900
€850
€800
€750
€700
€650
€600
€550
€500
€450
€400
The Daft.ie Rental Price Report – 2016 Q1 | 2423 | The Daft.ie Rental Price Report – 2016 Q1
Cavan and Monaghan inflation persistsPerhaps reflecting their access to the Greater Dublin area, rents in Cavan and Monaghan have risen by most in the last three months - and two years - excluding Galway city.
Just 600 homes on the marketFewer than 600 homes were available to rent in Connacht and Ulster on May 1st, the lowest figure since early 2007.
Rise in rent-a-room costsAs in other parts of the country, rent-a-room costs rose strongly in Connacht and Ulster in the year to March.
Large differences in trendsWhile rents in Galway city are now 37% above their lowest point, rents in Mayo, Roscommon and Sligo have risen by less than 10%.
Double BedRENTAL AREAS
Galway City Centre Galway City Suburbs Rest of ConnachtUlster (ROI)
AVG. RENT
€ 362€ 305€ 257€ 239
YR/YR CHANGE
17.5%9.7%8.3%
11.9%
AVG. RENT
€ 405€ 363€ 293€ 260
YR/YR CHANGE
7.4%10.3%13.0%
3.0%
Single Bed
Rent-a-Room Trends Q1 2016
DonegalAverage rent: €519
Qtr-on-qtr: 0.6%Year-on-year: 3.2%
Change from trough: 7.0%
SligoAverage rent: €575
Qtr-on-qtr: 0.8%Year-on-year: 3.8%
Change from trough: 10.6%
MayoAverage rent: €557
Qtr-on-qtr: 0.8%Year-on-year: 3.6%
Change from trough: 7.6%
Galway CityAverage rent: €900
Qtr-on-qtr: 1.5%Year-on-year: 12.7%
Change from trough: 36.7%
Galway CountyAverage rent: €618Qtr-on-qtr: 1.8%
Year-on-year: 8.4%Change from trough: 21.0%
LeitrimAverage rent: €473Qtr-on-qtr: 1.2%Year-on-year: 6.6%Change from trough: 14.9%
MonaghanAverage rent: €593Qtr-on-qtr: 2.2%Year-on-year: 8.5%Change from trough: 14.8%
CavanAverage rent: €555Qtr-on-qtr: 2.9%Year-on-year: 12.5%Change from trough: 17.7%
RoscommonAverage rent: €537Qtr-on-qtr: 0.9%Year-on-year: 5.1%Change from trough: 8.9%

Over the last number of years, Daft.ie has collected a vast amount of data on the Irish property market. Each year tens of thousands of properties for sale or rent are advertised on the site.About the Report
The goal of the Daft Report is to use this
information to help all actors in the property
market make informed decisions about buying and
selling. In addition, because it is freely available, the
Daft Report can help inform the media, the general
public and policymakers about the latest
developments in the property market.
This is the Daft.ie Rental Report, the partner to
the Daft.ie House Price Report. Together, they give
house-hunters and investors more information to
help them make their decisions. These twin reports
mean that Daft is the only objective monitor of
trends in both rental and sales markets on a
quarterly basis, making the report an essential
barometer for anyone with an interest in the Irish
property market.
The Daft Report was first launched in 2005. It has
already become the definitive barometer
of the Irish rental market and is being used by the
Central Bank, mortgage institutions, financial
analysts and the general public alike. The Daft.ie
House Price report is Ireland’s longest-running
house price report, combining information from the
Daft.ie archives with data from Ireland’s
Residential Property Price Register.
Methodology and Sample Size
The statistics are based on properties advertised
on Daft.ie for a given period. The regressions used
are hedonic price regressions, accounting for all
available and measurable attributes of properties,
with a Cooks Distance filter for outliers. The average
monthly sample size for lettings properties is over
10,000. Indices are based on standard methods,
holding the mix of characteristics constant, with the
annual average of 2012 used as the base. For more
on the methodology, please see www.daft.ie/
research.
About Daft.ie
Daft.ie is Ireland’s largest property website with
over 1.9 million unique users of the site generating
over 180 million page views each month.
Disclaimer
The Daft.ie Report is prepared from information
that we believe is collated with care, but we do
not make any statement as to its accuracy or
completeness. We reserve the right to vary our
methodology and to edit or discontinue the indices,
snapshots or analysis at any time for regulatory or
other reasons. Persons seeking to place reliance on
any information contained in this report for their
own or third party commercial purposes do so at
their own risk.
Credits
Economic Analysis: Ronan Lyons
Marketing and Communications: Martin Clancy
Layout and Design:
Derek Jones, Dara Gannon & Sheila Rodgers
Coming next:
The Daft.ie House Price Report2016 Q2The Daft.ie House Price Report will be published in July and will include a review of the performance of Ireland’s sales market in the second quarter of 2016, plus all the usual indices, snapshots, trends and analysis, providing analysts, buyers, sellers and the public with the most up-to-date information on Ireland’s sales market.
All data is Copyright © Daft Media Limited. The information contained in this report may only be reproduced if the source is clearly credited. Please contact Daft.ie on 01-4218700 for further information.
25 | The Daft.ie Rental Price Report – 2016 Q1