
The Cyclone Global Navigation Satellite System (CYGNSS ...
35
The Cyclone Global Navigation Satellite System (CYGNSS) – Analysis and Data Assimilation for Tropical Convection Xuanli Li (UAH) Timothy J. Lang (NASA MSFC), John Mecikalski (UAH), Tyler Castillo, Kacie Hoover, Themis Chronis (UAH)
Transcript of The Cyclone Global Navigation Satellite System (CYGNSS ...

The Cyclone Global Navigation Satellite System (CYGNSS) – Analysis and Data Assimilation for Tropical Convection
Xuanli Li (UAH) Timothy J. Lang (NASA MSFC), John Mecikalski (UAH),
Tyler Castillo, Kacie Hoover, Themis Chronis (UAH)

CYGNSS Cyclone Global Navigation Satellite System (CYGNSS): a constellation of 8 micro-satellite observatories launched in November 2016, to measure near-surface oceanic wind speed.Main goal: To monitor surface wind fields of the Tropical Cyclones’ inner core, including regions beneath the intense eye wall and rain bands that could not previously be measured from space; Cover 38°S – 38°N with unprecedented temporal resolution and spatial coverage, under all precipitating conditionsLow flying satellite: Pass over ocean surface more frequently than one large satellite. A median(mean) revisit time of 2.8(7.2) hrs.
Orbits at an inclination of 35°4 specular acquisitions per second
2
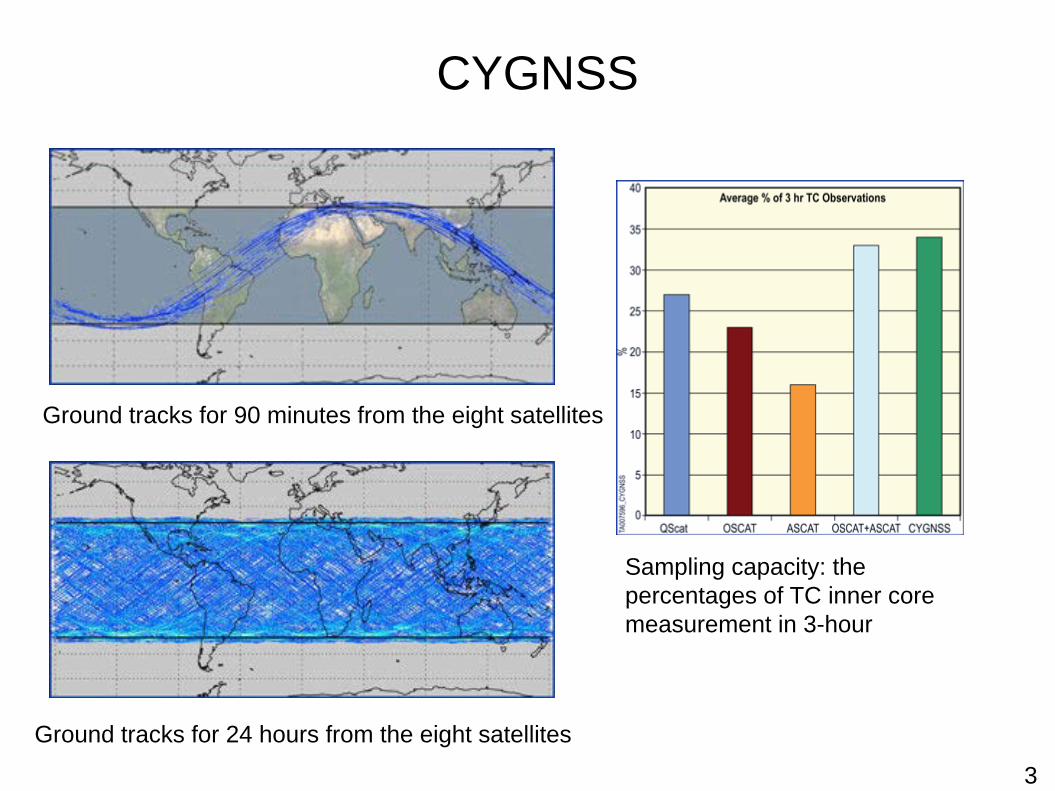
CYGNSS
Ground tracks for 90 minutes from the eight satellites
Ground tracks for 24 hours from the eight satellites
Sampling capacity: the percentages of TC inner core measurement in 3-hour
3

CYGNSS Instrument Definition Zenith Antenna: Collect GPS direct signalNadir Antennas: Collect GPS scattered signalDMR: Delay Mapping Receiver – Create Delay Doppler Map (DDM)
DDM
Wind Speed Retrieval
4

Two NASA Projects
Research goals: To analyze and utilize the high spatial coverage and temporal resolution simulated and real CYGNSS data.
NASA Project #1: Exploring the utility of the planned CYGNSS mission for investigating the initiation and development of the Madden-Julian Oscillation
• Investigate MJO onset using DYNAMO field campaign observations• Examine how CYGNSS observe tropical convection under heavy precipitation condition• Assimilate CYGNSS observation with Observing system simulation experiments (OSSEs)
5

MJO• Eastward propagation of regions of
enhanced/suppressed precipitation.• Distinct patterns in low-level and upper
level atmospheric anomalies: OLR, upper level velocity potential, upper and lower level wind, 500-hPa height.
• Planetary-scale over equatorial tropical • Intraseasonal, a period of 30-90 days.• Modulation of tropical and extratropical
precipitation, monsoon systems, ENSO cycle, tropical cyclone activities, and other meteorological and oceanographic phenomena.
• Challenge: Lack of high-resolution observations of the many facets of the equatorial tropical atmosphere and ocean
• DYNAMO and CYGNSS: To characterize the key feature in wind field anomaly during the MJO
6

DYNAMO Campaign
Dynamics of the Madden-Julian Oscillation (DYNAMO)• Goal: To observe the cloud population and evaluate the effects of the air-sea interactions, on both the small and large scale, during a MJO event • 2011 October, November, and December MJO events.
Intensive instruments:
• Indian Ocean - West Pacific• Sounding array • Air-sea fluxes • Ships and buoys • Satellite and aircraft data• Radar network
7
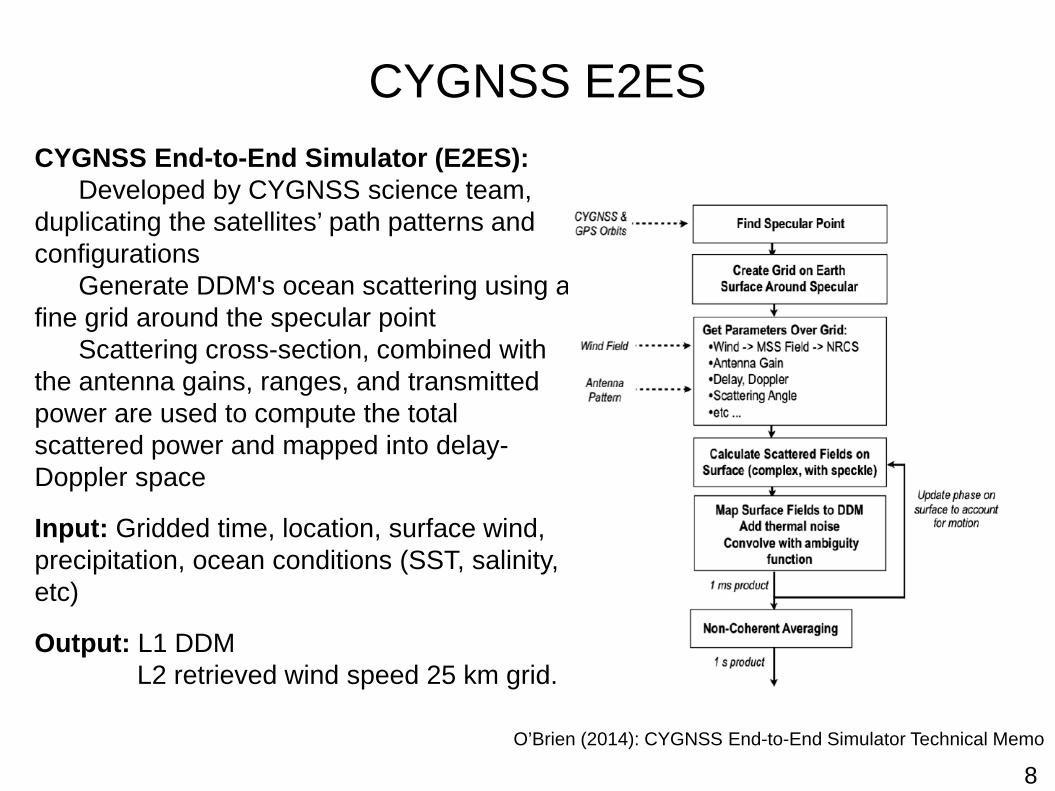
CYGNSS E2ES CYGNSS End-to-End Simulator (E2ES):
Developed by CYGNSS science team, duplicating the satellites’ path patterns and configurations
Generate DDM's ocean scattering using a fine grid around the specular point
Scattering cross-section, combined with the antenna gains, ranges, and transmitted power are used to compute the total scattered power and mapped into delay-Doppler space
Input: Gridded time, location, surface wind, precipitation, ocean conditions (SST, salinity, etc)
Output: L1 DDM L2 retrieved wind speed 25 km grid.
8O’Brien (2014): CYGNSS End-to-End Simulator Technical Memo
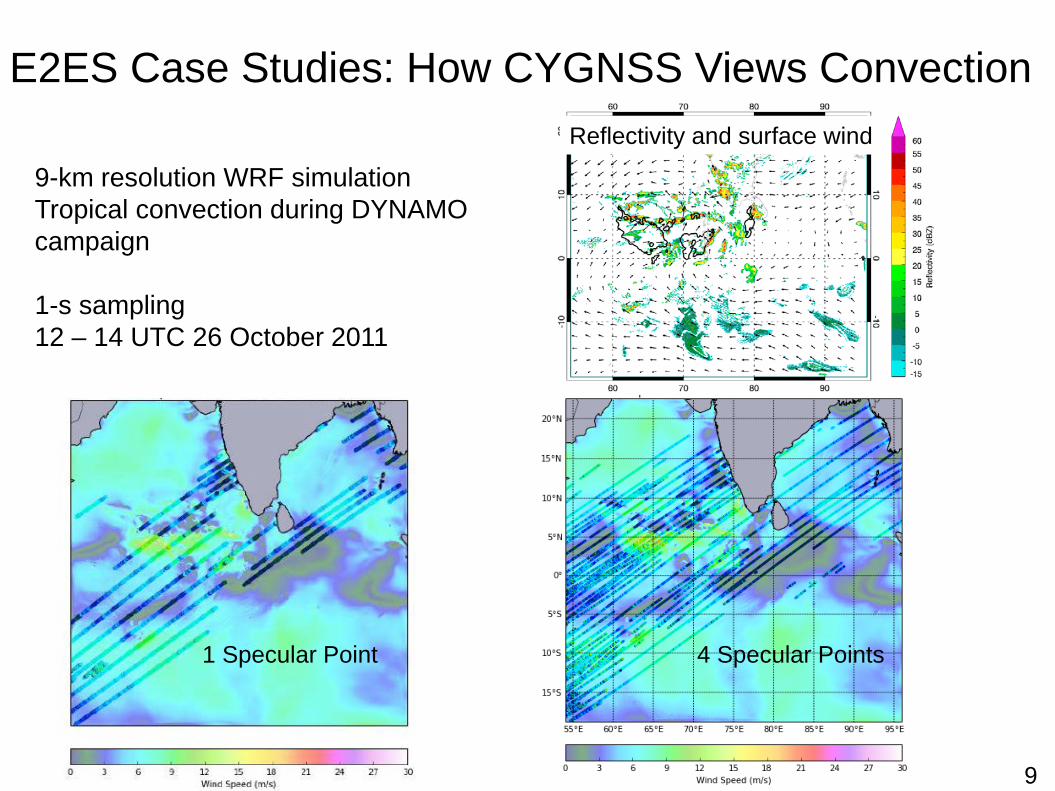
E2ES Case Studies: How CYGNSS Views Convection
1 Specular Point 4 Specular Points
9-km resolution WRF simulationTropical convection during DYNAMO campaign
1-s sampling 12 – 14 UTC 26 October 2011
Reflectivity and surface wind
9

How CYGNSS Views Tropical Convection
4 specular point 12 UTC 21 to 00 UTC 22 December 2011
ASCAT/OSCAT wind 15 – 17 UTC 21 December 2011
1

CYGNSS Observation: WWBs
1
Westerly Wind Burst (WWB): sustained zonal wind over 5m/s for a few daysMJO: Eastward propagation of convective clusters associated with WWB
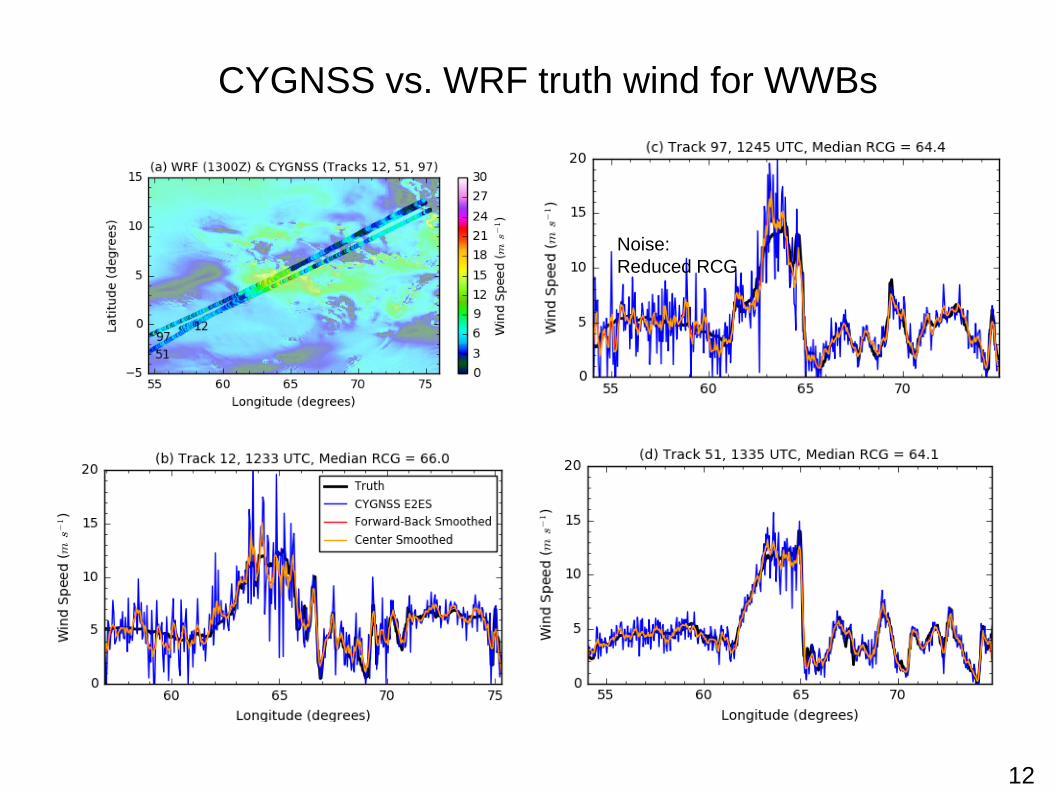
CYGNSS vs. WRF truth wind for WWBs
Noise: Reduced RCG
12

Convection Along Specular Point Track
Before CYGNSS overpass
CYGNSS overpass
After CYGNSS overpass
Sharp Gradient
13
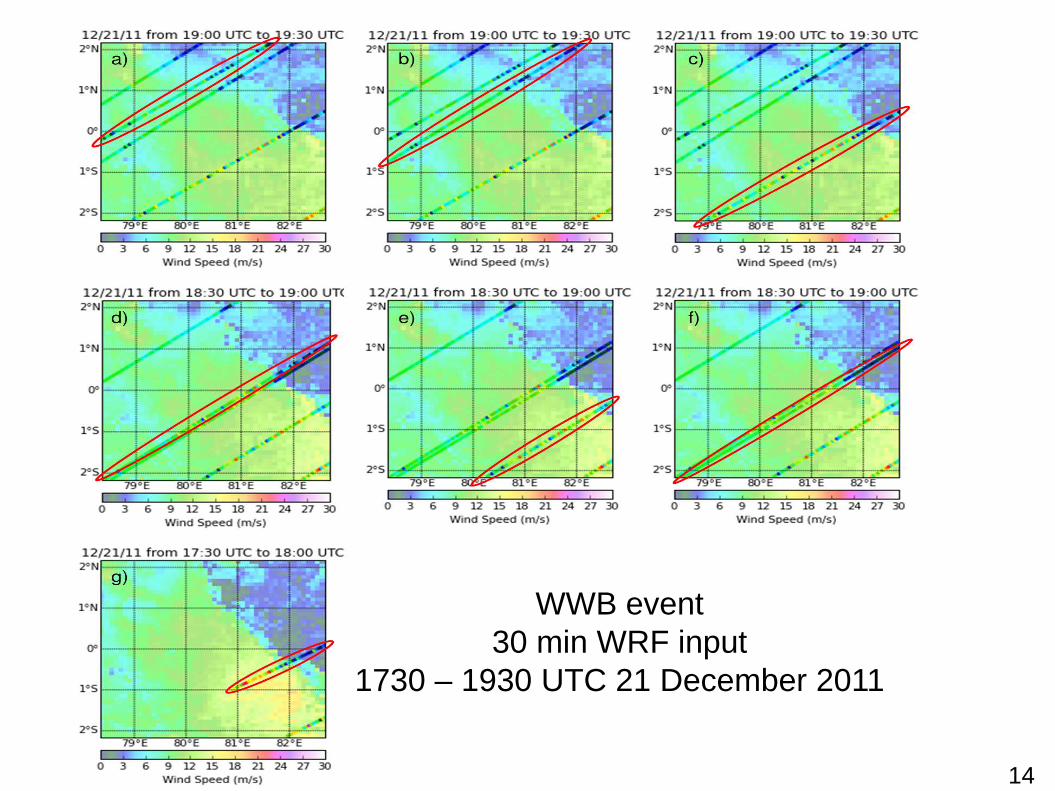
WWB event 30 min WRF input
1730 – 1930 UTC 21 December 2011
14

Strong Wind Gradient
Good
Good
Poor
Poor
Application of CYGNSS wind: Latent Heat Flux Estimate
15

Normalized Root Mean Square Error: 25.4%
Centered Smoothing: 13.9%
Forward-Back Smoothing: 12.4%
16
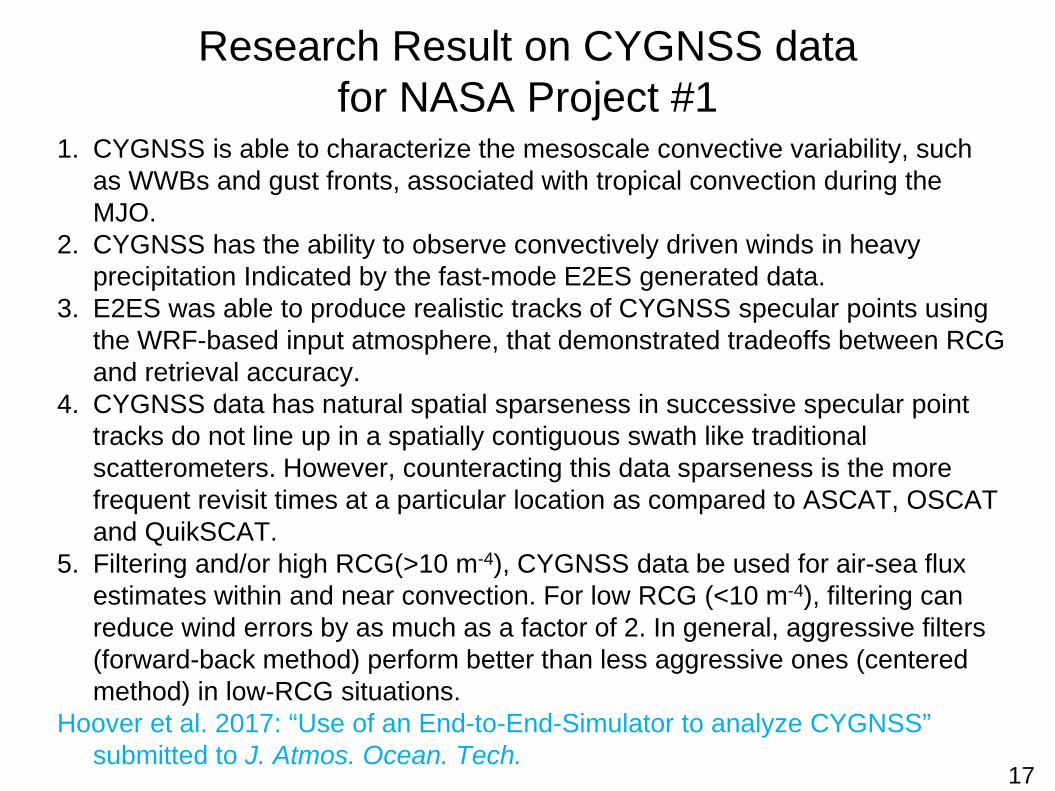
Research Result on CYGNSS data for NASA Project #1
1. CYGNSS is able to characterize the mesoscale convective variability, such as WWBs and gust fronts, associated with tropical convection during the MJO.
2. CYGNSS has the ability to observe convectively driven winds in heavy precipitation Indicated by the fast-mode E2ES generated data.
3. E2ES was able to produce realistic tracks of CYGNSS specular points using the WRF-based input atmosphere, that demonstrated tradeoffs between RCG and retrieval accuracy.
4. CYGNSS data has natural spatial sparseness in successive specular point tracks do not line up in a spatially contiguous swath like traditional scatterometers. However, counteracting this data sparseness is the more frequent revisit times at a particular location as compared to ASCAT, OSCAT and QuikSCAT.
5. Filtering and/or high RCG(>10 m-4), CYGNSS data be used for air-sea flux estimates within and near convection. For low RCG (<10 m-4), filtering can reduce wind errors by as much as a factor of 2. In general, aggressive filters (forward-back method) perform better than less aggressive ones (centered method) in low-RCG situations.
Hoover et al. 2017: “Use of an End-to-End-Simulator to analyze CYGNSS” submitted to J. Atmos. Ocean. Tech.
17

CYGNSS Data Application: Data Assimilation
18
Northern Indian Ocean TS 05A:Vortex formed on 2011-11-25Severe damage along coast of Sri LankaSustained onshore wind >10m/sLoss of 33 lives
18 UTC 2011-11-25Tropical Depression 1000 hPa 30 kts
06 UTC 2011-11-28Tropical Storm996 hPa 35 kts
00 UTC 2011-11-29Tropical Depression1000 hPa 30 kts
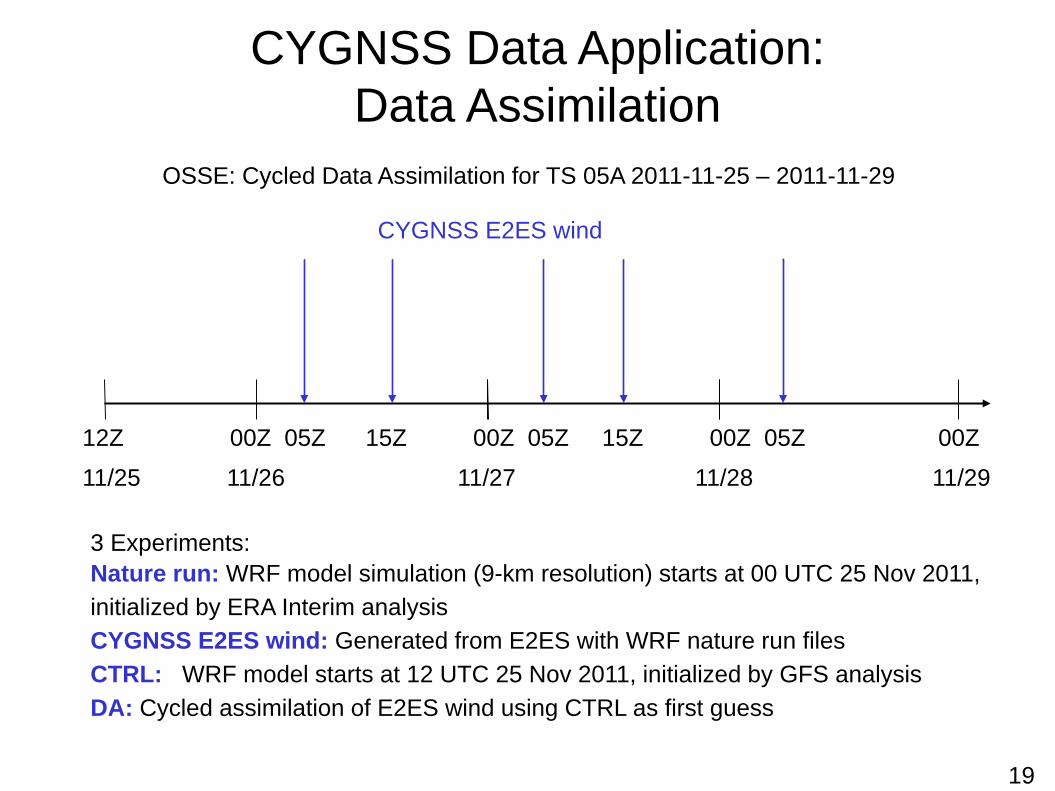
CYGNSS E2ES wind
11/25 11/26 11/27 11/28 11/29
12Z 00Z 05Z 15Z 00Z 05Z 15Z 00Z 05Z 00Z
CYGNSS Data Application: Data Assimilation
3 Experiments: Nature run: WRF model simulation (9-km resolution) starts at 00 UTC 25 Nov 2011, initialized by ERA Interim analysisCYGNSS E2ES wind: Generated from E2ES with WRF nature run filesCTRL: WRF model starts at 12 UTC 25 Nov 2011, initialized by GFS analysisDA: Cycled assimilation of E2ES wind using CTRL as first guess
OSSE: Cycled Data Assimilation for TS 05A 2011-11-25 – 2011-11-29
19

Analysis: 10-m Wind Speed at 15 UTC 2011-11-26
Min Aver RMSE MaxCTRL – NAT -19.20 0.0197 1.97 12.93NAT – NAT -13.44 0.0021 1.93 11.93
20

Analysis: 10-m Wind Speed at 05 UTC 2011-11-27
Min Aver RMSE MaxCTRL – NAT -17.49 0.224 2.08 14.48NAT – NAT -17.24 0.219 2.04 14.07
21
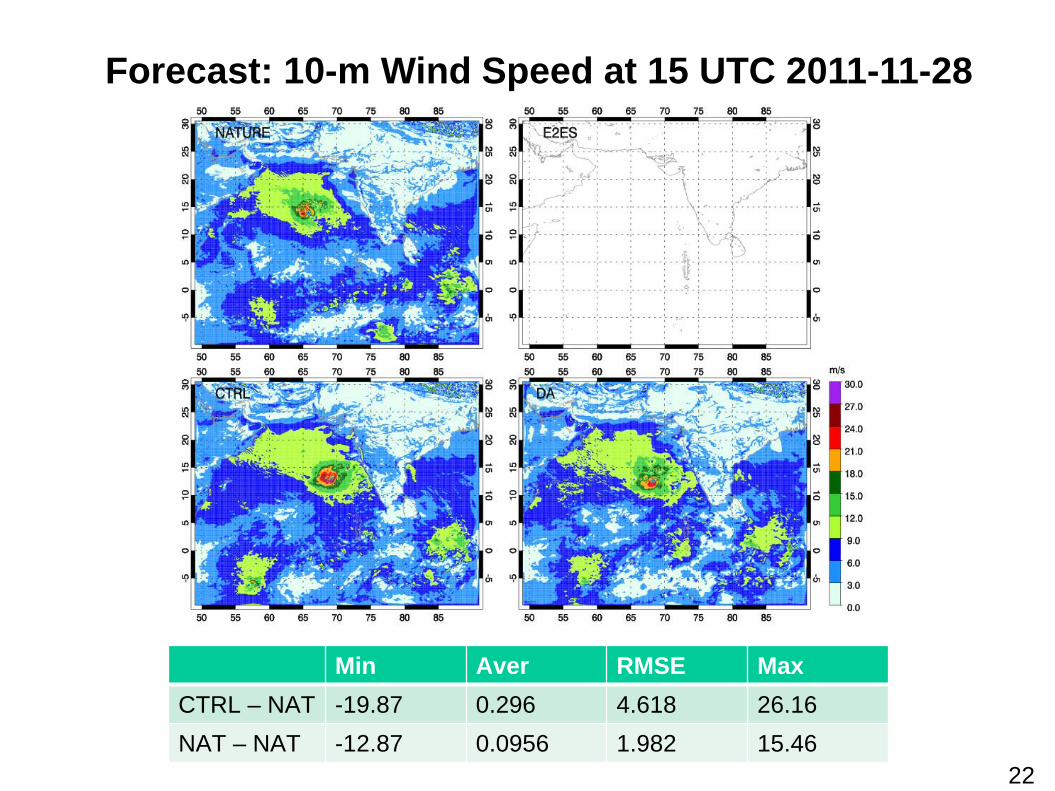
Forecast: 10-m Wind Speed at 15 UTC 2011-11-28
Min Aver RMSE MaxCTRL – NAT -19.87 0.296 4.618 26.16NAT – NAT -12.87 0.0956 1.982 15.46
22

Analysis: SLP and wind vector at 18 UTC 2011-11-26
NAT DA CTRL
Min SLP(hPa) 995 996 998
Max WSPD(m/s)
24.8 22.2 19.2
23

Analysis: SLP and wind vector at 06 UTC 2011-11-27
NAT DA CTRL
Min SLP(hPa) 995 995 996
Max WSPD(m/s)
25.0 21.5 20.3
24
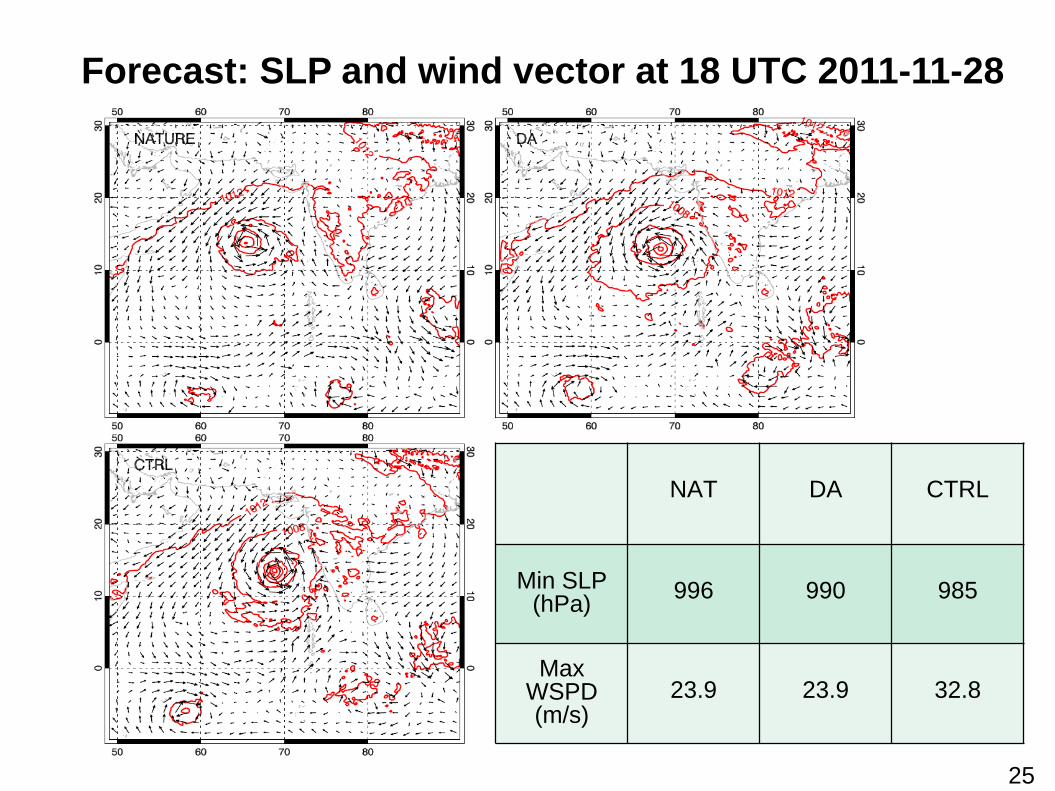
Forecast: SLP and wind vector at 18 UTC 2011-11-28
NAT DA CTRL
Min SLP(hPa) 996 990 985
Max WSPD(m/s)
23.9 23.9 32.8
25
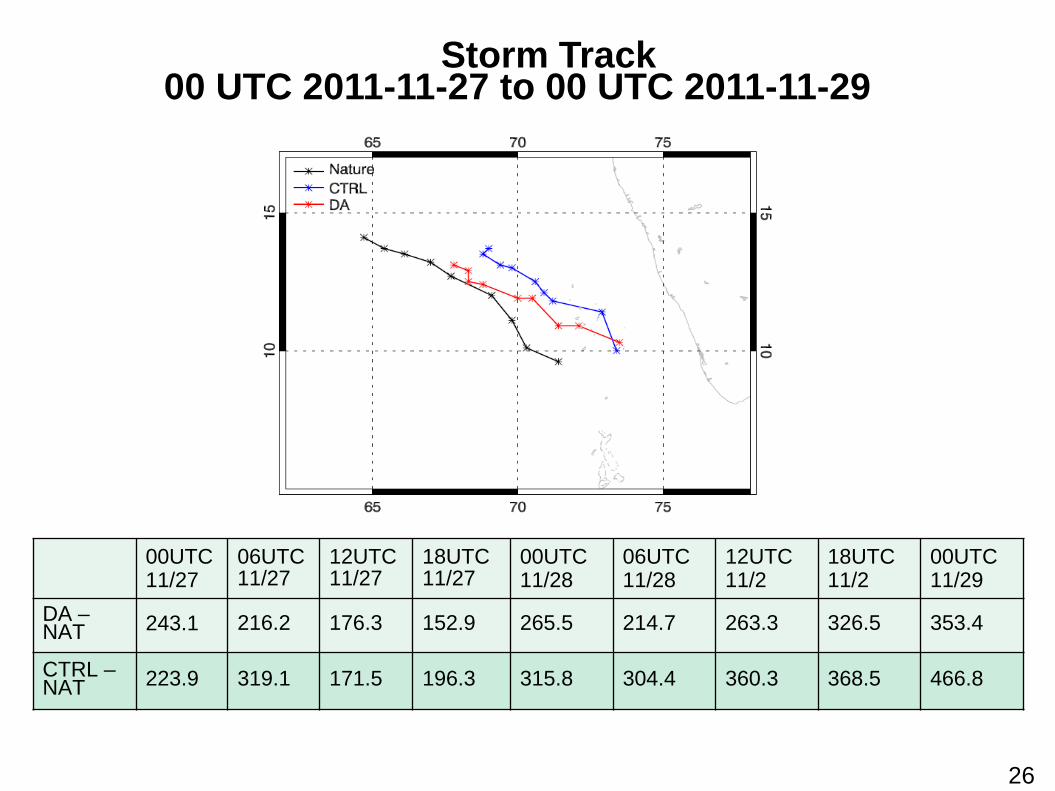
Storm Track 00 UTC 2011-11-27 to 00 UTC 2011-11-29
00UTC11/27
06UTC11/27
12UTC11/27
18UTC11/27
00UTC11/28
06UTC11/28
12UTC11/2
18UTC11/2
00UTC11/29
DA –NAT 243.1 216.2 176.3 152.9 265.5 214.7 263.3 326.5 353.4
CTRL –NAT 223.9 319.1 171.5 196.3 315.8 304.4 360.3 368.5 466.8
26

Forecast: 6-h Accumulate Rainfall 18 UTC 2011-11-28
Control
DA
2011-11-25 1800 UTC
Better Location and Intensity of Rainfall
27

Forecast: East-West Vertical Cross-section across Storm Center
T – T0T0: average over the domain
Water Vapor Mixing Ratio
28
18 UTC 2011-11-28

NASA Project #2:
Demonstrating the value of CYGNSS for investigating relationships between wind-driven surface fluxes and tropical oceanic convection
• Utilize CYGNSS data to study wind-precipitation-evaporation feedbacks• Improve estimate of surface flux estimates in and near heavy convection • Study the influence of wind-driven fluxes on convective development with assimilation of CYGNSS observation
2
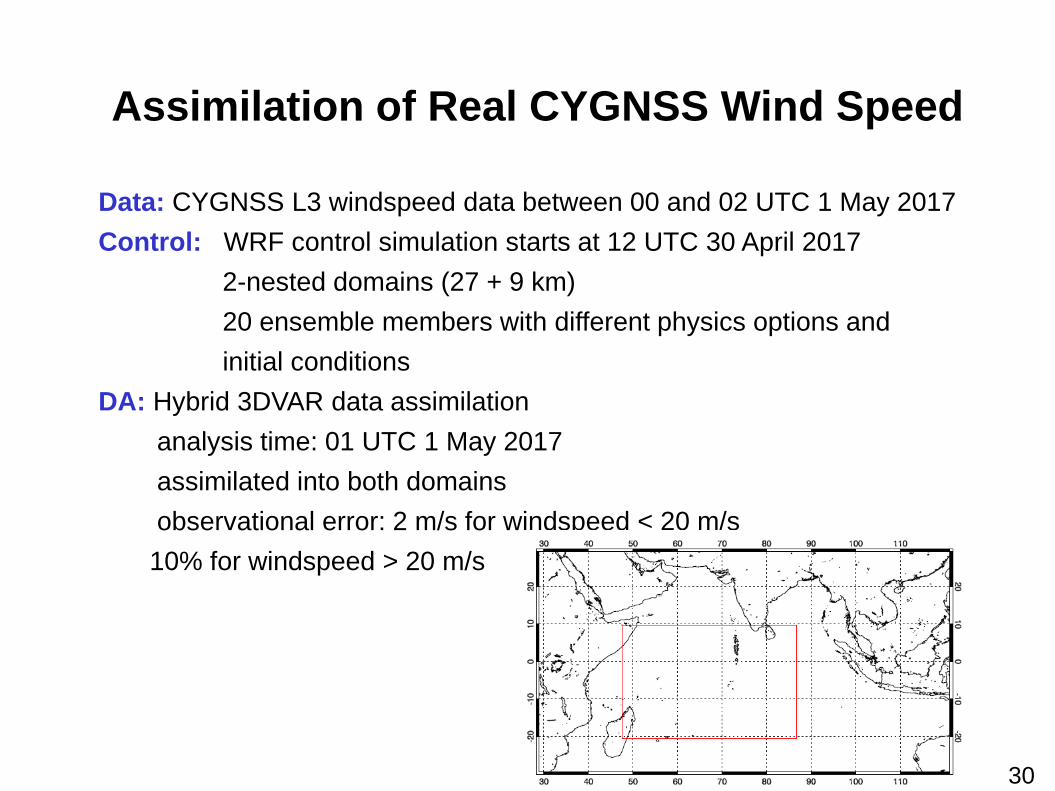
Assimilation of Real CYGNSS Wind Speed
Data: CYGNSS L3 windspeed data between 00 and 02 UTC 1 May 2017Control: WRF control simulation starts at 12 UTC 30 April 2017
2-nested domains (27 + 9 km)20 ensemble members with different physics options and initial conditions
DA: Hybrid 3DVAR data assimilationanalysis time: 01 UTC 1 May 2017assimilated into both domainsobservational error: 2 m/s for windspeed < 20 m/s
10% for windspeed > 20 m/s
30

Tropical Convection In Central Indian Ocean 01 UTC 2017-05-01
WRF CTRL Simulation IMERG rain rate (mm/hr)
31

CYGNSS L3 WindSpeed 00-02 UTC 2017-05-01
High Wind Speed
32
CYGNSS L2 wind: • Baseline product • Time and location – measurement space (sensor-specific latitude, longitude,
and time coordinates)CYGNSS L3 wind: • Gridded wind in uniform latitude, longitude, and time• Combines all 8 observatories x 4 bistatic radar channels = 32 measurements • Statistics of each bin (number, mean value) and quality flags
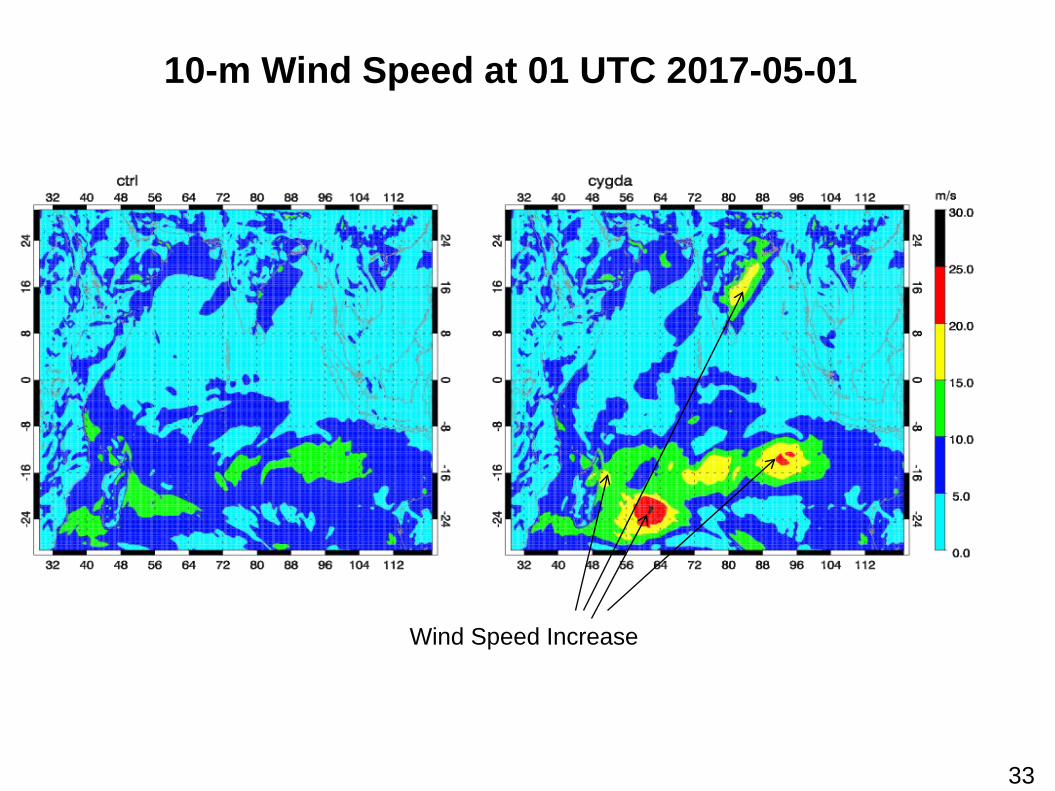
10-m Wind Speed at 01 UTC 2017-05-01
Wind Speed Increase
33

10-m Wind Speed at 03 UTC 2017-05-01
Impact of wind speed assimilation is still apparent in 2 h forecast field
34

Discussion and Future Works
• Positive Impact has been found with hybrid 3DVAR assimilation of CYGNSS simulated for tropical storm, helping create an improved initial condition and better forecast – intensity, track, and precipitation
• Impact has been found in surface wind field with assimilation of real CYGNSS, which can last 6-12 hours
• Highlight the needs for improved quality of CYGNSS observation: Influence of CYGNSS data is greatly influenced by the data quality.
• CYGNSS DDM (magnitude and shape) is a function of ocean roughness. Further understanding on CYGNSS L1 DDM and its relationship with ocean surface roughness and how to obtain more accurate near-surface wind speed retrievals.
35


![Cyclone Handbook, Section I. Cyclone FPGA Family Data Sheet1]EP1C12F256C8.pdf · Section I. Cyclone FPGA Family Data Sheet ... Cyclone Device Handbook, ... Vertical migration means](https://static.fdocuments.in/doc/165x107/5b3a24897f8b9a600a8f2cfc/cyclone-handbook-section-i-cyclone-fpga-family-data-sheet-1ep1c12f256c8pdf.jpg)


