The Customizing Consumer - University of St. GallenFILE/dis4397.pdf · The Customizing Consumer ......
127
The Customizing Consumer Shedding Light on Personality- and Context-Related Factors that Influence Consumers’ Decision Making D I S S E R T A T I O N of the University of St. Gallen, School of Management, Economics, Law, Social Sciences, and International Affairs to obtain the title of Doctor of Philosophy in Management submitted by Emanuel de Bellis from Basel (Basel-Stadt) Approved on the application of Prof. Dr. Andreas Herrmann and Prof. Dr. Torsten Tomczak Dissertation no. 4397 Rosch-Buch, Schesslitz
Transcript of The Customizing Consumer - University of St. GallenFILE/dis4397.pdf · The Customizing Consumer ......

The Customizing Consumer
Shedding Light on Personality- and Context-Related Factors
that Influence Consumers’ Decision Making
D I S S E R T A T I O N of the University of St. Gallen,
School of Management, Economics, Law, Social Sciences,
and International Affairs to obtain the title of
Doctor of Philosophy in Management
submitted by
Emanuel de Bellis
from
Basel (Basel-Stadt)
Approved on the application of
Prof. Dr. Andreas Herrmann
and
Prof. Dr. Torsten Tomczak
Dissertation no. 4397
Rosch-Buch, Schesslitz

II
The University of St. Gallen, School of Management, Economics, Law, Social Sciences and
International Affairs hereby consents to the printing of the present dissertation, without
hereby expressing any opinion on the views herein expressed.
St. Gallen, May 19, 2015
The President:
Prof. Dr. Thomas Bieger

III
To my dear parents
Maja and Gianfranco de Bellis

IV
Acknowledgments
The completion of this dissertation would not have been possible without a great deal of
people. First, I would like to express my gratitude to my doctoral advisor, Prof. Dr. Andreas
Herrmann, for the inspiring guidance, his trust and confidence in my work, and the freedom
he granted me in developing my own ideas. Further, I thank my co-advisor, Prof. Dr. Torsten
Tomczak, for helpful comments on my doctoral proposal and for providing exceptional
working conditions at the Center for Customer Insight (CCI).
In view of the range of projects that are being completed in collaboration, I am truly indebted
to my co-authors from around the world, amongst others: Dr. Jill Griffin, Prof. Dr. Gerald
Häubl, Prof. Dr. Ralph Hertwig, Prof. Dr. Kenichi Ito, Prof. Dr. Bernd Schmitt, and
Prof. Dr. David Sprott. A special thank you goes to Dr. Christian Hildebrand and Dr. Michael
Schulte-Mecklenbeck for the countless meetings and calls we had and for allowing me to
learn so much from them, both professionally and personally.
Further, I am grateful to have received the opportunity to advance part of this dissertation as
Visiting Scholar at the University of British Columbia. I feel indebted to my supervisors,
Prof. Dr. Joey Hoegg and Prof. Dr. Darren Dahl, for the warm welcome to their team, for
allowing me to access their resources, and for the many constructive meetings and fun events.
I also thank Thomas Allard, Chuck Howard, Dr. Kirk Kristofferson, and the whole Marketing
Division for the good time I had in Vancouver.
The CCI team played a key role in the successful completion of my dissertation. Specifically,
I thank Dr. Suleiman Aryobsei, Dr. Lucas Beck, and Dr. Tobias Schlager for being the
greatest and most supportive mates I could hope for. Also, I would like to thank Dr. Isabelle
Engeler, Dr. des. Christian Hauner, Prof. Dr. Wibke Heidig, Prof. Dr. Reto Hofstetter, Jessica
Müller-Stewens, Dr. Christian Purucker, Dr. Philipp Scharfenberger, Dr. Miriam van Tilburg,
and Dr. des. Anna Zakharova for creating a pleasant working environment during my time as
a PhD student. A big thank you goes to Veronika Hauser, Arlette Niedermann, and Klaus
Edel for their important work behind the scenes.
Finally, I feel extremely lucky to be able to count on my dear family. Thank you Maja de
Bellis, Gianfranco de Bellis, Andreas Leisinger, and Natascha Bout for your love, your
support, and your guidance in helping me get to where I am today. In this context, I would
also like to thank my friends from Basel for the fun times we had when I needed a change of

V
scene from the academic world. Last but not least, I would like to express my sincere
gratitude to my fiancée Anna-Louise McCaskey. Thank you Anna for the great and
continuing support during this academic journey, for joining me during my year in Canada,
and for being the best mother and prospective wife one could imagine. I look forward to our
future as a young family together with our son Livio.
St. Gallen, July 2015 Emanuel de Bellis

VI
Table of Contents
A. Summary / Zusammenfassung .................................................................................... III
B. Article I ............................................................................................................................. 1
de Bellis, E., Sprott, D. E., Herrmann, A., Bierhoff, H.-W., and Rohmann, E. (second round).
The Mass-Customizing Shopper: How Narcissism Drives Consumers to Configure Unique
Products. Journal of Retailing.
C. Article II ......................................................................................................................... 41
de Bellis, E., Hildebrand, C., Ito, K., Herrmann, A., and Schmitt, B. (in preparation for
submission). Examining the Global Boundaries of Mass Customization: Conventional
Configuration Procedures Clash with Holistic Information Processing. Journal of Marketing
Research.
D. Article III ....................................................................................................................... 58
de Bellis, E., Hildebrand, C., Ito, K., and Herrmann, A. (in press). Cross-National Differences
in Uncertainty Avoidance Predict the Effectiveness of Mass Customization across East Asia:
A Large-Scale Field Investigation. Marketing Letters.
E. Article IV ........................................................................................................................ 77
de Bellis, E. (2015). Die 3-K-Erfolgsfaktoren von Mass Customization. Marketing Review
St. Gallen, 32 (2), 62–69.
F. Article V ......................................................................................................................... 96
de Bellis, E., Schulte-Mecklenbeck, M., Brucks, W., Herrmann, A., and Hertwig, R.
(submitted). As Light Goes Down Speeding Goes Up. Nature.
G. Curriculum Vitae ........................................................................................................ 117

VII
Summary
The marketing discipline has largely focused on the investigation of universally
applicable principles. This focus is expressed, amongst others, by the oft-quoted marketing
mix. Therein, the end consumer merely plays a subordinate role, although it is known
nowadays that consumers respond heterogeneously to marketing activities while social media
and “big data” provide numerous customer segmentation methods. The present dissertation
aims to evaluate and quantify the importance of the individual consumer as well as his or her
cultural and environmental decision context. To do so, the author draws on established
psychological concepts, which are tested by means of behavioral experiments and secondary
field data.
The object of study is mass customization systems, which allow customers to create
their own customized products via web-based configurators. Such interfaces are relevant not
only because of their manifold potential and their increasing usage around the world, but also
because of the central role that is assigned to the consumer during the configuration process.
Converging evidence from seven empirical studies shows that individual personality traits
considerably affect behavior in configurators. Specifically, narcissism and associated feelings
of superiority lead consumers to configure more unique products, while the priming of a
narcissistic state allows firms to direct the uniqueness degree of consumer decisions (see
Article I).
Besides individual differences, myriad context-related factors influence consumers’
decision making. A series of cross-cultural studies demonstrate that conventional choice
architectures do not fit the holistic style of information processing of Eastern cultures, which
reduces mental simulation of product use along with consumers’ satisfaction with the
configured product (see Article II). Field data of a car manufacturer indicate that local
cultural differences must not be neglected either. The inherent uncertainty avoidance of
Japanese (vs. Chinese) consumers, for instance, leads to prolonged configuration time spans,
which in turn increases the likelihood of a non-purchase (see Article III). These and other
empirical findings are summarized and integrated into a conceptual model of mass
customization (see Article IV).
The final article deals with an environmental context factor that can fatally influence
human decision making. The analysis of over one million car movements shows that
drivers⎯counter to the principles of road safety⎯tend to exceed speed limits more often

VIII
when light conditions are impaired. This finding emphasizes that individuals do not always
behave rationally and that the environment in which a decision is made can change the
outcome considerably. Taking these influencing factors into consideration enables firms as
well as policy makers to improve the impact and scope of their actions and to better meet the
manifold needs of consumers.

IX
Zusammenfassung
Die Marketingdisziplin hat sich grösstenteils mit der Untersuchung von universell
anwendbaren Prinzipien befasst, was sich unter anderem im oft zitierten Marketingmix
ausdrückt. Der Endkonsument nimmt dabei lediglich eine untergeordnete Rolle ein, obwohl
heute bekannt ist, dass Konsumenten heterogen auf Marketingaktivitäten reagieren während
soziale Medien und „Big Data“ unzählige Möglichkeiten zur Kundensegmentierung bieten.
Die vorliegende Dissertation beabsichtigt, die Bedeutung des individuellen Konsumenten
sowie dessen kulturellen und umweltbedingten Entscheidungskontexts zu evaluieren und zu
quantifizieren. Hierzu greift der Autor etablierte psychologische Konzepte auf, die anhand
verhaltenswissenschaftlicher Experimente und Sekundärdaten aus der Praxis getestet werden.
Als Untersuchungsgegenstand dienen Mass Customization Systeme, welche es
Kunden erlauben, ihr massgeschneidertes Produkt via internetbasierter Konfiguratoren selbst
zu kreieren. Solche Schnittstellen sind nicht nur wegen des vielfältigen Potenzials und ihrer
zunehmenden Verwendung relevant, sondern auch wegen der zentralen Rolle, die dem
Konsumenten während des Konfigurationsprozesses zukommt. Die Ergebnisse von sieben
empirischen Studien zeigen, dass individuelle Persönlichkeitseigenschaften das Verhalten in
Konfiguratoren erheblich beeinflussen. So führen Narzissmus und damit einhergehende
Überlegenheitsgefühle dazu, dass Konsumenten einzigartigere Produkte konfigurieren. Das
Priming eines narzisstischen Zustands ermöglicht es Unternehmen, den Einzigartigkeitsgrad
von Konsumentenentscheidungen zu steuern (siehe Artikel I).
Neben individuellen Unterschieden gibt es unzählige Kontextfaktoren, die sich auf die
Entscheidungsfindung von Konsumenten auswirken. Eine Reihe kulturübergreifender Studien
weist darauf hin, dass herkömmliche Entscheidungsformate nicht zur holistischen
Informationsverarbeitung von östlichen Kulturen passen, wodurch die mentale Visualisierung
des Produktgebrauchs und damit die Zufriedenheit mit dem konfigurierten Produkt
vermindert wird (siehe Artikel II). Auch dürfen lokale Kulturunterschiede nicht
vernachlässigt werden, wie die Felddaten eines Automobilherstellers zeigen. Die inhärente
Unsicherheitsvermeidung von japanischen (vs. chinesischen) Konsumenten führt z.B. zu
verlängerten Konfigurationszeiten, welche die Wahrscheinlichkeit eines Nicht-Kaufs erhöhen
(siehe Artikel III). Diese und weitere empirischen Ergebnisse werden zusammengefasst und
in ein konzeptionelles Modell von Mass Customization eingearbeitet (siehe Artikel IV).

X
Der abschliessende Artikel befasst sich mit einem umweltbedingten Kontextfaktor,
der die menschliche Entscheidungsfindung fatal beeinflussen kann. Die Analyse von über
einer Million Fahrzeugbewegungen zeigt, dass Fahrzeuglenker⎯entgegen jeglichen
Grundsätzen der Verkehrssicherheit⎯bei schlechteren Lichtverhältnissen vermehrt dazu
neigen, die erlaubte Höchstgeschwindigkeit zu übertreten. Dieser Befund unterstreicht, dass
sich Individuen nicht immer rational verhalten und dass die Umgebung, in der eine
Entscheidung getroffen wird, das Ergebnis erheblich verändern kann. Die Berücksichtigung
solcher Einflussfaktoren erlaubt es Unternehmen wie auch politischen Entscheidungsträgern,
die Wirkung und Reichweite ihrer Handlungen zu optimieren und die vielfältigen
Bedürfnisse von Konsumenten besser abzudecken.

1
Article I
de Bellis, E., Sprott, D. E., Herrmann, A., Bierhoff, H.-W., and Rohmann, E. (second round).
The Mass-Customizing Shopper: How Narcissism Drives Consumers to Configure Unique
Products. Journal of Retailing.
This research has been presented at the 2013 Association for Consumer Research (ACR) and
the 2015 European Marketing Academy (EMAC).

2
The Mass-Customizing Shopper:
How Narcissism Drives Consumers to Configure
Unique Products
Emanuel de Bellisa
David E. Sprottb
Andreas Herrmanna
Hans-Werner Bierhoffc
Elke Rohmannc
aCenter for Customer Insight, University of St. Gallen, Switzerland
bCarson College of Business, Washington State University, USA cFaculty of Psychology, Ruhr University Bochum, Germany

3
Abstract
Mass customization systems allow retailers and manufacturers to augment product offerings
while providing consumers with the opportunity to create unique, self-designed products.
Yet field evidence suggests that only a minority of shoppers use the full potential of such
systems by configuring products with unique options (e.g., configuring a volcano red car
instead of a black one). The segment of those choosing unique product options is of
considerable interest to firms given their potential impact on product diffusion and profit
margins. The present research finds that heterogeneity of selected product options in a mass
customization system is driven by narcissism. In a field study and six additional studies, we
demonstrate that narcissistic shoppers configure more unique products while responding
strongly to the provision of uniqueness information. In doing so, we show that firms can
prime state narcissism to influence the uniqueness of product configurations. Feelings of
superiority mediate the narcissism-uniqueness relationship and serve as a boundary condition
of narcissists’ proclivity for unique products. Our findings suggest that retailers and
manufacturers should consider customers’ narcissistic tendencies, as well as their current
states of mind, when integrating mass customization systems into multi-channel distribution
strategies.

4
Main Body
Back in 1918, at the advent of mass production, half of the licensed cars in the United
States were Model Ts, most of which looked identical thanks to Henry Ford’s supposed
principle that “any customer can have a car painted any color that he wants so long as it is
black” (Eliason 2012; Ford 1922, p. 72). Today, given firms’ ability to offer mass-customized
products, the picture has radically changed with near limitless options being available via
web-based product configurators. These mass customization (MC) systems are provided by
retailers and manufacturers (see www.configurator-database.com) and allow consumers to
self-design their own products. In the light of firms’ growing interest in multi-channel
strategies (e.g., Wallace, Giese, and Johnson 2004), MC systems can also be used to create
and make use of new distribution channels. The popularity of these systems in today’s
marketplace is supported by findings of a short survey. Asking a sample of US consumers
(N = 102) how likely they were to customize 12 daily consumer products or services reveals
high approval rates for MC systems, from 33% for jewelry and 56% for foods, up to 66% for
cars and 80% for vacation packages.
Mass customization systems allow consumers to differentiate themselves from others
by communicating their own identity by means of self-designed, unique products (Berger and
Heath 2007; Franke and Schreier 2008). Shopper data, however, indicate that only a small
portion of consumers uses the full potential of these systems to configure truly unique
products. For example, while 74% of car buyers (of a European flagship car model in 2012)
chose one of five exterior colors (silver, grey, white, and two shades of black), the remaining
26% of customers picked one out of more than 90 additional colors. Whether it be color,
rims, or interior features, it appears that a considerable number of consumers deliberately
select product options that do not fit the mainstream, and in fact significantly deviate from it.
This market segment is of considerable economic importance to firms, since these consumers
provide visibility to the firm’s full range of product options, which in turn speeds up product
diffusion and shapes the brand’s image. In addition, uncommon product options are often
more expensive (and therefore likely more profitable) than standard ones. For instance, the
three most often chosen exterior colors (for the previously referenced flagship car model) had
an average surcharge of €317, whereas the three least chosen colors were priced at €2660, on
average. While manufacturing costs may be higher for unique product options, profit margins
are still substantially larger for those options.

5
Who are the consumers who select unique options when using MC systems and what
motivates them to self-design products in such a way? Conceptual research suggests that
answers to these questions may reside within the narcissistic personality construct (Sedikides
et al. 2007), defined as an unjustified conceit implying an excessive motive to self-enhance
(Lee, Gregg, and Park 2013; see Study 1 for a more detailed definition). Initial support for the
notion that narcissistic consumers are prone to use MC systems is provided by the earlier
referenced survey, which reveals a positive relationship between consumers’ narcissistic
tendencies and their likelihood to customize products (β = .20, t(100) = 2.02, p < .05). Our
general premise is that some consumers design unique products as an expression of their
narcissistic tendencies or due to a temporary narcissistic state of mind. We argue that the
configuration and consumption of unique products serve as an important strategy for
narcissists to appear unique in the material world (Emmons 1984), to be perceived as superior
and to self-enhance (Sedikides et al. 2007), and to project a colorful lifestyle to the public
(Chatterjee and Hambrick 2007). These issues are particularly relevant today, as cross-
sectional studies show that consumer narcissism has increased by 30% since the 1980s and is
likely to continue to expand along with the rise of social media (Twenge et al. 2008).
To date, no empirical research has examined the nature of shoppers who make use of
the full individualization potential of MC systems. The present work addresses this gap by
exploring the impact of consumers’ narcissistic tendencies and states of mind in an MC
context and showing how these mechanisms can be used to influence the uniqueness of
configured products. As such, the findings of this research have important implications for
the design of MC systems, customer segmentation, and marketing communication strategies
associated with the use of such systems by retailers and manufacturers.
Theoretical Background and Hypotheses
Mass customization, derived from the combination of the two apparently
contradictory terms “mass production” and “customization,” is an integral part of the multi-
channel distribution strategy that is beneficial to both retailing and manufacturing firms
(Huffman and Kahn 1998; Wallace et al. 2004). Given the distinct opportunity to create and
showcase unique products, MC systems are a particularly promising environment for
narcissists. The accumulated literature demonstrates that enabling consumers to express their
individual preferences by using web-based product configurators (i.e., software applications
that facilitate the MC of products) can decrease choice complexity and increase customer

6
satisfaction, while leading to greater purchase likelihood and higher willingness to pay
(Broniarczyk and Griffin 2014; Franke, Schreier, and Kaiser 2010; Moreau, Bonney, and
Herd 2011; Valenzuela, Dhar, and Zettelmeyer 2009). At the same time, researchers have
begun exploring the boundary conditions (e.g., Coker and Nagpal 2013; de Bellis et al. in
press) as well as the underlying processes for these effects. Firms offering MC systems not
only benefit from increased preference fit and design effort, but also from instilling feelings
of being the creator of a product design, which in turn enhances consumers’ pride and
feelings of accomplishment. These “I designed it myself” (Franke et al. 2010) or “I made it
myself” (Troye and Supphellen 2012) effects represent how MC systems enable consumers to
create individualized products that express uniqueness.
Narcissists are characterized by a desire for self-aggrandizement and self-
enhancement, with agentic self-beliefs (e.g., dominance, uniqueness, status, and autonomy)
standing at the center of their self-identity (Campbell and Foster 2007; Emmons 1984;
Sedikides et al. 2007). Whereas in Western cultures most people desire to differ from others
in order to establish their personal identity (Snyder and Fromkin 1980), recent research has
shown that the need for uniqueness is especially strong for the narcissist (Lee et al. 2013).1
According to the agency model of narcissism, narcissists emphasize agentic traits that fuel
narcissistic interpersonal strategies, such as an aspiration toward uniqueness (Campbell and
Foster 2007). Therefore, narcissists explicitly strive for uniqueness as a means of self-
enhancement (Sedikides et al. 2007). As consumers, narcissists should seek opportunities to
confirm or enhance their self-image, with related consumption decisions being closely linked
to agentic self-beliefs. Thus, narcissistic consumers are likely to focus their attention on
products with higher prestige and stylish exclusivity, therefore constituting an important
market segment that identifies with the latest, in-fashion products (Sedikides, Cisek, and Hart
2011).
Narcissistic consumers should be particularly prone to the self-signaling function of
mass-customized products because of their self-centered bias (Dhar and Wertenbroch 2012)
and their inclination to “favor the extreme, the grandiose, and the colorful,” while “discreet or
incremental actions are not satisfying” (Chatterjee and Hambrick 2007, p. 355). These views
suggest that narcissistic shoppers believe they can overcome the “average” and acknowledge
the “special” by configuring products which incorporate unique features. Moreover,
1 The need for uniqueness construct is not equivalent to narcissism. Whereas narcissism is defined as a pattern of grandiosity which is combined with need for admiration and lack of empathy, need for uniqueness refers to the desire to possess extraordinary characteristics.

7
customizing and consuming unique products involves social risk because the choice is not
supported by a substantial number of other consumers. Given that narcissism has been shown
to be consistently related to enhanced risk taking (Foster, Shenesey, and Goff 2009),
narcissistic consumers should be less concerned about the risks associated with customizing
and consuming a unique product. Finally, while initial empirical evidence indicates that
narcissism is positively associated with compulsive buying (Rose 2007), more recent research
highlights that narcissists’ inherent desire to distinguish themselves from others is also
reflected in their regular consumption behavior (e.g., by a greater interest in scarce, exclusive,
and personalizable products; Lee et al. 2013; Lee and Seidle 2012). In sum, because of
narcissists’ agentic self-beliefs, their enhanced need for uniqueness, and their risk-taking
nature, narcissistic consumers are likely to show a proclivity for self-designing unique
products. More formally, we hypothesize:
H1. Greater narcissistic tendencies of a shopper lead to the choice of more unique product
options and thus to increased product uniqueness when using MC systems.
While narcissism has been predominantly studied as a trait exhibiting stability over
time (Raskin and Hall 1981), more recent work suggests that situational variations in
narcissism can manifest as well (Sakellaropoulo and Baldwin 2007). Similar to the
comparison of trait and state self-esteem, trait and state narcissism refer to stable cross-
situational consistency versus situation-specific elicitation of a concept, respectively.
Building on this nascent stream of research, we propose that priming narcissism as a state of
mind will lead to similar effects on product uniqueness as does its trait counterpart (H1).
Inducing a narcissistic state of mind (independent of consumers’ predominant levels of trait
narcissism) provides support for the proposed causal effect of narcissism on product
uniqueness. In addition, developing a priming technique that is simple to apply in marketing
practice provides firms and policy makers with a strategic tool to direct the uniqueness of
configured products. Given the preceding, we propose:
H2. Priming a narcissistic (vs. non-narcissistic) state of mind increases product
uniqueness.
Firms can design MC systems to make the most of the narcissist’s agentic self-beliefs
by providing uniqueness information about the customized product at the end of the
configuration process. Such feedback would prove beneficial to narcissistic consumers,
especially when using complex MC systems where the likelihood of configuring a truly

8
unique product is high (e.g., some car configurators allow for millions of product option
combinations). Because narcissists attach considerable importance to the creation of unique
products (H1), their product evaluations are likely to be strongly affected by such feedback.
In particular, we propose that narcissistic consumers will exhibit greater feelings of
accomplishment (cf. Franke et al. 2010) and greater satisfaction with the customized product
(cf. Hildebrand et al. 2013) when feedback confirms their configuration as unique. In
contrast, feedback implying the configured product is not unique (or standard) will
disconfirm the uniqueness claim of narcissists and disappoint them because such feedback is
at odds with their self-identity. We hypothesize:
H3a. The effect of feedback regarding the uniqueness of a configured product on product
evaluations is moderated by shoppers’ narcissistic tendencies.
Current MC systems not only enable firms to indicate the uniqueness of the final,
configured product, but also allow for the provision of uniqueness information during the
configuration process. Narcissistic shoppers should be keen to learn whether a given product
option has been chosen frequently or rarely in the past. By providing information about the
uniqueness of products options―for instance, specifying the percentage share of the exterior
color “volcano red” as 2% and “silver” as 23% (relative to all other exterior
colors)―consumers can opt for their preferred level of uniqueness while configuring. Given
narcissists’ desire to create a truly unique product, their choice should be strongly influenced
by such information, with narcissistic consumers adjusting their choice of options based on
the percentage share of product options. Providing manipulated percentage shares allows one
to examine whether narcissists put more emphasis on choosing unique options (and therefore
creating a unique product) than on their personal preferences. Thus, we propose:
H3b. Greater narcissistic tendencies of a shopper lead to the choice of product options with
lower (vs. higher) manipulated percentage share.
Consumers’ feelings of superiority are proposed to mediate the narcissism-uniqueness
link (H1), since they are triggered by narcissistic beliefs and are considered as an underlying
motive of narcissists (Emmons 1987; Sedikides et al. 2007). Feelings of superiority are likely
to make a person focus on the self-enhancing consequences of one’s choices. Not
surprisingly, firms often use superiority claims when making comparisons to competitive
offerings (e.g., “You won’t even need to speed past other drivers to make them feel inferior,”
a slogan used by Bentley in 2010). While people in general consider themselves to be better

9
than the average (Kruger and Dunning 1999), narcissists emphasize this tendency more so
than others (Campbell, Rudich, and Sedikides 2002). Narcissists’ preoccupation with prestige
and entitlement can be achieved by uncommon brands and designs, something which
(according to narcissists) is better than what the average consumer deserves. This motive
should emerge in situations allowing for superior self-presentation (Krizan and Bushman
2011), such as when self-designing and purchasing products with MC systems. For
narcissists, creating a truly unique product is an opportunity to confirm and fulfill their
superiority claim. As such, we hypothesize:
H4. The positive relationship between narcissism and product uniqueness is mediated by
shoppers’ feelings of superiority.
We finally explore how influencing consumers’ feelings of superiority will serve as a
boundary condition for the proposed narcissism-uniqueness relationship, providing additional
evidence for the mediating role of superiority feelings (i.e., by testing a mediational process
through a moderating variable; Spencer, Zanna, and Fong 2005). Building on H4, we aim to
shut off the effect of narcissism on product uniqueness by diminishing feelings of superiority
via a mental simulation task. Providing consumers with equal (vs. superior) performance
feedback should make superiority-related cognitions less available in memory through
spreading activation processes (Berger and Fitzsimons 2008), prompting narcissists to
temporarily feel less superior. In so doing, we predict that diminishing narcissists’ inherent
feelings of superiority will reduce the uniqueness-enhancing consequences of narcissism in
the context of MC systems. Thus, we hypothesize:
H5. Inducing feelings of equality eliminates the positive relationship between narcissism
and product uniqueness.
To test these focal hypotheses, we report the results of a field study and six additional
studies within the context of MC. We focus on two customizable product categories:
automobiles (due to the integration of MC systems into the automotive industry’s distribution
system) and foods (to extend our findings to a non-durable product category; see also Nagpal,
Lei, and Khare in press).2 The present research concludes with a discussion of why and how
2 Per the initially referenced survey, consumers’ willingness to customize these two products is above average (66% for cars and 56% for foods), but their appeal to narcissists differs; while narcissistic consumers are particularly willing to customize cars, the amount of narcissists and non-narcissists is about equal when it comes to the configuration of foods, thereby serving as a conservative test of our hypotheses.

10
retailers should consider narcissistic customers, as well as their associated states of mind,
when implementing MC systems.
Study 1: Field Evidence for Narcissists’ Desire for Uniquely Configured Products
Study 1 examines whether variations in consumer narcissism influence product
uniqueness (H1). To test this basic premise in a natural environment, we questioned recent
car buyers and analyzed their purchased automobile along with their narcissistic tendencies.
Method
Narcissism measure. The focal independent variable for Studies 1 and 3 to 5 is the
15-item short form of the Narcissistic Personality Inventory (NPI-15; Schütz, Marcus, and
Sellin 2004), a validated measure of narcissism that has been used in numerous previous
studies (e.g., Hepper, Gramzow, and Sedikides 2010). The NPI-15 assesses relevant
deviations from the normal range of self-esteem and is based on Raskin and Terry’s (1988)
concept of narcissism as a subclinical personality construct (American Psychiatric
Association 2013). For the NPI-15, respondents are given 15 pairs of phrases (α = .67); one
phrase represents a narcissistic response (e.g., “I am going to be a great person”) and the
other a non-narcissistic response (e.g., “I hope I am going to be successful”; see Appendix).
For each pair, respondents are requested to select the response closest to their own beliefs.
The number of narcissistic responses are summed to form a narcissism score ranging from
0 (not at all narcissistic) to 15 (very narcissistic). Analyses were carried out on a continuous
measure of narcissism (cf. Foster and Campbell 2007).
Uniqueness index. To examine the uniqueness of the customized automobile, we
assessed (1) car buyers’ subjective uniqueness perception as well as (2) an objective
uniqueness index. The former was based on customers’ uniqueness estimation of six essential
car attributes (e.g., “How many other customers have chosen the same sound system?”
gauged on seven-point scales with 1 = “very few,” and 7 = “many,” averaged to form a single
indicator and recoded to represent a measure of uniqueness; α = .77). To quantify product
uniqueness, we created a uniqueness index (UI), that is, an objective measure of uniqueness
based on percentage shares of the selected product options (data obtained from the car
manufacturer). For each of the six chosen options, actual percentage share data were placed
in context against the number of options for a particular attribute via the following equation:

11
11
A
i ii
PS OUI
A== −
,
where i represents the attributes (exterior color, rims, seat upholstery, decorative elements,
steering wheel, and sound system), PS refers to the percentage share of the chosen option of
the ith attribute, O refers to the number of options for the ith attribute, and A refers to the
number of attributes. A higher UI represents a more unique configured product, since
relatively unique options with lower percentage shares have a greater weighting than
relatively common options that possess higher shares. In Study 1, the UI ranged from −.39
to .57 (MUI = .11).
Procedure. Recent car buyers were recruited and compensated for participation by a
commercial market research company. Participants were selected from a database that
included customers who were confirmed to have purchased or leased a new car of a specific
brand in Germany within the last two years. Customers were only included in analyses if they
confirmed (at the end of the survey) that the car configured in the study corresponded to the
car they had actually purchased. The sample size consisted of 34 recent car buyers
(44% female; Mage = 40). Data were collected via a short online survey that asked a variety of
questions about the car purchase. Customers began by completing standardized scales: the
NPI-15 as an indication of car buyers’ narcissistic tendencies, the 10-item Rosenberg
Self-Esteem Scale (Rosenberg 1965) as a measure of self-esteem, as well as the 4-item
Knowledge of Product Class Scale (Chang 2004) gauging general car expertise. Next,
customers were asked to configure their recently purchased car by means of the original car
configurator of the manufacturer and to provide us with their configuration code
(i.e., a unique tracking code tied to a configuration and changes thereof), allowing us to
examine customers’ chosen car attributes as well as their price surcharges. The survey
concluded with the measurement of car buyers’ subjective uniqueness perception of the six
car attributes, along with demographics and a debriefing.
Pretest
We conducted a pretest to determine consumers’ ability to judge uniqueness of
product options in an MC system. Percentage share of an option serves as a reasonable
indicator of uniqueness as it represents the choice frequency of a particular option for a given
attribute (e.g., 23% of customers have chosen “silver” as the exterior color). A sample of
MBA students (N = 27) was recruited for a paper-and-pencil study, who ranked options of
12
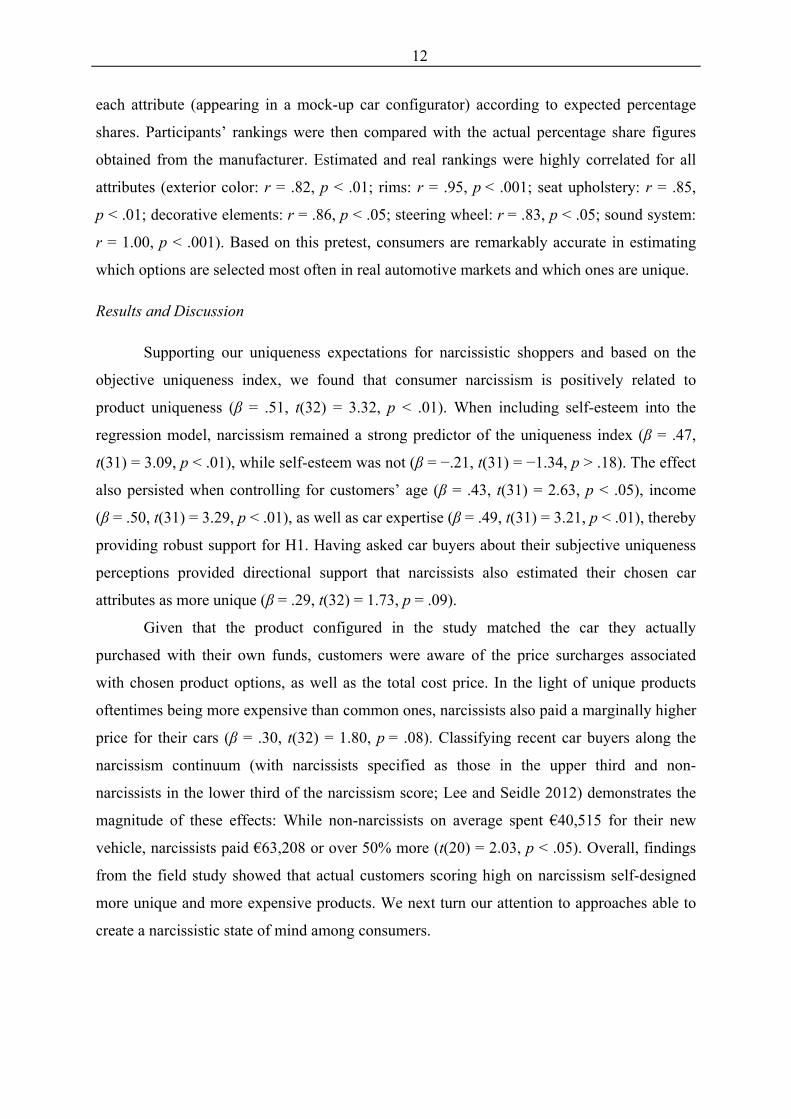
each attribute (appearing in a mock-up car configurator) according to expected percentage
shares. Participants’ rankings were then compared with the actual percentage share figures
obtained from the manufacturer. Estimated and real rankings were highly correlated for all
attributes (exterior color: r = .82, p < .01; rims: r = .95, p < .001; seat upholstery: r = .85,
p < .01; decorative elements: r = .86, p < .05; steering wheel: r = .83, p < .05; sound system:
r = 1.00, p < .001). Based on this pretest, consumers are remarkably accurate in estimating
which options are selected most often in real automotive markets and which ones are unique.
Results and Discussion
Supporting our uniqueness expectations for narcissistic shoppers and based on the
objective uniqueness index, we found that consumer narcissism is positively related to
product uniqueness (β = .51, t(32) = 3.32, p < .01). When including self-esteem into the
regression model, narcissism remained a strong predictor of the uniqueness index (β = .47,
t(31) = 3.09, p < .01), while self-esteem was not (β = −.21, t(31) = −1.34, p > .18). The effect
also persisted when controlling for customers’ age (β = .43, t(31) = 2.63, p < .05), income
(β = .50, t(31) = 3.29, p < .01), as well as car expertise (β = .49, t(31) = 3.21, p < .01), thereby
providing robust support for H1. Having asked car buyers about their subjective uniqueness
perceptions provided directional support that narcissists also estimated their chosen car
attributes as more unique (β = .29, t(32) = 1.73, p = .09).
Given that the product configured in the study matched the car they actually
purchased with their own funds, customers were aware of the price surcharges associated
with chosen product options, as well as the total cost price. In the light of unique products
oftentimes being more expensive than common ones, narcissists also paid a marginally higher
price for their cars (β = .30, t(32) = 1.80, p = .08). Classifying recent car buyers along the
narcissism continuum (with narcissists specified as those in the upper third and non-
narcissists in the lower third of the narcissism score; Lee and Seidle 2012) demonstrates the
magnitude of these effects: While non-narcissists on average spent €40,515 for their new
vehicle, narcissists paid €63,208 or over 50% more (t(20) = 2.03, p < .05). Overall, findings
from the field study showed that actual customers scoring high on narcissism self-designed
more unique and more expensive products. We next turn our attention to approaches able to
create a narcissistic state of mind among consumers.

13
Study 2a: Priming a Narcissistic State of Mind
The aim of Study 2a is to present causal evidence that narcissism (and not other,
related constructs) drives product uniqueness by demonstrating that the effects of narcissism
can be induced temporarily through a state-based approach (H2). To complement Study 1’s
field setting, we conducted this study in a controlled environment using a mock-up car
configurator.
Method
Mock-up car configurator. Configurators for automobiles offer a range of attributes
(e.g., seat upholstery) and options (e.g., leather with embossing), many of which can be
combined according to one’s own preferences. For the purpose of this research, we rebuilt the
online configurator of a large European car manufacturer. The MC system consisted of six
important car attributes (each with several options, as indicated in parentheses): exterior color
(12), rims (9), seat upholstery (8), decorative elements (6), steering wheel (6), and sound
system (3). The number of possible option combinations are vast (over 90,000 combinations
exist in our simplified configurator), thereby allowing consumers to configure a truly unique
vehicle. To obtain an unaffected indication of preferences, we did not include the price of the
presented product options in this study.
Variables. To induce a narcissistic state, we adapted the priming technique developed
by Sakellaropoulo and Baldwin (2007). In a visualization task, consumers in the “narcissism
activation” condition were asked to “describe a specific and personally experienced occasion
in which you felt you had impressed someone.” In the “acceptance activation” condition,
consumers were instructed to “describe a specific and personally experienced occasion in
which you felt you were socially accepted and/or included.” The latter approach allowed
consumers to reflect upon a socially positive experience, but without narcissistic elements
associated with the narcissism visualization. In both conditions, consumers could take as
much time as they needed (at least three minutes) to describe the requested memory.
Following, they were asked to “focus in on the memory and get it as clear as possible” and to
hold the image and accompanying feelings in mind. The dependent variable was the
uniqueness index (UI per the equation), which was computed on the basis of respondents’
configured car in the mock-up configurator.
Procedure. One-hundred and fifty-five participants who regularly used a car were
recruited through Amazon Mechanical Turk (MTurk) and were randomly assigned to

14
experimental conditions. Twenty-seven respondents who failed an instructional manipulation
check were excluded, resulting in a final sample of 128 participants (57% female; Mage = 36),
of which 63 were in the narcissism activation condition and 65 in the acceptance activation
condition. Participants were told that the study would consist of two unrelated parts, a
visualization task and a car configuration task. They were introduced to the respective version
of the visualization task before creating their preferred car using the mock-up configurator.
To do so, they passed through the configurator in a fixed order and chose one option per
attribute (similar to the manufacturer’s real online MC system). The study ended by
completion of final questions, demographics, and a debriefing.
Pretest
A pretest was conducted to ensure that the priming technique increased state
narcissism without affecting related constructs. Employing the same exclusion criteria as
previously noted, the final pretest sample included 112 respondents recruited through MTurk.
To gauge state narcissism, we used a 7-item measure adapted from Sakellaropoulo and
Baldwin (2007). This scale was developed by taking the highest loading item from each of
seven first-order principal components of the NPI-40 trait measure (Raskin and Terry 1988),
with an eye toward items that could be reworded to a state form (e.g., “Right now, I feel I am
an exceptional person”; α = .82). Similarly, we collected a 7-item state version of the
Rosenberg Self-Esteem Scale (Rosenberg 1965; α = .77) and the 20-item Positive and
Negative Affect Scale (PANAS; Watson, Clark, and Tellegen 1988; α = .88) as a measure of
current mood. Analyses revealed that the narcissism (vs. acceptance) priming increased state
narcissism (Mnarcissism = 28.47, Macceptance = 24.85; t(110) = 2.36, p < .01), but did not affect
state self-esteem (p > .21), positive affect (p > .68), nor negative affect (p > .75).
Results and Discussion
Besides encouraging state narcissism (without affecting other focal constructs, per the
pretest), we found that the narcissism priming also affected the uniqueness of shoppers’
configured cars. In support of H2, analyses determined that priming a narcissistic
(vs. non-narcissistic) state of mind significantly increased product uniqueness
(Mnarcissism = .14, Macceptance = .04; t(126) = 2.46, p < .01). These findings provide causal
evidence of the relationship between narcissism and product uniqueness in MC decisions and
suggest that practitioners have the ability to affect the uniqueness of configured products
along with consumers’ narcissistic states of mind (an issue we turn to in more detail next).

15
Study 2b: Making of the Narcissist in Marketing Practice
In the previous study, we showed that priming a narcissistic state of mind resulted in
augmented product uniqueness. In Study 2b, we build upon the conceptual core of Study 2a,
while employing a more market applicable priming technique. In so doing, we aim to broaden
the scope of our findings by providing marketers with a strategic tool to influence consumer
narcissism along with its distinct effects on product uniqueness.
Method
Variables. To generate a narcissistic state of mind, we employed an existing
automobile advertisement that displayed a car driving in a natural scene (the same car model
as used in the mock-up car configurator). For the experiment, we added a slogan that was
placed prominently in the top-left corner of the ad and varied between experimental
conditions (see Fig. 1), with effects expected similar to a lexical decision task
(cf. Sakellaropoulo and Baldwin 2007). In the “narcissism activation” condition, the slogan
read “You impress. Like the new Audi A6,” while in the “acceptance activation” condition it
was “You belong. Like the new Audi A6.” Consumers were requested to “look carefully at
the image and the slogan of the advertisement and visualize the scene” and to write down
“thoughts and feelings about the scene.” The uniqueness index (UI per the equation)
represented the dependent variable for this study.
--- Insert Fig. 1 here ---
Procedure. Eighty-seven participants who regularly used a car were recruited through
MTurk and were randomly assigned to experimental conditions. A total of 14 respondents
who failed an instructional manipulation check were excluded, resulting in a final sample
of 73 participants (43% female; Mage = 34), of which 36 participants were in the narcissism
activation condition and 37 in the acceptance activation condition. The study consisted of
two parts; the advertisement evaluation task (which included the experimental manipulation
and lasted for two minutes) and the configuration of one’s preferred car via the mock-up car
configurator. Final questions, demographics, and a debriefing concluded the study.
Pretest
To ensure the ad-based priming technique increased state narcissism without affecting
related constructs, we employed a pretest (N = 62) conducted through MTurk. As in the
pretest of Study 2a, we presented respondents with the experimental conditions and measured

16
state narcissism (α = .89), state self-esteem (α = .76), and current mood (α = .89). Results
revealed that the narcissism (vs. acceptance) priming significantly increased state narcissism
(Mnarcissism = 29.30, Macceptance = 23.72; t(60) = 2.41, p < .01), but did not affect state self-
esteem (p > .14), positive affect (p > .22), nor negative affect (p > .11).
Results and Discussion
While the ad-based priming increased state narcissism in the pretest, it also affected
the uniqueness of consumers’ configured cars. In particular, priming a narcissistic
(vs. non-narcissistic) state of mind significantly increased objective product uniqueness
(Mnarcissism = .10, Macceptance = −.03; t(71) = 2.20, p < .05), providing additional support for H2.
This finding suggests an efficient tool for marketers to influence the uniqueness of configured
products. Thus far, we have established that trait narcissism (Study 1) and state narcissism
(Studies 2a and 2b) lead to the self-design of more unique products when using an MC
system. Next, we explore how narcissistic consumers respond to the provision of uniqueness
information about the configured product.
Study 3a: Narcissists’ Response to Product Uniqueness Feedback
Mass customization systems seem to be a particularly promising environment to
accentuate the agentic self-beliefs of narcissistic shoppers. This study examines how product
uniqueness feedback affects product evaluations of consumers who vary in their levels of
narcissism (H3a) while providing an additional test for H1.
Method
Variables. As in Study 1, consumers completed the NPI-15 as a measure of
narcissism (α = .80). After configuring their preferred car, consumers received feedback on
the uniqueness of their configuration. The feedback was introduced as follows: “The Audi A6
you have configured is now being compared against the manufacturer’s database. This
database contains all 36,596 Audi A6 vehicles that have been configured in Germany during
this year. After the matching, you will receive feedback about how unique or standard your
car is compared to the vehicles in the database.” Next, a programmed delay (including a
computer-based loading sign with feedback on the supposed process) led consumers to
believe their configuration was being compared with the database. Subsequently, consumers
were randomly assigned to manipulated feedback. For the “unique feedback” (“non-unique

17
feedback”) condition, consumers read: “Comparing your vehicle against the manufacturer’s
database produced the following results: Your configured Audi A6 is (not) a unique vehicle
for this market. No Audi A6 (Many Audi A6s) delivered in Germany during this year was
(were) similar to yours. You have configured a vehicle that is not equivalent (equivalent) to a
standard configuration.”
The primary dependent variable was consumers’ perceived feelings of
accomplishment about the customized car (three items on seven-point Likert scales, e.g.,
“I feel proud of having accomplished something”; α = .94), a key success driver of current
MC systems (Franke et al. 2010). In addition, we assessed consumers’ satisfaction with the
customized product (five items on seven-point Likert scales, e.g., “All in all, I am satisfied
with my choice of car”; α = .61), as a general measure of choice satisfaction (Hildebrand et
al. 2013). As in the previous studies, we employed the uniqueness index (UI per the equation)
as objective measure of product uniqueness.
Procedure. The sample (N = 109) included panel members from a commercial
research firm who were compensated for participation and randomly assigned to treatment
conditions. Participants were only eligible for the study if they regularly used a car.
Seventeen consumers who did not perceive the feedback as realistic were excluded from
further analyses. Thus, 92 participants (55% female; Mage = 40) were included in the main
analysis, with a roughly equal distribution between the unique (n = 49) and non-unique
(n = 43) feedback conditions. After agreeing to participate, consumers completed the NPI-15
to assess narcissistic tendencies. Next, participants configured their car using the mock-up
configurator, which was followed by the experimental feedback. At the end of the study, but
before being debriefed, participants completed evaluative measures of the configured product
as well as demographics.
Results and Discussion
Consumers’ narcissistic tendencies moderated the effect of uniqueness feedback on
product evaluations. Regressing feelings of accomplishment on narcissism, uniqueness
feedback (unique feedback = 1, non-unique feedback = 0), and their interaction showed the
predicted significant interaction (β = .44, t(88) = 2.13, p < .05), while no main effects
emerged. We used the Johnson-Neyman technique to identify ranges of narcissism for which
the simple effect of uniqueness feedback was significant (cf. Spiller et al. 2013). This
“floodlight analysis” revealed a significant positive effect of unique (vs. non-unique)
feedback on feelings of accomplishment for anyone with a narcissism score greater than 5.89

18
(see Fig. 2, Panel a). We obtained similar results for consumers’ satisfaction with the
customized product, as indicated by a significant interaction between narcissism and
uniqueness feedback (β = .44, t(88) = 2.07, p < .05). Specifically, there was a significant
positive effect of unique (vs. non-unique) feedback on satisfaction for any consumer with a
narcissism score greater than 6.71 (see Fig. 2, Panel b). These results both support H3a.
--- Insert Fig. 2 here ---
In line with the field study and H1, we also found narcissism to result in more
objectively unique product configurations (β = .29, t(90) = 2.90, p < .01), providing renewed
support for a robust narcissism-uniqueness relationship. This effect remained stable when
controlling for consumers’ age (β = .28, t(89) = 2.80, p < .01), income (β = .29, t(89) = 2.90,
p < .01), and car expertise (β = .27, t(89) = 2.72, p < .01).
In addition to replicating the findings from the field study, Study 3a demonstrated that
narcissistic consumers react strongly to feedback on their final product’s level of uniqueness.
When told that their configured product was not unique, narcissists felt less accomplishment
and less satisfaction about their self-designed product. These effects on product evaluation
appear to be driven by both increases from unique feedback, as well as decreases from non-
unique feedback (see Fig. 2). This study’s findings provide further evidence that narcissists
attach considerable importance to creating unique products and demonstrate one way firms
can use MC systems to increase customers’ evaluations of configured products.
Study 3b: The Influence of Option Uniqueness Information
While Study 3a examined the effect of feedback regarding the uniqueness of the final
product on consumers’ product evaluations, Study 3b explores the impact of providing
uniqueness information about product options on consumers’ choices of those options (H3b).
Method
Variables. The NPI-15 measure of narcissism (α = .76) served as the key independent
variable. Within the mock-up car configurator, we presented option uniqueness information
as the percentage share (relative to other options) for a particular attribute. Consumers read:
“The percentage share of a product option indicates its choice frequency relative to other
options. A share of 50% would therefore indicate that many people choose this option
(i.e., it corresponds to a standard option), while a share of 1% would indicate that the option
is chosen only occasionally.” The percentage share values were randomly assigned to options

19
for a particular attribute. For instance, the real percentage share of “alloy wheels 5 segment
spokes” is 6%, “alloy wheels 10 spokes” is 13%, and “forged wheels 6 arm” is 23%. In this
study, we manipulated these figures by randomly assigning percentages to options of an
attribute, so the percentage share of “alloy wheels 5 segment spokes” could have been 13% or
23% (instead of 6%). The primary dependent variable represented whether consumers chose
product options with low vs. high (manipulated) percentage shares. This choice variable was
measured through the same uniqueness index used in Study 1 (UI per the equation), but using
the manipulated percentage shares instead of real ones.
Procedure. Participants (N = 66; 42% female; Mage = 42) included panel members
from a commercial research firm who were compensated for participation, and were only
eligible if they regularly used a car. Participants began by completing the NPI-15 narcissism
measure. After self-designing their preferred car using our mock-up configurator (including
manipulated percentage share information), participants completed demographics and were
debriefed.
Results and Discussion
Regression analysis showed that narcissism positively influenced the choice of
product options with low (manipulated) percentage share (β = .25, t(64) = 2.04, p < .05).
These findings provide support for a systematic relation between narcissism and emphasis on
a product option’s uniqueness (H3b). Narcissistic consumers shopped for relatively unique
options (those with low percentage share) and adjusted their car configuration according to
this information, thereby placing product uniqueness over personal preferences. Thus,
providing option uniqueness information could be a useful means for firms to guide
customers, especially narcissistic ones, in their configuration process.
Study 4: The Mediating Role of Feelings of Superiority
Our empirical studies have shown thus far that consumers’ narcissistic tendencies are
an important driver of product uniqueness, that the priming of narcissistic states of mind
yields similar outcomes, and that narcissistic consumers significantly respond to provided
uniqueness information. We next explore the underlying processes of the narcissism-
uniqueness link and test whether this effect is mediated by consumers’ feelings of superiority
(H4).

20
Method
Variables. While the NPI-15 narcissism measure (α = .80) served as the primary
independent variable, we also collected two possible mediators. Cognitive consequences of
consumers’ feelings of superiority were obtained by the Better-Than-Average Self-Construal
Scale comprising 9 items (e.g., “Many people suffer from inferiority feelings. I, on the
contrary, oftentimes have the feeling of superiority”; Bierhoff 2014; α = .75). The scale taps
into inflated self-assessments and has been shown to be a reliable and consistent measure of
superiority feelings. Given prior research showing that consumers’ need for uniqueness
influences customization experiences (cf. Franke and Schreier 2008), we also assessed the
Creative Choice Counterconformity subscale of the Consumers’ Need for Uniqueness
measure (the subscale includes 11 items, such as “I collect unusual products as a way of
telling people I’m different”; Tian, Bearden, and Hunter 2001; α = .95).1 Similar to the
previous studies, we computed the uniqueness index (UI per the equation) serving as the
primary dependent variable.
Procedure. Participants (N = 213; 48% female; Mage = 41) included panel members
from a commercial research firm who regularly used a car and were compensated for
participation. Data were collected online via the mock-up car configurator. Participants
completed the NPI-15 before configuring their car. Finally, participants responded to the
putative mediators (feelings of superiority and need for uniqueness) along with
demographics, before being debriefed.
Results and Discussion
Discriminant validity between narcissism, feelings of superiority, and need for
uniqueness was examined by comparing the average variance extracted (AVE) values for
each pair of constructs with the Φ2 value between them (cf. Fornell and Larcker 1981). No Φ2
is greater than the individual AVE values, thereby supporting the discriminant validity of the
scales. A scree plot further confirmed unidimensionality of the narcissism scale as indicated
by a large drop in eigenvalues from the first (4.04) to the second component (1.39) and a
subsequent flattening of the curve (e.g., 1.22 for the third component). The good Cronbach
alpha score (α = .80) provided further support for the scale’s high internal consistency.
To test underlying processes, we employed a mediation model with bootstrapped
estimates (cf. Preacher and Hayes 2008) and included narcissism as the independent variable,
feelings of superiority as mediator, and the uniqueness index as the key outcome variable. In

21
line with our previous studies, the bootstrap test identified a significant total effect of
narcissism on product uniqueness (c = 7.35, p < .05; see Fig. 3), providing renewed support
for H1. Importantly, the indirect effect of feelings of superiority was positive and significant
(a × b = 4.71), with a 95% confidence interval (CI) excluding zero (1.26 to 8.88). The direct
effect of narcissism on product uniqueness was no longer significant after including feelings
of superiority into the model (c’ = 2.64, p > .44), thereby establishing full mediation and
supporting H4. Specifying the same model but controlling for consumers’ need for
uniqueness also yielded a significant indirect effect (a × b = 3.70, 95% CI: .45 to 7.38) as
well as a full mediation (c’ = 1.13, p > .75).
--- Insert Fig. 3 here ---
Study 4 showed that narcissists’ enhanced feelings of superiority underlie the
narcissism-uniqueness relationship. These findings suggest that uniquely configured
products, and more broadly the use of MC systems, help narcissists to self-enhance as
expressed by their sense of superiority.
Study 5: Boundary Conditions of the Narcissism-Uniqueness Link
By experimentally diminishing consumers’ feelings of superiority in Study 5, we
provide further support for the underlying process and reveal a boundary condition for the
narcissism-uniqueness link (H5). We focus on a non-durable product (i.e., the emerging
customization of foods in retailing; Nagpal et al. in press) in order to assess the
generalizability of our findings.
Method
Mock-up food configurator. Following a US retail chain, we developed a cupcake
configurator (“Baked by Anna-Louise”). While the configurator allowed consumers to
customize their preferred product as in previous studies, the product category in Study 5 is
distinct in a variety of ways, including lower price, shorter product life cycle, and less
consumer knowledge about product options. The cupcake configurator enabled consumers to
customize four attributes (cake, icing, topping, and stuffing), with each attribute including
four options. Given weaker consumer knowledge about product options, we provided
consumers with an indication of uniqueness by randomly assigning one of the four options
the following sign: “Be the first to taste it. No other customer has chosen this particular
option yet today.” Consumers’ understanding of the sign was tested at the end of the study.

22
Variables. Besides the NPI-15 narcissism measure (α = .87), this study included
a mental simulation task as a second independent variable. Specifically, we manipulated
feelings of superiority by asking consumers to imagine a performance review at work. In the
“equality feedback” condition, consumers read that “your performance was on average during
the last work period. Indeed, you performed similarly to your colleagues.” In the “superiority
feedback” condition, consumers were told that “your performance was above average during
the last work period. Indeed, you performed clearly better than your colleagues.” After the
treatment, all consumers wrote down three thoughts or feelings related to the performance
feedback. As a manipulation check, we measured current feelings of superiority (“How do
you feel right now?” with the three items “superior,” “predominant,” and “surpassing” on
seven-point Likert scales; α = .88). To distinguish superiority from uniqueness, we also
included three items measuring current feelings of uniqueness (“unique,” “distinct,” and
“unparalleled”; α = .83). Compared to the approach used for the more complex car
configurator, the primary dependent variable in Study 5 was a simple measure of uniqueness
computed as the number of unique product options chosen (containing the “Be the first to
taste it” sign) and ranged from 0 to 4 (Muniqueness = 1.46).
Procedure. Ninety-two participants were recruited through MTurk and were randomly
assigned to experimental conditions. Fourteen respondents who failed an instructional
manipulation check (cf. Goodman, Cryder, and Cheema 2013) were excluded from further
analyses, resulting in a final sample of 78 participants (38% female; Mage = 32), of which 36
were in the equality feedback condition and 42 in the superiority feedback condition.
Participants began the study by completing the mental simulation task comprising the
performance feedback. They were then introduced to the cupcake configurator and asked to
configure their preferred cupcake by choosing from various options offered over four
attributes. The study finished with completion of a manipulation check, final questions, and
demographics, followed by a debriefing.
Results and Discussion
As intended, the equality feedback significantly reduced feelings of superiority
(Mequality = 3.69) relative to the superiority feedback (Msuperiority = 4.25; t(76) = 2.00, p < .05),
but did not affect uniqueness feelings (p > .12). In contrast to Study 3a, in which the
moderator was a continuous variable (narcissism), Study 5 used a simple slope analysis
(Hayes 2013) to examine the moderating role of induced feelings of equality. Regressing the
number of unique product options chosen on narcissism (mean centered), performance

23
feedback (superiority feedback = 0, equality feedback = 1), and their interaction revealed a
significant simple effect of narcissism (β = .34, t(74) = 2.16, p < .05), thereby supporting H1
in a new product context, and a qualifying significant interaction (β = −.50, t(74) = −2.21,
p < .05). Estimating the same model but recoding the dichotomous moderating variable
(superiority feedback = 1, equality feedback = 0) shows that induced feelings of equality
eliminated the positive relationship between narcissism and product uniqueness (β = −.16,
t(74) = −0.99, p > .32; see Fig. 4 for the simple slopes). These results support H5.
--- Insert Fig. 4 here ---
Studies 4 and 5 provide converging evidence for feelings of superiority standing at the
center of narcissists’ desire for creating unique products (H4 and H5). Study 5 replicates the
effect of narcissism on product uniqueness in a different category and provides a mechanism
to mitigate narcissists’ preference for creating unique products (an issue we further discuss in
the general discussion).
General Discussion
Mass customization systems allow retailing and manufacturing firms to pursue multi-
channel distribution strategies while providing their customers with the opportunity to create
individualized, unique products. Yet field evidence indicates that few shoppers actually use
the full individualization potential of these web-based product configurators. Given the
importance of this market segment in terms of product diffusion and profit margins, we
sought to shed light on the nature of these consumers by examining their drivers for
configuring products in such a unique way. Our findings indicate that trait and state
narcissism lead consumers to express their felt superiority through the customization of
unique products, thereby exploiting the largely untapped potential of MC systems.
In a series of seven studies, we established that consumers high in trait narcissism or
primed with state narcissism tend to choose product options that are selected by few other
consumers, therefore self-designing more unique products using MC systems (a finding we
demonstrated in both durable and non-durable product categories). The state-based priming
approaches provide causal evidence for the narcissism-uniqueness relationship and
demonstrate how firms can promote the uniqueness of configured products through
advertising (Studies 2a and 2b). In line with our reasoning, we showed that feedback
regarding the uniqueness of the configured product and the product’s options differentially
influences narcissistic consumers (Studies 3a and 3b). Exploring the underlying processes of
24
these effects, we found that feelings of superiority constitute an important motivation for
narcissists when configuring a unique product, thereby establishing feelings of superiority as
a mediator and boundary condition of the narcissism-uniqueness link (Studies 4 and 5). In the
following sections, we explore the implications of these findings for theory, practice, and
future research.
Implications for Research
While the customization literature has focused to a large extent on the advantages of
MC systems (compared to conventional choice formats; e.g., Huffman and Kahn 1998;
Valenzuela et al. 2009), few researchers have examined how such systems can be best
designed to correspond with (and perhaps even influence) consumers’ motives. The
opportunity provided by MC systems to show the world that “I made it myself” is tailored to
narcissists’ inherent desire to distinguish themselves from others. In support of this, our
research shows how narcissism (both as a trait and state of mind) is translated into product
configuration. The mediating role of feelings of superiority demonstrates that the self-
enhancing tendency of narcissists is directly influential on the self-design of their products.
Indeed, the purchase and consumption of unique products allows narcissists to attract the
attention of other consumers and to impress them.
A variety of reasons motivated us to focus our investigation on consumer narcissism
and not on related constructs such as need for uniqueness, materialism, or egocentrism.
First, narcissism is a broad personality construct with a long-standing history and is likely to
underlie more specialized trait measures. Because of narcissists’ agentic self-beliefs and their
strong motivation to be rewarded (Foster, Misra, and Reidy 2009), they are more likely to
approach not only people but also material goods (thereby fostering materialism) and are
primarily interested in rewarding themselves while ignoring others (related to egocentrism).
Second, rising incidence rates have led researchers to refer to a “narcissism epidemic”
(Twenge and Campbell 2009), with even the New York Times “seeing narcissists
everywhere” (Quenqua 2013). Such far-reaching societal changes make it relevant to study
their consequences on today’s and tomorrow’s marketing efforts. Third, narcissism is a
multifaceted construct that encompasses several sub dimensions being responsible for the
customization of unique products, such as narcissists’ desire for self-aggrandizement and
self-enhancement (Sedikides et al. 2007), which in turn drives their need for uniqueness.
Finally, narcissism can be primed and used by practitioners (as detailed in the implications
for practice).

25
Our research contributes to the understanding of agentic self-beliefs being central to
the narcissist’s self-identity. We demonstrated that a measure of superiority feelings mediated
the effect of narcissism on the uniqueness of a configured product and further showed that
experimentally influencing feelings of superiority moderated observed effects. Together,
these findings place feelings of superiority as a key explanatory factor for the narcissist’s
crave for unique products and, at the same time, shed light on the underlying reasons why
consumers use MC systems. While previous research has attributed the economic value of
mass-customized products to increased preference fit, design effort, and awareness of being
the creator (Franke et al. 2010), our findings suggest that superior self-presentation may
represent an additional factor determining the success of MC systems.
Some of the strongest findings regarding the link between narcissism and product
uniqueness were obtained using state narcissism (rather than trait narcissism). The results
of two experiments support our assertion that induced state narcissism increases
the uniqueness of consumers’ self-designed products. These findings reflect the contention
that a person’s level of narcissism can change over time, similar to Baumeister and Vohs’
(2001) state of narcissistic myopia characterized by a “heightened desire for admiration”
(p. 208), and demonstrate how state narcissism can influence shoppers’ behavior. Given that
our manipulation only affected state narcissism, but not related constructs such as state self-
esteem, the priming results provide solid evidence for a causal relationship between
consumer narcissism and the uniqueness of a configured product. Together with the extensive
effects of trait narcissism and the fact that we used two different manipulations of state
narcissism, our findings are generalizable across different techniques of implementation.
Implications for Practice
Consumers who self-design uncommon, unique products can speed up product
diffusion and enhance profit margins because of their willingness to pay a price premium.
Given their preference for unique products, narcissistic consumers (or those in a narcissistic
state) are of considerable economic importance to firms employing MC systems. In the
current research, we identified narcissistic consumers through the NPI-15 (Schütz et al.
2004), a well-established measure of narcissism that allows MC providing firms to identify
and understand their key market segment. Are there other ways that narcissists can be
identified in the marketplace?
Building on people’s tendency to outwardly express their personality via everyday
cues, several strategies allow firms to identify the narcissistic consumer. First, narcissists can

26
be recognized by their physical appearance, as they are more likely to wear expensive,
ostentatious clothing and to have a neat appearance (Vazire et al. 2008). Second, narcissists
can be identified according to their work space, given that their office is likely to include
specific physical characteristics (e.g., awards or self-promoting pictures of oneself).
Similarly, their prominence in presentations, use of first-person singular pronouns, or salary
demands can be used to determine people’s level of narcissism (Chatterjee and Hambrick
2007). Third, and most promising for firms using MC systems, narcissistic consumers can be
traced online via personal web sites or online social networks. Narcissists not only spend
more time on such networks, but also share more self-promoting content, use I-centered
communication more frequently (e.g., in the “About me” section of Facebook), and upload
more “selfies” (Buffardi and Campbell 2008; Fox and Rooney 2015).
Our empirical results, however, indicate that firms need not identify true narcissists in
order to apply the findings of our research. As shown in Studies 2a and 2b, a firm can create
a narcissistic state of mind using marketing communications and realize similar benefits in
terms of having consumers self-design more unique products. While our final study used an
ad-based manipulation, firms could use numerous promotional vehicles to create a
narcissistic state. For example, a recent email-based promotion by Nike (a manufacturer that
has direct consumer access through mono-brand retail stores and MC systems such as
NIKEiD) pictured a customized shoe stating “My mass-customized Nike shoes look
amazing.” Applying the current findings would simply require changing this tagline to a
narcissist-based appeal (e.g., “My unique mass-customized Nike shoes impress”) in order to
induce a narcissistic state that encourages the self-design of a truly unique product. In those
instances where firms want to direct consumers toward less unique product options
(e.g., if those options are more cost effective or easier to manufacture), marketers could
remind narcissists that they are similar or equal to other consumers (thereby reducing feelings
of superiority as demonstrated in Study 5). Similar approaches are conceivable in an
environment where uniqueness is not desirable from a policy or broader societal perspective.
For instance, people often do not adequately diversify their retirement plans, investing into
single stocks (i.e., the unique option) instead of multiple funds or standard indices such as the
S&P 500―even though the latter typically outperforms the former in the long run and
therefore puts people’s financial future at risk (Harding 2013; Morrin et al. 2012).
Once narcissistic consumers have been identified or a narcissistic state of mind has
been created, firms using MC systems can benefit by indicating the uniqueness of product
options (e.g., via percentage shares) and / or the final, configured product itself

27
(e.g., by indicating how often the exact same product was configured). With such feedback,
both narcissistic and non-narcissistic consumers can opt for their preferred level of product
uniqueness. For example, firms could program a pop-up message to appear after consumers
have configured a truly unique product, which is relatively likely given the vast number of
product attributes and options within many configurators (e.g., the Audi configurator permits
several million different combinations of options). If a truly unique product has been
configured, firms could even allow customers to block their specific configuration for a
period of time (and in return of a price premium), thereby ensuring that the configured
product stays unique in the near future.
For retailing firms, MC systems provide the distinct opportunity to create and make
use of new distribution channels, which in turn enable them to pursue a multi-channel
distribution strategy that can increase customer satisfaction and loyalty (Wallace et al. 2004).
In so doing, our findings help retailers to identify which consumers should be targeted via
MC systems, and who should continue using conventional choice formats that do not require
the additional effort inherent to MC (Broniarczyk and Griffin 2014; Hildebrand et al. 2014).
In addition, the reported priming approaches may not only enable retailers to increase the
share of consumers who exert MC systems, but also to make sure that they use the full
potential of these systems by creating truly unique products. The present findings thus
facilitate retailers’ customer targeting and segmentation efforts and suggest, more broadly,
that MC systems are a promising (but mostly unexploited) instrument for traditional retailing
firms. While customized in-store shopping is available in a few product domains
(e.g., Subway sandwich or IKEA cupboard), MC bears a much larger potential for retailers
such as Walmart (e.g., in-store customization of clothes or integration of MC systems on
www.walmart.com).
At a broader level, our investigation illustrates that choice architectures should be
built upon a deeper understanding of the consumers who make particular use of them. The
reported findings demonstrate the importance of offering a variety of customizable attributes
and options for markets where narcissistic consumers are likely to exist. However, an
analysis of the online configurators of the 20 most-sold car brands in the US, Germany, and
China reveals that the most customizable MC systems are found in the German (rather than in
the US) market, while in East Asia customization is just emerging for retailers and
manufacturers (Accenture 2012)―a pattern that is evident across different industries. This
seems surprising in the light of narcissistic propensities being at least as high in the US than
in Western Europe (Twenge and Campbell 2009), and continuously increasing in East Asia

28
(Cai, Kwan, and Sedikides 2012). Indeed, firms operating in such consumer markets should
consider adding more attributes and options to their MC systems. Those firms operating in
markets with fewer narcissists, however, could implement our research findings by creating a
narcissistic state of mind among their market segments using promotions and other marketing
instruments to enhance people’s agentic self-beliefs.
Limitations and Future Research
As with any research, certain limitations exist that provide opportunities for future
researchers. One such point regards the generalizability of our findings to purchase decisions
where there is less involvement of one’s self-identity. Our studies focused on configurators
from two different product categories, with both MC systems providing an opportunity for
narcissists to stand out from other consumers. Possibly, narcissists would play a more
subordinate role within less identity-relevant domains (e.g., the customization of utilitarian
products; Berger and Heath 2007) where boasting about one’s achievements is less rewarding
and self-involving. In such domains, narcissists are likely to conform to the preferences of
others and place more emphasis on the functionality of the product. Therefore, research
exploring consumers’ narcissistic behavior regarding non-identity products may be useful.
While the cost of the final product and its product options were available to customers
in the field study, we did not provide such information in the subsequent studies to obtain an
unaffected indication of preferences. This, however, may have diminished the size of our
reported effects due to the supportive information that higher prices provide for unique
options (i.e., more expensive products are usually also more unique). Indication of price
could lead to some new and intriguing conclusions. Given that narcissistic consumers want to
signal superiority and uniqueness, choosing more expensive options might be an important
factor in their decisions. In other words, one can signal uniqueness either by selecting unique
product options or by choosing options that are higher priced. This suggests an interesting
boundary condition—it could be that narcissists choose less unique options if the associated
costs can effectively signal uniqueness. Furthermore, priming of state narcissism offers some
rewarding new paths for consumer researchers. For instance, when having the choice between
two web-based architectures, consumers in a narcissistic state of mind should prefer and more
often use MC systems rather than simply choosing from pre-configured products.
Given their desire for admiration (Baumeister and Vohs 2001) and self-affirmation
(Morf and Rhodewalt 2001), narcissists are likely to exchange information with other
consumers. Such social information plays a key role in modern MC systems (Hildebrand et

29
al. 2013; Moreau and Herd 2010), which have become increasingly connected to online
social networks (so-called social configurators). For example, car manufacturers have
recently launched web-based tools enabling customers to easily share, discuss, and improve
their configured products. In the light of narcissists’ pronounced sensitivity to social feedback
and their enhanced use of online social networks (which provide social recognition),
promising future research could study how narcissists respond to and present social
information about a configured product. While narcissistic consumers are likely to search for
praise of their customized product on Facebook, too many “likes” may indicate that the
configuration is mainstream and thus diminish its perceived uniqueness and its appeal to the
narcissist. Other research aimed at understanding the role of narcissists within social
configurators could be particularly useful for firms that are able to employ the inherent social
power of the narcissist to further the use and adoption of MC systems within non-narcissistic
segments of the market.
Conclusion
Our empirical findings indicate that narcissistic consumers (or those in a narcissistic
state of mind) account for some of the heterogeneity of products configured with MC
systems, as these consumers systematically deviate from the mainstream in order to define
their superior identity with unique products. In the light of the distinct benefits of unique
products, narcissists appear to be an important market segment for firms offering MC
systems. At the same time, ever increasing narcissism rates around the globe are likely to
increase demand for individualized and more colorful products―a trend that might be further
enhanced by firms creating narcissistic states of mind and stands in stark contrast to Henry
Ford’s vision of solely black-colored cars.

30
References
Accenture (2012), “Asia Consumer Product Trends: Implications for Retailers and
Manufacturers,” (accessed February 1, 2015), [available at
http://www.accenture.com/us-en/Pages/insight-asia-consumer-product-trends-
implications-retailers-manufacturers.aspx].
American Psychiatric Association (2013), Diagnostic and Statistical Manual of Mental
Disorders (5th Edition). Washington, DC: American Pychiatric Association.
Baumeister, Roy F. and Kathleen D. Vohs (2001), “Narcissism as Addiction to Esteem,”
Psychological Inquiry, 12 (4), 206–10.
Berger, Jonah and Gráinne Fitzsimons (2008), “Dogs on the Street, Pumas on Your Feet:
How Cues in the Environment Influence Product Evaluation and Choice,” Journal of
Marketing Research, 45 (1), 1–14.
——— and Chip Heath (2007), “Where Consumers Diverge from Others: Identity Signaling
and Product Domains,” Journal of Consumer Research, 34 (2), 121–34.
Bierhoff, Hans-Werner (2014), “Facets of Narcissism: Better-Than-Average, Quest for
Exclusiveness and Self-Monitoring,” manuscript in preparation, Department of Social
Psychology, Ruhr-University Bochum, Germany.
Broniarczyk, Susan M. and Jill Griffin (2014), “Decision Difficulty in the Age of Consumer
Empowerment,” Journal of Consumer Psychology, 24 (4), 608–25.
Buffardi, Laura E. and W. Keith Campbell (2008), “Narcissism and Social Networking Web
Sites,” Personality and Social Psychology Bulletin, 34 (10), 1303–14.
Cai, Huajian, Virginia S. Y. Kwan, and Constantine Sedikides (2012), “A Sociocultural
Approach to Narcissism: The Case of Modern China,” European Journal of
Personality, 26 (5), 529–35.
Campbell, W. Keith and Joshua D. Foster (2007), “The Narcissistic Self: Background, an
Extended Agency Model, and Ongoing Controversies,” in Frontiers in Social
Psychology: The Self, Constantine Sedikides and Steven J. Spencer, eds. Philadelphia,
PA: Psychology Press, 115–38.
——— , Eric A. Rudich, and Constantine Sedikides (2002), “Narcissism, Self-Esteem, and
the Positivity of Self-Views: Two Portraits of Self-Love,” Personality and Social
Psychology Bulletin, 28 (3), 358–68.

31
Chang, Chingching (2004), “The Interplay of Product Class Knowledge and Trial Experience
in Attitude Formation,” Journal of Advertising, 33 (1), 83–92.
Chatterjee, Arijit and Donald C. Hambrick (2007), “It’s All about Me: Narcissistic Chief
Executive Officers and Their Effects on Company Strategy and Performance,”
Administrative Science Quarterly, 52 (3), 351–86.
Coker, Brent and Anish Nagpal (2013). “Building-Up versus Paring-Down: Consumer
Responses to Recommendations When Customizing,” Journal of Retailing, 89 (2),
190–206.
de Bellis, Emanuel, Christian Hildebrand, Kenichi Ito, and Andreas Herrmann (in press),
“Cross-National Differences in Uncertainty Avoidance Predict the Effectiveness of
Mass Customization across East Asia: A Large-Scale Field Investigation,” Marketing
Letters.
Dhar, Ravi and Klaus Wertenbroch (2012), “Self-Signaling and the Costs and Benefits of
Temptation in Consumer Choice,” Journal of Marketing Research, 49 (1), 15–25.
Eliason, Erik (2012), “3 Reasons Why Mass Customization Is the Future of Consumer
Products,” The Huffington Post, (accessed February 1, 2015), [available at
http://www.huffingtonpost.com/erik-eliason/mass-customization_b_1313875.html].
Emmons, Robert A. (1984), “Factor Analysis and Construct Validity of the Narcissistic
Personality Inventory,” Journal of Personality Assessment, 48 (3), 291–300.
——— (1987), “Narcissism: Theory and Measurement,” Journal of Personality and Social
Psychology, 52 (1), 11–17.
Ford, Henry (1922), My Life and Work. New York: Cosimo, Inc.
Fornell, Claes and David F. Larcker (1981), “Structural Equation Models With Unobservable
Variables and Measurement Error: Algebra and Statistics,” Journal of Marketing
Research, 18 (1), 382–88.
Foster, Joshua D. and W. Keith Campbell (2007), “Are There Such Things as ‘Narcissists’ in
Social Psychology? A Taxometric Analysis of the Narcissistic Personality Inventory,”
Personality and Individual Differences, 43 (6), 1321–32.
——— , Tiffany A. Misra, and Dennis E. Reidy (2009), “Narcissists Are Approach-Oriented
Toward Their Money and Their Friends,” Journal of Research in Personality, 43 (5),
764–69.
——— , Jessica W. Shenesey, and Joshua S. Goff (2009), “Why Do Narcissists Take More
Risks? Testing the Roles of Perceived Risks and Benefits of Risky Behaviors,”
Personality and Individual Differences, 47 (8), 885–89.

32
Fox, Jesse and Margaret C. Rooney (2015), “The Dark Triad and Trait Self-Objectification as
Predictors of Men’s Use and Self-Presentation Behaviors on Social Networking
Sites,” Personality and Individual Differences, 76 (1), 161–5.
Franke, Nikolaus and Martin Schreier (2008), “Product Uniqueness as a Driver of Customer
Utility in Mass Customization,” Marketing Letters, 19 (2), 93–107.
——— , ——— , and Ulrike Kaiser (2010), “The ‘I Designed It Myself’ Effect in Mass
Customization,” Management Science, 56 (1), 125–40.
Goodman, Joseph K., Cynthia E. Cryder, and Amar Cheema (2013), “Data Collection in a
Flat World: The Strengths and Weaknesses of Mechanical Turk Samples,” Journal of
Behavioral Decision Making, 26 (3), 213–24.
Harding, Sy (2013), “Swear Off Individual Stocks For Better Returns,” Forbes, (accessed
February 1, 2015), [available at http://www.forbes.com/sites/greatspeculations/2013/
03/22/swear-off-individual-stocks-for-better-returns].
Hayes, Andrew F. (2013), Introduction to Mediation, Moderation, and Conditional Process
Analysis: A Regression-Based Approach. New York: The Guilford Press.
Hepper, Erica G., Richard H. Gramzow, and Constantine Sedikides (2010), “Individual
Differences in Self-Enhancement and Self-Protection Strategies: An Integrative
Analysis,” Journal of Personality, 78 (2), 781–814.
Hildebrand, Christian, Gerald Häubl, Andreas Herrmann, and Jan R. Landwehr (2013),
“When Social Media Can Be Bad for You: Community Feedback Stifles Consumer
Creativity and Reduces Satisfaction with Self-Designed Products,” Information
Systems Research, 24 (1), 14–29.
——— , ——— , ——— (2014), “Product Customization via Starting Solutions,” Journal of
Marketing Research, 51 (6), 707–25.
Huffman, Cynthia and Barbara E. Kahn (1998), “Variety for Sale: Mass Customization or
Mass Confusion?” Journal of Retailing, 74 (4), 491–513.
Krizan, Zlatan and Brad J. Bushman (2011), “Better than My Loved Ones: Social
Comparison Tendencies Among Narcissists,” Personality and Individual Differences,
50 (2), 212–16.
Kruger, Justin and David Dunning (1999), “Unskilled and Unaware of It: How Difficulties in
Recognizing One’s Own Incompetence Lead to Inflated Self-Assessments,” Journal
of Personality and Social Psychology, 77 (6), 1121–34.

33
Lee, Seung Yun, Aiden P. Gregg, and Seong Hoon Park (2013), “The Person in the Purchase:
Narcissistic Consumers Prefer Products that Positively Distinguish Them,” Journal of
Personality and Social Psychology, 105 (2), 335–52.
——— and Russell Seidle (2012), “Narcissists as Consumers: The Effects of Perceived
Scarcity on Processing of Product Information,” Social Behavior and Personality,
40 (9), 1485–500.
Moreau, C. Page, Leff Bonney, and Kelly B. Herd (2011), “It’s the Thought (and the Effort)
That Counts: How Customizing for Others Differs from Customizing for Oneself,”
Journal of Marketing, 75 (5), 120–33.
——— and Kelly B. Herd (2010), “To Each His Own? How Comparisons with Others
Influence Consumers’ Evaluations of Their Self-Designed Products,” Journal of
Consumer Research, 36 (5), 806–19.
Morf, Carolyn C. and Frederick Rhodewalt (2001), “Unraveling the Paradoxes of Narcissism:
A Dynamic Self-Regulatory Processing Model,” Psychological Inquiry, 12 (4),
177–96.
Morrin, Maureen, J. Jeffrey Inman, Susan M. Broniarczyk, Gergana Y. Nenkov, and Jonathan
Reuter (2012), “Investing for Retirement: The Moderating Effect of Fund Assortment
Size on the 1/N Heuristic,” Journal of Marketing Research, 49 (4), 537–50.
Nagpal, Anish, Jing Lei, and Adwait Khare (in press), “To Choose or to Reject: The Effect of
Decision Frame on Food Customization Decisions,” Journal of Retailing.
Preacher, Kristopher J. and Andrew F. Hayes (2008), “Asymptotic and Resampling Strategies
for Assessing and Comparing Indirect Effects in Multiple Mediator Models,”
Behavior Research Methods, 40 (3), 879–91.
Quenqua, Douglas (2013), “Seeing Narcissists Everywhere,” The New York Times, (accessed
February 1, 2015), [available at http://www.nytimes.com/2013/08/06/science/seeing-
narcissists-everywhere.html].
Raskin, Robert and Calvin S. Hall (1981), “The Narcissistic Personality Inventory:
Alternative Form Reliability and Further Evidence of Construct Validity,” Journal of
Personality Assessment, 45 (2) 159–62.
——— and Howard Terry (1988), “A Principal Component Analysis of the Narcissistic
Personality Inventory and Further Evidence of its Construct Validity,” Journal of
Personality and Social Psychology, 54 (5), 890–902.

34
Rose, Paul (2007), “Mediators of the Association between Narcissism and Compulsive
Buying: The Roles of Materialism and Impulse Control,” Psychology of Addictive
Behaviors, 21 (4), 576–81.
Rosenberg, Morris (1965), Society and the Adolescent Self-Image. Princeton, NJ: Princeton
University Press.
Sakellaropoulo, Maya and Mark W. Baldwin (2007), “The Hidden Sides of Self-Esteem:
Two Dimensions of Implicit Self-Esteem and Their Relation to Narcissistic
Reactions,” Journal of Experimental Social Psychology, 43 (6), 995–1001.
Schütz, Astrid, Bernd Marcus, and Ina Sellin (2004), “Measuring Narcissism as a Personality
Construct: Psychometric Properties of a Long and a Short Version of the German
Narcissistic Personality Inventory,” Diagnostica, 50 (4), 202–18.
Sedikides, Constantine, Sylwia Cisek, and Claire M. Hart (2011), “Narcissism and Brand
Name Consumerism,” in The Handbook of Narcissism and Narcissistic Personality
Disorder: Theoretical Approaches, Empirical Findings, and Treatments, W. Keith
Campbell and Joshua D. Miller, eds. Hoboken, NJ: John Wiley, 382–92.
——— , Aiden P. Gregg, Sylwia Cisek, and Claire M. Hart (2007), “The I That Buys:
Narcissists as Consumers,” Journal of Consumer Psychology, 17 (4), 254–57.
Snyder, Charles Richard and Howard L. Fromkin (1980), Uniqueness: The Human Pursuit of
Difference. New York: Plenum.
Spencer, Steven J., Mark P. Zanna, and Geoffrey T. Fong (2005), “Establishing a Causal
Chain: Why Experiments Are Often More Effective Than Mediational Analyses in
Examining Psychological Processes,” Journal of Personality and Social Psychology,
89 (6), 845–51.
Spiller, Stephen A., Gavan J. Fitzsimons, John G. Lynch Jr., and Gary H. McClelland (2013),
“Spotlights, Floodlights, and the Magic Number Zero: Simple Effects Tests in
Moderated Regression,” Journal of Marketing Research, 50 (2), 277–88.
Tian, Kelly Tepper, William O. Bearden, and Gary L. Hunter (2001), “Consumers’ Need for
Uniqueness: Scale Development and Validation,” Journal of Consumer Research, 28
(1), 50–66.
Troye, Sigurd Villads and Magne Supphellen (2012), “Consumer Participation in
Coproduction: ‘I Made It Myself’ Effects on Consumers’ Sensory Perceptions and
Evaluations of Outcome and Input Product,” Journal of Marketing, 76 (2), 33–46.
Twenge, Jean M. and W. Keith Campbell (2009), The Narcissism Epidemic: Living in the
Age of Entitlement. New York: Free Press.

35
——— , Sara Konrath, Joshua D. Foster, W. Keith Campbell, and Brad J. Bushman (2008),
“Egos Inflating Over Time: A Cross-Temporal Meta-Analysis of the Narcissistic
Personality Inventory,” Journal of Personality, 76 (4), 875–901.
Valenzuela, Ana, Ravi Dhar, and Florian Zettelmeyer (2009), “Contingent Response to Self-
Customization Procedures: Implications for Decision Satisfaction and Choice,”
Journal of Marketing Research, 46 (6), 754–63.
Vazire, Simine, Laura P. Naumann, Peter J. Rentfrow, and Samuel D. Gosling (2008),
“Portrait of a Narcissist: Manifestations of Narcissism in Physical Appearance,”
Journal of Research in Personality, 42 (6), 1439–47.
Wallace, David W., Joan L. Giese, and Jean L. Johnson (2004), “Customer Retailer Loyalty
in the Context of Multiple Channel Strategies,” Journal of Retailing, 80 (4), 249–63.
Watson, David, Lee A. Clark, and Auke Tellegen (1988), “Development and Validation of
Brief Measures of Positive and Negative Affect: The PANAS Scales,” Journal of
Personality and Social Psychology, 54 (6), 1063–70.

36
A: Narcissistic Priming Stimuli
B: Non-Narcissistic Priming Stimuli
Fig. 1. The ad-based priming technique used to induce a narcissistic state of mind (Study 2b).

37
A: Feelings of Accomplishment
B: Satisfaction with Customized Product
Fig. 2. Narcissism moderates the relationship between uniqueness feedback and product evaluations
(Study 3a). The vertical lines indicate the Johnson-Neyman point while the hatched areas show the
region of narcissism scores for which a spotlight test reveals significant differences (α = .05) between
the two feedback conditions. As such, consumers with narcissism scores greater than 5.89 (Panel A) or
6.71 (Panel B) show increased product evaluations in the case of unique (vs. non-unique) feedback.

38
Fig. 3. Mediation model for the relationship between narcissism and product uniqueness (Study 4).
The path coefficients are unstandardized regression coefficients. The value in parentheses (c) indicates
the total effect of narcissism on product uniqueness. The indirect effect (a × b) is significant at α = .05.
* p < .05; ** p < .01
a = 1.56** b = 3.02*
c’ = 2.64 (c = 7.35*)
Feelings of Superiority
Consumers’ Narcissistic Tendencies Product Uniqueness

39
Fig. 4. Feelings of superiority moderate the relationship between narcissism and product uniqueness
(Study 5). In contrast to Study 3a, in which the moderator was a continuous variable (narcissism),
Study 5 used a simple slope analysis to examine the moderating role of induced feelings of equality.

40
Appendix. The 15-Item Short Form of the Narcissistic Personality Inventory
(NPI-15; Schütz, Marcus, and Sellin 2004)
1 A) I have a natural talent for influencing people. B) I am not good at influencing people.
2 A) When people compliment me I sometimes get embarrassed. B) I know that I am good because everybody keeps telling me so.
3 A) I prefer to blend in with the crowd. B) I like to be the center of attention.
4 A) I am no better or worse than most people. B) I think I am a special person.
5 A) I am not sure if I would make a good leader. B) I see myself as a good leader.
6 A) I like to have authority over other people. B) I don't mind following orders.
7 A) I find it easy to manipulate people. B) I don't like it when I find myself manipulating people.
8 A) I just want to be reasonably happy. B) I want to amount to something in the eyes of the world.
9 A) I have a strong will to power. B) Power for its own sake doesn't interest me.
10 A) I really like to be the center of attention. B) It makes me uncomfortable to be the center of attention.
11 A) Being an authority doesn't mean that much to me. B) People always seem to recognize my authority.
12 A) I would prefer to be a leader. B) It makes little difference to me whether I am a leader or not.
13 A) I am going to be a great person. B) I hope I am going to be successful.
14 A) I am a born leader. B) Leadership is a quality that takes a long time to develop.
15 A) I am much like everybody else. B) I am an extraordinary person.

41
Article II
de Bellis, E., Hildebrand, C., Ito, K., Herrmann, A., and Schmitt, B. (in preparation for
submission). Examining the Global Boundaries of Mass Customization: Conventional
Configuration Procedures Clash with Holistic Information Processing. Journal of Marketing
Research.
This research has been presented at the 2014 Society for Consumer Psychology (SCP) and
will be presented at the 2015 Association for Consumer Research (ACR).

42
Examining the Global Boundaries of Mass Customization:
Conventional Configuration Procedures Clash with
Holistic Information Processing
Emanuel de Bellisa
Christian Hildebranda
Kenichi Itob
Andreas Herrmanna
Bernd Schmittc
aCenter for Customer Insight, University of St. Gallen, Switzerland
bDivision of Psychology & Institute on Asian Consumer Insight,
Nanyang Technological University, Singapore cMarketing Department, Columbia University, USA

43
Abstract
A large-scale field study and three cross-cultural experiments demonstrate that conventional
mass customization is in conflict with holistic information processing. Specifically, attribute-
by-attribute configuration (vs. choosing from prespecified alternatives) reduces product
evaluations of East Asian consumers while priming habitual processing styles can increase
product evaluations both in the East and West.

44
Main Body
Information processing is inherently tied to an individual’s cultural background. For
instance, Easterners share the belief that different pieces of information coexist
interdependently and thus process information more holistically, whereas Westerners
perceive each piece of information to exist autonomously and therefore process information
more analytically (Nisbett and Masuda 2003). As a consequence, companies may fail to sell
their products effectively unless they take these important cross-cultural differences into
account and provide tailored marketing strategies to consumers in different markets
(e.g., advertising campaigns, brand names, or user interfaces; Haig 2011).
This shortcoming is particularly pronounced for mass customization systems that
allow consumers to express their unique preferences (Simonson 2005). While the popularity
of such systems is increasing among Western and Eastern consumers, manufacturers still
employ identical user interfaces around the globe. For example, consumers configuring an
automobile at Audi’s country-specific websites in North America, Europe, or Asia always
walk through exactly the same configuration procedure: first prospective car buyers select a
model, then they choose an exterior color, followed by their preferred rims, a number of
interior features, and other options. This sequential process of conventional attribute-by-
attribute customization across Western and Eastern markets is not limited to the
customization of cars but can also be found in other industries including apparel, furniture,
foods, and many attribute-based service packages (see www.configurator-database.com).
In this paper, we examine the psychological consequences of such attribute-by-
attribute customization and how they affect consumer decision making across different
markets. Our findings based on field and lab data show that conventional attribute-by-
attribute customization is especially beneficial to North American and European consumers.
For East Asian consumers, selecting a product from already preconfigured products is more
favorable due to their habitual, more holistic information processing style. These findings
have direct implications for the design of choice architectures in both Eastern and Western
markets.

45
THEORETICAL BACKGROUND
Mass Customization
Consumers never before had the opportunity to customize such a wide variety of
products. An increasing number of companies offer web-based services that allow consumers
to create their own self-designed products. The mass customization (MC) literature focused
to a large extent on outcome-oriented topics such as the positive influence of MC on
consumer satisfaction (Moreau, Bonney, and Herd 2011) and willingness to pay (Franke,
Schreier, and Kaiser 2010). However, allowing users to customize their own products may
not be uniformly beneficial to all consumers. For example, consumers’ response to
customized offers may be affected by their ability to form a holistic product impression based
on the sequential nature of choosing each attribute in isolation (Simonson 2005).
A more recent stream of research started examining the architecture of MC systems
themselves (Bauer, Düll, and Jeffrey 2010). Valenzuela, Dhar, and Zettelmeyer (2009)
showed the differential effects of customization formats on attribute tradeoffs and consumers’
perceived decision complexity. Our work contributes to this emerging stream of research
examining the process and boundary conditions rather than the outcome of MC and does so
across different markets. Our key hypothesis is that MC is most effective if it matches
consumers’ culture-specific style of information processing.
Culture-Specific Information Processing
Individuals develop distinct patterns of information processing depending on their
cultural background. Research in cross-cultural psychology has extensively documented that
East Asians’ default style of information processing is holistic (sometimes also referred to as
global) to the extent that they bind salient information with contextual information (Nisbett
and Masuda 2003). East Asians share the belief that objects in the environment are equally
important and inherently connected. As such, East Asians’ holistic style of information
processing is often contrasted with Westerners’ analytic (or local) processing style.
Westerners tend to focus on salient information without being distracted by contextual
information, because they share the belief that objects in the environment exist of unique,
independent attributes (Nisbett and Masuda 2003). As a result of the distinct styles of
information processing, East Asians create more information-rich products (e.g., websites or
paintings) than Westerners (Wang et al. 2012).

46
Prior research not only showed that consumers are surrounded by objects that reflect
distinct cross-cultural patterns of perception, but also highlighted that they inherently prefer
such objects. For example, Liang, Runyan, and Fu (2011) categorized over 1,000 ads from
various US-American and Chinese magazines and examined whether these ads differed in
their content of holistic, contextual information (e.g., activity or location information) versus
more analytic, focal information (e.g., clothing or car). Their results revealed that 77% of
Chinese ads and only 53% of US-American ads contained contextual information. In return,
Chinese (US-American) consumers preferred products that were presented in contextualized
(non-contextualized) ads. This pattern of results demonstrates that consumers favor products
that match their culture-specific style of information processing.
Towards Culture-Specific Mass Customization Systems
Similar to marketing campaigns that tailor their efforts to specific markets (Han and
Shavitt 1994), we propose that MC is more beneficial to consumers if it fits their predominant
style of information processing. MC systems are of particular relevance not only because of
their widespread use across industries and their rise in East Asia (Accenture 2012), but also
because they can be aligned with consumers’ culture-specific information processing as we
will show across three experimental studies.
The predominant mode of MC is designed as a bottom-up process where consumers
configure a product in multiple sequential steps by choosing features attribute by attribute.
Such MC systems, focusing on individual attributes instead of the fully specified product
itself may inhibit East Asian consumers’ ability to form a holistic product impression, being
in conflict with their habitual, more holistic processing style. Consequently, consumers who
process information more holistically―such as East Asians―should experience difficulties
in envisioning the product under attribute-by-attribute customization. We predict that such an
inhibition of mentally simulating product use may result in negative evaluations of the
customization experience and consumers’ ultimate choice (Escalas 2004; Zhao, Hoeffler, and
Zauberman 2011). In contrast, a choice architecture that consists of already prespecified
alternatives corresponds more to the inherent information processing style of East Asians, as
this choice architecture allows consumers to envision the product more holistically and to
make cross-attribute comparisons simultaneously. This focus on the product as a whole is
predicted to enable East Asians to select a product whose attributes fit well together, thereby
promoting increased mental simulation of product use.
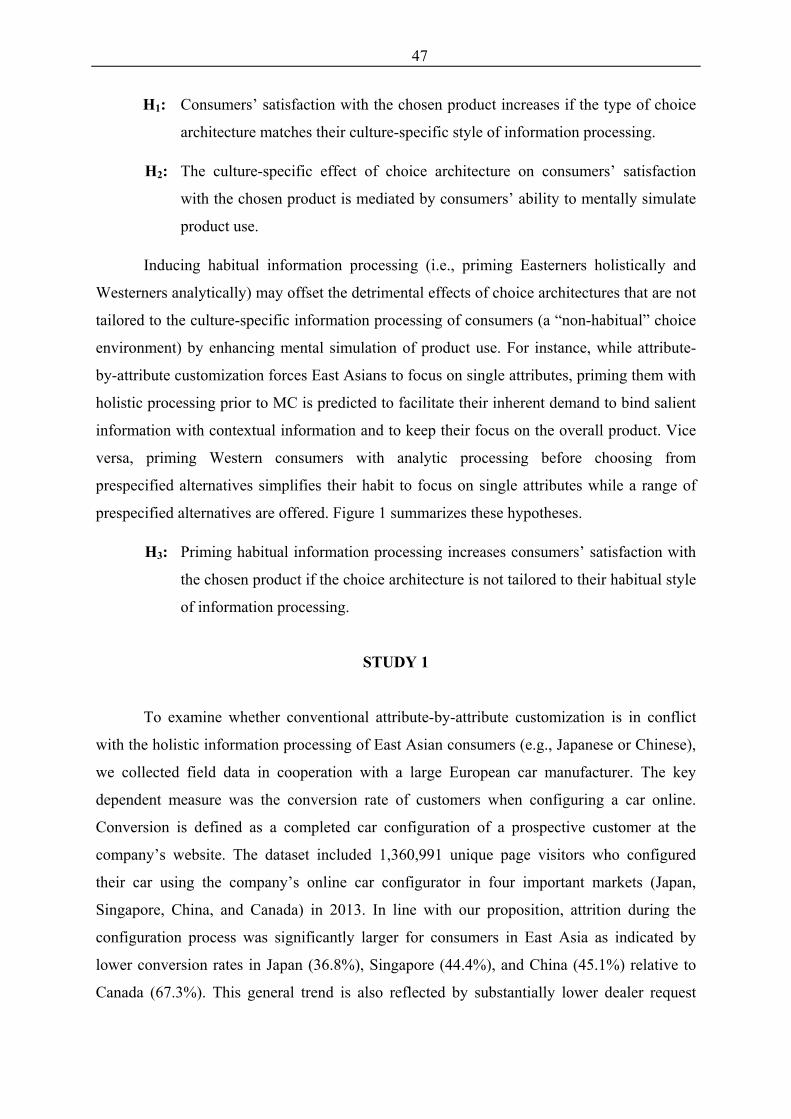
47
H1: Consumers’ satisfaction with the chosen product increases if the type of choice
architecture matches their culture-specific style of information processing.
H2: The culture-specific effect of choice architecture on consumers’ satisfaction
with the chosen product is mediated by consumers’ ability to mentally simulate
product use.
Inducing habitual information processing (i.e., priming Easterners holistically and
Westerners analytically) may offset the detrimental effects of choice architectures that are not
tailored to the culture-specific information processing of consumers (a “non-habitual” choice
environment) by enhancing mental simulation of product use. For instance, while attribute-
by-attribute customization forces East Asians to focus on single attributes, priming them with
holistic processing prior to MC is predicted to facilitate their inherent demand to bind salient
information with contextual information and to keep their focus on the overall product. Vice
versa, priming Western consumers with analytic processing before choosing from
prespecified alternatives simplifies their habit to focus on single attributes while a range of
prespecified alternatives are offered. Figure 1 summarizes these hypotheses.
H3: Priming habitual information processing increases consumers’ satisfaction with
the chosen product if the choice architecture is not tailored to their habitual style
of information processing.
STUDY 1
To examine whether conventional attribute-by-attribute customization is in conflict
with the holistic information processing of East Asian consumers (e.g., Japanese or Chinese),
we collected field data in cooperation with a large European car manufacturer. The key
dependent measure was the conversion rate of customers when configuring a car online.
Conversion is defined as a completed car configuration of a prospective customer at the
company’s website. The dataset included 1,360,991 unique page visitors who configured
their car using the company’s online car configurator in four important markets (Japan,
Singapore, China, and Canada) in 2013. In line with our proposition, attrition during the
configuration process was significantly larger for consumers in East Asia as indicated by
lower conversion rates in Japan (36.8%), Singapore (44.4%), and China (45.1%) relative to
Canada (67.3%). This general trend is also reflected by substantially lower dealer request

48
rates in Japan (1.3%) relative to Canada (5.7%; see Table 1). To provide further evidence for
the hypothesis that conventional attribute-by-attribute customization is less effective when it
is not tied to East Asians’ holistic information processing, we received and analyzed
additional country-specific field data for the Chinese and German market from March to
December 2013. In line with the previous findings, Chinese customers were less likely to
return to the company’s car configurator (M = 1.38) relative to prospective customers in the
German market (M = 1.73; see Table 1). Together, these analyses of over a million
prospective car buyers across various markets provide a first hint toward conventional MC
systems being less beneficial to East Asian consumers.
However, these findings are based on correlational evidence and do not necessarily
indicate causation. In addition, the data were collected on the aggregate level such that the
psychological processes that may have led to the differential effects in Western and Eastern
markets remain unclear. Hence, we designed three cross-cultural experiments to examine the
influence of conventional attribute-by-attribute customization (as implemented by the
company reported above) relative to choosing from prespecified alternatives, thus examining
the underlying processes in a more rigorous, controlled setting. These experiments were
conducted in the German market, known for its residents with a more analytic processing
style, and in the Singaporean market, known for its residents with a more holistic processing
style. Our key hypothesis was that consumers experience more mental simulation of product
use and evaluate their customized product more favorably if the MC system matches
consumers’ habitual processing style.
STUDY 2
To investigate how the two predominant choice architectures succeed in different
markets, we assessed consumers’ culture-specific style of information processing before
having them configure their preferred car (either using conventional attribute-by-attribute
customization or choosing among prespecified alternatives). In study 2, we conducted a
2 (choice architecture: attribute-wise vs. prespecified) × 2 (market: Singapore vs. Germany)
between-subjects design, which aimed to test whether consumers’ satisfaction with a chosen
product is increased if the type of choice architecture matches their culture-specific style of
information processing (H1).

49
Method
In studies 2 to 4, we recruited consumers from an online panel in Singapore and
Germany via local market research companies for monetary compensation. Participants were
prescreened to be in the market for a new car in the next 2 to 3 years. In study 2, consumers
(N = 180; Mage = 37; 49% females) first completed the Kimchi similarity task (Kimchi and
Palmer 1982) to assess their culture-specific style of information processing. In this task,
participants are shown a triangle consisting of smaller triangles and have to indicate which of
two additional figures (e.g., a square made of triangles or a triangle made of squares) is more
similar to the target. Subsequently, participants were randomly assigned to one of two choice
architectures; customizing a car attribute-by-attribute or choosing from a set of prespecified
cars. Specifically, participants in the “attribute-wise” condition customized their car
sequentially, selecting an option (e.g., phantom black) for each of three attributes
(e.g., exterior color). In the “prespecified” condition, participants chose a car from a set of
already preconfigured alternatives. We controlled for the overall attribute space such that the
prespecified alternatives resembled all possible attribute combinations of the attribute-wise
architecture. After the choice task and along with demographics, we measured consumers’
ability to mentally simulate product use via three items (e.g., “How well could you imagine
your personal vehicle based on your selection?”) and their choice satisfaction via five items
(e.g., “All in all, I am satisfied with my choice of car”).
Results
In support of H1, we found that when Singaporeans (vs. Germans) used the
prespecified (vs. attribute-wise) choice architecture, they were more satisfied with their
chosen car. Adding choice architecture and market as predictors into a two-way ANOVA
revealed the predicted interaction, F(2, 176) = 6.98, p < .01, and no significant main effects
(ps > .77). In line with our theorizing, consumers experienced an increased ability to mentally
simulate driving the car when provided with their culture-specific choice architecture, that is,
attribute-by-attribute customization in Germany and choosing from prespecified cars in
Singapore (H2). A two-way ANOVA revealed the predicted interaction, F(2, 176) = 4.78,
p < .05 (no main effects; ps > .84).
Given our proposition that consumers’ analytic versus holistic information processing
styles underlie this culture-specific effect, we added consumers’ information processing style
(as measured by the Kimchi similarity task) as a predictor to the model. Indeed, we found
converging evidence that consumers with more holistic information processing choosing
50
from prespecified alternatives and consumers with more analytic information processing
configuring via attribute-by-attribute customization showed increased mental simulation of
product use, as indicated by a significant interaction in a two-way ANOVA, F(2, 176) = 6.32,
p < .05 (no main effects; ps > .43). To account for all variables within one model, we
estimated a moderated mediation model as detailed in Figure 1.
In line with our predictions, we found a significant choice architecture × information
processing interaction to predict mental simulation of product use, 95% CI [.04, .36], while
mental simulation fully mediates the effect of choice architecture on consumers’ choice
satisfaction, 95% CI [.02, .20], as indicated by the insignificance of the direct choice
architecture effect, 95% CI [–.31, .20]. In sum, these findings provide support for the effects
hypothesized in the conceptual model.
Discussion
Why did Easterners’ tendency to process information holistically interfere with a
choice architecture that demands more analytic processing? Our findings suggest that
conventional attribute-by-attribute customization inhibits East Asian consumers’ mental
simulation of product use (Escalas 2004), reducing their overall choice satisfaction.
To provide further support for the moderating role of culture-specific information processing,
we primed consumers’ processing styles in the next study.
STUDY 3
In this study, we examined whether priming consumers with habitual information
processing may offset the detrimental effects of choice architectures that are in conflict with
consumers’ processing style (H3). Therefore, study 3 employed a 2 (choice architecture:
attribute-wise vs. prespecified) × 2 (information processing priming: holistic vs. analytic)
× 2 (market: Singapore vs. Germany) between-subjects design to examine the influence of
information processing priming on consumers’ mental simulation of product use and their
choice satisfaction. The priming procedure also aimed to provide additional support for the
moderating role of information processing in choice architectures.
Method
Mirroring the experimental paradigm of study 2, prospective car buyers (N = 668;
Mage = 39; 54% females) were recruited online in Singapore and Germany. Prior to the choice

51
task, we either induced habitual processing (i.e., priming Easterners holistically and
Westerners analytically) or non-habitual processing (i.e., priming Easterners analytically and
Westerners holistically). To prime a specific information processing style we used the well-
established Navon letters task (Navon 1977). Participants in the “holistic priming” condition
were instructed to detect large letters only, thus procedurally priming a holistic processing
style, while those in the “analytic priming” condition were instructed to detect small letters
only, thus procedurally priming an analytic processing style (Förster 2009). Subsequent to the
priming procedure, participants either used the attribute-by-attribute architecture to customize
their preferred car (attribute-wise condition) or chose from a set of prespecified cars
(prespecified condition). After the choice task, we measured consumers’ mental simulation of
product use and their choice satisfaction, along with a manipulation check (i.e., the Kimchi
similarity task) and demographics.
Results
The manipulation check confirmed that participants in the holistic (analytic) priming
condition showed more holistic (analytic) information processing, both in the Singaporean
and the German sample (see Table 1). In support of H3, we found that priming Singaporeans
with a holistic processing style before using the attribute-wise architecture significantly
increased their ability to mentally simulate using the car and also replicated the positive effect
on consumers’ choice satisfaction (see Table 1). As predicted, priming Germans with an
analytic processing style before using the prespecified architecture increased their choice
satisfaction. In sum, priming consumers with their habitual processing style positively
affected their experience with an otherwise poorly matching choice architecture that is
contrary to their culture-specific information processing (as shown in study 2).
Discussion
The causal effects of habitual priming were shown to offset the detrimental influence
of conflicting choice architectures. As such, priming consumers with their habitual
information processing style can provide a remedy for the negative influence of choice
architectures that are not tailored towards consumers’ habitual processing styles. Yet, the
implementation of a Navon letters-prime would be cumbersome in a real choice setting. Our
final study therefore examined the effectiveness of information processing priming via
marketing communication techniques.

52
STUDY 4
This study tested whether an effective priming of consumers’ habitual processing
styles can be implemented via specifically tailored advertisements and additionally measured
consumers’ intention to purchase their chosen product. As such, study 4 mirrored the
experimental paradigm of study 3, but applied more realistic priming stimuli.
Method
As in study 3, prospective car buyers (N = 552; Mage = 41; 39% females) were
recruited online in Singapore and Germany. Manipulating holistic versus analytic processing
styles, we adjusted available advertising videos of study 1’s company. As such, we created
two 45s videos based on the company’s TV commercials that were displayed without sound
to reduce confounds. The “holistic video” included scenes that are closely related to more
holistic perceptions by focusing on overall broad-based characteristics of a car, such as power
and safety. In contrast, the “analytic video” included scenes highlighting single product
items, such as Xenon headlights and features of the multimedia system. A pretest on
consumers of the same target population (N = 202) confirmed the effectiveness of the video
priming technique on the Kimchi similarity task (see Table 1). The pretest also revealed that
consumers remembered more car items after being primed with the analytic (vs. holistic)
video, indicating the effectiveness in drawing consumers’ attention toward the constituting
parts rather than the product as a whole (as under the holistic prime). Having watched either
of the two videos, consumers chose their preferred car either using the attribute-wise or the
prespecified architecture, followed by a measurement of consumers’ willingness to purchase
the chosen car and demographics.
Results & Discussion
Replicating the results of study 3, priming consumers with their habitual processing
styles via specifically tailored advertisements increased their intention to purchase the
product if they used a choice architecture that was not tailored to their habitual style of
information processing. We found that priming Singaporeans with a holistic processing style
before using the attribute-wise architecture significantly increased their purchase intention. In
turn, priming German consumers with an analytic processing style before using the
prespecified architecture also increased their purchase intention (see Table 1). These findings

53
provide renewed support for H3 and suggest that marketers can benefit from implementing
advertising campaigns, such as videos, that trigger habitual information processing.
GENERAL DISCUSSION
This research provides converging evidence that firms can benefit from tailoring
modern MC systems to their customers’ culture-specific style of information processing. In
essence, consumers’ processing styles establish an important boundary condition for the
success of MC of multi-national companies selling their products in various markets. Based
on the joint power of field and lab data, we showed a causal link between consumers’ culture-
specific style of information processing and their satisfaction with the chosen product. Our
findings contribute to the emerging field of cross-cultural consumer psychology and
marketing (Burton 2009). Specifically, we found differential effects of culture-specific
information processing on both mental simulation of product use and the overall effectiveness
of two predominant choice architectures; choosing from a set of prespecified alternatives
versus configuring a product via attribute-by-attribute customization. When consumers use a
choice architecture that is tailored to their culture-specific information processing, they
envision using a product more extensively during the purchase decision process. This, in turn,
systematically influences how satisfied consumers end up with their product choices.
The combined findings of our empirical studies have implications for companies
providing (or considering providing) tailored choice architectures to consumers across
different markets, thereby advancing connections around the globe. As such, this research
helps developing more effective choice architectures that nudge consumers to make choices
that are beneficial for themselves (e.g., greater satisfaction with the ultimate product) as well
as for companies (e.g., less attrition during the configuration procedure). Given the increasing
individualization in East Asia and the constant rise of MC in these markets (Accenture 2012),
the current research provides a new lens on how culture-specific information processing can
be aligned with interactive choice environments.

54
References
Accenture (2012). Asia Consumer Product Trends: Implications for Retailers and
Manufacturers. www.accenture.com/us-en/Pages/insight-asia-consumer-product-
trends-implications-retailers-manufacturers.aspx. Accessed 1 February 2014.
Bauer, Hans H., Anja Düll, and Dennis W. Jeffery (2010), “Typology of Potential Benefits of
Mass Customization Offerings for Customers: An Exploratory Study of the Customer
Perspective,” in Handbook of Research in Mass Customization and Personalization,
eds. Frank T. Piller and Mitchell M. Hackensack, NJ: World Scientific Publishing
Co., 161–80.
Burton, Dawn (2009), Cross-Cultural Marketing: Theory, Practice and Relevance, New
York, NY: Routledge.
Escalas, Jennifer E. (2004) “Imagine Yourself in the Product: Mental Simulation, Narrative
Transportation, and Persuasion,” Journal of Advertising, 33 (2), 37–48.
Förster, Jens (2009), “Relations Between Perceptual and Conceptual Scope: How Global
Versus Local Processing Fits a Focus on Similarity Versus Dissimilarity,” Journal of
Experimental Psychology: General, 138 (1), 88–111.
Franke, Nikolaus, Martin Schreier, and Ulrike Kaiser (2010), “The ‘I Designed It Myself’
Effect in Mass Customization,” Management Science, 56 (1), 125–40.
Haig, Matthew (2011), Brand Failures: The Truth About the 100 Biggest Branding Mistakes
of All Time, Sterling, VA: Kogan.
Han, Sang-Pil and Sharon Shavitt (1994), “Persuasion and Culture: Advertising Appeals in
Individualistic and Collectivistic Societies,” Journal of Experimental Social
Psychology, 30 (4), 326–50.
Kimchi, Ruth and Stephen E. Palmer (1982), “Form and Texture in Hierarchically
Constructed Patterns,” Journal of Experimental Psychology: Human Perception and
Performance, 8 (4), 521–35.
Liang, Beichen, Rodney C. Runyan, and Wei Fu (2011), “The Effect of Culture on the
Context of Ad Pictures and Ad Persuasion: The Role of Context-Dependent and
Context-Independent Thinking,” International Marketing Review, 28 (4), 412–34.
Moreau, C. Page, Leff Bonney, and Kelly B. Herd (2011), “It’s the Thought (and the Effort)
That Counts: How Customizing for Others Differs from Customizing for Oneself,”
Journal of Marketing, 75 (5), 120–33.

55
Navon, David (1977) “Forest Before Trees: The Precedence of Global Features in Visual
Perception,” Cognitive Psychology, 9 (3), 353–83.
Nisbett, Richard E. and Takahiko Masuda (2003), “Culture and Point of View,” Proceedings
of the National Academy of Sciences of the United States of America, 100 (19),
11163–70.
Simonson, Itamar (2005), “Determinants of Customers’ Responses to Customized Offers:
Conceptual Framework and Research Propositions,” Journal of Marketing, 69 (1),
32–45.
Valenzuela, Ana, Ravi Dhar, and Florian Zettelmeyer (2009), “Contingent Response to Self-
Customization Procedures: Implications for Decision Satisfaction and Choice,”
Journal of Marketing Research, 46 (6), 754–63.
Wang, Huaitang, Takahiko Masuda, Kenichi Ito, and Marghalara Rashid (2012), “How Much
Information? East Asian and North American Cultural Products and Information
Search Performance,” Personality and Social Psychology Bulletin, 38 (12), 1539–51.
Zhao, Min, Steve Hoeffler, and Gal Zauberman (2011), “Mental Simulation and Product
Evaluation: The Affective and Cognitive Dimensions of Process Versus Outcome
Simulation,” Journal of Marketing Research, 48 (5), 827–39.

56
TABLE 1
SUMMARY OF EMPIRICAL RESULTS
Study
Design
Key Findings
Study 1: Field data of a large European car manufacturer (N = 1,360,991 prospective car buyers)
Analyses of conversion rates, dealer request rates, and return rates of conventional MC systems across various Eastern and Western markets.
− Lower conversion rates in Japan (36.8%), Singapore (44.4%), and
China (45.1%) relative to Canada (67.3%; χ2(3, N = 1,360,991) = 109,332.48, p < .001).
− Lower dealer request rates in Japan (1.3%) relative to Canada
(5.7%; χ2(1, N = 1,139,046) = 13,491.04, p < .001).
− Lower return rates in China (M = 1.38) relative to Germany (M = 1.73; t(1,239,891) = 18.57, p < .001).
Study 2: Lab experiment in Singapore and Germany (N = 180 consumers)
2 (choice architecture: attribute-wise vs. prespecified) × 2 (market: Singapore vs. Germany) between-subjects design
− Empirical support for a moderated mediation model (see Figure 1).
− Interaction of choice architecture × information processing to
predict mental simulation of product use, 95% CI [.04, .36].
− Mental simulation fully mediates the effect of choice architecture on consumers’ choice satisfaction, 95% CI [.02, .20], as indicated by the insignificance of the choice architecture effect, 95% CI [–.31, .20].
Study 3: Lab experiment in Singapore and Germany (N = 668 consumers)
2 (choice architecture: attribute-wise vs. prespecified) × 2 (information processing priming: holistic vs. analytic) × 2 (market: Singapore vs. Germany) between-subjects design
− A manipulation check confirmed that the analytic (holistic) priming increased analytic (holistic) information processing, both in the Singaporean sample, t(407) = 2.68, p < .01, and the German sample, t(283) = 1.77, p < .05.
− Priming Singaporeans with holistic processing before using the attribute-wise architecture increased their mental simulation of product use, t(205) = 1.41, p = .08, as well as consumers’ choice satisfaction, t(205) = 1.69, p < .05.
− Priming Germans with analytic processing before using the prespecified architecture increased their choice satisfaction,t(114) = 2.45, p < .01.
Study 4: Lab experiment in Singapore and Germany (N = 552 consumers)
2 (choice architecture: attribute-wise vs. prespecified) × 2 (information processing priming: holistic vs. analytic) × 2 (market: Singapore vs. Germany) between-subjects design
− A pretest (N = 202) confirmed that the analytic (vs. holistic) video increased analytic information processing, t(200) = 1.65, p < .05, along with remembered car items, t(200) = 2.20, p < .05.
− Priming Singaporeans with holistic processing before using the attribute-wise architecture increased their intention to purchase the product, t(205) = 1.64, p = .05.
− Priming Germans with analytic processing before using the prespecified architecture increased their intention to purchase the product, t(134) = 1.61, p = .05.

57
FIGURE 1
CONCEPTUAL MODEL
Figure 1. Conceptual model of how consumers’ analytic vs. holistic information processing
styles and mental simulation of product use influence the effect of choice architecture on
choice satisfaction. Note that while information processing styles are culturally determined,
they can also be primed as a current state of mind.

58
Article III
de Bellis, E., Hildebrand, C., Ito, K., and Herrmann, A. (in press). Cross-National Differences
in Uncertainty Avoidance Predict the Effectiveness of Mass Customization across East Asia:
A Large-Scale Field Investigation. Marketing Letters.
The final publication is available at:
http://link.springer.com/article/10.1007/s11002-015-9356-z

59
Cross-National Differences in Uncertainty Avoidance
Predict the Effectiveness of Mass Customization
across East Asia: A Large-Scale Field Investigation
Emanuel de Bellisa
Christian Hildebranda
Kenichi Itob
Andreas Herrmanna
aCenter for Customer Insight, University of St. Gallen, Switzerland
bDivision of Psychology & Institute on Asian Consumer Insight,
Nanyang Technological University, Singapore

60
Abstract
Why does mass customization succeed in some East Asian markets but fail in others?
Building on and extending prior work on uncertainty avoidance, this research suggests that
providing mass customization in highly uncertainty-avoiding cultures can have negative
consequences for consumers and companies, including longer configuration duration, lower
conversion rates to actually purchase the customized product, and a reduced degree of sharing
one’s product with other consumers. We provide support for those propositions based on two
large-scale field studies involving more than 700,000 prospective car buyers in Japan and
Taiwan (scoring high on uncertainty avoidance) versus China and Singapore (scoring low on
uncertainty avoidance). Our findings on actual customers suggest that neglecting cross-
national differences in uncertainty avoidance across East Asia puts both consumers and
companies at risk due to more onerous customization experiences for consumers and
substantially lower conversion for companies.

61
Main Body
1 Introduction
A new consumer trend in East Asia is a “quest for customized products and the thrill
of ‘co-creation’ collaborations between consumers and product manufacturers” (Accenture
2012, p. 2). To be effective though, consumers need to have at least some insight into their
own preferences when customizing products based on a large number of available features
and combinations thereof (Simonson 2005). This research proposes that consumers’
uncertainty involved in such a configuration process may have varying and sometimes
unintended consequences among East Asian consumers given that East Asian cultures differ
greatly in their degree of uncertainty avoidance (Hofstede et al. 2010). Differences in
uncertainty avoidance have been shown to affect consumers’ willingness to buy new product
offerings, with high (vs. low) uncertainty-avoiding countries being more reluctant to adopt
newly developed products and technologies (Lynn and Gelb 1996; van Everdingen and
Waarts 2003; Yeniyurt and Townsend 2003). These findings are particularly important in a
mass customization context where consumers face uncertainty with both the functionality of
the product (given a typically more complex choice environment; Hildebrand et al. 2014) and
their ability to contribute effectively during the configuration process.
Whether or not such differences in uncertainty avoidance affect people’s consumption
behavior beyond traditional comparisons between Eastern and Western cultures is widely
unknown. The majority of cross-cultural research treated individuals from different East
Asian countries as homogenous subjects of a largely identical group (e.g., Lehman et al.
2004), because researchers aimed to verify cultural frameworks developed in Western
countries by testing them in East Asia. The resulting “East-West” comparisons, such as
interdependent versus independent self-construal (Markus and Kitayama 1991) or holistic
versus analytic cognition (Nisbett 2003), received tremendous research and media coverage
during the past decades. In contrast, academic work on inter-Asian differences has attracted
some attention in management and cross-cultural psychology (e.g., Ang and Schmitt 1999;
Cheng et al. 2014; Oyserman et al. 2002), but is still in its infancy in the area of marketing
and consumer behavior (Schmitt 2013). Despite uncertainty avoidance being one of the most
defining cultural differences between East Asian countries (Hofstede et al. 2010), research on
the consequences of uncertainty avoidance on East Asians’ consumption behavior is rare
(see Frank et al. 2012 as a recent exception).
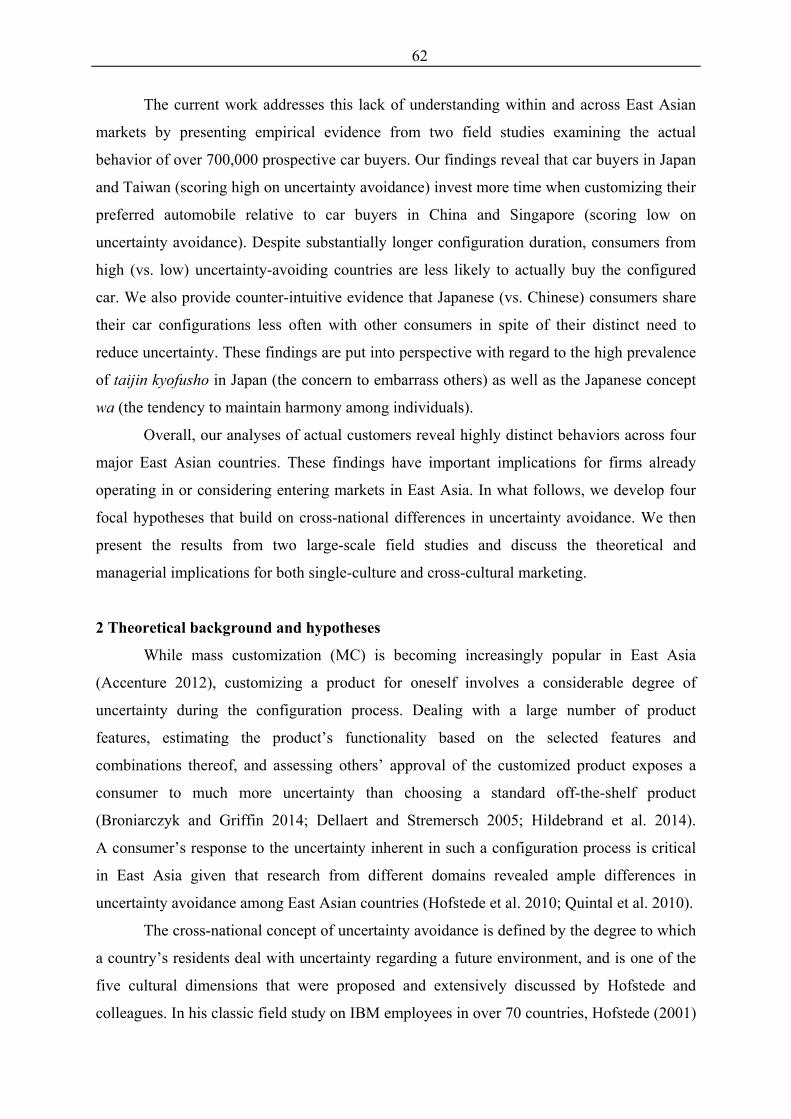
62
The current work addresses this lack of understanding within and across East Asian
markets by presenting empirical evidence from two field studies examining the actual
behavior of over 700,000 prospective car buyers. Our findings reveal that car buyers in Japan
and Taiwan (scoring high on uncertainty avoidance) invest more time when customizing their
preferred automobile relative to car buyers in China and Singapore (scoring low on
uncertainty avoidance). Despite substantially longer configuration duration, consumers from
high (vs. low) uncertainty-avoiding countries are less likely to actually buy the configured
car. We also provide counter-intuitive evidence that Japanese (vs. Chinese) consumers share
their car configurations less often with other consumers in spite of their distinct need to
reduce uncertainty. These findings are put into perspective with regard to the high prevalence
of taijin kyofusho in Japan (the concern to embarrass others) as well as the Japanese concept
wa (the tendency to maintain harmony among individuals).
Overall, our analyses of actual customers reveal highly distinct behaviors across four
major East Asian countries. These findings have important implications for firms already
operating in or considering entering markets in East Asia. In what follows, we develop four
focal hypotheses that build on cross-national differences in uncertainty avoidance. We then
present the results from two large-scale field studies and discuss the theoretical and
managerial implications for both single-culture and cross-cultural marketing.
2 Theoretical background and hypotheses
While mass customization (MC) is becoming increasingly popular in East Asia
(Accenture 2012), customizing a product for oneself involves a considerable degree of
uncertainty during the configuration process. Dealing with a large number of product
features, estimating the product’s functionality based on the selected features and
combinations thereof, and assessing others’ approval of the customized product exposes a
consumer to much more uncertainty than choosing a standard off-the-shelf product
(Broniarczyk and Griffin 2014; Dellaert and Stremersch 2005; Hildebrand et al. 2014).
A consumer’s response to the uncertainty inherent in such a configuration process is critical
in East Asia given that research from different domains revealed ample differences in
uncertainty avoidance among East Asian countries (Hofstede et al. 2010; Quintal et al. 2010).
The cross-national concept of uncertainty avoidance is defined by the degree to which
a country’s residents deal with uncertainty regarding a future environment, and is one of the
five cultural dimensions that were proposed and extensively discussed by Hofstede and
colleagues. In his classic field study on IBM employees in over 70 countries, Hofstede (2001)

63
identified that individuals’ stress levels at work strongly correlated with their perceived
employment stability in the future and their unwillingness to violate company rules.
Importantly, he showed that the strength of this correlation differs substantially across
countries and argued that these differences stem from culture combatting individuals’
tendencies to feel insecure about unknown future events. In delineating the concept of
uncertainty avoidance, Hofstede (2001) distinguished uncertainty avoidance from risk
avoidance. Whereas the perception of risk is related to a specific event to be feared,
uncertainty is perceived when one is unable to foresee what will happen next. Other
researchers conceptualized uncertainty avoidance as individuals’ reliance on implicit or
explicit rules, structures, and relationships to escape from the ambiguity in everyday life
(Yaveroglu and Donthu 2002). For example, a country’s dominance of religious beliefs is
associated with the degree of uncertainty avoidance because it provides individuals in high
uncertainty-avoiding countries with answers for many unanswerable questions that make
people’s lives ambiguous (e.g., life after inevitable death). Indeed, anthropologists showed
that religiosity is more prominent in East Asian countries scoring high on uncertainty
avoidance (e.g., Japan) relative to those scoring low (e.g., China; Hsu 1971).
Uncertainty avoidance has been suggested as one of the most defining cultural
differences among East Asians (Frank et al. 2012; Hofstede et al. 2010). For instance, while
Japanese, Taiwanese, Chinese, and Singaporeans are considered as both interdependent and
holistic thinkers (Markus and Kitayama 1991; Nisbett 2003), they differ greatly from one
another on the dimension of uncertainty avoidance. According to Hofstede et al.’s (2010)
uncertainty avoidance index, Japanese (92 out of 100) and Taiwanese (69) score high on
uncertainty avoidance while Chinese (30) and Singaporeans (8) score low on uncertainty
avoidance. This central cultural difference has also been shown to affect individuals’
consumption patterns. Consumers in high (vs. low) uncertainty-avoiding cultures tend to be
less innovative and entrepreneurial, while their consumption is more conscientious (e.g., they
consume less processed foods, buy more designer furniture, and choose mineral water over
tap water; de Mooij and Hofstede 2002). Taken together, these characteristics of uncertainty
avoidance suggest that individuals in high (vs. low) uncertainty-avoiding countries prefer a
decision context that is free of potential ambiguity. In an MC context, in which clear decision
strategies for one’s preferred configuration are lacking, we predict that consumers in high
(vs. low) uncertainty-avoiding countries take longer to configure their preferred product.
More formally, we hypothesize:
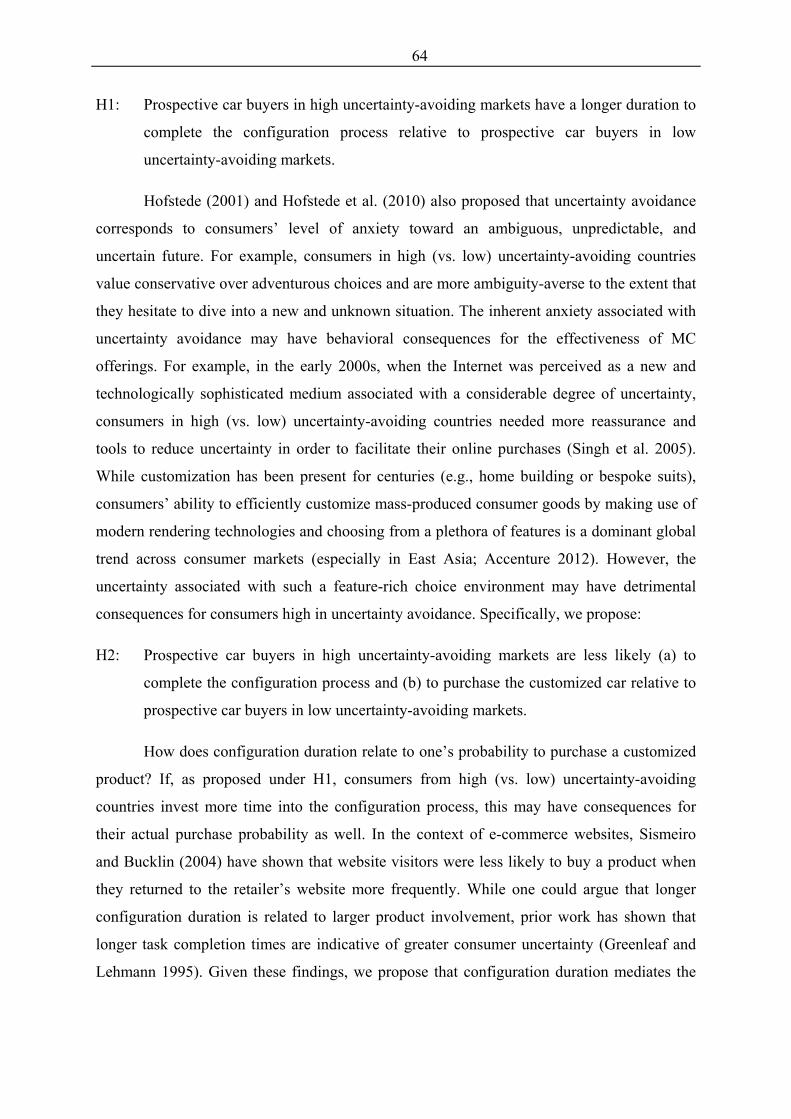
64
H1: Prospective car buyers in high uncertainty-avoiding markets have a longer duration to
complete the configuration process relative to prospective car buyers in low
uncertainty-avoiding markets.
Hofstede (2001) and Hofstede et al. (2010) also proposed that uncertainty avoidance
corresponds to consumers’ level of anxiety toward an ambiguous, unpredictable, and
uncertain future. For example, consumers in high (vs. low) uncertainty-avoiding countries
value conservative over adventurous choices and are more ambiguity-averse to the extent that
they hesitate to dive into a new and unknown situation. The inherent anxiety associated with
uncertainty avoidance may have behavioral consequences for the effectiveness of MC
offerings. For example, in the early 2000s, when the Internet was perceived as a new and
technologically sophisticated medium associated with a considerable degree of uncertainty,
consumers in high (vs. low) uncertainty-avoiding countries needed more reassurance and
tools to reduce uncertainty in order to facilitate their online purchases (Singh et al. 2005).
While customization has been present for centuries (e.g., home building or bespoke suits),
consumers’ ability to efficiently customize mass-produced consumer goods by making use of
modern rendering technologies and choosing from a plethora of features is a dominant global
trend across consumer markets (especially in East Asia; Accenture 2012). However, the
uncertainty associated with such a feature-rich choice environment may have detrimental
consequences for consumers high in uncertainty avoidance. Specifically, we propose:
H2: Prospective car buyers in high uncertainty-avoiding markets are less likely (a) to
complete the configuration process and (b) to purchase the customized car relative to
prospective car buyers in low uncertainty-avoiding markets.
How does configuration duration relate to one’s probability to purchase a customized
product? If, as proposed under H1, consumers from high (vs. low) uncertainty-avoiding
countries invest more time into the configuration process, this may have consequences for
their actual purchase probability as well. In the context of e-commerce websites, Sismeiro
and Bucklin (2004) have shown that website visitors were less likely to buy a product when
they returned to the retailer’s website more frequently. While one could argue that longer
configuration duration is related to larger product involvement, prior work has shown that
longer task completion times are indicative of greater consumer uncertainty (Greenleaf and
Lehmann 1995). Given these findings, we propose that configuration duration mediates the

65
effect of cross-national differences in uncertainty avoidance on consumers’ probability to
purchase the customized product. Thus, we hypothesize:
H3: Longer configuration duration decreases the probability to purchase a customized car,
resulting in lower conversion rates.
In today’s competitive market environments, companies not only aim to increase the
purchase probability of a focal consumer, but also seek ways to maximize product diffusion
and electronic word-of-mouth. In the light of the “interconnected, mobile [East Asian]
consumer who wants to use consumer technology to make shopping fun, fast and
collaborative” (Accenture 2012, p. 2), consumers’ willingness to share their customized
product with fellow consumers is particularly important in East Asia. A dominant finding in
prior research is that uncertainty avoidance causes individuals to avoid social outings because
of the fear of embarrassment and negative evaluation by others (Arrindell et al. 2004). In
addition, uncertainty avoidance may strengthen the predisposition of culture-specific
concepts of interpersonal relationships on consumers’ advice-seeking behavior (Steenkamp
et al. 1999). This is particularly important with respect to the Japanese culture because of the
relatively high prevalence of taijin kyofusho (TKS), as individuals with TKS are highly
concerned that their behavior will offend or embarrass another person (Hofmann et al. 2010).
In such an environment, consumers may hesitate to seek advice from others and to share their
configuration. Also, the meaning of acquiring and maintaining interpersonal relationships
differs fundamentally across East Asia. For example, the Chinese concept guanxi is based on
the exchange of utilitarian favors among individuals, while the Japanese concept wa refers to
horizontal harmony among group members which is maintained through consensus building
and avoidance of conflict (Cheng et al. 2014). From this perspective, asking others to
comment on a customized product to achieve one’s self-interests is likely to be socially
acceptable in China, but less so in Japan. Therefore, we propose:
H4: Prospective car buyers in high uncertainty-avoiding markets share their customized
product less often with others relative to prospective car buyers in low uncertainty-
avoiding markets.
The above hypotheses about the effects of cross-national differences in uncertainty
avoidance on consumers’ purchase and social sharing behavior are summarized in Fig. 1.
Solid lines represent hypothesized effects while the dashed line indicates an exploratory

66
effect. We do not provide a formal hypothesis (due to the lack of directionality) but will test
the effect of social sharing on consumers’ purchase probability in section 4.2.
Fig. 1 Summary of hypotheses (solid lines are hypothesized; dashed line is exploratory)
3 Field study 1
In collaboration with a large Western car manufacturer, we conducted a field study to
examine whether consumers in high (vs. low) uncertainty-avoiding countries show longer
configuration duration (H1) and reduced configuration completion (H2a) when customizing
their preferred car.
3.1 Data and measurement
Across all analyzed markets, the car manufacturer employs exactly the same MC
interface which guides consumers through the configuration process by letting them select
each product attribute individually (i.e., one’s preferred engine, exterior color, wheels,
interior features, and add-ons), which has previously been conceptualized as by-attribute
customization (Valenzuela et al. 2009). To test our hypotheses, the car manufacturer
developed an MC tracking software that was incorporated in each market. When prospective
car buyers entered the MC interface to configure their preferred car, the tracking software
collected data on whether consumers completed their configuration (referred to as
configuration completion) and the time span from starting the configuration until completion
(referred to as configuration duration). Data were collected during 1 year (January 1 to

67
December 31, 2013) for a total of 686,003 prospective car buyers who configured their
preferred car in the Japanese, Taiwanese, Chinese, or Singaporean market.
3.2 Results
In line with our theorizing, we find that prospective car buyers in Japan and Taiwan
(high in uncertainty avoidance) showed considerably longer configuration duration relative to
those in China and Singapore (low in uncertainty avoidance). As such, Japanese and
Taiwanese consumers took about 21 min to complete their car configuration whereas Chinese
and Singaporean consumers only spent 19 and 14 minutes, respectively (MJapan = 20.94 min,
MTaiwan = 21.16 min, MChina = 18.88 min, MSingapore = 13.63 min; F(1, 442,697) = 56.88,
p < .001; see Fig. 2a). In support of H1, post-hoc analyses reveal that all pairwise
comparisons are significant (ps < .001) except the one between the Japanese and Taiwanese
markets (p > .51). Interestingly, while investing more time, Japanese and Taiwanese
consumers were less likely to complete their configuration. As shown in Fig. 2b, only 36.8
and 38.0 % of prospective car buyers in Japan and Taiwan completed their car configuration
relative to a significantly larger fraction of 45.1 and 44.4 % in China and Singapore,
respectively (χ² = 4180, p < .001). Post-hoc analyses reveal that all pairwise comparisons are
significant (ps < .001) apart from the one comparing the Chinese and the Singaporean
markets (p > .10). These results provide converging support for H2a.
Fig. 2 Study 1: prospective car buyers in high uncertainty-avoiding markets (a) invested
more time into the configuration process and (b) were less likely to complete it relative to
those in low uncertainty-avoiding markets

68
In sum, we find that although prospective car buyers in Japan and Taiwan showed
significantly longer configuration duration when customizing their preferred car, they were
less likely to actually complete the configuration process relative to consumers in China and
Singapore. Even though the reported effects are large and in line with our hypotheses, the
aggregate nature of the data does not allow any inference on the individual level. To provide
a remedy to this limitation, we conducted a follow-up study that enabled a more in-depth
analysis of East Asians’ distinct usage of MC interfaces.
4 Field study 2
To make inferences above and beyond the aggregate data of study 1, we collaborated
with the same car manufacturer as in study 1 and implemented an improved MC tracking
software in the Japanese and Chinese markets, Asia’s two largest economies and automobile
markets. Study 2 examines the behavioral consequences of configuration duration (H3) and
tests whether consumers in high (vs. low) uncertainty-avoiding countries show lower
conversion rates (H2b) and reduced social sharing behavior (H4) when customizing their
preferred car.
4.1 Data and measurement
This study allows an individual-level analysis of consumers’ configuration processes
by leveraging and combining dealer sales data (as indicated by an entry in a car dealer’s
database) with the behavioral data of the MC tracking software. Data sources were linked by
unique identifiers of an individual car configuration via a user’s device-specific hardware ID
and a tracking code that is tied to a configuration and changes thereof. This adjustment
enables the analysis of prospective car buyers’ behavior over the time span from first visiting
the MC interface until the final lead entry in the car dealer’s database, which typically lasts
several days or weeks (and is therefore referred to as overall configuration duration). Most
importantly, we were able to analyze whether or not a configured car was purchased (referred
to as conversion rate). In addition, the software tracked whether consumers sent their car
configuration to a self-selected person via the manufacturer’s MC interface (referred to as
social sharing). Study 2 involves 78,978 car configurations from 42,074 prospective car

69
buyers who had at least one but no more than 20 car configurations.3 Data were collected
over a time span of 6 months (February 22 to September 1, 2014) in Japan and China.
4.2 Results
Similar to study 1, Japanese car buyers showed significantly longer overall
configuration duration relative to Chinese car buyers. Specifically, analyzing those customers
who returned at least once to the MC interface and eventually triggered a dealer request,
Japanese (vs. Chinese) took five times as long from their first configuration until their final
dealer configuration, with about 10 days in Japan relative to 2 days in China (MJapan = 9.92
days, MChina = 1.73 days; t(5282) = 16.33, p < .001). Follow-up analyses revealed that
Japanese customers had both higher return frequencies (MJapan = 3.49 vs. MChina = 3.16;
t(5282) = 4.31, p < .001) and longer time spans between two single configurations
(MJapan = 68 h vs. MChina = 13 h; t(5282) = 15.49, p < .001). These results provide additional
support for H1.
In line with our previous findings on the behavioral consequences of uncertainty
avoidance, consumers’ configuration completion was significantly lower in Japan (39.1 %)
compared to China (59.8 %; χ² = 12,827, p < .001), replicating the results from study 1. Most
importantly, conversion rates from a consumer’s first configuration to his or her actual
purchase differed greatly between markets with 18.3 % (18,959 out of 103,578 started
configurations) in China and only 2.3 % (5,803 out of 255,847 started configurations) in
Japan (χ² = 29,554, p < .001). These results are summarized in Fig. 3 and provide strong
support for H2a and H2b.
3 A total of 318 consumers (or less than 1 % of the sample) had more than 20 configurations and were likely to correspond to external dealer configurations, as noted by the company providing the data. Consequently, we removed these cases from all subsequent analyses. The reported results are robust and do not change if including these observations.

70
Fig. 3 Study 2: prospective car buyers in Japan (high in uncertainty avoidance) had a
lower configuration completion rate, fewer dealer requests, and a reduced conversion rate
relative to those in China (low in uncertainty avoidance)
A logit model predicting consumers’ conversion (non-purchase [coded as 0] vs.
purchase [coded as 1]) based on their overall configuration duration reveals the expected
negative effect: As prospective car buyers took longer for the configuration process they were
less likely to actually purchase the configured car (βconfiguration duration = −.21, p < .001).4
Controlling for the respective market, both main effects remain negative and significant
(βconfiguration duration = −.09, p < .001; βJapan vs. China = −1.18, p < .001), while their interaction is
non-significant (βconfiguration duration × Japan vs. China = .07, p > .10). In support of the proposed
process explanation (see Fig. 1), a mediation model with bootstrapped estimates (Preacher
and Hayes 2008) shows that the effect of high versus low uncertainty-avoiding markets on
conversion rates is mediated by consumers’ configuration duration (a × b = −.010, with a
4 Additional analyses indicate that both higher return frequencies (β = −.46, p < .001) and longer time spans between two single configurations (β = −.17, p < .001) are negatively related to purchase probability, in line with prior work (Greenleaf and Lehmann 1995; Sismeiro and Bucklin 2004).

71
95 % confidence interval excluding zero [−.014 to −.005]), while the direct effect is reduced
but yet significant (c’ = −1.20), indicating partial mediation. These results confirm H3 and
demonstrate that Japanese consumers’ increased time investment into the configuration
process decreases (rather than increases) their tendency to actually purchase the customized
car.
While investing more time into the configuration process, Japanese consumers were
less likely to share their configuration with other consumers. In support of H4, only 0.13 % of
prospective car buyers in Japan shared their configuration relative to 0.28 % in China
(t(42072) = 3.11, p < .001). Counter to intuition, sharing a configuration with others was
associated with reduced conversion rates. Controlling for the respective market, both main
effects remain negative and significant (βsocial sharing = −.12, p < .001; βJapan vs. China = −1.20,
p < .001), while their interaction is non-significant (βsocial sharing × Japan vs. China = −.08, p > .37).
Given the increased attention of social sharing in recent consumer research, this finding
highlights the need for further (both single-culture and cross-cultural) research on the
consequences of social sharing and is discussed in more detail in section 5.
5 General discussion
Based on a large-scale field investigation involving over 700,000 prospective car
buyers in four major East Asian countries, the current research identified cross-national
differences in uncertainty avoidance as an important driver of how consumers deal with MC
offerings in East Asia. We showed that consumers in high uncertainty-avoiding markets
(Japan and Taiwan) had substantially longer configuration duration, were less likely to
purchase their customized car, and were less inclined to share their configuration with others
relative to consumers in low uncertainty-avoiding markets (China and Singapore). These
findings contribute to the emerging fields of research on MC, socially-enriched choice
environments, and cross-cultural marketing, including the study of East Asian consumers.
While the majority of prior work on MC has examined outcome-related factors such
as consumers’ increased satisfaction with a customized product or their willingness to pay
(e.g., Valenzuela et al. 2009), our findings suggest that consumers from high uncertainty-
avoiding countries perceive customizing their own product as more onerous, with negative
consequences such as ultimately lower conversion rates for companies. A similarly hot topic
is the ubiquitous online social sharing activity with other consumers. This is the first series of
studies demonstrating that social sharing is substantially reduced in high (vs. low)
uncertainty-avoiding cultures. From an uncertainty avoidance standpoint, we suggest that this

72
seemingly counter-intuitive finding can, at least partly, be explained by individuals’
avoidance of social outings and their inherent wish not to offend others, which aligns with the
prevalence of taijin kyofusho and the concept wa in the Japanese culture. Importantly, while
only few consumers shared their configuration with others, the negative effect of social
sharing on consumers’ purchase probability adds to the field of socially-enriched choice
environments and is in line with recent findings showing that the use of social media can
have unintended, negative consequences for both consumers and firms (Hildebrand et al.
2013).
From a broader perspective on cross-cultural marketing, our work contributes to the
development of research on the similarities and differences between East Asian societies. For
more than 30 years, cross-cultural researchers have demonstrated the importance of culture
on human cognition and behavior, primarily by comparing East Asians with North Americans
or Western Europeans. This line of research has successfully established the perspective that
one cannot comprehend consumption behavior independent of the cultural environment.
However, the paradigm of East-West comparisons has been criticized for focusing mainly on
Japan/China and the USA (Henrich et al. 2010) and for its failure to acknowledge differences
within Eastern and Western cultures (Oyserman et al. 2002). The current findings contribute
to more nuanced cross-cultural research, as they highlight the behavioral consequences of
(neglecting) cultural differences within East Asia. In particular, we built on the concept of
uncertainty avoidance―the degree to which a society deals with uncertainty regarding the
future (Hofstede 2001)―as a defining characteristic to aid in understanding East Asian
cultures. In line with recent work of Frank and colleagues (e.g., Frank et al. 2012), we
demonstrated that East Asian markets and their consumers’ behavior differ greatly, with
important consequences for firms operating in or considering entering these markets.
Despite these contributions, we acknowledge the limitations inherent in using industry
field data. As such, we have not experimentally manipulated uncertainty avoidance to isolate
the proposed effects in a more controlled setting. However, given prior work on uncertainty
avoidance in East Asia (Frank et al. 2012; Hofstede et al. 2010) and the large datasets used in
this research, we believe that the current results are robust. In addition, the analysis of four
different countries controls for potentially confounding factors arising from differences on
economic or other cultural dimensions. For instance, GDP per capita is comparable between
Japan, Taiwan, and Singapore, while China and Taiwan share a similar historical background.
As such, the results of this large-scale field investigation hold even after controlling for other
major differences at the country level.
73
With respect to future directions, one particularly puzzling observation relates to
Japanese consumers being perceived as technology mavens with a strong affection for new
technologies and unique products. The present research provides a more nuanced observation
and suggests that using advanced MC interfaces does not equal actual purchase. Future
research may examine the antecedents that cause such discrepancies as well as potential
strategies to assist consumers from high uncertainty-avoiding cultures when navigating
through potentially complex choice environments, such as by-alternative instead of by-
attribute customization (Valenzuela et al. 2009) or customization via starting solutions
(Hildebrand et al. 2014). Besides contributing to the emerging field of consumer decision
making in electronically-enhanced choice environments, such research would enhance our
understanding of the behavioral consequences of East Asia’s crave for customized products.

74
References
Accenture (2012). Asia consumer product trends: implications for retailers and
manufacturers. www.accenture.com/us-en/Pages/insight-asia-consumer-product-
trends-implications-retailers-manufacturers.aspx. Accessed 1 July 2014.
Ang, S. H., & Schmitt, B. H. (1999). Introduction to special issue. Asia Pacific Journal of
Management, 16, 3–8.
Arrindell, W. A., Eisemann, M., Oei, T. P. S., Caballo, V. E., Sanavio, E., Sica, C., et al.
(2004). Phobic anxiety in 11 nations: part II. Hofstede’s dimensions of national
cultures predict national-level variations. Personality and Individual Differences, 37,
627–643.
Broniarczyk, S. M., & Griffin, J. (2014). Decision difficulty in the age of consumer
empowerment. Journal of Consumer Psychology, 24, 608–625.
Cheng, B., Boer, D., Chou, L., Huang, M., Yoneyama, S., Shim, D., et al. (2014).
Paternalistic leadership in four East Asian societies: generalizability and cultural
differences of the triad model. Journal of Cross-Cultural Psychology, 45, 82–90.
de Mooij, M., & Hofstede, G. (2002). Convergence and divergence in consumer behavior:
implications for international retailing. Journal of Retailing, 78, 61–69.
Dellaert, B. G. C., & Stremersch, S. (2005). Marketing mass-customized products: striking a
balance between utility and complexity. Journal of Marketing Research, 42, 219–227.
Frank, B., Abulaiti, G., & Enkawa, T. (2012). What characterizes Chinese consumer
behavior? A cross-industry analysis of the Chinese diaspora in Japan. Marketing
Letters, 23, 683–700.
Frank, B., Abulaiti, G., Torrico, B., & Enkawa, T. (2013). How do Asia’s two most important
consumer markets differ? Japanese-Chinese differences in customer satisfaction and
its formation. Journal of Business Research, 66, 2397–2405.
Greenleaf, E. A., & Lehmann, D. R. (1995). Reasons for substantial delay in consumer
decision making. Journal of Consumer Research, 22, 186–199.
Henrich, J., Heine, S. J., & Norenzayan, A. (2010). The weirdest people in the world?
Behavioral and Brain Sciences, 33, 61–83.
Hildebrand, C., Häubl, G., Herrmann, A., & Landwehr, J. R. (2013). When social media can
be bad for you: community feedback stifles consumer creativity and reduces
satisfaction with self-designed products. Information Systems Research, 24, 14–29.

75
Hildebrand, C., Häubl, G., & Herrmann, A. (2014). Product customization via starting
solutions. Journal of Marketing Research, 51, 707–725.
Hofmann, S. G., Asnaani, A., & Hinton, D. E. (2010). Cultural aspects in social anxiety and
social anxiety disorder. Depression and Anxiety, 27, 1117–1127.
Hofstede, G. (2001). Culture’s consequences: comparing values, behaviors, institutions, and
organizations across nations (2nd ed.). Thousand Oaks: Sage.
Hofstede, G. H., Hofstede, G. J., & Minkov, M. (2010). Cultures and organizations: software
of the mind – intercultural cooperation and its importance for survival. New York:
McGraw-Hill.
Hsu, F. L. (1971). Psychosocial homeostasis and jen: conceptual tools for advancing
psychological anthropology. American Anthropologist, 73, 23–44.
Lehman, D. R., Chiu, C., & Schaller, M. (2004). Psychology and culture. Annual Review of
Psychology, 55, 689–714.
Lynn, M., & Gelb, B. D. (1996). Identifying innovative national markets for technical
consumer goods. International Marketing Review, 13, 43–57.
Markus, H. R., & Kitayama, S. (1991). Culture and the self: implications for cognition,
emotion, and motivation. Psychological Review, 98, 224–253.
Nisbett, R. E. (2003). The geography of thought. New York: Free Press.
Oyserman, D., Coon, H. M., & Kemmelmeier, M. (2002). Rethinking individualism and
collectivism: evaluation of theoretical assumptions and meta-analyses. Psychological
Bulletin, 128, 3–72.
Preacher, K. J., & Hayes, A. F. (2008). Asymptotic and resampling strategies for assessing
and comparing indirect effects in multiple mediator models. Behavior Research
Methods, 40, 879–891.
Quintal, V., Lee, J., & Soutar, G. (2010). Tourists’ information search: the differential impact
of risk and uncertainty avoidance. International Journal of Tourism Research, 12,
321–333.
Schmitt, B. (2013). The changing face of the Asian consumer: insights and strategies for
Asian markets. Singapore: McGraw-Hill.
Simonson, I. (2005). Determinants of customers’ responses to customized offers: conceptual
framework and research propositions. Journal of Marketing, 69, 32–45.
Singh, N., Zhao, H., & Hu, X. (2005). Analyzing the cultural content of web sites: a cross-
national comparison of China, India, Japan, and US. International Marketing Review,
22, 129–146.

76
Sismeiro, C., & Bucklin, R. E. (2004). Modeling purchase behavior at an e-commerce web
site: a task-completion approach. Journal of Marketing Research, 41, 306–323.
Steenkamp, J.-B. E. M., Hofstede, F. T., & Wedel, M. (1999). A cross-national investigation
into the individual and national cultural antecedents of consumer innovativeness.
Journal of Marketing, 63, 55–69.
Valenzuela, A., Dhar, R., & Zettelmeyer, F. (2009). Contingent response to self-
customization procedures: implications for decision satisfaction and choice. Journal
of Marketing Research, 46, 754–763.
van Everdingen, Y., & Waarts, E. (2003). The effect of national culture on the adoption of
innovations. Marketing Letters, 14, 217–232.
Yaveroglu, I. S., & Donthu, N. (2002). Cultural influences on the diffusion of new products.
Journal of International Consumer Marketing, 14, 49–63
Yeniyurt, S., & Townsend, J. (2003). Does culture explain acceptance of new products in a
country? An empirical investigation. International Marketing Review, 20, 377–396.

77
Article IV
de Bellis, E. (2015). Die 3-K-Erfolgsfaktoren von Mass Customization. Marketing Review
St. Gallen, 32 (2), 62–69.
The final publication is available at:
http://link.springer.com/article/10.1007/s11621-015-0519-3

78
Die 3-K-Erfolgsfaktoren von Mass Customization
Emanuel de Bellisa
aCenter for Customer Insight, University of St. Gallen, Switzerland

79
Zusammenfassung
Während Mass Customization in vielen Industrien ein fester Bestandteil des Marketings
geworden ist, besteht unter Marketingmanagern nach wie vor Unklarheit über die
zugrundeliegenden Mechanismen und Stellhebel. Der Beitrag beleuchtet anhand aktueller
Forschungsergebnisse eine Reihe wichtiger Erfolgsfaktoren und ordnet sie drei Säulen zu.

80
Hauptteil
Rund um den Globus werden massgeschneiderte Produkt- und Servicelösungen
angeboten und als Wundermittel gegen schrumpfende Absatzmärkte und steigende
Wettbewerbsintensität gepriesen (Eliason 2012). Im Fokus von Marketingmanagern steht
insbesondere Mass Customization (MC), was den Konsumenten erlaubt, Konsumgüter
individuell zu konfigurieren und exakt auf ihre Bedürfnisse zuzuschneiden. Über 35‘000
Konfiguratoren sind weltweit in Gebrauch und ermöglichen MC in einer Vielzahl von
Industriezweigen (siehe Abb. 1 und www.configurator-database.com). Aus dem
Automobilmarkt ist bekannt, dass bis zu 70% der Kaufinteressenten ihr Fahrzeug online
konfigurieren, bevor sie beim Händler eine Bestellung aufgeben (Stadler et al. 2012). Andere
Autoren heben hervor, dass der Erfolg von MC stark von der jeweiligen Industrie und
Produktkategorie abhängt (Da Silveira/Borenstein/Fogliatto 2001; Pollard/Chuo/Lee 2008).
Um MC im Markt möglichst effektiv anzuwenden, ist die Kenntnis von universalen
Erfolgsfaktoren unabdingbar.
--- Abb. 1 hier einfügen ---
Ein aufstrebendes Forschungsfeld zeigt, dass MC im Vergleich zu herkömmlichen
Konsumangeboten sowohl die Entscheidungszufriedenheit als auch die Zahlungsbereitschaft
von Konsumenten signifikant erhöhen kann (Valenzuela/Dhar/Zettelmeyer 2009). Dies wird
nicht nur dem verbesserten Einklang von individuellen Präferenzen mit dem konfigurierten
Produkt zugeschrieben, sondern basiert auch auf dem investierten Einsatz sowie auf dem
Stolz, etwas Eigenes kreiert zu haben (Franke/Schreier/Kaiser 2010). Gleichzeitig wird
jedoch hervorgehoben, dass MC zu erhöhter Entscheidungskomplexität und verminderter
mentaler Visualisierung des Produkts führen kann – mit potenziell negativen Konsequenzen
für Konsumenten und Unternehmen (Broniarczyk/Griffin 2014; Hildebrand/Häubl/Herrmann
2014). Der vorliegende Aufsatz beleuchtet eine Reihe von Erfolgsfaktoren, die unabhängig
vom angebotenen Produkt für Marketingmanager relevant erscheinen, um die Wirkung und
Reichweite von MC zu optimieren (siehe Abb. 2). Dabei werden auch Umstände
herausgearbeitet, bei denen MC weniger zu empfehlen ist. Diese Erfolgsfaktoren werden drei
Säulen zugeordnet; den 3 K (Konsument, Kontext und Konfigurator).
--- Abb. 2 hier einfügen ---

81
Säule 1: Der konfigurierende Konsument
Ein Treiber des Erfolgs von MC ist das je nach Konsument unterschiedlich stark
ausgeprägte Bedürfnis nach Einzigartigkeit (need for uniqueness; Franke/Schreier 2008).
Dies steht in engem Zusammenhang mit der Möglichkeit, via MC Produkte zu kreieren,
welche subjektiv und/oder objektiv einzigartig sind. Einzigartige Produkte erhöhen wiederum
die Produktdiffusion und ermöglichen potenziell höhere Gewinnmargen. Ein umfangreiches
Forschungsprogramm des Autors zeigt, dass die Konfiguration einzigartiger Produkte durch
ein Gefühl der Überlegenheit getrieben wird. Dies deutet darauf hin, dass Konfiguratoren von
einem Teil der Konsumenten (implizit oder explizit) genutzt werden, um das eigene
Überlegenheitsgefühl zu bestätigen oder ein solches Gefühl zu erlangen. Für
Marketingmanager impliziert dies, dass Vergleiche mit anderen Konsumenten entscheidend
sind. So könnte es von Vorteil sein, die Meinung oder Konfiguration von anderen
Konsumenten in den Konfigurator einzubauen, um soziale Vergleiche zu ermöglichen und
Status-Gefühle hervorzurufen.
Andere Studienergebnisse zeigen, dass insbesondere narzisstische Konsumenten dazu
neigen, einzigartige Produkte zu konfigurieren (de Bellis et al. 2015a; Lee/Gregg/Park 2013).
Dabei ist anzunehmen, dass narzisstische Konsumenten generell öfter Konfiguratoren
benutzen. Dies hat gewichtige Implikationen für Unternehmen, weil Narzissten innerhalb
ihres Umfelds oftmals als Meinungsführer gelten und bereit sind, Informationen zu ihrem
Konsumverhalten mit anderen zu teilen (Baumgarten 1975). Des Weiteren wird Narzissmus
nicht nur als Persönlichkeitseigenschaft, sondern auch als temporärer Zustand verstanden
(Sakellaropoulo/Baldwin 2007). Manipulierte Werbebotschaften (z.B. „Sie beeindrucken.
Wie Ihr neuer Audi A6.“) können einen narzisstischen Zustand auslösen und das
anschliessende Konfigurationsverhalten beeinflussen, indem Konsumenten signifikant
einzigartigere und teurere Fahrzeuge zusammenstellen (de Bellis et al. 2015a). Im Rahmen
der zunehmenden Verschmelzung von Konfiguratoren und klassischen
Unternehmenswebseiten (siehe www.audi.de) können solche narzisstischen Elemente relativ
einfach via Marketingkommunikation (z.B. Bannerwerbung, Werbespots) in die Praxis
eingebaut werden, wobei ethische Aspekte zwingend mitberücksichtig werden müssen.
Neben universellen Persönlichkeitseigenschaften gibt es eine Reihe von intra-
individuellen Faktoren, welche den Umgang mit Konfiguratoren determinieren. So zeigt ein
Forschungsstrang von Franke und Kollegen, dass der Mehrwert von MC stark von der
Ausprägung der eigenen Präferenzen abhängt: Wenn Konsumenten keine klaren
Vorstellungen über das zu konfigurierende Produkt haben, werden sie von der Flut von

82
Attributen und Entscheidungen in vielen Konfiguratoren überwältigt sein – und deshalb eine
niedrigere Entscheidungszufriedenheit aufweisen oder gar zum Nicht-Kauf tendieren. So
konnte gezeigt werden, dass der Erfolg von MC insbesondere auf denjenigen Konsumenten
beruht, welche (1) einen besseren Einblick in ihre eigenen Präferenzen haben, (2) ihre
Präferenzen besser ausdrücken können, und (3) eine höhere Involvierung in das Produkt
aufweisen (Franke/Keinz/Steger 2009). Gleichzeitig wird aber auch argumentiert, dass die
Konfiguration von Produkten das Erlernen der eigenen Präferenzen (zumindest mittel- bis
langfristig) erleichtern kann.
Die erste Säule hat gezeigt, dass die Persönlichkeitseigenschaften eines Konsumenten
bei der Benutzung von MC eine bedeutende Rolle spielen. Trotzdem ist erstaunlich wenig
darüber bekannt, inwiefern der Erfolg von MC auf den spezifischen Charakteristiken eines
Konsumenten beruht, obwohl sich dadurch wertvolle Informationen zur
Kundensegmentierung gewinnen lassen und Konfigurationen sogar in eine bestimmte
Richtung (z.B. mehr Einzigartigkeit) gelenkt werden können.
Säule 2: Kontext der Konfiguration
Der Kontext einer Konfiguration umfasst sowohl kulturelle, soziale, als auch situative
Aspekte. Die Kultur formt gesellschaftliche Normen und beeinflusst dadurch das
Konsumverhalten (Kaynak/Herbig 2014). So wird bspw. dem asiatischen Konsumenten
neben besonderen Präferenzen für Farben und ästhetische Eigenschaften eine andere Art der
Informationsverarbeitung zugeschrieben. Während der westliche Konsument oft auf einzelne
Attribute von Produkten fokussiert (analytische Verarbeitung), achtet der Konsument in
Fernost vermehrt auf ganzheitliche Aspekte von Produkten sowie auf deren Einbettung in den
Kontext (holistische Verarbeitung; Nisbett 2003). Solche kulturellen Unterschiede sind
insbesondere bei der Konfiguration von Konsumgütern relevant, weil potenziellen Kunden
dabei eine Vielzahl von Informationen dargeboten wird. Obwohl MC in Asien als
Konsumententrend gilt (Accenture 2012), zeigen neue Studienergebnisse, dass herkömmliche
Konfiguratoren in asiatischen Märkten nachteilige Wirkungen erzeugen können: Während
MC in Deutschland zu einer erhöhten Kaufintention führt, verringert MC diese beim
singapurischen Konsumenten aufgrund der ungleichen Informationsverarbeitung (de Bellis et
al. 2014).
Neben diesen generischen Unterschieden zwischen Ost und West darf nicht
vernachlässigt werden, dass gerade in den asiatischen Wachstumsmärkten grundlegend
verschiedene Kulturen existieren und dass sich deren Konsumenten aufgrund des neu

83
erlangten Wohlstands auch lokal stark voneinander unterscheiden. So zeigen die Daten eines
deutschen Fahrzeugherstellers, dass der Erfolg von MC stark vom unterschiedlichen Grad der
Unsicherheitsvermeidung (uncertainty avoidance; Hofstede/Hofstede/Minkov 2010) abhängt.
Konsumenten mit niedriger Unsicherheitsvermeidung (z.B. Chinesen) benötigen im
Vergleich zu denjenigen mit hoher Unsicherheitsvermeidung (z.B. Japaner) mehr Zeit, um
eine Konfiguration abzuschliessen, was sich negativ auf ihre Kaufwahrscheinlichkeit
auswirkt (de Bellis et al. 2015b). Trotz ihrem Drang, die innere Unsicherheit zu vermeiden,
teilen erstere Konsumenten ihre Konfiguration deutlich seltener via Email oder soziale
Medien mit anderen Konsumenten. Diese Feldergebnisse deuten darauf hin, dass in Märkten
mit hoher Unsicherheitsvermeidung Werkzeuge (z.B. Online Assistenzsysteme) zur
Verfügung gestellt werden sollten, welche es Kunden erlauben, ihre inhärente Unsicherheit
zu vermindern.
Im Gegensatz zum kulturellen Kontext bezieht sich der soziale Kontext einer
Konfiguration auf die Interaktion mit anderen. Die zunehmende Verflechtung von
Konfiguratoren und sozialen Medien ermöglicht es Konsumenten, ihr konfiguriertes Produkt
via Facebook & Co. mit Freunden zu teilen. Solche Schnittstellen ermöglichen Anerkennung
und soziale Absicherung, während das Unternehmen von Mundpropaganda profitiert. Eine
Reihe von Feld- und Laborstudien hat jedoch gezeigt, dass das Feedback von anderen
Konsumenten die Entscheidungskomplexität erhöhen und die Einzigartigkeit einer
Konfiguration vermindern kann, was sich in schlechteren Produktevaluationen wiederspiegelt
(Hildebrand et al. 2013). Andere Forschungsarbeiten zeigen wiederum, dass der
Interaktionspartner eine zentrale Rolle einnimmt; die Interaktion mit Freunden führt bspw. zu
Konfigurationen in höherer Preislage als mit Experten (wie z.B. Fahrzeughändlern;
Beck 2014). Darüber hinaus entscheidet die spezifische Kommunikationsweise des
Interaktionspartners über die Reaktion des konfigurierenden Konsumenten.
Studienergebnisse des Autors zeigen, dass ich-zentrierte Kommunikation (wie sie für
Narzissten bekannt ist) einen grösseren Einfluss auf die Einzigartigkeit einer Konfiguration
hat.
Auch gilt es zu berücksichtigen, für wen ein Produkt konfiguriert wird. So können
sich Geschenkkonfigurationen aufgrund der investierten Zeit und des Zusatzaufwandes
sowohl auf den schenkenden als auch auf den beschenkten Konsumenten positiv auswirken
(Moreau/Bonney/Herd 2011; Pizzetti et al. 2013). Neben diesen sozialen Kontextfaktoren
gibt es eine Reihe von situativen Variablen, wie z.B. Nutzung von MC via Computer, Tablet
oder Smartphone, welche die Konfiguration beeinflussen können. Während Produkte immer

84
häufiger mobil konfiguriert werden, ist noch gänzlich unklar, wie sich dies auf das
Kundenerlebnis auswirkt.
Dieser Überblick hat die Bedeutung des spezifischen Kontexts einer Konfiguration
beleuchtet. Nur wenn Unternehmen diese kulturellen, sozialen und situativen Gesichtspunkte
soweit möglich kennen und berücksichtigen, können sie optimal vom zukünftigen Wachstum
in Fernost, der allgegenwärtigen Präsenz von sozialen Medien oder dem Trend zu mobiler
Internetnutzung profitieren.
Säule 3: Design des Konfigurators
Während der Konsument sowie der Kontext einer Konfiguration oftmals gegeben
sind, bietet das Design eines Konfigurators für Marketingmanager viele Stellhebel. In der
Literatur werden zwei grundlegende Konfigurationsformate unterschieden: Ein sequentielles
Format führt den Konsumenten Attribut für Attribut durch den Konfigurationsprozess,
während der Konsument bei einem simultanen Format aus gebündelten Vorkonfigurationen
wählen kann (Valenzuela et al. 2009). Eine ausführliche Marktanalyse des Autors zeigt, dass
sequentielle Formate in westlichen Märkten die grosse Mehrheit stellen (45-55%) und nur
wenige Hersteller ein simultanes Format anbieten (5-10%; der Rest besteht aus einem Mix
beider Formate). Weitere Konfigurationsformate sind denkbar, wie bspw. die Konfiguration
mittels vorkonfigurierter Vorlagen (customization via starting solutions; Hildebrand et al.
2014). Dabei wählen Konsumenten zunächst eine vorkonfiguriertes Vorlage, bevor sie ihre
Konfiguration verfeinern können, was die Entscheidungskomplexität verringern und die
mentale Visualisierung des Produkts erhöhen kann. Andere Autoren argumentieren zudem,
dass das Ersetzen von attributspezifischen Bezeichnungen (z.B. Farbe, Felge) durch
thematische Bezeichnungen (z.B. Sportpaket) zu einer optimierten Bedürfnisorientierung
führt (Mazur 2013).
Neben der Veränderung der Grundstruktur eines Konfigurators ist relativ wenig
darüber bekannt, wie einzelne Bausteine den Entscheidungsprozess von Konsumenten
beeinflussen. Ein solcher Baustein besteht bspw. im Setzen von Defaults, also der
voreingestellten Auswahl eines Attributlevels, was Konsumenten als Navigationshilfe durch
den Konfigurationsprozess dienen kann (Beck 2014). Um das volle Potenzial von MC
auszuschöpfen, wäre es zudem denkbar, dass dem Konsumenten am Ende einer
Konfiguration mitgeteilt wird, ob seine Konfiguration einzigartig ist (d.h. ob kein anderer
Konsument das exakt gleiche Produkt konfiguriert hat, was bei komplexen Konfiguratoren
oftmals zutrifft). Wenn dem so ist, könnten Unternehmen die Option anbieten, die genau

85
gleiche Konfiguration (gegen einen Aufpreis) sperren zu lassen, um die Einzigartigkeit des
Produkts auch in naher Zukunft zu gewährleisten. Eine weitere Möglichkeit besteht im
Einbau von spielerischen Bausteinen in Konfiguratoren (product gamification; Deterding et
al. 2011). Studienergebnisse zeigen, dass bspw. das Freispielen einzelner Attributlevels als
Herausforderung wahrgenommen wird, was wiederum das Kundenerlebnis verbessern kann
(Schlager et al. 2015).
Interessant erscheint der Umstand, dass relativ wenig über das eigentliche Kunden-
und Klickverhalten im Konfigurator bekannt ist. Vor diesem Hintergrund hat der Autor eine
MouselabWeb-Studie (siehe www.mouselabweb.org) durchgeführt, bei der 136 deutsche
Konsumenten einen nachgeahmten Fahrzeugkonfigurator präsentiert bekamen und anhand
von insgesamt 44 Attributlevels ihr Wunschfahrzeug zusammenzustellen konnten. Die
Ergebnisse zeigen, dass der Name sowie der Preis eines Attributlevels im Durchschnitt ca.
drei Mal konsultiert wurden (MName = 2.66; MPreis = 3.30), während dem Bild
überdurchschnittlich viel Aufmerksamkeit zukam (MBild = 6.16). Ebenfalls interessant
erscheint der Umstand, dass die Angabe des Marktanteils eines Attributlevels gleich oft
geöffnet wurde wie dessen Name (MMarktanteil = 2.66). Dies hebt die Wichtigkeit von visueller
Information hervor und deutet darauf hin, dass Konsumenten Hinweise auf die
Einzigartigkeit eines Attributlevels in ihren Entscheidungsprozess integrieren – sei es, um das
eigene Produkt besonders einzigartig zu gestalten, oder um nicht von der Norm abzuweichen.
Um mehr über den zugrundeliegenden Konfigurationsprozess zu erfahren, könnte zukünftige
Forschung untersuchen, welche Entscheidungsstrategien Konsumenten verfolgen und ob
simple Heuristiken den Konfigurationsprozess am besten abbilden, ähnlich wie in anderen
Domänen (z.B. Essensentscheidungen; Schulte-Mecklenbeck et al. 2013).
Dieser Abschnitt hat gezeigt, dass Hersteller anhand der Wahl eines geeigneten
Konfigurationsformats sowie durch die Integration von verschiedenen Bausteinen grossen
Handlungsspielraum haben, um das Kundenerlebnis von MC zu optimieren. Abb. 3 fasst die
abgeleiteten Erfolgsfaktoren zusammen.
--- Abb. 3 hier einfügen ---
Fazit und Ausblick
Der zunehmende Erfolg von Mass Customization hat die Marketingdisziplin im
letzten Jahrzehnt stark verändert. Mittels internetbasierter Konfiguratoren ist es heute in
vielen Industriezweigen möglich, Produkte exakt auf die individuellen Kundenbedürfnisse

86
zuzuschneiden. Der vorliegende Aufsatz hat auf der Basis aktueller Forschung eine Reihe
von Erfolgsfaktoren aufgezeigt, welche drei Säulen zugeordnet wurden: den konfigurierenden
Konsumenten, den Kontext einer Konfiguration, sowie das Design des Konfigurators. Dabei
erscheint es wichtig hervorzuheben, dass die 3 K nicht isoliert betrachtet werden sollten. So
wurden u.a. Interaktionseffekte zwischen dem kulturellen Kontext und
Konfigurationsformaten nachgewiesen, welche darauf hindeuten, dass asiatische Kulturen
besser auf simultane an Stelle von sequentiellen Konfiguratoren reagieren (de Bellis et al.
2014). Ebenso gilt es zu beachten, dass spezifische Konfigurator-Bausteine
(z.B. Gewährleistung der Einzigartigkeit eines Produkts) für bestimmte Konsumenten
besonders wertvoll sind (Narzissten), während sie für andere nicht relevant oder gar
nachteilig sein können (Konformisten).
Ein Faktor, der in diesem Artikel bewusst ausser Acht gelassen wurde, ist das zu
konfigurierende Produkt und die dahinterstehende Industrie (siehe Pollard et al. 2008), um
möglichst universale Handlungsempfehlungen zu geben. Auch erhebt die vorgenommene
Auflistung der Erfolgsfaktoren keinen Anspruch auf Vollständigkeit; die drei Säulen sollen
vielmehr als mögliche Klassifikation für weitere Erfolgsfaktoren dienen. Das daraus
resultierende konzeptionelle Modell soll sowohl Praktikern als auch Akademikern die
unterschiedlichen Facetten von MC näher bringen und sie mit den wichtigsten Stellhebeln
vertraut machen.

87
Literaturverzeichnis
Accenture (2012): Asia consumer product trends: Implications for retailers and
manufacturers, www.accenture.com/us-en/Pages/insight-asia-consumer-product-
trends-implications-retailers-manufacturers.aspx, Abruf 01.10.2014.
Baumgarten, S. A. (1975): The innovative communicator in the diffusion process, in: Journal
of Marketing Research, 12, 1, S. 12-18.
Beck, L. (2014): Der Preis der Freundschaft – Soziale Interaktion in Produktkonfiguratoren,
in: Marketing Review St. Gallen, 31, 5, S. 73-83.
Broniarczyk, S. M./Griffin, J. (2014): Decision difficulty in the age of consumer
empowerment, in: Journal of Consumer Psychology, 24, 4, S. 608-625.
Da Silveira, G./Borenstein, D./Fogliatto, F. S. (2001): Mass customization: Literature review
and research directions, in: International Journal of Production Economics, 72, 1, S.
1-13.
de Bellis, E. et al. (2015a): The mass-customizing shopper: How narcissism drives consumers
to configure unique products (im Reviewprozess).
de Bellis, E. et al. (2015b): Cross-national differences in uncertainty avoidance predict the
effectiveness of mass customization across East Asia: A large-scale field
investigation, in: Marketing Letters (im Druck).
de Bellis, E. et al. (2014): From global rollout to local failure: Product customization systems
clash with holistic information processing, in: Society for Consumer Psychology,
Washington DC.
Deterding, S./Dixon, D./Khaled, R./Nacke, L. (2011): From game design elements to
gamefulness: Defining gamification, in: Proceedings of the 15th International
Academic MindTrek Conference, Tampere.
Eliason, E. (2012): 3 reasons why mass customization is the future of consumer products,
www.huffingtonpost.com/erik-eliason/mass-customization_b_1313875.html, Abruf
01.10.2014.
Franke, N./Keinz, P./Steger, C. J. (2009): Testing the value of customization: When do
customers really prefer products tailored to their preferences?, in: Journal of
Marketing, 73, 5, S. 103-121.
Franke, N./Schreier, M. (2008): Product uniqueness as a driver of customer utility in mass
customization, in: Marketing Letters, 19, 2, S. 93-107.

88
Franke, N./Schreier, M./Kaiser, U. (2010): The „I designed it myself“ effect in mass
customization, in: Management Science, 56, 1, S. 125-140.
Hildebrand, C. et al. (2013): Conformity and the crowd, in: Harvard Business Review, 91, 7,
S. 23-24.
Hildebrand, C./Häubl, G./Herrmann, A. (2014): Product customization via starting solutions,
in: Journal of Marketing Research, 51, 6, S. 707-725.
Hofstede, G. H./Hofstede, G. J./Minkov, M. (2010): Cultures and organizations—Software of
the mind: Intercultural cooperation and its importance for survival, 3. Aufl., New
York.
Kaynak, E./Herbig, P. (2014): Handbook of cross-cultural marketing, Binghamton.
Lee, S. Y./Gregg, A. P./Park, S. H. (2013): The person in the purchase: Narcissistic
consumers prefer products that positively distinguish them, in: Journal of Personality
and Social Psychology, 105, 2, S. 335-352.
Mazur, M. (2013): Bedürfnisorientierte Gestaltung von Kontaktpunkten, in: Marketing
Review St. Gallen, 30, 6, S. 34-49.
Moreau, C. P./Bonney, L./Herd, K. B. (2011): It’s the thought (and the effort) that counts:
How customizing for others differs from customizing for oneself, in: Journal of
Marketing, 75, 5, S. 120-133.
Nisbett, R. E. (2003): The geography of thought, New York.
Pizzetti, M. et al. (2013): ‘I designed it myself – just for you’: Effects of gift personalization
on giver and recipient, and the role of product involvement, self-construal, and
gender, in: European Marketing Academy Conference, Istanbul.
Pollard, D./Chuo, S./Lee, B. (2011): Strategies for mass customization, in: Journal of
Business & Economics Research, 6, 7, S. 77-85.
Sakellaropoulo, M./Baldwin, M. W. (2007): The hidden sides of self-esteem: Two
dimensions of implicit self-esteem and their relation to narcissistic reactions, in:
Journal of Experimental Social Psychology, 43, 6, S. 995-1001.
Schlager, T. et al. (2015): Product gamification, in: Society for Consumer Psychology,
Phoenix.
Schulte-Mecklenbeck, M. et al. (2013): A lack of appetite for information and computation:
Simple heuristics in food choice, in: Appetite, 71, S. 242-251.
Stadler, R. et al. (2012): Defaults als Navigationshilfen in Produktkonfiguratoren – ein
Beispiel aus der Automobilindustrie, in: Marketing Review St. Gallen, 29, 2, S. 42-
46.

89
Valenzuela, A./Dhar, R./Zettelmeyer, F. (2009): Contingent response to self-customization
procedures: Implications for decision satisfaction and choice, in: Journal of Marketing
Research, 46, 6, S. 754-763.
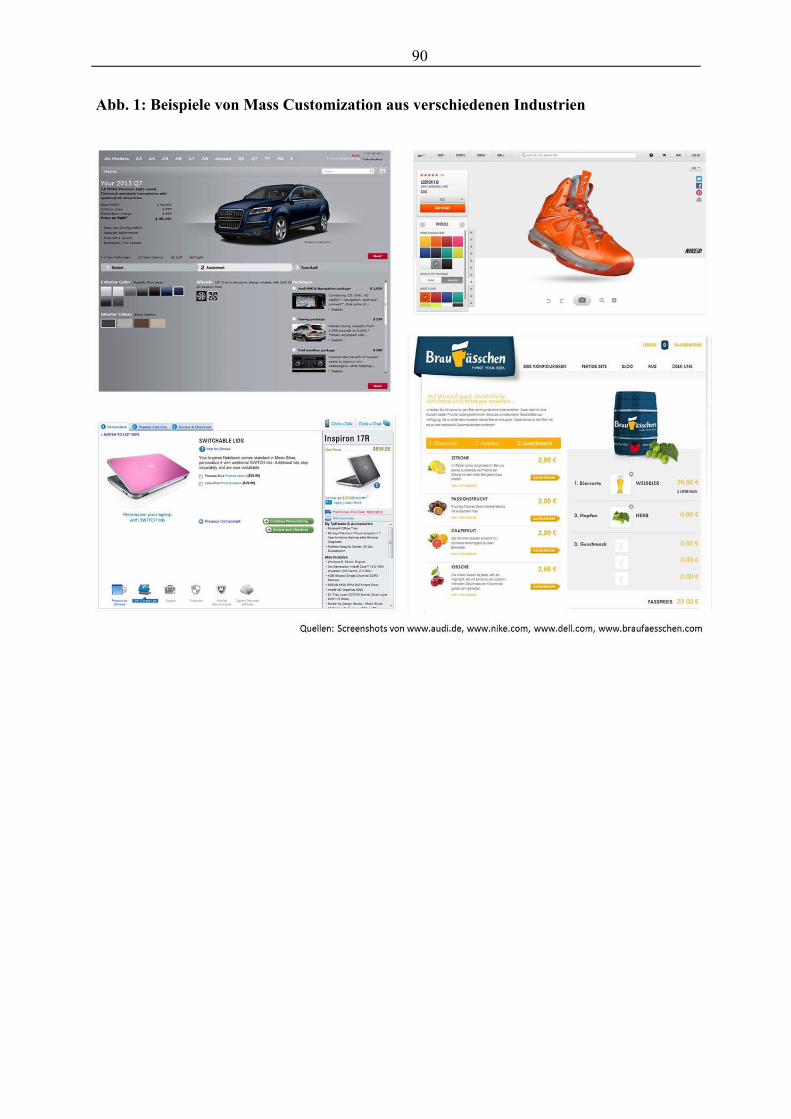
90
Abb. 1: Beispiele von Mass Customization aus verschiedenen Industrien

91
Abb. 2: Konzeptionelles Modell von Mass Customization
Legende: Mass Customization kann ökonomische Zielvariablen einerseits verbessern (z.B.
via grösserem Einklang zwischen Präferenzen und Produkt) aber gleichzeitig auch
verschlechtern (z.B. via erhöhter Entscheidungskomplexität). Die 3-K-Erfolgsfaktoren
beeinflussen diesen Prozess sowohl direkt als auch indirekt.
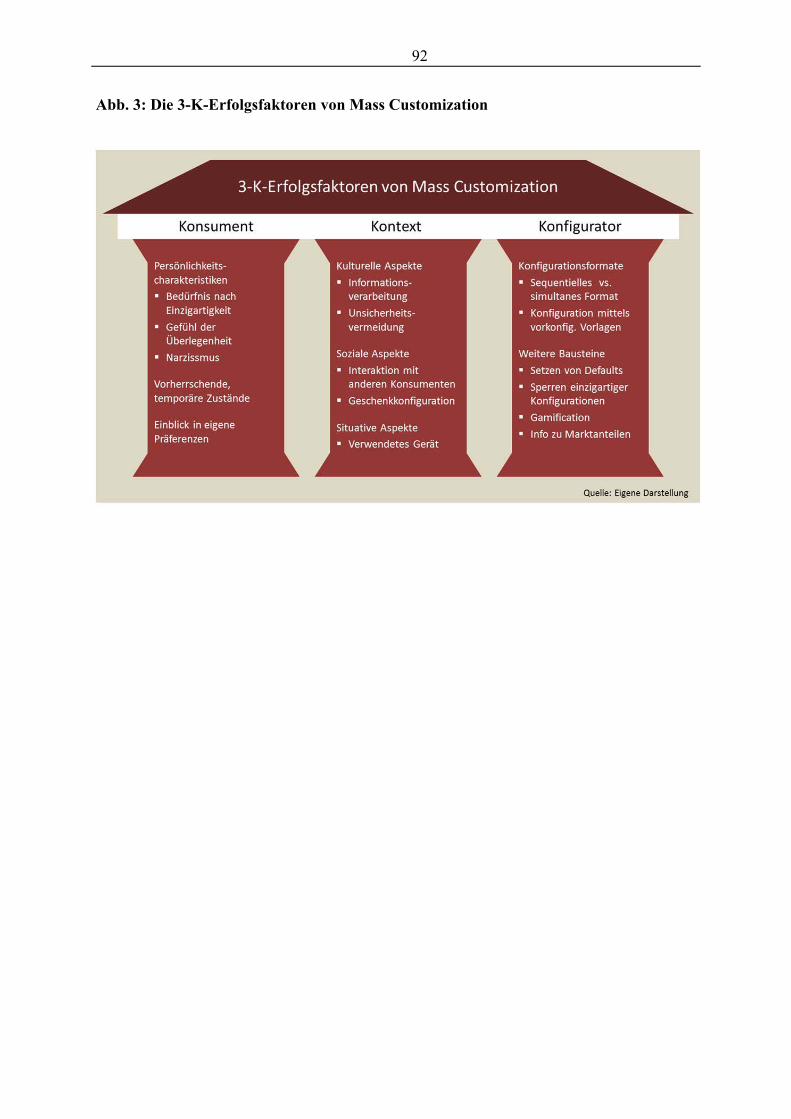
92
Abb. 3: Die 3-K-Erfolgsfaktoren von Mass Customization

93
Appendix 1: Zusammenfassung
Mass Customization ist für viele Unternehmen bereits ein fester Bestandteil des
Marketings. Trotzdem besteht unter Marketingmanagern Unklarheit über die
zugrundeliegenden Mechanismen sowie die Stellhebel zur Optimierung des
Kundenerlebnisses.
Die akademische Literatur hebt den Mehrwehrt von Mass Customization und die
zugrundeliegenden psychologischen Prozesse hervor. Gleichzeitig wurden auch
einschränkende Faktoren beleuchtet, welche den Erfolg von Konfiguratoren
vermindern.
Dieser Beitrag beleuchtet anhand aktueller Forschungsergebnisse diverse
Erfolgsfaktoren von Mass Customization (die 3 K; Konsument, Kontext und
Konfigurator) und leitet daraus akademische Forschungslücken sowie praxisnahe
Handlungsempfehlungen ab.

94
Appendix 2: Kernthesen
Die Erfolgsfaktoren von Mass Customization können dem Konsumenten, dem
Kontext, sowie dem Konfigurator zugeordnet werden.
Die Persönlichkeit von Konsumenten (z.B. Narzissmus) wirkt sich direkt auf die
Einzigartigkeit ihrer Konfiguration aus.
Der kulturelle Kontext einer Konfiguration (z.B. Grad der Unsicherheitsvermeidung)
bestimmt über Kauf oder Nicht-Kauf.
Die Wahl des Konfigurationsformats (z.B. sequentielles Format) beeinflusst die
Zahlungsbereitschaft von Konsumenten.

95
Appendix 3: Handlungsempfehlungen
Die Möglichkeit, einzigartige Produkte zu kreieren, ist eines der Kernargumente für
Mass Customization. Um dieses Potenzial auszuschöpfen, können Unternehmen die
Option anbieten, die exakt gleiche Konfiguration sperren zu lassen.
Der Grad an Unsicherheitsvermeidung bestimmt den Erfolg von Mass Customization.
In Märkten mit hoher Unsicherheitsvermeidung sollten Online Assistenzsysteme
bereitgestellt werden, um die inhärente Unsicherheit von Kunden zu reduzieren.
Das Design eines Konfigurators bietet viele Stellhebel zur Optimierung des
Kundenerlebnisses. Der Einbau spielerischer Bausteine erhöht die Herausforderung
und kann dadurch ökonomische Zielvariablen verbessern.
Marketingmanager sollten die 3-K-Erfolgsfaktoren und ihre potenziellen
Interaktionseffekte kennen, um von den vielseitigen Möglichkeiten von MC optimal
Gebrauch machen zu können.

96
Article V
de Bellis, E., Schulte-Mecklenbeck, M., Brucks, W., Herrmann, A., and Hertwig, R.
(submitted). As Light Goes Down Speeding Goes Up. Nature.
This research has been presented at the 2014 Society for Judgment and Decision Making
(SJDM).
97
As Light Decreases, Speeding Increases
Emanuel de Bellisa
Michael Schulte-Mecklenbeckb
Wernher Brucksc
Andreas Herrmanna
Ralph Hertwigb
aCenter for Customer Insight, University of St. Gallen, Switzerland
bMax Planck Institute for Human Development, Germany cTraffic Division of the City of Zurich, Switzerland

98
Abstract
Worldwide, more than one million people die on the roads each year1. One third of these fatal
accidents are attributed to speeding, with properties of the individual driver and the
environment regarded as key contributing factors1-3. The quality of visual conditions has been
shown to affect drivers’ speed perception, but the directionality of its effect on speeding is
disputed. One set of findings suggests that drivers underestimate their speed when driving
under adverse visual conditions (for example, in fog) and therefore accelerate4-8; other
research has observed a decrease in driving speed under such conditions9-12. However, both
sets of findings are based on driving simulations. Here we examine drivers’ real-world
speeding behaviour and its interaction with illuminance, a ubiquitous environmental property
defined as the luminous flux incident on a surface. Drawing on an analysis of 1.2 million
vehicle movements, we show that reduced illuminance levels are associated with an increase
in speeding. This relationship persists when we control for factors that are known to influence
speeding (for example, fluctuations in traffic volume or time of day) and consider proxies of
illuminance (for example, sight distance). Traffic planners can act on the inverse
illuminance‒speeding relationship by testing the extent to which improved street lighting can
attenuate speeding and the associated accident rates. Our analysis illustrates one way of using
big data to examine a hypothesized relationship that has been difficult to test conclusively in
laboratory settings.

99
Main Body
In theory, every driver knows one of the key principles of road safety: If visual
conditions are poor, reduce your speed. In practice, however, drivers appear not to slow down
sufficiently to compensate for the higher risks associated with adverse visual conditions13,14.
Perception research suggests that drivers’ ability to recognize non-illuminated objects that
demand a reduction in speed (for example, crossroads or pedestrians) is substantially
diminished under low contrast, where the difference in brightness between an object and the
background is reduced. Whereas ambient vision (which is of primary importance for
guidance of locomotion) remains effective under low contrast, focal vision (which is
responsible for visual recognition) is severely impaired15. This perceptual account is
complemented by the inferential nature of human perception. For instance, the perceived
distance of an object is inferred from, among other cues, its contrast: the higher the contrast
of an object, the closer it appears to be16. Consequently, drivers operating under adverse
visual conditions may not only take longer to recognize objects, but also overestimate their
distance17, as a result of which deceleration is delayed.
Insights from other lines of research suggest that drivers even speed up under adverse
visual conditions. According to the Thompson effect, a classic principle in vision research,
the perceived speed of moving objects is underestimated when contrast is reduced18-20.
Similar effects have been observed in functional imaging studies at lower levels of contrast,
with results showing that these estimation biases arise in the earliest visual cortical regions21.
Do these findings generalize to actual driving? Snowden et al.4 showed that participants in
computer-generated driving simulations not only perceived foggy (vs. clear) scenes to move
more slowly, but also “drove” faster than a given target speed in simulated fog. This finding
was replicated using filmed footage of actual traffic situations7,8. However, these studies have

100
been criticized for representing a poor model of motion perception in three-dimensional
environments, because contrast was reduced uniformly and independently of distance.
Indeed, recent work employing more ecologically valid fog simulations10,11 or examining
reduced levels of luminance12 (the amount of light emitted from a particular surface) has
found that drivers overestimate their speed—an estimation bias that prompts them to
decelerate.
One way to shed light on these contradictory findings is to step outside the laboratory
and investigate the effects of visual conditions in real traffic22. The only study to date to have
analysed actual driving behaviour found a reduction in speed when contrast was reduced9.
However, this study was conducted on a closed road course, contrast was reduced uniformly,
and the drivers’ view of the speedometer was obstructed. Thus, how light and speed interact
“in the wild” is still unclear. We pursued a different approach: First, we asked which of the
findings outlined above can be replicated in real traffic with all its distinctive environmental
and driver-related factors, including other road users. Second, rather than investigating
deviations from various target speeds (the standard measure in many experimental studies),
we focused on drivers who exceeded the legal speed limit. Third, we extended research on
contrast and luminance by investigating the effects of illuminance—defined as the luminous
flux incident on a surface—a ubiquitous variable that policy makers are able to influence by
environmental design (Extended Data Fig. 1).
The traffic division of the City of Zurich (Switzerland’s largest city) regularly uses
hidden radar systems to measure vehicle speed for city planning purposes. Drivers are
unaware of the measurement and are not prosecuted for speeding. Our analyses are based on
the speed measurements of 1,220,359 vehicle movements, collected in 69 urban streets
(Fig. 1) between 2007 and 2009. We calculated a speeding index by dividing the number of
vehicles that exceeded the speed limit by the total number of vehicles per street and hour. To

101
examine the illuminance‒speeding relationship, we then correlated the speeding index with
hourly matched illuminance data (measured in lux and logarithmized) as well as with several
proxies of illuminance, such as sight distance and fog (Methods and Extended Data Table 1).
Linear regression analyses that controlled for fluctuations in traffic volume yielded an
inverse relationship between illuminance and the speeding index (b = −1.241, P < 0.001,
partial η2 = 0.020), indicating that a reduction in illuminance was associated with an increase
in speeding behaviour. Specifically, a reduction in illuminance of 100 lux was associated
with an increase in speeding of 0.59%. A cubic polynomial regression fitted the obtained
pattern in Fig. 2 best, with a significant linear (b = −586.4, P < 0.001), quadratic (b = 74.3,
P < 0.001), and cubic term (b = −169.7, P < 0.001). The cubic function explained
significantly more variance than a quadratic function (F = 57.734, P < 0.001) and was not
outperformed by a quartic function (F = 0.600, P > 0.438). The inverse illuminance‒speeding
relationship proved robust across less frequented and highly frequented streets (Extended
Data Fig. 2), in 30 km/h and 50 km/h zones, on weekdays and at weekends, and across
seasons (Table 1).
Although finding support for the inverse illuminance‒speeding relationship during the
day and at night (Table 1), the results presented in Fig. 2 indicate that the relationship may
not be constant across the 24-hour cycle. In order to analyse this variability further, we
calculated separate regression analyses for each hour of the day. The relationship proved to
be constantly negative and significant for every hour between 8 am and 10 pm (bs < −1.101,
Ps < 0.05), a period accounting for 84.4% of daily traffic volume, and negative but mostly
non-significant at night (Extended Data Fig. 3). In addition, we considered the degree of
speeding instead of using a dichotomous measure. Performing separate regression analyses
for each speed bracket (for example, driving 31−35 km/h in a 30 km/h zone) showed that the

102
inverse relationship between illuminance and speeding was significant across speed brackets,
but that its strength declined at higher levels of speeding (Fig. 3).
Examining proxies of illuminance provided converging evidence for the inverse
illuminance‒speeding relationship. Specifically, the relative proportion of speeding was
higher when global irradiance was lower (b = −4.093, P < 0.001, partial η2 = 0.016), when
sunshine duration was shorter (b = −0.069, P < 0.001, partial η2 = 0.005), when sight distance
was shorter (b = −0.087, P < 0.001, partial η2 = 0.004), and when particulate air pollution was
higher (b = 6.323, P < 0.001, partial η2 = 0.005). We also found speeding to be increased
under foggy (vs. clear) conditions (b = 7.068, P < 0.01, partial η2 = 0.002). As a control, we
examined how precipitation—a condition in which drivers have been shown to slow
down13—impacts speeding. Speeding was indeed less pronounced when precipitation became
stronger (b = −0.161, P < 0.001, partial η2 = 0.001). In sum, various proxies of illuminance
showed that, contrary to the ABCs of road safety, drivers showed more speeding behaviour in
conditions of reduced illuminance.
The relationship between speeding and traffic accidents is well established23; a speed
reduction of only 5 km/h is generally estimated to yield a 15% decrease in accidents14.
Although the driver undoubtedly plays an important role3, as it is he or she who puts the
pedal to the metal, researchers have increasingly focused on environmental factors such as
fog, contrast, and luminance, with driving simulation studies reporting mixed results4,7,8,10-12.
Having overcome the limitation of the Snowden et al. study (a focus on isolated perceptual
mechanisms), our research confirms that illuminance is inversely related to drivers’ speeding
behaviour in the real world. In line with our results, field research on accident prevention has
shown that more natural light (as examined in the context of the change to and from daylight
saving time25,26) as well as more artificial light (as examined by manipulating the illuminance
of street lighting27,28) can result in fewer traffic accidents and fatalities. Our findings suggest
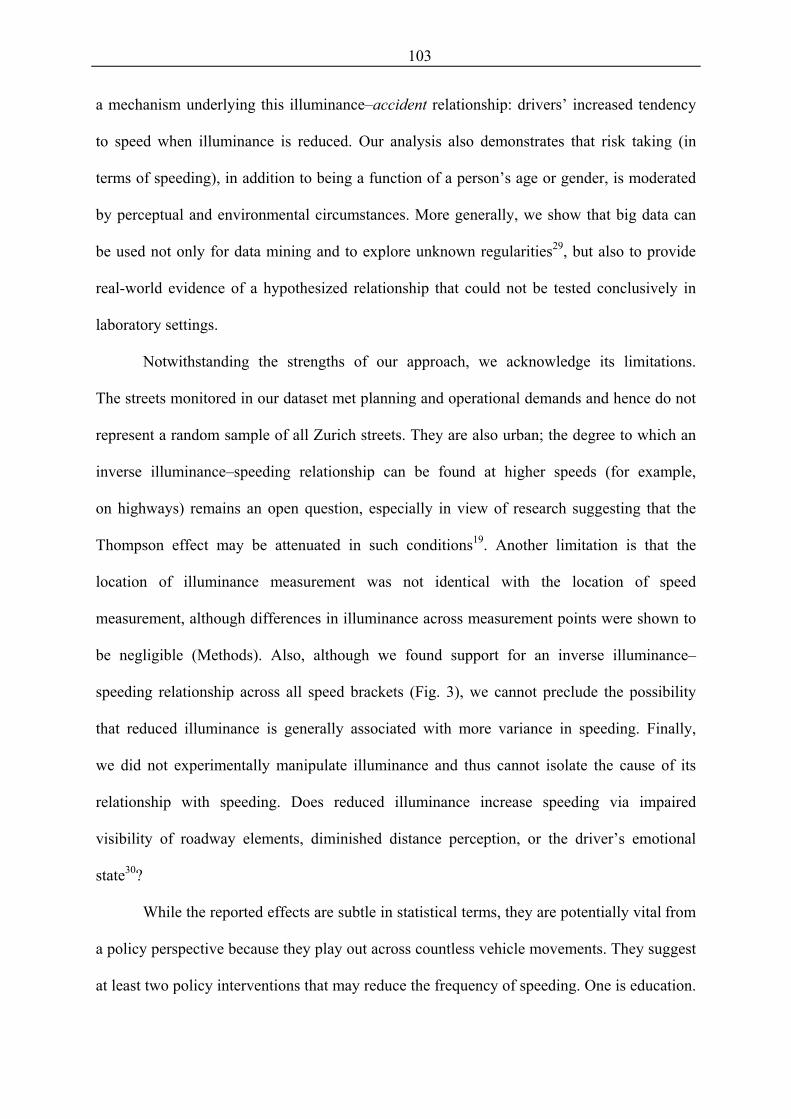
103
a mechanism underlying this illuminance‒accident relationship: drivers’ increased tendency
to speed when illuminance is reduced. Our analysis also demonstrates that risk taking (in
terms of speeding), in addition to being a function of a person’s age or gender, is moderated
by perceptual and environmental circumstances. More generally, we show that big data can
be used not only for data mining and to explore unknown regularities29, but also to provide
real-world evidence of a hypothesized relationship that could not be tested conclusively in
laboratory settings.
Notwithstanding the strengths of our approach, we acknowledge its limitations.
The streets monitored in our dataset met planning and operational demands and hence do not
represent a random sample of all Zurich streets. They are also urban; the degree to which an
inverse illuminance‒speeding relationship can be found at higher speeds (for example,
on highways) remains an open question, especially in view of research suggesting that the
Thompson effect may be attenuated in such conditions19. Another limitation is that the
location of illuminance measurement was not identical with the location of speed
measurement, although differences in illuminance across measurement points were shown to
be negligible (Methods). Also, although we found support for an inverse illuminance‒
speeding relationship across all speed brackets (Fig. 3), we cannot preclude the possibility
that reduced illuminance is generally associated with more variance in speeding. Finally,
we did not experimentally manipulate illuminance and thus cannot isolate the cause of its
relationship with speeding. Does reduced illuminance increase speeding via impaired
visibility of roadway elements, diminished distance perception, or the driver’s emotional
state30?
While the reported effects are subtle in statistical terms, they are potentially vital from
a policy perspective because they play out across countless vehicle movements. They suggest
at least two policy interventions that may reduce the frequency of speeding. One is education.

104
Drivers should be educated (for example, in driving schools) about the counterintuitive
relationship between reduced illuminance and speeding behaviour—just as they are instructed
in the effects of fatigue on reaction time. The other policy intervention is to pilot test the
extent to which increasing illuminance (for example, by installing higher-intensity or
illuminance-dependent street lighting) may reduce the likelihood of speeding and its
potentially devastating consequences.

105
Methods
1. Speeding dataset
The traffic division of the City of Zurich regularly performs speed measurements
throughout Zurich, Switzerland’s largest city, with a population of 400,000 and a daily
movement of approximately 600,000 vehicles across the city borders31. The use of hidden
radar systems means that drivers are unaware of the measurements, and they are not
prosecuted for exceeding the speed limit. Over the study period, the radar systems were
installed for on average 8 consecutive days (M = 7.7, SD = 4.2) per location and measured
each passing vehicle’s driving speed around the clock.
Our analyses are based on the speed measurements of 1,220,359 vehicle movements,
collected in 69 urban Zurich streets (Fig. 1) in both 30 km/h and 50 km/h zones between
31st May 2007 and 24th August 2009. The measurements are allotted to 5 km/h speed brackets
for each hour. To analyse the illuminance‒speeding relationship, we calculated a speeding
index (SI) by dividing the number of vehicles exceeding the speed limit by the total number
of vehicles (per street and hour), to give a scale ranging from 0 (no speeding) to 100
(all vehicles exceeded the speed limit):
= × 100
In line with local police regulations, speeding was defined as exceeding the speed
limit by more than 5 km/h32. For instance, drivers in a 30 km/h zone were considered to speed
if their driving speed was 36 km/h or higher (the same rule was applied to drivers in a 50
km/h zone, with a cut-off at 56 km/h). The illuminance‒speeding relationship persisted when
we used a hard speeding cut-off, considering speeds of 31 (51) km/h or faster in a 30 (50)
km/h zone as speeding (b = −1.870, P < 0.001 for 30 km/h zones and b = −1.349, P < 0.001
for 50 km/h zones).
Three portable traffic counters were used to measure vehicle speed (manufacturer and
share of reported measurements in brackets): (1) the KV Laser (Sodi Scientifica SpA; 25%),
which is based on laser technology without external sensors, (2) the LOTOS system (CRVM;
33%), also based on laser technology, and (3) the Radar Traffic Recorder (RTR; Multanova
AG; 42%), which is based on radar technology. Analysing the illuminance‒speeding
relationship separately for each system revealed slight variations in results, but the overall

106
picture was consistent: Illuminance was negatively related to speeding as measured by the
KV Laser (b = −1.591, P < 0.001), the LOTOS system (b = −0.429, P < 0.001), and the RTR
(b = −1.119, P < 0.001). The use of different measurement systems reduces potential
measuring errors and therefore speaks for the robustness of the results obtained.
In addition to the reported linear and polynomial regressions, we performed a linear
mixed-effects analysis using the lme4 R package33 to account for the random effects structure
of the dataset. As fixed effects, we entered illuminance and traffic volume (both
logarithmized and without interaction term) into the model. As random effects, we entered an
intercept for street as well as a by-street random slope for the effect of illuminance. The
results substantiated the previously observed inverse illuminance‒speeding relationship (b =
−0.235, SE = 0.092). A likelihood ratio test comparing the full model against a model
excluding illuminance showed that this relationship reached statistical significance (χ2 =
6.281, P < 0.05).
2. Meteorological variables
Zurich covers an area of 91.9 km2, has a maximum north‒south extension of 12.7 km,
and a maximum east‒west extension of 13.4 km34. Meteorological variables were measured
either at Zurich downtown or at Zurich airport, approximately 8 km north of that (Extended
Data Table 1). Local sunrise and sunset times were consulted to examine day/night
differences.
To analyse the extent to which illuminance might differ across the speed measurement
points, we ran two comparative analyses. First, we compared illuminance data from Zurich
airport with those from an additional meteorological station situated approximately 1 km east
of Zurich downtown (Zurich east). For the Zurich east station, data were available for about
seven months (1st January 2007 to 17th July 2007). Correlating the illuminance measures from
both stations for this timespan revealed a highly consistent pattern (r = 0.984, P < 0.001),
implying that fluctuations in illuminance across geographical locations within Zurich were
negligible. Second, we used illuminance data from each station separately to analyse the
inverse illuminance‒speeding relationship. Using illuminance measures from Zurich east to
predict the speeding index led to similar, but slightly stronger results than did using measures
from Zurich airport; as in the overall analysis, reduced illuminance was associated with
increased speeding (b = −1.781, P < 0.001).

107
References
1. World Health Organization. Global Status Report on Road Safety.
www.who.int/violence_injury_prevention/road_safety_status/2013/report/en/ (2013).
2. National Highway Traffic Safety Administration. Traffic Safety Facts: Speeding. www-
nrd.nhtsa.dot.gov/Pubs/812021.pdf (2014).
3. Gabany, S. G., Plummer, P. & Grigg, P. Why drivers speed: The speeding perception
inventory. J. Safety Res. 28, 29–36 (1997).
4. Snowden, R. J., Stimpson, N. & Ruddle, R. A. Speed perception fogs up as visibility
drops. Nature 392, 450 (1998).
5. Gegenfurtner, K. R., Mayser, H. & Sharpe, L. T. Seeing movement in the dark.
Nature 398, 475–476 (1999).
6. Weiss, Y., Simoncelli, E. P. & Adelson, E. H. Motion illusions as optimal percepts.
Nature Neurosci. 5, 598–604 (2002).
7. Horswill, M. S. & Plooy, A. M. Reducing contrast makes speeds in a video-based driving
simulator harder to discriminate as well as making them appear slower. Perception 37,
1269−1275 (2008).
8. Brooks, K. R. & Rafat, M. E. Simulation of driving in low-visibility conditions:
Does stereopsis improve speed perception? Perception 44, 145−156 (2015).
9. Owens, D. A., Wood, J. & Carberry, T. Effects of reduced contrast on the perception and
control of speed when driving. Perception 39, 1199−1215 (2010).
10. Brooks, J. O. et al. Speed choice and driving performance in simulated foggy conditions.
Accident Anal. Prev. 43, 698–705 (2011).
11. Pretto, P., Bresciani J.-P., Rainer, G. & Bülthoff, H. H. Foggy perception slows us down.
eLife 1, 1–12 (2012).
12. Pritchard, S. J. & Hammett, S. T. The effect of luminance on simulated driving speed.
Vision Res. 52, 54–60 (2012).
13. Edwards, J. B. Speed adjustment of motorway commuter traffic to inclement weather.
Transport. Res. F–Traf. 2, 1−14 (1999).
14. Al-Ghamdi, A. S. Experimental evaluation of fog warning system. Accident Anal. Prev.
39, 1065–1072 (2007).
15. Owens, D. A. & Tyrrell, R. A. Effects of luminance, blur, and age on nighttime visual
guidance: A test of the selective degradation hypothesis. J. Exp. Psychol.: App. 5,
115−128 (1999).
16. O’Shea, R. P., Blackburn, S. G. & Ono, H. Contrast as a depth cue. Vision Res. 34, 1595–
1604 (1994).

108
17. Cavallo, V., Colomb, M. & Doré, J. Distance perception of vehicle rear lights in fog.
Hum. Factors 43, 442–451 (2001).
18. Thompson, P. Perceived rate of movement depends on contrast. Vision Res. 22, 377−380
(1982).
19. Blakemore, M. R. & Snowden, R. J. The effect of contrast upon perceived speed:
A general phenomenon? Perception 28, 33–48 (1999).
20. Anstis S. Moving objects appear to slow down at low contrasts. Neural Networks 16,
933–938 (2003).
21. Vintch, B. & Gardner, J. L. Cortical correlates of human motion perception biases.
J. Neurosci. 34, 2592−2604 (2014).
22. Kemeny, A. & Panerai, F. Evaluating perception in driving simulation experiments.
Trends Cog. Sci. 7, 31–37 (2003).
23. Aarts, L. & Van Schagen, I. Driving speed and the risk of road crashes: A review.
Accident Anal. Prev. 38, 215–224 (2006).
24. Marinovic, W., Pearce, S. L. & Arnold, D. H. Attentional-tracking acuity is modulated by
illusory changes in perceived speed. Psychol. Sci. 24, 174–180 (2013).
25. Coate, D. & Markowitz, S. The effects of daylight and daylight saving time on US
pedestrian fatalities and motor vehicle occupant fatalities. Accident Anal. Prev. 36,
351−357 (2003).
26. Huang, A. & Levinson, D. The effects of daylight saving time on vehicle crashes in
Minnesota. J. Safety Res. 41, 513–520 (2010).
27. Elvik, R. & Vaa, T. The Handbook of Road Safety Measures, 2nd version (Elsevier
Science, 2009).
28. Wanvik, P. O. Effects of road lighting: An analysis based on Dutch accident statistics
1987–2006. Accident Anal. Prev. 41, 123–128 (2009).
29. Jiang, P. & Liu, X. S. Big data mining yields novel insights on cancer. Nat. Genet. 47,
103–104 (2015).
30. Xu, A. J. & Labroo, A. A. Incandescent affect: Turning on the hot emotional system with
bright light. J. Consum. Psychol. 24, 207–216 (2014).
31. Stadt Zürich. Mobilität in Zahlen. www.stadt-zuerich.ch/ted/de/index/taz/
publikationen_u_broschueren/mobilitaet-in-zahlen-2013-1.html (2013).
32. Kanton Zürich Sicherheitsdirektion. Verkehrsbussen. www.kapo.zh.ch/internet/
sicherheitsdirektion/kapo/de/faq/strassenverkehr/verkehrsbussen.html (2015).
33. Bates, D., Maechler, M. & Bolker, B. lme4: Linear Mixed-Effects Models Using S4
Classes. http://CRAN.R-project.org/package=lme4 (2012).
34. Stadt Zürich. Zahlen & Fakten. www.stadt-zuerich.ch/portal/de/index/
portraet_der_stadt_zuerich/zahlen_u_fakten.html (2013).

109
Figure 1 | Location and name of monitored streets across Zurich. The traffic division of
the City of Zurich regularly uses hidden radar systems to measure the speed of passing
vehicles for city planning purposes. Our analyses are based on the measured speed of
1,220,359 vehicle movements collected in 69 urban streets (see red dots) between 31st May
2007 and 24th August 2009.
●
●
●
●
●
●
●
●
●
●
●
●
●
●
●
●
●
●●
●●
●
●
●
●
●
●
●●
●
●
●
●
●
●
●
●
●
●
●
●
●
●
●
●
●
●
●
●
●
●●
●
●
●
●
●
●
●
●●●
●
●
●
●
●
●
●
●
●●
Agnesstrasse Girhaldenstrasse Morgentalstrasse Am Oeschbrig Gubelstrasse Mühlackerstrasse Armin-Bollinger-Weg
Gutstrasse Nordstrasse Hagenbuchrain Pflanzschulstrasse
Attenhoferstrasse Haldenstrasse Rainstrasse Ausserdorfstrasse Hammerstrasse Riedgrabenweg Bachtobelstrasse Haumesserstrasse Röslistrasse Bändlistrassse Heinrichstrasse Rossackerstrasse Baumackerstrasse Höhenring Scheideggstrasse Bellariastrasse Holzwiesweg Scheuchzerstrasse Conrad-Ferdinand-Meyer-Strasse
Huttenstrasse Schulhausstrasse Im Maas Schwellistrasse
Culmannstrasse Jungholzstrasse Sonneggstrasse Drusbergstrasse Kalchbühlstrasse Sonnenbergstrasse Eidmattstrasse Kanzleistrasse Speerstrasse Feldblumenstrasse Kilchbergstrasse Staubstrasse Feldstrasse Klebestrasse Stüssistrasse Ferdinand-Hodler-Strasse
Köschenrütistrasse Thujastrasse Kürbergstrasse Toblerstrasse
Flössergasse Kurfürstenstrasse Tulpenstrasse Freiestrasse Letzigraben Venusstrasse Freudenbergstrasse Lügislandstrasse Wehrenbachhalde Frohalpstrasse Marchwartstrasse Wolfswinkel Geibelstrasse Moosstrasse Zollikerstrasse

110
Figure 2 | Overall relationship between illuminance and speeding. Illuminance represents
the luminous flux incident on a surface per unit area averaged per hour and measured in
log(lux). The speeding index indicates the number of vehicles exceeding the speed limit
divided by the total number of vehicles, with 0 (100) implying that no vehicle (all vehicles)
exceeded the speed limit. Each data point depicts a street at a given hour and represents 1 to
640 vehicles depending on traffic volume. Results show a negative relation between
illuminance and speeding at low and high illuminance levels, but not at intermediate
illuminance levels. Note that removing outliers (for example, data points with a speeding
index of 0 and 100) or less frequented streets (for example, data points with a traffic volume
of 5 and below) does not change the overall pattern of results.

111
Figure 3 | Illuminance‒speeding relationship across speed brackets. For both 30 km/h
and 50 km/h zones, we calculated separate regression analyses for each speed bracket.
The y-axis indicates non-standardized regression coefficients and is reversed for ease of
interpretation (that is, higher numbers indicate a stronger negative relationship). Across speed
brackets, we found support for the inverse relationship between illuminance and speeding.
However, the strength of the relationship declined with increasing speeding rates. All
regression coefficients were significant at P < 0.001.

112
Table 1 | Robustness checks for the illuminance‒speeding relationship.
(a) (b)
Overall
−1.241** (0.052)
−0.854** (0.048)
Less frequented streets (below median)
−1.293** (0.078)
−1.191** (0.076)
Highly frequented streets (above median)
−1.172** (0.070)
−0.979** (0.069)
30 km/h zone
−1.538** (0.057)
−0.911** (0.053)
50 km/h zone
−0.689** (0.073)
−0.443** (0.065)
Day (sunrise to sunset)
−2.146** (0.292)
−1.991** (0.294)
Night (sunset to sunrise)
−1.639** (0.157)
−1.124** (0.152)
Noon (12.00 to 12.59 pm)
−4.697* (1.727)
−5.211* (1.727)
Weekdays (Monday to Friday)
−1.382** (0.064)
−0.947** (0.058)
Weekends and statutory holidays
−0.977** (0.088)
−0.654** (0.084)
Spring (March to May)
−1.249** (0.097)
−0.939** (0.091)
Summer (June to August)
−0.698** (0.079)
−0.639** (0.066)
Autumn (September to November)
−1.143** (0.100)
−0.555** (0.095)
Winter (December to February)
−0.923** (0.234)
−0.792** (0.212)
Reported results are non-standardized regression coefficients of the illuminance‒speeding
relationship with standard errors in parentheses. a, The speeding index is regressed on
illuminance and traffic volume (both logarithmized). b, The second model does not control
for traffic volume. Significance levels: *P < 0.01, **P < 0.001 (linear regression models).

113
Extended Data Figure 1 | Illuminance over a 24-hour period and across seasons.
We calculated the average illuminance for each hour of the day in Zurich for the
observational time period between 2007 and 2009 split into four seasons. Time of day
corresponds to the local time (UTC+1 adjusted for daylight saving time). The figure shows
the mean daily fluctuations in illuminance, from minimal illuminance values in the early
morning hours to maximum illuminance shortly after noon. Seasonal changes in illuminance
are apparent in the earlier increase in illuminance in the morning (summer < spring < autumn
< winter) and the later decrease in illuminance in the evening (summer > spring > autumn
> winter).

114
Extended Data Figure 2 | Illuminance‒speeding relationship by traffic volume.
This figure depicts the relationship between illuminance and speeding as in Fig. 2, but is split
by the traffic volume of the respective street per hour. We chose four brackets, each
containing a similar number of measurement points: 1‒5 vehicles per hour (6497
measurement points), 6‒18 (6917), 19‒55 (7012), and 56‒640 (7147). The fitted line shows
some variation across the four panels, but they all point to an inverse illuminance‒speeding
relationship.

115
Extended Data Figure 3 | Illuminance‒speeding relationship by time of day. We
calculated separate regression analyses for each hour of the day. The y-axis indicates non-
standardized regression coefficients and is reversed for ease of interpretation (that is, higher
numbers indicate a stronger negative relationship). Time of day corresponds to the local time
(UTC+1 adjusted for daylight saving time). The illuminance‒speeding relationship was
particularly strong after noon and was (with one exception) non-significant at night, when
traffic volume reaches its daily minimum.

116
Extended Data Table 1 | Variable transformations and sources.
Variable Description Aggregation/ Transformation
Unit Location Source
Traffic volume
Total number of passing vehicles per street and hour
Summed per hour and logarithmized
Number of vehicles
69 streets in Zurich
Traffic division of the City of Zurich, Switzerland
Speed Speed of passing vehicles per street and hour
Summed per hour and measured in 5 km/h speed brackets
km/h 69 streets in Zurich
Traffic division of the City of Zurich, Switzerland
Speeding index
Proportion of vehicles exceeding the speed limit per street and hour (based on speed variable)
N(speeding) / N(total) × 100
% of measured vehicles
69 streets in Zurich
Traffic division of the City of Zurich, Switzerland
Illuminance Luminous flux incident on a surface per unit area
Averaged per hour and logarithmized
lx Zurich airport / Zurich east
Swiss Federal Office of Meteorology and Climatology
Global irradiance
Electromagnetic radiation Averaged per hour and logarithmized
W/m2 Zurich airport
Swiss Federal Office of Meteorology and Climatology
Sunshine duration
Cumulative time of direct irradiance from the sun (> 120 W/m2)
Summed per hour min Zurich airport
Swiss Federal Office of Meteorology and Climatology
Sight distance
Maximal horizontal distance at which an object or light source can be clearly discerned
None (measured at 3-hour intervals)
km Zurich airport
Swiss Federal Office of Meteorology and Climatology
Particulate air pollution
Microscopic solid or liquid matter Averaged per hour and logarithmized
µg/m3 Zurich downtown
Swiss Federal Office for the Environment
Fog Low-lying clouds None (measured at 3-hour intervals)
Binary (present/absent)
Zurich airport
Swiss Federal Office of Meteorology and Climatology
Precipitation Condensation of atmospheric water vapour
Summed per hour and logarithmized
mm Zurich airport
Swiss Federal Office of Meteorology and Climatology

117
Curriculum Vitae
Personal information
Name Emanuel de Bellis
Date of birth December 20, 1985
Place of birth Basel
Education
2011−2015 University of St. Gallen
Doctoral studies in Management
2009−2011 University of Basel
Master studies in Cognitive and Decision Sciences
2005−2008 University of Basel
Bachelor studies in Psychology (Minor: Business Administration)
1999−2004 Gymnasium Kirschgarten, Basel
Matura with focus on Physics and Applied Mathematics
Work experience
2011−2015 Center for Customer Insight, University of St. Gallen
Research associate in Marketing and Consumer Behavior
2010 Consumer Science Group, Nestlé Research Center, Lausanne
Research internship
2008−2009 LP Marktforschung, Basel
Internship & part time employee