The current financial crisis and its effects on the French economy
45
1 Mid Sweden University Östersund Autumn semester 2009. Department of Social Sciences The current financial crisis and its effects on the French economy Independent work C level Presented by: DUMOULIN Etienne Supervisor: SALMAN Khalik ( PhD) ; Associate professor
Transcript of The current financial crisis and its effects on the French economy
1
Mid Sweden University Östersund
Autumn semester 2009. Department of Social Sciences
The current financial crisis and its
effects on the French economy
Independent work C level Presented by:
DUMOULIN Etienne
Supervisor:
SALMAN Khalik ( PhD) ; Associate professor

2
Abstract
In this paper, we will be interested by the current financial crisis and how it did affect
on the French economy. After setting the global French point of view and an overview of
other crises, the discussion will be focused on the subprime crisis and how it turned into a
worldwide financial crisis to reach the state of France. The data of the French statistic institute
(INSEE) will be used as an analytic tool to show how France has been hit.
To discuss this topic, we start from a chronology of the last crises to an overview of
the French point of view in economy to correlate the current financial crisis to the French
economy shrink. To set the subprime principles permit to explain the spread of the toxic
mortgages in the worldwide finance and the collapse of economies. In more details, that
explains the French economy collapse. The shrinking French economy started with the GDP
and as a snowball effect, foreign trade, and companies followed. In the same time, the rise of
unemployment and the change of the consumer behaviour can be notice. All of those are
correlated with the current financial crisis.
Going through this paper, we learnt that the subprime crisis is the cause of the
current financial crisis. Indeed, the spread of the toxic loan into the whole financial market
provided its collapse and finally reached to a fall of the world wide economy. In this study,
we were focused on the effects of the current financial crisis on the French economy. This
paper showed in the conclusion that the economy are recovering after a period of depression.

3
Table of Contents
Purpose of study 6
INTRODUCTION 7
1 Chronology of the world crises 7
2 Background of the French point of view of economy 8
PART I: The subprime crisis
CHAPTER 1: The subprime concept 10
2.1 The principle of the subprime loans 10
2.2 Housing price bubble forms and its burst 11
CHAPTER 2: The spread of the subprime collapse 13
2.1 The spread of the crisis by the securitization and the investment fund 13
2.2 The engagement of the banks 14
CHAPTER 3: The effect of the subprime on the banks 15
3.1 The banks difficulties and the States intervention 15
3.2 Example of banks failure: Northern Rock 16
PART II: Consequences of the current financial crisis on the French economy
CHAPTER 4: The French economy before the current financial crisis 17
4.1 The historical French economic crises 17
4.2 The current financial crisis and the French economy 20
4
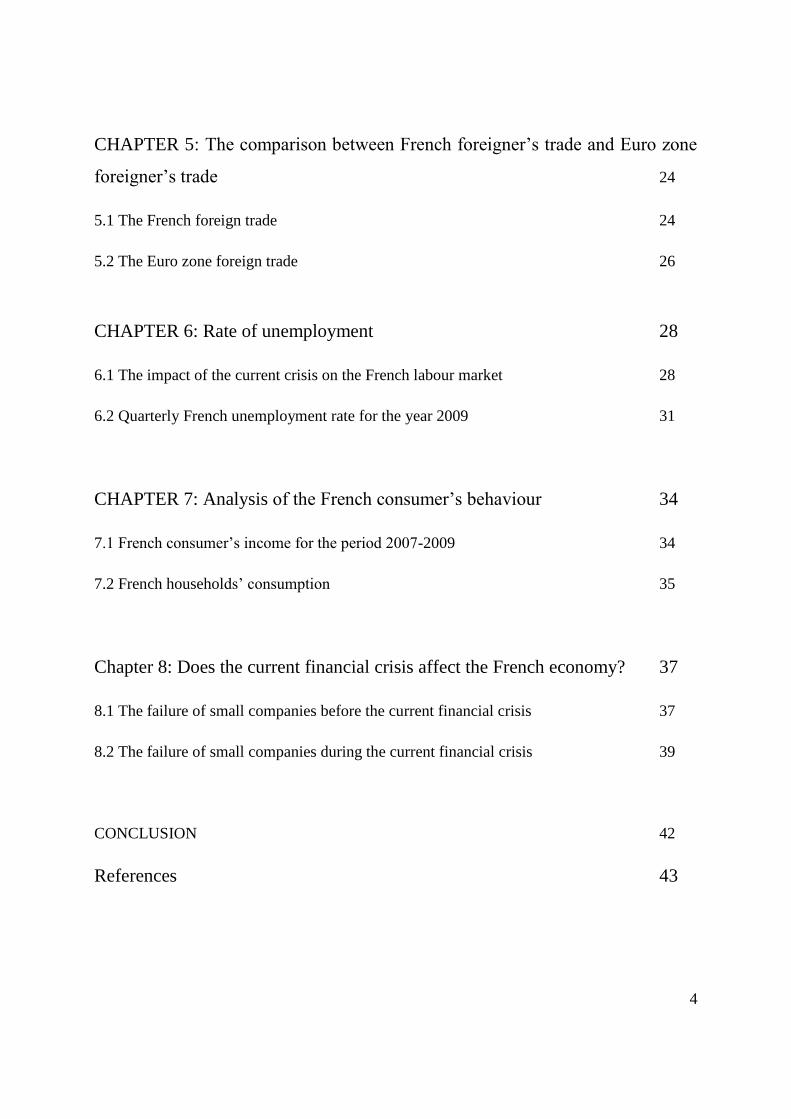
CHAPTER 5: The comparison between French foreigner’s trade and Euro zone
foreigner’s trade 24
5.1 The French foreign trade 24
5.2 The Euro zone foreign trade 26
CHAPTER 6: Rate of unemployment 28
6.1 The impact of the current crisis on the French labour market 28
6.2 Quarterly French unemployment rate for the year 2009 31
CHAPTER 7: Analysis of the French consumer’s behaviour 34
7.1 French consumer’s income for the period 2007-2009 34
7.2 French households’ consumption 35
Chapter 8: Does the current financial crisis affect the French economy? 37
8.1 The failure of small companies before the current financial crisis 37
8.2 The failure of small companies during the current financial crisis 39
CONCLUSION 42
References 43
5
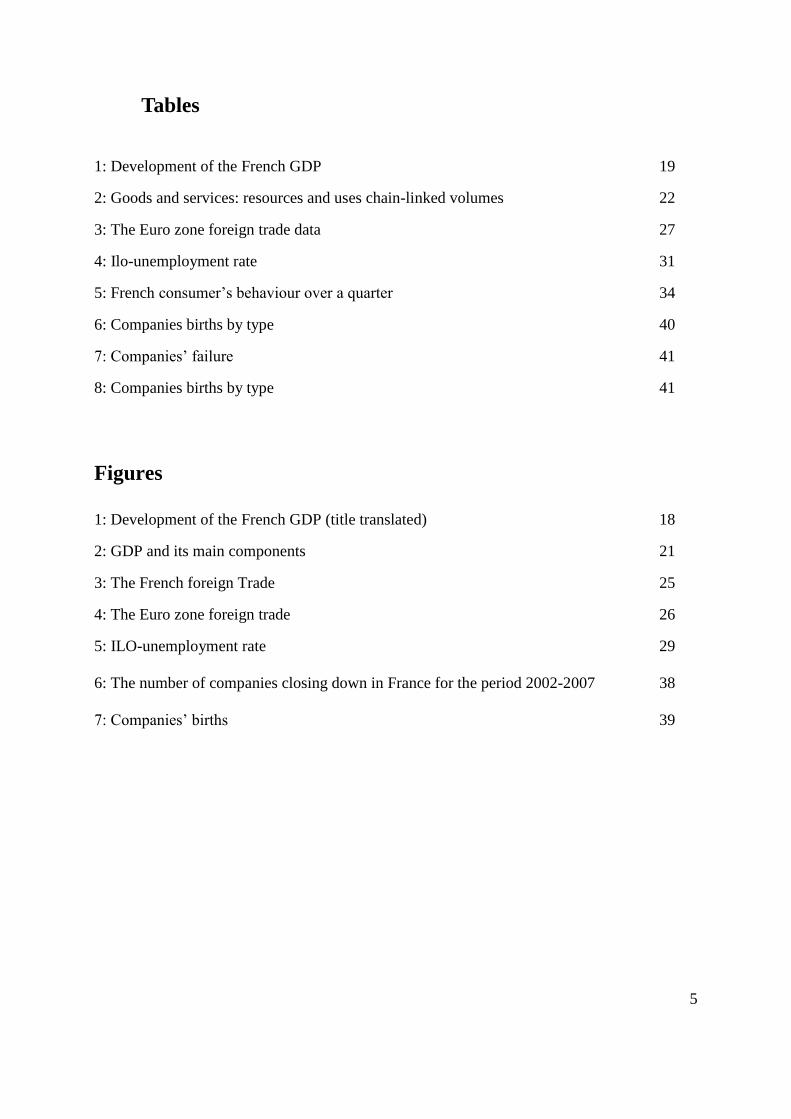
Tables
1: Development of the French GDP 19
2: Goods and services: resources and uses chain-linked volumes 22
3: The Euro zone foreign trade data 27
4: Ilo-unemployment rate 31
5: French consumer’s behaviour over a quarter 34
6: Companies births by type 40
7: Companies’ failure 41
8: Companies births by type 41
Figures
1: Development of the French GDP (title translated) 18
2: GDP and its main components 21
3: The French foreign Trade 25
4: The Euro zone foreign trade 26
5: ILO-unemployment rate 29
6: The number of companies closing down in France for the period 2002-2007 38
7: Companies’ births 39

6
Purpose of study
The aim of this work is to try to show and to explain how the current financial crisis happened
and spread all over the world and finished to hit France. Thus, we will use economic tools to
analyze all the data, for example, the rate of change or some index. This paper will use
qualitative method approach and empiric database in the second part with the help of the
INSEE and the French customs. The theoretical theory will be used to set up the French
thought in economy, and to understand the principle of the subprime crisis.

7
INTRODUCTION
In August 2007, the bubble crash of the housing market, also known as the subprime
crisis, turned the USA into the deepest crisis since the great depression of 1930. Since two
years now, we are victims of this crisis because of its spread all over the world.
Three main questions can be asked. Why did it happen? How? And what are the effects on the
French economy?
First of all, to understand why it happened, a chronology of the most important previous crises
in the capitalism history is necessary.
1 Chronology of the world crises
The first crisis in the history was in 16371 with the tulip mania. This period considered
the tulip market is considering as the first example of a financial speculative bubble in
economy in the history. Nevertheless, go back in time so far is not useful. The capitalism was
born in the 19th
century. During this century, there was a crisis about every twenty years.
Thus, it can be interesting to start a little chronology of the most important crises in the world
during the 20th
century.
The first, which can be quoted, is the hyperinflation in Germany happened in 1923. Indeed,
after the First World War, Germany was forced to pay all the costs of the war, which evolved
in a gigantic monetary crisis.
The next one happened in 1929 and this crisis is known as the mother of all financial crises:
The great depression. In fact, in 1928 and 1929, the prices of the stock market in the USA
doubled because of a high speculation. In October 1929, the market crashed and the prices fell
by 20%. The effect of this financial crisis on the economy was a rise of unemployment up to
30% and a fall of the industrial activities.
After 30 years of economic growth, the world was hit by another crisis in 1973. This crisis is
known as the first oil crisis of the century. The OPEC multiplied the oil barrel price by 4,
which stopped the economic growth of the western countries. In 1978, the second rise of the
1 Claude Mauriange 19 février 2009. All the dates come from this author.

8
barrel oil price caused another break in the growth of the industrial countries. This was the
second oil crisis.
After that, in the years of 1990-2000, successively, countries started to suffer from bank crisis
due to a rate of exchange crisis. The first to be hit were the Asian countries lead by Japan
followed by the Latin South American Countries Mexico and Argentina in 1994 and 2001.
To sum it up, even if we do not mention all the crises of the 20th
century, many crises hit the
world during this time and all had negative effects on the economy, oil crises as well as
financial crises. All caused a rise of unemployment and a fall of the economic activities and
all this crises happened in capitalist countries. Furthermore, the more the time past, and the
more the crises are global, they hit more than one country. In fact, the latest crisis in date is
the subprime crisis, which affected all the economies in the world. This was possible because
all the capitalist countries are link with the same financial system and the subprime crisis is a
financial crisis.
2 Background of the French point of view of economy
On the other hand, to understand why the French economy plunged, it should be
understand how France managed its economy. Since the capitalism is born, France is a
capitalist country. As a capitalist country, there are two way of thinking the capitalism. The
first one is more social and the second one is more liberal.
Most of the time, France has been liberal with a heavy background of socialism in the
government policy applied to the economy. That means that they prefer to not regulate the
financial market, the bank or in fact all the financial institutes. Moreover, they prefer more to
encourage the financial innovations than to regulate them. For instance, the following French
presidents were issued from right parties, which implicate them in the leading of a liberal
policy with their government: Georges Pompidou (1969-1974), Valéry Giscard d’Estaing
(1974-1981), Jacques Chirac (1995-2007) and Nicolas Sarkozy (since 2007) 2
Even if France is a liberal country, it is only since the 1980’s that the deregulation of the
financial system had started. In fact, it was not a real deregulation. The government did not
repress the financial innovation and even encourage the innovations. Furthermore, even if the
2 La documentation Française 2009

9
government want to regulate more and more the financial system, the financial innovations
always appear before that the government can regulate it.
Thus, the banks can evade the regulation and make profit even if it includes that they take too
much risk.
In the following part, the concentration will be put on the subprime crisis and why this crisis
is called the current financial crisis. The link with the financial crisis will be approached in the
part 2 and it will be discussed about the affect of the subprime crisis on the French economy.
Methodology
In this work, the topic of the current financial crisis will be developed through the subprime
crisis and how it affects on the French economy. To measure the affect on the French
economy of the recent financial crisis, we will use quantitative and qualitative method to
analyze and to discuss about the French data.
10
PART I: The subprime crisis
CHAPTER 1: The subprime concept
As a result of the financial innovations and the banks’ wills to make profits, new financial
products emerge in the mortgage markets.
1.1 The principle of the subprime loans
Banks as firms want to make profit. To make profits, banks use credits and other
financial products. In the last decade, the part of the subprime mortgages has risen up to
permit banks to earn more profits. Subprime mortgages are mortgages with the worst quality
of borrower. It allows people without much income and assets to have access to property.
Giving the opportunity to new consumers to have access to property, banks rose up the
subprime mortgages from 12% in 2006 to 21% in 20073 of the new mortgages loans. On the
other hand, the prime (best quality) fell down from 67% to 50%. The advantages of this type
of mortgages were the stability of the interest rate (average of 6%) during two or three years
(after that, the interest rate will fluctuate with the economy) and the credits were tax free.
Moreover, if a borrower cannot pay his loan anymore, the value of the house allows the bank
to not lose money.
Furthermore, subprime mortgages loans became indivisible with the securitization process.
Indeed, banks always need liquidities and by principle, a loan is illiquid. However, since
subprime loans are standardized products, they thought to make more profit when taking it off
their balance sheet by securitizing the mortgages and sell them on the financial market.
With the securitization’s process of the subprime mortgages, the bank do not support any risk
and by the game of intermediates in the financial market, anyone has to support the
aggregates’ risks. As risks were spread, many financial institutions as hedge funds or pension
funds specialized their investments on the subprime mortgages for their liquidities.
3 Bertrand Jacquilat- Vivien Levy-Garboua : Les 100 mots de la crise financière september 2
nd 2008. All the data
from this part come from the same authors

11
The process is based on the speculation of the housing price. With a loan at an average of
12%, if the housing price value, even if the household cannot pay the mortgage loan, the price
of the house will compensate for the loss of the bank’s credit. Nevertheless, the process work
only if there is a high speculation, which leads to the rise of the house price value.
1.2 Housing price bubble forms and its burst
In fact, the subprime loans are not a financial innovation from 2007. As it was
discussed in the part 1.1, the part of the subprime took another expansion on the financial
market. In the USA, the rise of the housing price between 1997 and 2006 was by 85%4 in
actual terms (inflation was erased). The households and the financial market expected a rise of
the housing prices by the only fact that the prices will rise by themselves. For example,
because everyone expected housing prices would value, everybody invested in the real
estate’s market.
Moreover, with a time line with low interest rate, borrow a part or the totality of the
property’s value is profitable because the equity of the good can only increase.
In this case, the buyer grows rich and the banker is trustful due to the rise of the property’s
value.
2006-2007 were the growth phases of the housing price bubble. In 2006, an amount of 3 000
billions of dollars was yielded by the new mortgage loans and as it was said, 21% of it were
subprime loans. Because of the creation of a huge amount of profit, many financial
institutions decided to specialise their activities in the subprime mortgage loans.
The housing price bubble, in her rising phase, has some criteria.
An increase of the price without correlation with the inflation those everyone think the
process is normal. In fact, the households believe that the situation of the bubble will be
different. Moreover, properties’ yields go down but nobody takes care of it because only an
increase in value is linked to the yield. Leverage increases due to borrowers want borrow and
the lenders want to lend even more. The contracts covenants become lax, the loan to value
4 Bertrand Jacquilat- Vivien Levy-Garboua : Les 100 mots de la crise financière september 2
nd 2008. All the data
from this part come from the same authors
12
rise up, clauses targeting to limit the risks for the borrowers become more relaxed and
protections are reduced.
Finally, the only way to get out of the system is to sell the good but households will
not sell it because to pay the loan, they just have to borrow another credit to refinance the first
one.
The type of financing is called “Ponzi financing” and the first economist to talk about this was
Minsky Hyman.
Nevertheless, the reverse of the medal appear in 2007. Before 2007, the bankers’ postulates
were that 12 percent of the subprime mortgages loans could not be payed off and the selling
of the house, in the worst case, will cover at least 70% of the loan. Thus, a mark-up of 6%
will cover bank charges and risks.
In 2007, bankers’ postulates were that 20% of the borrowers could not pay off their loans and
the loss during the sale could be 40% of the loan. In fact, it represents a charge for the bank of
8%.5
Due to this estimation, the subprime mortgages loans suddenly shrunk to cause the burst of
the housing price bubble.
5 Bertrand Jacquilat- Vivien Levy-Garboua : Les 100 mots de la crise financière september 2
nd 2008
13
CHAPTER 2: The spread of the subprime collapse
In august 2007, with the burst of the housing price bubble and the stop of the securitization
process, USA banks and financial market started to plunge.
2.1 The spread of the crisis by the securitization and the investment fund
First of all, the securitization process, as it was evocated in chapter 1, is a tool for
banks to transform debts in securitizes and to sell them on the financial market. This process
is possible thanks to the companies ad hoc that transform the debts for the banks to sell it to
specialised societies. These societies just have to buy debts that allow banks to be refinanced.
In the other hand, the companies ad hoc borrow money to transform the debts and refinance
themselves in issuing securities. The aim of the process is to transform illiquid assets into
marketable securities. The ABS (Assets Back Securities) are the securitized assets from the
MBS (Mortgage Backed Securities), CMBS (Commercial Mortgage Backed Securities) and
RMBS (Residential Mortgage Backed Securities).6
The subprime market used many of these securitized assets to develop itself. At least, with
this process, banks could lend 40 times their own capital because the Cook’s ratio was
evaded.7
Moreover, selling in shares’ portfolio to investor via the financial market, the demand
for these assets by the investors was increased due to a high yield of the subprime market
justified by a high interest rate of the loan. In fact, the investment funds were doped with
these high yield securities.
Nevertheless, in 2007, the investors started to consider the securities not as “junk
securities” but as “toxic securities”. The consequences on the market were a fall of the ABS
and CDO and the investment fund started to feel some difficulties. The first investment fund
to collapse was Bear Steams on July 17th
2007. From this time, all the investments funds were
6 Bertrand Jacquilat- Vivien Levy-Garboua : Les 100 mots de la crise financière september 2
nd 2008
7 Marchés financiers : le G7 réclame plus de transparence [archive], Challenges, 9 octobre 2007

14
suspected to own “toxics securities”. As a problem never come alone, the investment funds
are managed by banks.8
8 Interview au Financial Times, 8 octobre 2007

15
2.2 The engagement of the banks
Indeed, even if the investment funds are not owned by banks, they can be financed by
them. For example, hedge funds are financed by leverage (few capital for many borrows).
Thus, banks have to assume, via their investment funds, the risks that they evade to the
financial market9. In fact, around end of July 2007, the whole banking system had to bear the
risks of the credits and not only in their investment fund capital but also in their own capital.
Thus, the securitized debts with a high yield, “therefore with high risks” according to the
capital asset pricing model, were even inside some “SICAV monétaire” (société
d’investissement à capital variable) consider as secure investment. The closest English name
for SICAV is ICVC (Investment Company with Variable Capital).
On August 9th
2007, the first French bank, BNP Paribas, announced the freeze of its three
active investment funds’ assets for a total amount of 1.6 billion euro10
. The bank was unable
to put on figure on the assets of these funds since the negotiation with the mortgage securities
were stopped. On August 29th
, BNP Paribas announced the end of the freeze. The funds
reopen during September with a below per rating of maximum 1.21%11
Furthermore, a problem of liquidity started to be felt by all the banks. The liquidity
crisis is the result of the mistrust of the banks among each other. Not knowing how all the
banks were affected by the crisis, they stopped to lend money to each other. Banks who had a
surplus (minority) invested it in Treasury bonds, and the majority who needed liquidity, did
not find it on the financial market and had to borrow from the central banks. This process was
intensified as one gone along that the interbank loans fell due and they were not renewed. In
this case, banks have only three options: sell assets, stop to re-establish credits or make
purchase, which need liquidity or be refinanced by central banks. In fact, in 2008, banks chose
massively the third proposition.12
9 Source : Sylvain de Boissieu, Les banques dans la tempête, in Investir number 1753, 11/08/2007
10 Source : Les Échos, 19/07/2007
11« Subprime » : le dernier fonds gelé par BNP Paribas rouvre sur une baisse de 1,21 % [archive], Les Échos, 3
septembre 2007
12 Source : Bertrand Jacquilat- Vivien Levy-Garboua : Les 100 mots de la crise financière september 2
nd 2008

16
CHAPTER 3: The effect of the subprime on the banks
3.1 The banks difficulties and the States intervention
The first step of the banks’ bankruptcy was the need of liquidity. As it was discussed
in the previous section, banks, to make front to their own funds difficulties, asked to the
central bank liquidities. In 2007-2008, the massive lend of liquidities from the central bank to
banks make “rebirth” to the liquidity trap13
problem. At the level of the interbank relationship:
banks preferred to keep and to save the money rather than invest into the economy or the
accord credit to other banks. To stop the liquidity trap process, governments forced banks to
invest the loans in the economy.
However, the reinvest of the loans were into the interbank market. For households and
companies, the credits rationing was started to be established by the banks. The process is
known as the credit crunch. Insofar as credits that do not appear in the banks’ balance sheet
are “repatriated”, their need in capital increases when their results fall, when the regulation
institutions put more pressure on the capital ratio of the banks and in the same time, when the
bail out by their own start to be a problem. The only solution for banks is to reduce to accord
credit to people. That includes good borrowers as well as bad borrowers. That is what is
called the Credit crunch. During the last financial crisis, this process appeared in the middle of
2008 when banks could not bail out themselves. Paulson 2 plan and Brown plan had reached
to cut down the Credit crunch process in bailing out massively the banks14
.
3.2 Example of banks failure: Northern Rock
Before all interventions of the different States, banks started to go bankrupt due to a paucity
of capital. The best example of a bank failure is from the Northern Rock. Founded in 1965 in
Newcastle and quoted on stock exchange in 1997. This bank was a model of success until
13
John Maynard Keynes : The General Theory of Employment, Interest and Money 1936
14 Bertrand Jacquilat- Vivien Levy-Garboua : Les 100 mots de la crise financière september 2
nd 2008

17
2007 when their consumers started to panic and run to the bank. This phenomenon is called
bank run.
The bank run process started to appear for the Northern Rock because of its need of liquidity.
Before the subprime crisis, the bank lent at a long run and borrowed at short run. With the
securitization, the bank could have some liquidity and made profit with the leverage. The
leverage was not at an extreme yield but the return on equity was upper than 20%.
Nevertheless, the Northern Rock, as the other banks, could have a problem of illiquidity due
to its only 30% of deposits. The rest was only refinancing. With the difficulties of payment
from the households and the stop of the securitization process, more credits appeared in the
bank balance sheet. Furthermore, it could find anymore to borrow money. Therefore,
depositors started to be anxious and withdrew their deposit. Thinking the first to be arrived
will be the first to be served, the bank run process appeared and the bank went to bankruptcy.
To stop the bank run, the economy minister insures all the deposit in the totality. The flight of
deposit was stopped and the Bank of England gave a credit of 28 billion of pounds but that
was not enough to avoid Northern Rock failure. On February 18th
2008, the government
decided to nationalise the bank.15
To sum up this part, the subprime crisis affects all the capitalism countries due to the
developed links that they have among each other. In fact, the link between all the countries is
the finance. As the subprime mortgages loans spread in all the finance (banks and financial
market), went the housing price burst, the collapse reaches all the finance all over the world.
Moreover, the financial crisis shows that not only the financial system was hit, but the real
economy too. Indeed, the effect of the financial crisis will be discussed in the next part of the
paper.
15
Bertrand Jacquilat- Vivien Levy-Garboua : Les 100 mots de la crise financière september 2nd
2008

18
PART II: CONSEQUENCES OF THE CURRENT
FINANCIAL CRISIS ON THE FRENCH ECONOMY
In this part, we will focus on the effect of the financial crisis on the French economy.
Journalists spread the word that the French economy was weak, the French GDP going down
and its exports plunged; the rate of unemployment going up, households cutting their
spending and companies are closing down. Everyone agrees that the French economy has
collapsed.
Nevertheless, French economists expected the end of the recession at the end of 2009 and the
economy will recover.
CHAPTER 4: The French economy before the current financial
crisis
4.1 The historical French economic crises
Since the end of the Second World War, the French economy has grown. During more than
30 years, the country’s wealth grew as never before. Economists estimate the rise of the
French wealth between four and eight percent per year. Nevertheless, the first crisis since the
1970’s crash happened and the French economy was going down. This crisis was due to the
rise of the petrol’s barrel caused by the cartel of oil producer countries known as OPEC
(organization of the petroleum exporting countries). The consequences for the economy was a
reduction of the GDP
The GDP is the abbreviation for Gross Domestic Product which means that “the total market
value of all final goods and services produced in a country in a given year, equal to total
consumer, investment and government spending, plus the value of exports, minus the value of
imports.” 16
16
Parkin Powell Matthews, Seventh edition Economics 2007

19
After a few years, the economy recovered and the production activities were reflated.
As the history shows, an economy works well before a crisis and a nation produces wealth,
which means the GDP rises. However, when an external shock like a crisis, hits an economy,
everything collapses and the growth of the GDP decreases. Figure1 shows the development.
Figure 1: Development of the French GDP (title translated)
Source: INSEE national accounts-base 2000, France 2009
Indeed, every fall of the curves corresponds to an external shock. For instance, the fall of
1973 is due to the first oil crisis, the second, between 1978 and 1980, is due to the second oil
20
crisis. Nevertheless, the sink of 2001 was caused by another shock than a crisis: it was the
new currency adopted by France. In fact, the euro’s settle in the French economy created
inflation and consumers thought they will lose money. As a result, they changed their
consumption behaviour, cut their spending, and created less demand in the country. Thus, the
French GDP growth decreased from 3.9 percent in 2000 to 1.1 percent in 2003. The
economists proved that the inflation was low and the prices stabilized. Thus, people changed
their mind about the Euro. The GDP started to increase in 2004, and even though it decreased
in 2005, the next year was recorded a better GDP’s growth. In addition, foreign investments
can be mentioned as a source of the GDP’s rise. The Euro has been a strong currency, which
can scare the foreign investors. In fact, France attracts investors because the currency and the
policy are stable. Moreover, the French government subsidizes foreign investors to redevelop
the economic activities of the French redevelopment regions. An example is, the French aid
grant given to Toyota to set up factory in North of France17
. Thus, investors created more
activities and contributed to the rise of the French GDP.
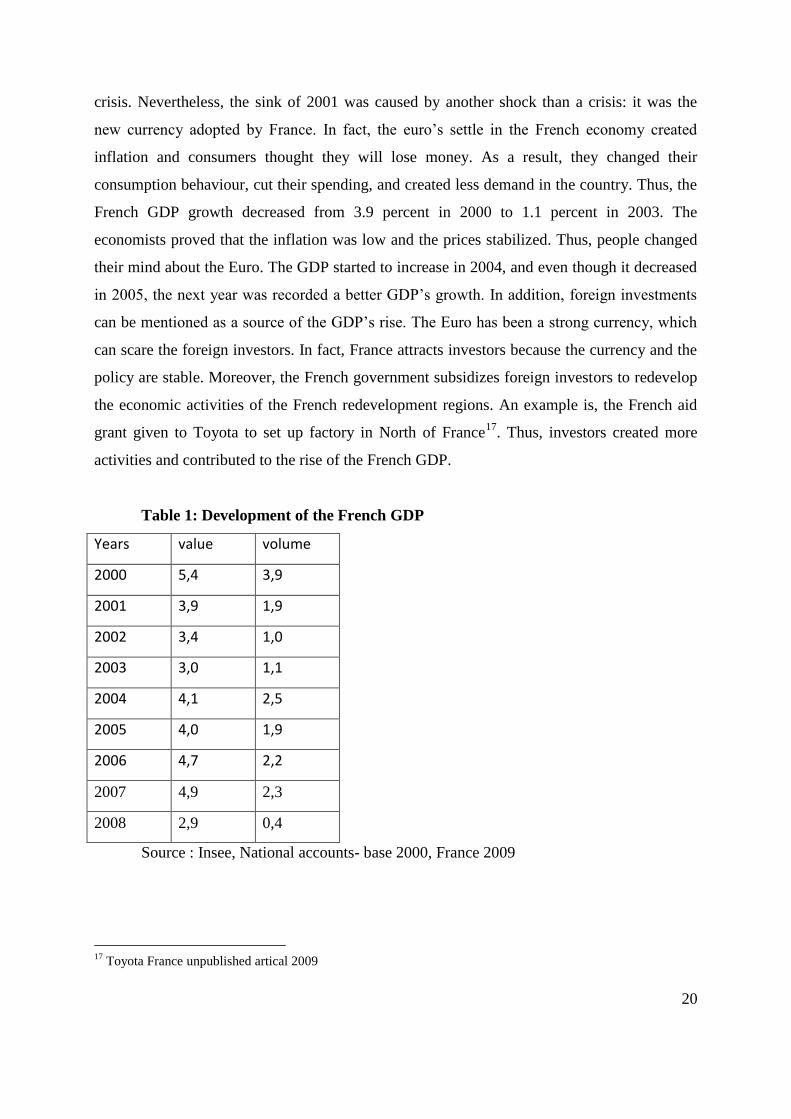
Table 1: Development of the French GDP
Years value volume
2000 5,4 3,9
2001 3,9 1,9
2002 3,4 1,0
2003 3,0 1,1
2004 4,1 2,5
2005 4,0 1,9
2006 4,7 2,2
2007 4,9 2,3
2008 2,9 0,4
Source : Insee, National accounts- base 2000, France 2009
17
Toyota France unpublished artical 2009

21
Table 1 shows that, the French GDP was recovering from the external shock of 2001
with the GDP’s rise of 2006-2007. After that, the GDP started to decrease from 2.3% to 0.4%
in 2008. The reason is known as another external shock, not the currency’s change, but the
impact of a crisis. Indeed, a new financial crisis hit the French economy known as the result
of the subprime crisis.
4.2 The current financial crisis and the French economy
As was mentioned in the previous parts, the results of the subprime crisis are failures
of several banks, financial market collapse, household consumption changes and spread of the
panic in the industry. This crisis turned into a financial crisis for France causing the wealth of
the State going down by a sink of the stock exchange, which means less way for firms to
invest. Banks went bankrupt which means no more credits to finance companies and they
have to be bail out by the state. Thus, the government has to cut its investments to save the
French banks.
In fact, the impact of the current financial crisis affects the GDP and its components.
First of all, the households have to change their consumption because house prices fluctuated.
Moreover, the collapses of companies cause higher unemployment and people earn less
money, therefore, they have to change their spending.
Next, the investment measure by the Gross fixed capital formation has fluctuated. Gross fixed
capital formation (GFCF) is a macroeconomic concept used in official national accounts such
as the NIPAs and UNSNA since the 1930s. Statistically it measures the value of additions to
fixed assets purchased by business, government and households less disposals of fixed assets
sold off or scrapped18
.
The last component is the balance trade. As a snowball effect, the exports and the inventory
changes have shrunk because a plunge of the companies’ activities.
18
Wikipedia 2009
22
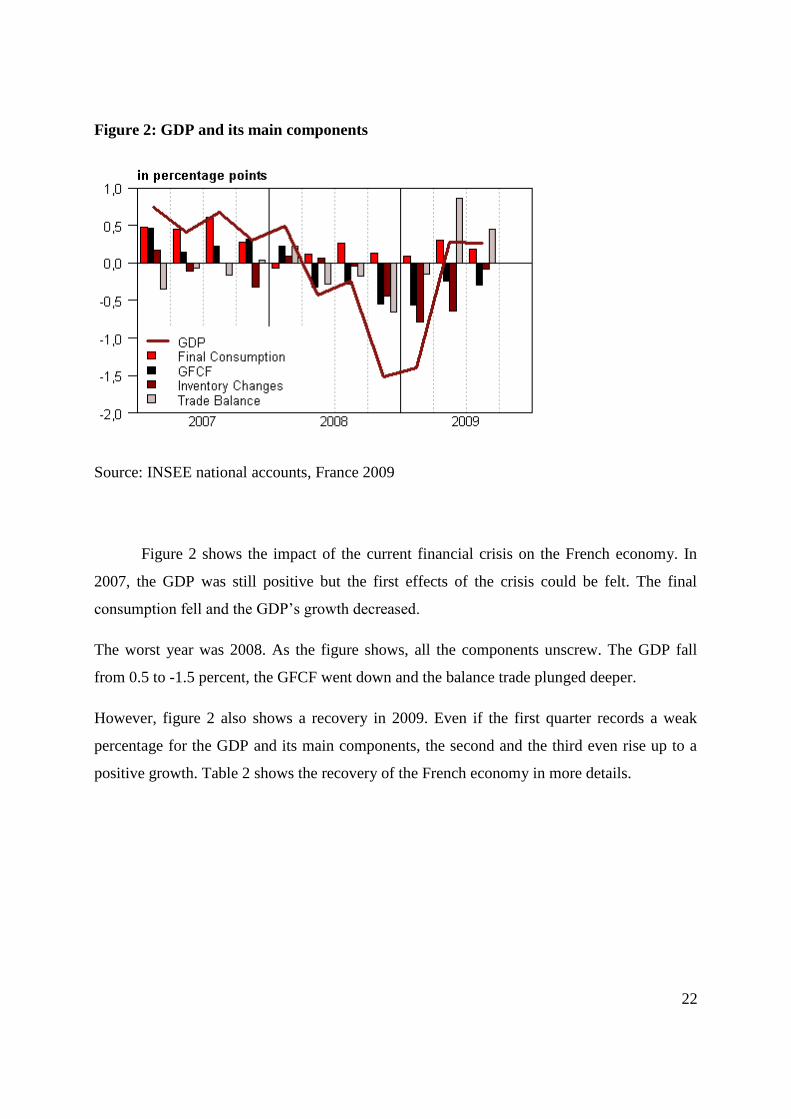
Figure 2: GDP and its main components
Source: INSEE national accounts, France 2009
Figure 2 shows the impact of the current financial crisis on the French economy. In
2007, the GDP was still positive but the first effects of the crisis could be felt. The final
consumption fell and the GDP’s growth decreased.
The worst year was 2008. As the figure shows, all the components unscrew. The GDP fall
from 0.5 to -1.5 percent, the GFCF went down and the balance trade plunged deeper.
However, figure 2 also shows a recovery in 2009. Even if the first quarter records a weak
percentage for the GDP and its main components, the second and the third even rise up to a
positive growth. Table 2 shows the recovery of the French economy in more details.
23
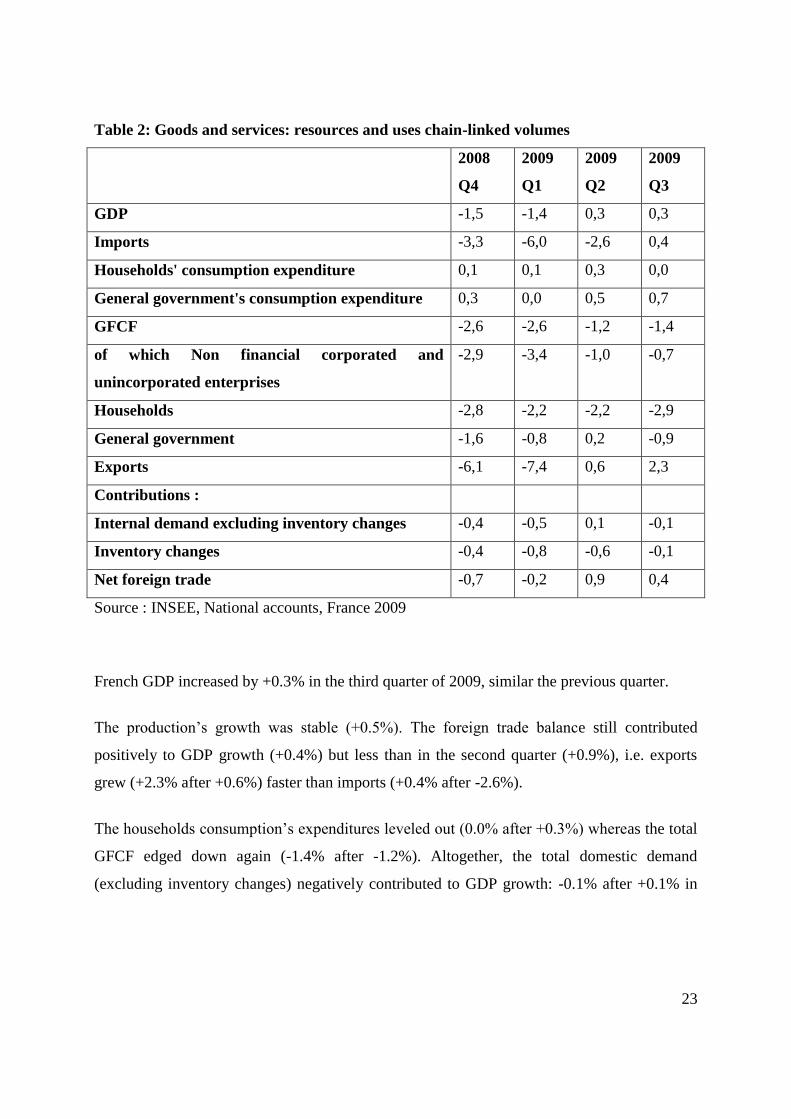
Table 2: Goods and services: resources and uses chain-linked volumes
2008
Q4
2009
Q1
2009
Q2
2009
Q3
GDP -1,5 -1,4 0,3 0,3
Imports -3,3 -6,0 -2,6 0,4
Households' consumption expenditure 0,1 0,1 0,3 0,0
General government's consumption expenditure 0,3 0,0 0,5 0,7
GFCF -2,6 -2,6 -1,2 -1,4
of which Non financial corporated and
unincorporated enterprises
-2,9 -3,4 -1,0 -0,7
Households -2,8 -2,2 -2,2 -2,9
General government -1,6 -0,8 0,2 -0,9
Exports -6,1 -7,4 0,6 2,3
Contributions :
Internal demand excluding inventory changes -0,4 -0,5 0,1 -0,1
Inventory changes -0,4 -0,8 -0,6 -0,1
Net foreign trade -0,7 -0,2 0,9 0,4
Source : INSEE, National accounts, France 2009
French GDP increased by +0.3% in the third quarter of 2009, similar the previous quarter.
The production’s growth was stable (+0.5%). The foreign trade balance still contributed
positively to GDP growth (+0.4%) but less than in the second quarter (+0.9%), i.e. exports
grew (+2.3% after +0.6%) faster than imports (+0.4% after -2.6%).
The households consumption’s expenditures leveled out (0.0% after +0.3%) whereas the total
GFCF edged down again (-1.4% after -1.2%). Altogether, the total domestic demand
(excluding inventory changes) negatively contributed to GDP growth: -0.1% after +0.1% in

24
the second quarter. The decrease of inventory changes was almost steady and contributed -
0.1% to the GDP growth, after -0.6%19
.
Even if the French economy was hurt badly, the last quarter of 2009 leads the way
from the recession to the recovery. Almost all components of the GDP stopped to fluctuate
negatively and the exports lead the GDP’s growth. Thus, the French economics’ activities
increase again.
19
INSEE, 2009
25
CHAPTER 5: The comparison between French foreigner’s trade
and Euro zone foreigner’s trade
Since the current financial crisis, the French economy has been turned into a recession
and the impact caused the French foreign trade to decrease.
Nevertheless, the French government anticipate the economy’s upturn for the end of 2009,
beginning of 2010 and figure 2 suggests an upturn lead by the foreign trade. In fact, the
French customs published in their last analysis of the French exports that the exportation of
transport’s equipments and intermediate’s goods renew with the GDP’s growth in September
2009. Nevertheless, the high technologies’ equipments do not show any signs of recovery20
.
Therefore, a contradiction appears in the French exports: some goods become export goods
and some others stagnate or even continue to decrease. Furthermore, we have to keep in mind
that the current financial crisis is global. Thus, it continues to affect not only France, but also
the Euro zone (as the rest of the world).
5.1 The French foreign trade
It can be interesting to compare the imports and the exports between France and the
Euro zone to see which of them are more affected.
Indeed, France has seen its foreign trade decrease because of the current financial crisis. In
fact, the decrease of the French activities and the American dollars deflation weight a lot on
the French exportations.
The decrease of the French activities has been explained previously. To sum it up again: less
productivity involves fewer goods to sell.
Next, the devaluation of the American dollar compared to the Euro makes American goods
less expensive than European goods. Even if the volume of international exchange falls, for a
substitutable product, it is better to buy an American product than a French product.
Thus, the French export falls (as well as the import).
20
French Customs 2009

26
Figure 3: The French foreign Trade
Source: French Customs published by the French government, 2009
*Translation: solde= balance
*Numbers are stated in million.
Figure 3 shows the French exports and imports fluctuated more in the period 2007 and
2009.
In 2007 and 2008, the French exports had a regular fluctuation. It was around 33 000 million
Euro per quarter. Nevertheless, at the beginning of 2009, the blue curve started to sink from
35 000 million Euro to 27 000 million Euro per quarter. In fact, the repercussions of the
current financial crisis took 2 years to influence the French foreign trade. Indeed, the imports
were rising from 2007 to 2008 whereas in 2009, the French imports started to decrease as well
as the exports. However, for the last quarter of 2009, the export started to rise, which affects
the balance positively. For instance, the balance’s gap at the beginning of 2009 was at -6 000
million euro and at the end of 2009, the gap is less than -2 000 thousand euro.
To conclude, the French foreign trade is starting to recover from the recession and as it was
mentioned previously, the rise of the exportations and the stabilisation of the importation
correspond to the end of the French recession.
27
5.2 The Euro zone foreign trade
At the same time, the current financial crisis affects the Euro zone foreign trade but
maybe not with the same strength as the French foreign trade. Even if the effects are similar,
the affect can be different. For example, the Euro zone can be hit deeper than France or vice-
versa.
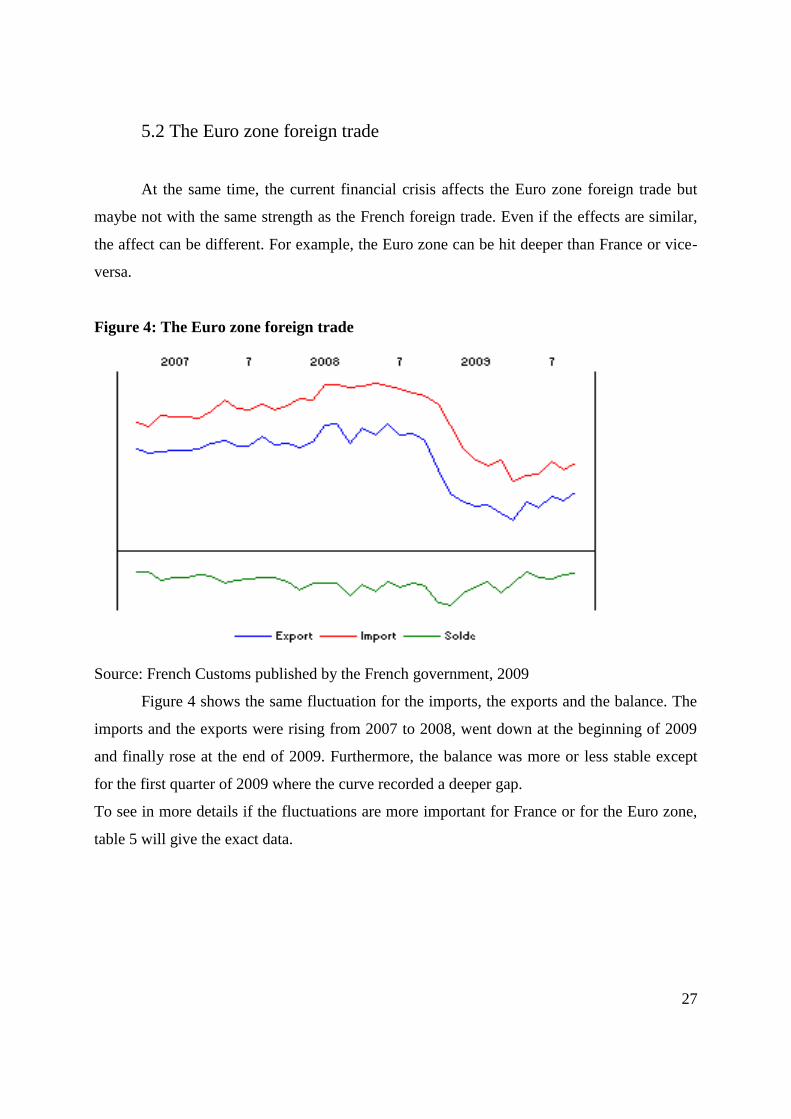
Figure 4: The Euro zone foreign trade
Source: French Customs published by the French government, 2009
Figure 4 shows the same fluctuation for the imports, the exports and the balance. The
imports and the exports were rising from 2007 to 2008, went down at the beginning of 2009
and finally rose at the end of 2009. Furthermore, the balance was more or less stable except
for the first quarter of 2009 where the curve recorded a deeper gap.
To see in more details if the fluctuations are more important for France or for the Euro zone,
table 5 will give the exact data.

28
Table 3: The Euro zone foreign trade data
Date Export Import Balance
3T2009 42 397 47 418 -5 021
2T2009 40 103 45 552 -5 449
1T2009 40 508 47 943 -7 435
4T2008 43 563 53 697 -10 134
3T2008 52 077 59 141 -7 064
2T2008 53 245 60 429 -7 184
1T2008 52 868 60 331 -7 463
4T2007 50 792 57 692 -6 900
3T2007 51 090 56 627 -5 537
2T2007 50 983 56 859 -5 876
1T2007 49 858 55 165 -5 307
Source: French Customs published by the French government, 2009
*Numbers are stated in million.
*T= trimester= quarter
Table 3 shows the Euro zone exports, imports and balance. In comparison with France,
the Euro zone exports and imports more. For instance, from 2007 to 2009, the euro zone
exported between 40 000 and 53 000 million (in a quarter) whereas France exported between
27 000 and 33 000 million. Considering the imports, the Euro zone imports also more than
France does. However, the Euro zone has a deeper negative balance than France and this can
be explained with the strength’s Euro. With a strong currency, the purchasing power is higher
compared to a weaker currency. Therefore, the Euro zone countries import more than they
export and the result is that they have a deeper deficit in their balance of trade.
To conclude, the Euro zone countries export and import more than France does but
France has a better balance than the Euro zone countries.
29
CHAPTER 6: Rate of unemployment
Since the beginning of the capitalism, crisis and unemployment are correlated. During
the 1930’s crisis, the rate of unemployment rose up more than 30 percent in the USA or in
Germany. In fact, every time a financial crisis disturbs an economy, a wave of unemployment
follows the financial panic. To stay with the example of the 1930’s crisis, to fight against the
unemployment, Roosevelt’s USA president built huge dam and others public building. In
Germany, preparing the state for the war gave people new employment.
Recently, a new financial crisis hits the earth and the French economy was not spared.
However, does the French government react as the other countries did during history?
6.1 The impact of the current crisis on the French labour market
In fact, the reaction is different because France would like to avoid the disaster of
1930’s recovery. Keeping the Market free to resolve all the problems by itself, shows that it is
leading only to a disaster. For this reason, the State made interventions as discussed in chapter
4. Indeed, financial crises spread insecurity and mistrust between banks and companies or
among companies themselves. Firms have to cut their investment spending and the bank stops
to grant credits to firms. The consequences are that small companies start to have more fund
difficulties and because they cannot pay off their debts, they have to close down.
Moreover, the financial crisis provides big losses for banks that are going in bankruptcy.
Because of their special links with companies, banks’ failure provides what is called the credit
crunch, which means companies are not allowed to have a credit according to the loss of the
banks. As we said, small companies are closing down and this creates unemployment.
However, this type of problem provides also a chance of restructuration for big firms, since it
involves a lot of dismissal.
A companies’ restructuration is viewed as a massive dismissal and, sometimes, delocalisation
occurs to cover their mark-up.
In fact, to sum it up, the current financial crisis causes a rise of the unemployment rate on the
French labour market.
Nevertheless, the fluctuation of the unemployment rate can be analyzed in different way
according to how the unemployment rate is defined.

30
Different types of unemployment exist; the frictional unemployment, the structural
unemployment, the natural unemployment and the cyclical unemployment.
When taking into consideration one type of unemployment rather than another, the
unemployment rate can fluctuate differently. To understand the numbers of unemployment in
the following part better, a definition is necessary.
For the ILO (International labour office) a person is unemployed when being in age to work
(15 years and older) and answering these three criteria:
-be without job, that means do not work even one hour during the referee week.
-be on hand to take a job in the next 15 days.
- To have looked for a job during the last month or to have found one which start in less than
3 months21
Figure 5: ILO-unemployment rate
*T= trimester= quarter
Source: INSEE, Labour Force Survey, France 2009
The figure 5 shows the unemployment rate between 2003 and 2009.
Before the current financial crisis from 2003 to 2006, the average unemployment rate was
around 9 percent. It started to decrease at the second quarter of 2006 from 9.3% to 7.5% at the
end of 2007.
21
INSEE 2009
31
Nevertheless, the effect of the crisis started to be felt by the French economy at the beginning
of 2008 and the unemployment rate rose up to settle at 9.5% in 2009. The last rise can be
explained as the cyclical unemployment. In fact, since the labour market is hit by the current
financial crisis the unemployment rate rises. Normally, when the recession is over, the
unemployment rate will decrease again.
32
6.2 Quarterly French unemployment rate for the year 2009
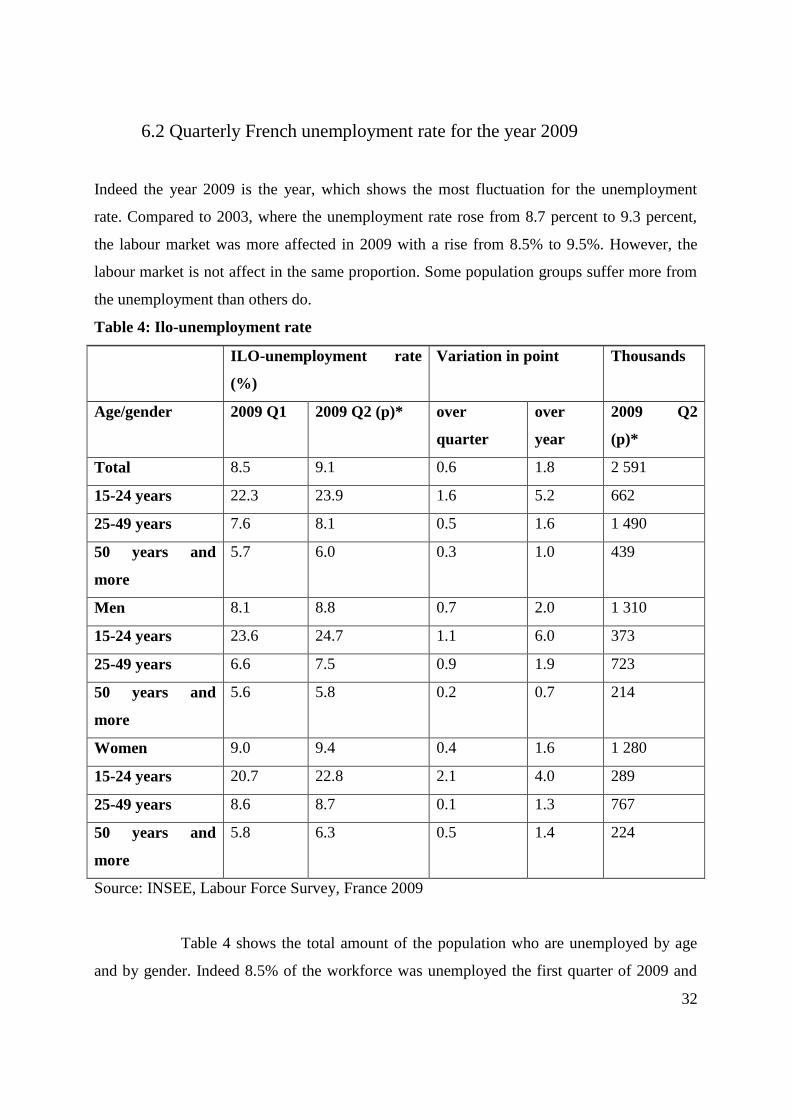
Indeed the year 2009 is the year, which shows the most fluctuation for the unemployment
rate. Compared to 2003, where the unemployment rate rose from 8.7 percent to 9.3 percent,
the labour market was more affected in 2009 with a rise from 8.5% to 9.5%. However, the
labour market is not affect in the same proportion. Some population groups suffer more from
the unemployment than others do.
Table 4: Ilo-unemployment rate
ILO-unemployment rate
(%)
Variation in point Thousands
Age/gender 2009 Q1 2009 Q2 (p)* over
quarter
over
year
2009 Q2
(p)*
Total 8.5 9.1 0.6 1.8 2 591
15-24 years 22.3 23.9 1.6 5.2 662
25-49 years 7.6 8.1 0.5 1.6 1 490
50 years and
more
5.7 6.0 0.3 1.0 439
Men 8.1 8.8 0.7 2.0 1 310
15-24 years 23.6 24.7 1.1 6.0 373
25-49 years 6.6 7.5 0.9 1.9 723
50 years and
more
5.6 5.8 0.2 0.7 214
Women 9.0 9.4 0.4 1.6 1 280
15-24 years 20.7 22.8 2.1 4.0 289
25-49 years 8.6 8.7 0.1 1.3 767
50 years and
more
5.8 6.3 0.5 1.4 224
Source: INSEE, Labour Force Survey, France 2009
Table 4 shows the total amount of the population who are unemployed by age
and by gender. Indeed 8.5% of the workforce was unemployed the first quarter of 2009 and

33
9.1% of them for the second quarter. The variation is 0.6 (6%) on one quarter and 1.8 (18%)
meaning a total of 2 591 thousand unemployed people.
In the same time, the most affected by the unemployment are the category between 15-24
years old with 23.9% of unemployment for the 2nd
quarter and an evolution of 5.2 in a year. In
fact, the population group is the most affected by the current financial crisis. Among men
from 15 to 24 years old, the unemployment rate rose from 23.6% in the 1st quarter of 2009 to
24.7% in the 2nd
quarter with a variation of 1.1 (11%) for the 1st three months and 6.0 (60%)
for the whole year. For women of the same age category, the unemployment rate rose from
20.7% in the 1st quarter to 22.8% for the second quarter.
Nevertheless, the part that is most affected (in total numbers) are men with the highest
increase (2.0 points for the year) and 1310 thousand unemployed people. In contrast to that,
women, who have the highest percentage of unemployment with 9.4%, have a little less
variation than the men do. (1.6 point with 1 280 thousand unemployed)
Moreover, men have the highest unemployment rate for young people with 24.7% (373 000)
instead of 22.8% (289 000) for young women.
However, it is the exactly inverse for the next age category: 25-49. The unemployment rate
for men rose from 6.6% (Q1) to 7.5 % (Q2) with 723 000 unemployed, meaning an increase
of 0.9 over the quarter and 1.9 over the year. For women, it rose from 8.6% (Q1) to 8.7%
(Q2). That means an increase of only 0.1 over the quarter and 1.3 over the year with 767 000
unemployed.
Analyzing the last category shows that in the age group of 50 years and more the numbers are
approximately the same for both gender.
Table 4 shows that the current financial crisis affects in total more men than
women. However, we have to say that in France most of the employees are men. Therefore it
can be logical that the first people to lose their jobs are men.
Moreover, not thinking in terms like gender but instead age group the most unemployed are
young people. The young people have the highest unemployment rate with 23.9% of the total
and they have the most important variation (more unemployed) with an increase of 52% over
the year.
To sum up, the current financial crisis has for a big effect on the labour market with a
rise from 7.5% to 9.1% in the unemployment rate i.e., about 2.6 million of people. More
34
generally, in France, 3.3 million people out of 25 913 000 people (workforce) do not work but
would like to work22
.
22
INSEE 2009

35
CHAPTER 7: Analyze of the French consumer’s behaviour
In chapter 7, it could be seen that many workers were lent off, which leads in
consequences to a rise of the unemployment. In fact, people lost their jobs and therefore their
income, which affects their own consumption behaviour. Indeed, the current financial crisis
forces some consumers to change their consumption’s behaviour, to change their level of
saving or for some of them to change nothing.
7.1 French consumer’s income for the period 2007-2009
As it is known in economy, incomes are inflexible to decrease. Thus, even if a crisis
hit an economy, workers’ wages will not go down. However, the workforce in a company can
fall and even the number of companies themselves can decrease. In this way, even if wages
stay at the same level than before a crisis, less people earn an income than before. Therefore,
the global consumer’s behaviour should change in a country hit by a crisis.
Table 5: French consumer’s behaviour over a quarter
Source: National Accounts - Base 2000, Insee, France 2009
The first approach is to say that the GDI between Q3 of 2007 and the Q2 of 2009 has
risen at the same level. A more detailed look on the table 7 shows that the GDI has decreased
between the last quarter of 2007 and the first quarter of 2009.
Furthermore, in the first quarter of 2009, the GDI decreased by 0.1 (means negative rise by
0.1%). In fact, the consumers at the first quarter of 2009 lost some earnings compared to the
last quarter of 2008.
Heading Q3
2007
Q4
2007
Q1
2008
Q2
2008
Q3
2008
Q4
2008
Q1
2009
Q2
2009
Gross disposable
income (GDI)
1,2 1,3 0,8 0,5 0,4 0,5 -0,1 1,0
GDI per unit of
consumption (UC)
1,0 1,1 0,6 0,4 0,3 0,3 -0,2 0,9
saving rate (level) 15,4 15,3 15,5 15,1 15,0 15,8 15,9 16,6

36
Nevertheless, the second quarter of 2009 shows an upturn of the brut net earnings of 1%.
Thus, the French consumer see their incomes increase again.
Next, if we take as a referee the GDI per unit of consumption, it shows that the rise of the
GDI is less important than previously. In fact, all the percentages are levelled down by 0.2%
or 0.1%. Indeed, taking into account the consumption of the household makes a difference
with their brut net earnings because they use more income for consumption than before. This
is a result of the current financial crisis.
Finally, French households seem to save more money to cover their wages’ losses. The saving
rate (level) has risen from 15.4% to 16.6% between 2007 and 2009 with the variation rate; the
saving rate has risen by 7.79%.
In fact, this is a typical behaviour of a consumer. For instance, when an economy is in an
expansion period, workers’ wages increase and the unemployment rate fall. People spend
more money to consume and save only the rest of their income. In a recession time, people
anticipate a decrease of their income and decide to rise up their saving to prevent the near
wage decrease. They think if they save more, they will not have to shrink their consumption if
they become jobless. They can then rely on their savings.
7.2 French households’ consumption
Indeed, household consumption changes because of the current financial crisis. Their
purchasing power stagnates, their investment decreases. However, their consumption, after
two years of declining starts to increase again.
“Consumption should progress again moderately.
Purchasing power set to mark time
Purchasing power for households as a whole is expected to stand still in H2 2009. Earned
income should stagnate as job losses continue and the rise in unemployment weighs down on
wages. Also, purchasing power should be boosted less by the stimulus plan than in H1.
Finally, it is likely to be hit by the upturn in inflation. Over the year, however, it should grow
more in 2009 (+2.1%) than in 2008 (+0.6 %), essentially due to inflation falling back.
Consumption set to continue its moderate rise.
37
In line with the small gains in purchasing power in H2, household consumption is likely to
grow at a very moderate pace (+0.2% per quarter). All in all in 2009, the rise in
unemployment should incite households to be careful: their savings rate should increase to
16.5%, against 15.3 % in 2008.
Household investment still declining In the construction sector, the continued low levels of
the business tendency surveys suggest that a rapid upturn in this sector is unlikely. New
housing sales rose in Q2, driving stocks downwards, but due to construction lead times, these
sales should only generate activity in the sector gradually. Household investments in housing
are therefore likely to continue their decline in H2, but at an increasingly moderate pace.” 23
23
INSEE, 2009
38
Chapter 8: Does the current financial crisis affect the French
economy?
In the previous chapters, it has been discussed how the current financial crisis hit the
French economy. First it was analyzed, the GDP, then the export, next the unemployment rate
and then the consumer’s behaviour. However, there is another important point which has not
been dealt with: small companies’ failure. Indeed, this point is linked with the other entire
chapters as some authors have been mentioned.
In fact, businesses are the motor of the economy and as it is known, firms produce
goods and services. All of these are the wealth of a country and are measured by the GDP.
When a company closes down, it does not produce wealth for the State anymore and the GDP
goes down. Moreover, a failure of a company causes unemployment and that has also bad
results for an economy.
8.1 The failure of small companies before the current financial crisis
Nevertheless, companies’ failure is a part of economics life. Every day, new people go into
business and launch his/her own small company. Sometimes they succeed and sometimes,
they fail. Without external impact like a financial crisis, the average rate of a small company
(in every sector) which succeeds is one business out of two and most of the failures are due to
management mistakes.

39
Figure 6: The number of companies closing down in France for the period 2002-2007
Source: Insee, enquête Sine 2002, interrogations 2002, 2005 and 2007. France 2009
*Translation: Nombres d’entreprises= number of companies
Emploi total= total of jobs
Emploi non salarié= non-salaried employee
Emploi salarié= salaried employee
Au démarrage en 2002= at the beginning in 2002
Cinq ans après, en 2007= five years later, in 2007
As this figure 6 shows, the number of firms that close down is an average of 100 000
firms. More than 200 000 companies started in 2002. 5 years later, in 2007, a little more than
100 000 businesses are still active. In fact 50 percent of the companies closed down. The
number of employment shows the result of all these failure. In 2002, there were more than
416 000 workers in all the created firms. In 2007, there were more than 350 000 workers. In
fact, 50 000 persons more were unemployed in 2007. However, 87 percent of the
employments created by the start of the businesses are still active.
To sum up, there is one out two of companies that fail with 50 000 unemployed people during
a normal economic cycle between 2002 and 2007.
40
8.2 The failure of small companies during the current financial crisis
Nevertheless, an external shock like a financial crisis increases companies’ failure
because it becomes difficult for small firms to invest and therefore to make profit. As a
snowball effect, if the company cannot make enough profit, it cannot pay off its depts.
Therefore, it becomes illiquid and has to close down. In fact, this is caused because banks are
not allowed to grant credits to firms.
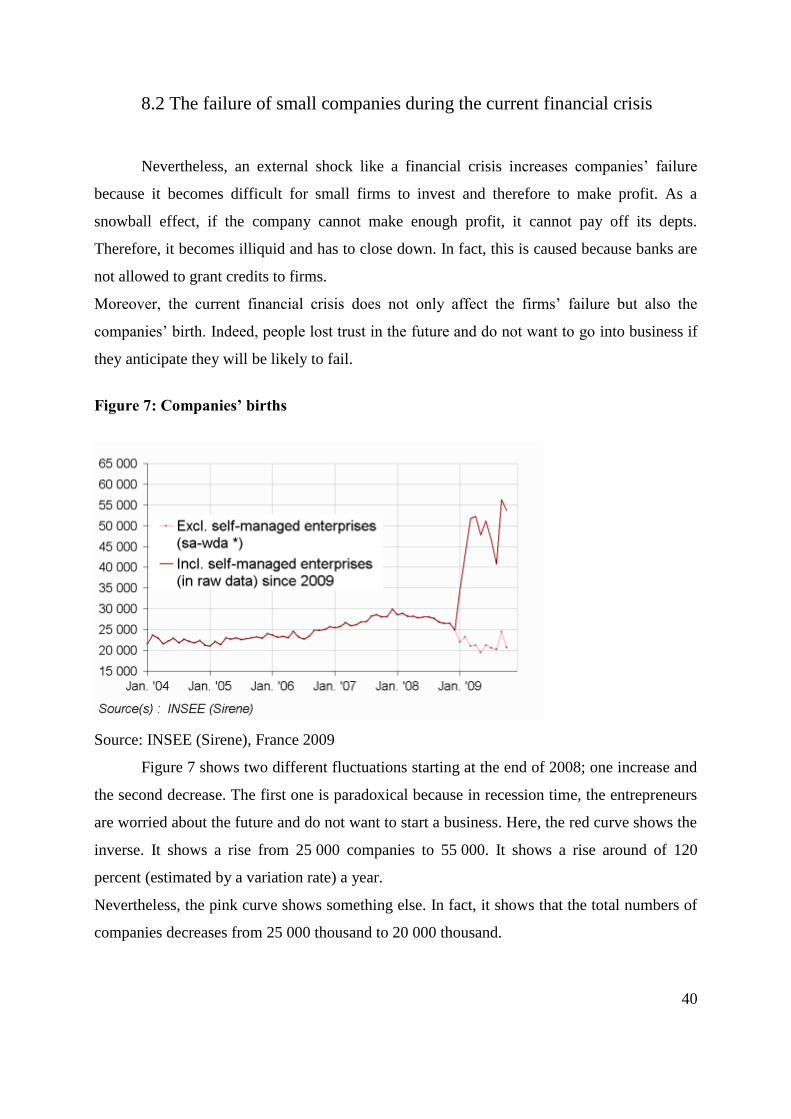
Moreover, the current financial crisis does not only affect the firms’ failure but also the
companies’ birth. Indeed, people lost trust in the future and do not want to go into business if
they anticipate they will be likely to fail.
Figure 7: Companies’ births
Source: INSEE (Sirene), France 2009
Figure 7 shows two different fluctuations starting at the end of 2008; one increase and
the second decrease. The first one is paradoxical because in recession time, the entrepreneurs
are worried about the future and do not want to start a business. Here, the red curve shows the
inverse. It shows a rise from 25 000 companies to 55 000. It shows a rise around of 120
percent (estimated by a variation rate) a year.
Nevertheless, the pink curve shows something else. In fact, it shows that the total numbers of
companies decreases from 25 000 thousand to 20 000 thousand.

41
In fact, this paradox can be explained by the political support that the state gives to the
new entrepreneurs. To avoid too much failure of little companies and to dope the economy;
the French government put up a new reform to launch a company. This new form of business
is known as self-managed enterprise which simplifies so much the right to start a venture in a
business.
For instance, an English teacher is a worker for the state. With the self-managed enterprise, he
is allowed to create a micro-business to give private courses to raise her income. Generally,
everybody can be a self-managed entrepreneur (students, workers, teachers etc.) but it is only
to complete your income and to live on your own with this type of business.
In fact, this new form of business is a micro-business. To be a self-managed enterprise does
not mean you own a restaurant or a small company in informatics or any kind of firm that
allows you only to complete your income.
Table 6: Companies births by type
Moving total % change* Moving total Moving total
on 3 months
( %)
on 12 months
( %)
January-October
2009
January-October
2008
Total 92,0 55,7 480 729 286 991
Companies -3,0 -10,4 124 543 138 898
Individual
enterprises
178,5 118,9 356 186 148 093
Of which self-
managed
// // 263 374 //
Source: INSEE (Sirene), France 2009
Table 6 has to be linked with figure 8 because it shows the increase of the individual
enterprises, which includes the self-managed enterprises and the decrease of the companies.
Indeed, the rise of the whole companies is estimated at 92.0 percent for 3 months and 55.7
percent for the years for a moving total in 2009 of 480 729 companies. The biggest part of this
rise is the increase of the numbers of the individual enterprise, which includes the new
popular business: self-managed enterprise.
However, companies suffer of a fall of -3 percent on three months and -10.4 percent on
twelve months.
42
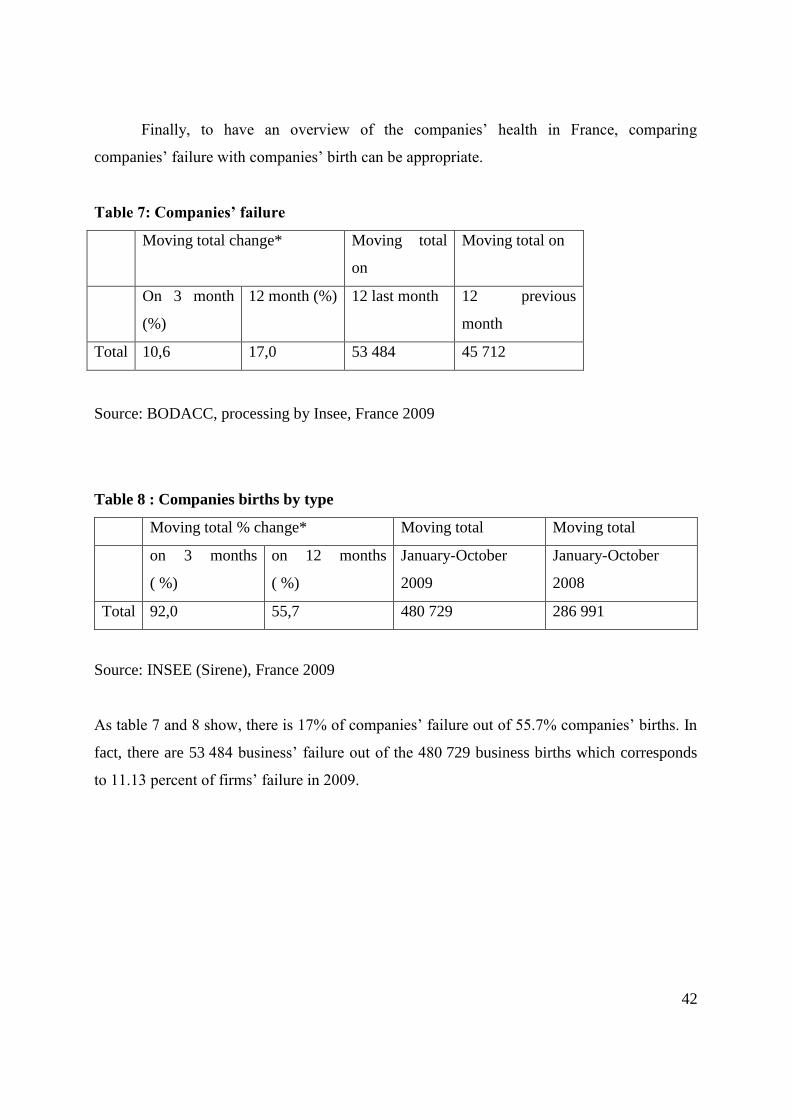
Finally, to have an overview of the companies’ health in France, comparing
companies’ failure with companies’ birth can be appropriate.
Table 7: Companies’ failure
Moving total change* Moving total
on
Moving total on
On 3 month
(%)
12 month (%) 12 last month 12 previous
month
Total 10,6 17,0 53 484 45 712
Source: BODACC, processing by Insee, France 2009
Table 8 : Companies births by type
Moving total % change* Moving total Moving total
on 3 months
( %)
on 12 months
( %)
January-October
2009
January-October
2008
Total 92,0 55,7 480 729 286 991
Source: INSEE (Sirene), France 2009
As table 7 and 8 show, there is 17% of companies’ failure out of 55.7% companies’ births. In
fact, there are 53 484 business’ failure out of the 480 729 business births which corresponds
to 11.13 percent of firms’ failure in 2009.
43
CONCLUSION
The aim of this work was to indentify the cause of the current financial crisis and to
link it to the French economy chronologically. The first step was to discuss the subprime
crisis and then focus on the effects on the French economy.
What is the conclusion? The last financial crisis was responsible for the fall of the French
economy. This was possible thanks to the relationship between banks, financial market and
companies.
The research of the profit by the banks spreading all the risks in the financial market
thinking that to spread risks will cancel all the risks was a mistake. At least, the burst of the
housing price bubble showed the “toxic products” were everywhere and nobody knew which
responsibility they had on it. Banks, Insurance or Companies went bankrupt due to the
possession of the subprime securities they had as an investment.
At a different level, the lax of the financial authorities as the AMF (for France) to
regulate the financial market and the negligence of the credit rating agencies to quote the
securities made the housing price bubble grown. As the bubble bursts, the whole financial
system collapsed and the States came to rescue all the banks due to their fear of the 1929’s
crisis.
However, the financial crisis hit the real economy and France was not avoided. It GDP
and foreign trade went down, the unemployment rose, the consumers changed their
consumption behaviour due to an uncertainty for the future and companies stopped to be
launched and started for the other to close down because of a paucity of funds.
Nevertheless, a question can be asked. How will be the future? French economists
expect an upturn of the economy for 2010 and as the second part of the paper showed, at the
end of 2009, the economy started to recover. With the recovery of the economy, the promises
of a rebuild from A to Z of our financial system become a nonsense because the needs to
change disappear. The change we can expect is more control for the bank and perhaps more
openness from the financial market.
Now the questions are: How will they reinforce the control on the financial markets
and on the banks? How to avoid a new financial bubble with this “destruction power”? How
can governments protect people from this kind of crisis? Do we really have to change our
financial system?

44
References
Literature:
Jacquilat Bertrand - Vivien Levy-Garboua, Les 100 mots de la crise financière September 2nd
2008
Keynes John Maynard, The General Theory of Employment, Interest and Money 1936
Cambridge University Press, London
Mishkin Frederic S, Economics of Money, Banking, and Financial Markets, the Ninth Edition
2009
Parkin Powell Matthews, Economics, Seventh edition 2007
Online reference:
http://fr.wikipedia.org/-2009
http://lekiosque.finances.gouv.fr/ On December 2009 (link to the French custom)
http://www.insee.fr – From November 2009 to January 2010
http://www.ladocumentationfrancaise.fr – 2009
http://www.reflexionhumaniste.org/documents/Chronologie%20des%20grandes%20crises.pdf
- Claude Mauriange February 19th
2009.
http://www.toyota.fr -Toyota France unpublished article 2009
45
Articles from newspaper:
Chavagneux, C.; Alternative economiques, 2008, number 267, p 6 -French newspaper
Chavagneux, C.; .Alternative economiques, 2008, number 274, pp 46-71 -French newspaper
Jean-Michel Lamy, Le nouvel économiste, October 8th
2007, Interview of Financial Times, p
6 -French newspaper
Marianne Bliman, Les Échos, Subprime, June 19th
2007, p31 - French newspaper
Challenges, Marchés financiers, October 9th
2007, p10- French newspaper
Sylvain de Boissieu, Investir, Les banques dans la tempête, number 1753, 2007, p2 - French
newspaper