The Crystallization Kinetics in - COnnecting REpositories · 2016-01-07 · The Crystallization...
25
VYSOKÉ UČENÍ TECHNICKÉ V BRNĚ BRNO UNIVERSITY OF TECHNOLOGY FAKULTA CHEMICKÁ ÚSTAV CHEMIE MATERIÁLŮ FACULTY OF CHEMISTRY INSTITUTE OF MATERIALS SCIENCE THE CRYSTALLIZATION KINETICS IN SEMICRYSTALLINE NANOCOMPOSITES KINETIKA KRYSTALIZACE V SEMIKRYSTALICKÝCH NANOKOMPOZITECH DIZERTAČNÍ PRÁCE DOCTORAL THESIS AUTOR PRÁCE Ing. KATEŘINA HYNŠTOVÁ AUTHOR VEDOUCÍ PRÁCE prof. RNDr. JOSEF JANČÁŘ,CSc. SUPERVISOR BRNO 2010
Transcript of The Crystallization Kinetics in - COnnecting REpositories · 2016-01-07 · The Crystallization...

VYSOKÉ UČENÍ TECHNICKÉ V BRNĚ BRNO UNIVERSITY OF TECHNOLOGY
FAKULTA CHEMICKÁ ÚSTAV CHEMIE MATERIÁLŮ
FACULTY OF CHEMISTRY INSTITUTE OF MATERIALS SCIENCE
THE CRYSTALLIZATION KINETICS IN SEMICRYSTALLINE NANOCOMPOSITES KINETIKA KRYSTALIZACE V SEMIKRYSTALICKÝCH NANOKOMPOZITECH
DIZERTAČNÍ PRÁCE DOCTORAL THESIS
AUTOR PRÁCE Ing. KATEŘINA HYNŠTOVÁ AUTHOR
VEDOUCÍ PRÁCE prof. RNDr. JOSEF JANČÁŘ,CSc. SUPERVISOR
BRNO 2010

The Crystallization Kinetics in Semicrystalline Nanocomposites 2010
2
ABSTRACT
The crystal growth greatly affects morphology and, thus, physical properties of
semicrystalline polymers. In this PhD work, the effect of adding high specific surface area
silica nano-filler on the crystallization kinetics of linear polyethylene was investigated. In
polymers, adding high specific surface area filler is able to alter the chain dynamics even at
very low filler loadings. It is suggested that in the vicinity of the filler surface, polymer chains
exhibit retarded reptation motion due to the chain immobilization caused by either the filler-
polymer interaction or by chain constraints between closely packed nanoparticles.
The polarized optical microscope equipped with a hot stage was employed to measure
the spherulites growth rates in the medium crystallization regime II. It was shown that even
weak interaction between PE chains and silica nano-filler above glass transition temperature
leads to substantial decrease of the spherulite growth rate. The measured data were correlated
with predictions based on the theoretical models and molecular simulations of molecular
dynamics of the crystallizing polymer.
The observed decrease of spherulite growth rate, G, in dependence on both the silica
nano-filler content and polyethylene molecular weight was interpreted utilizing the chain
immobilization hypothesis, where the dynamics adsorption and desorption of the chain at the
filler interface results in the slowing down of the reptation motion.
Keywords: polyethylene, nanocomposite, crystallization kinetics, reduced reptation
ABSTRAKT
Růst krystalů zásadně ovlivňuje morfologii a tím také fyzikální vlastnosti
semikrystalických polymerů. Tato PhD práce přináší alternativní pohled na popis kinetiky
krystalizace v polyolefinech plněných slabě interagujícími částicemi. V nanokompozitních
materiálech vysoký specifický povrch plniva i při nízkých plněních zásadně ovlivňuje
dynamiku řetězců. V blízkosti povrchu plniva začíná hrát významnou roli zpomalená reptace
způsobená jak vzájemnými interakcemi plnivo-polymer tak prostorovým omezením mezi
nanočásticemi.
Růst krystalů byl zkoumán pomocí polarizovaného optického mikroskopu vybaveného
horkým stolkem. Výsledky byly korelovány s teoretickými modely a rozsáhlými
počítačovými simulacemi na molekulární úrovni.
Pozorovaný pokles rychlosti růstu sférolitů v závislosti na obsahu plniva a molekulové
hmotnosti matrice je interpretován na základě imobilizační hypotézy.
Klíčová slova: Polyetylen, nanokompozit, kinetika krystalizace, zpomalená reptace
The Crystallization Kinetics in Semicrystalline Nanocomposites 2010
3
TABLE OF CONTENTS
POLYMER CRYSTALLIZATION ................................................................................... 4
MATERIALS AND METHODS ........................................................................................ 7
RESULTS ........................................................................................................................... 11
THE NUCLEATION EFFECT AND AGGREGATION OF THE FILLERS ......................................... 11
THE SPHERULITE GROWTH RATE ..................................................................................... 11
Comparison of experimental results with the L-H theory predictions ........................ 13
MOLECULAR WEIGHT SCALING OF THE CRYSTALS GROWTH RATES ................................... 14
MOLECULAR DYNAMICS SIMULATIONS ............................................................................. 17
The crystallization in the presence of a nano-filler ..................................................... 18
CONCLUSIONS ................................................................................................................ 23
REFERENCES .................................................................................................................. 24
ACKNOWLEDGEMENTS .............................................................................................. 25

The Crystallization Kinetics in Semicrystalline Nanocomposites 2010
4
POLYMER CRYSTALLIZATION
Many useful materials in the future are expected to be created with various self-
organizing molecules. Crystallization is a typical case of polymer self-organization, which has
long been investigated since the discovery of chain-folding as the principal mode of
crystallization. The chain-folded lamellae are main building blocks of polymeric materials
and their spatial distribution dominates all physicochemical properties of the materials.
Crystal structures and crystallization mechanisms are therefore central subjects in science and
technology of polymers.
Also in most processing technologies, crystallization process can affect physical
properties of final articles made of semicrystalline polymers, substantially. The kinetics of
polymer crystallization is controlled by the diffusion of chains to the phase transition zone.
Changes in morphology brought about by a change in temperature or by the external factors
will cause changes in physical properties and in the response to an applied stress. Thus, due to
the close relation between the properties and morphology, the nature and consequences of the
changes connected with the nanoparticles addition must be fully understood.
The nature of the polymer nanocomposites research is shifting the main emphasis on the
research of fundamental aspects of physics of long chain molecules in both non-Newtonian
liquids and disordered and ordered solids. New phenomena now observed on the micro-scale
are being discovered with huge potential application benefits. Despite its importance, no
generally acceptable explanation of the peculiarities of the development of the crystalline
structure observed in nanocomposites with semicrystalline matrices has been published in the
scientific literature so far.
Crystallization of flexible polymers with a large number of internal degrees of
freedom involves very complicated molecular motions of various space and time scales,
ranging from large scale transport of whole chains to atomistic scale rearrangement of
crystalline stems in perfecting crystalline order. In contrast to the global chain dynamics in the
melt, the molecular motions during crystallization can be very sensitive to the chemical
structure just like the crystal structure being specific to the structure of constituent molecules.
Many stereo-regular polymers, whether synthetic or biological, form partially
crystalline solids, which consist of crystalline lamellae and intervening amorphous layers [1].
The crystalline polymers are known to show characteristic multi-scale structures ranging from
local crystalline structure to macroscopic structure of spherulites (Fig. 1). Since the
morphology is closely related to the properties, it is in the focus of the scientific interest
continuously [2-4]. The crystal structure of polymer is almost uniquely determined as the
lowest free-energy state, and the energy analyses by computer modeling have contributed
much to the structure determinations [5-7]. On the other hand, the large-scale structure, the
way of lamellar stacking or branching for example, may be determined by the balance of
equilibrium and kinetic processes of crystallization. They show a great deal of varieties
depending on the crystallization conditions such as temperature, pressure, solvent as well as
on molecular structure itself [1, 8-10].

The Crystallization Kinetics in Semicrystalline Nanocomposites 2010
5
Figure 1: Multi-scale structures of crystalline polymers, from molecular-level
structure of the lamella crystal growing by reeling in random coiled chains in the melt, to
mesoscopic level structure of growing lamellae showing cooperative layering and twisting,
and to final macroscopic spherulitic aggregate of the lamella [11].
On the basis of the secondary nucleation mechanism, a framework of the molecular
scenario was first proposed by Lauritzen and Hoffman (LH) soon after the discovery of chain-
folded crystallization [12-15]. Due to the great success of the LH-theory especially in
predicting characteristic changes in lamellar thickness and crystal growth rate with
crystallization temperature Tc, most of the discussions thereafter have been concentrated on
understanding various experiments in terms of the LH-theory.
As for the very beginning of crystallization in isotropic melt, the presence of unknown
impurities in polymer samples has long obscured the primary nucleation mechanism. Recent
surge of investigations on the very early stages of crystallization will have an origin in the
proposal of peculiar instability in undercooled melt before the onset of crystallization, a
spinodal-decomposition (SD) or phase-separation assisted nucleation scenario [16].
Emerging also is the new enthusiasm about novel crystallization in strongly confined
systems; very thin film [17] polymers in a cylindrical cavities or nanorods [18] or
nanodomains in phase separated block-copolymers [19] and [20].The presence of surface or
interface will cause strong constraints on polymer conformations and enforce peculiar chain
trajectories during crystallization.
The polymer crystallization thus involves quite new topics as well as historical
unsolved problems. Long flexible polymers are considered to show chain-folded
crystallization from highly entangled states by reeling in their chain tails. The experimental
knowledge available is mostly macroscopic, and detailed molecular processes of polymer
Macroscopic
Mesoscopic Molecular

The Crystallization Kinetics in Semicrystalline Nanocomposites 2010
6
crystallization are not readily accessible. It is the fundamental task to find out possible
molecular pathways from mechanical and statistical–mechanical points of view.
In the presence of nanofillers who are of the similar dimensions as the polymer chain,
one more variable is introduced into the polymer when investigating the kinetics of the
crystallization process on molecular level. The crystal growth rate in nanocomposites was
investigated by Nitta and col. [21].
Figure 2: Experimentally measured dependence of spherulite growth rate on internal surface
area for iPP-SiO2 nanocomposite presented by Nitta et al. 21.
For polypropylene filled with nano-silica, it has been shown that the crystal growth
rate is reduced with the increasing amount of the filler (Figure 2). The observed behavior was
subscribed to the geometrical constraints. Similar trends were observed by Waddon and
Petrovic [22] for polyethylene oxide filled with colloidal silica. The focus is given at the
behavior at the different crystallization temperatures and slowing down of the crystal growth
with the increasing filler content is interpreted in terms of reduced molecular mobility.
However, no direct evidence of this interpretation was given. Recently, the approach to view
the crystallization behavior in nanocomposites from the point of the dynamic fragility concept
has been presented [23]. It has been shown previously that the chain mobility can be
considerably reduced in the presence of nano-sized inclusions near and above the matrix glass
transition temperature, Tg [24]. Hence, it could be assumed that the presence of weakly
interacting silica nanoparticles could result in an increase of the activation energy of chain
diffusion, QD*, in the melt resulting in a considerable change in crystallization kinetics,
similarly to the trends observed by Nitta for polypropylene.

The Crystallization Kinetics in Semicrystalline Nanocomposites 2010
7
MATERIALS AND METHODS
Fumed silica (Sigma Aldrich, USA) with specific surface area of 390 m2/g and mean
particle diameter d = 8 nm was used as the nano-filler. This type of silica, who has a spherical
shape, has been chosen to eliminate the effect of the filler shape.
Figure 3: Transmission electron micrograph of the used silica fillers. The tendency of the
fumed silica to aggregate is shown. On the right is TEM micrograph of HDPE containing 8
volume % of silica nano-filler. The areas with different filler contents are shown. The various
scales are shown with the impact on the various scales.
Commercial high density polyethylene, HDPE, and laboratory synthesized model
polyethylene with narrow molecular weight distribution were used as matrices. Homopolymer
Liten MB 71 (Chemopetrol, CZ, Mw = 86 000 g/mol (determined by high temperature gel
permeation chromatography), Mw/Mn = 5.79) was used as a matrix. Nanocomposites were
prepared by adding silica into the xylene solution of HDPE at 130°C under ultrasonic
vibrations, intensive mixing and drying at 70°C for 10 hours. Dried nanocomposite powder
was compression molded at 170°C using a press (TP 400, Fontijne) into 1 mm thick sheets.
The neat PE, used as a reference material, went through the same preparation procedure as the
nanocomposites.
Sample Filler
volume
content (%)
Specific internal surface of fillers
in nanocomposite = filler-matrix
contact area
(m2/g of composite)
Specific internal surface of
fillers in nanocomposite =
filler-matrix contact area
(m2/cm
3 of composite)
Neat HDPE 0 0 0
HDPE 2 2 16 14.1
HDPE 4 4 32 29.1
HDPE 8 8 64 61.8
Table 1: Table of HDPE samples with emphasis on relation of volume filling
and the specific internal surface of fillers in nanocomposite.

The Crystallization Kinetics in Semicrystalline Nanocomposites 2010
8
Model narrow MWD polyethylenes [25] were prepared using phenoxy-imine complex
catalyst bis[N-(3-tert-butylsalicylidene)-2,3,4,5,6pentafluoroanilinato] titanium(IV)dichloride
in combination with methylalumoxane (MAO) as a co-catalyst.
Average molecular weight (Mn and Mw) and polydispersity index (Mw/Mn) of the
synthetized model polyethylenes were determined by high temperature gel-permeation
chromatograph (Polymer Laboratories) at 140 °C in decalin using polystyrene standards.
Melting temperature (Tm) was determined by DSC upon heating sample to 160 °C at heating
rate of 10 °C/min. The polyethylene was dissolved in xylene at 90°C, stabilized with Irganox
1076 [26] and the various contents of silica were added (0,2,4,8 volume percent). The volume
content was kept so low to be able to capture the onset of the investigated crystal growth
change with the present of the filler. Consequently, the samples were placed in the ultra sound
bath for 15 minutes and then casted on a hot microscope slide and heated for 15 minutes at
170°C.
The spherulite growth rates were investigated using optical microscope (BX50,
Olympus) and hot-stage (LTS 350, Linkam) under isothermal conditions at standard pressure
Prepared films of thickness ranging from 5 to 10 μm were used for crystallization
kinetics measurements, thin slices cut out from the pressed sheets were placed between two
glass slides. Before each measurement of the spherulite radii, the specimen was melted at
170°C. After 5 min at 170oC, the specimen was cooled down below the melting temperature
as fast as the hot-stage allowed. The spherulite growth rate was measured isothermally at
temperatures 125°C, 126°C, 127°C and 128°C, respectively. These temperatures were chosen
to be in the span of crystallization regime II for polyethylene [13]. The samples for the hot
stage were prepared using either solution of melting method. The thickness was determined
via confocal laser scanning microscopy (CLSM) as the thickness for the spherulite to have a
space to fully develop in 3D. To verify the effect of the nucleation of fumed nanosilica in the
matrix, the method suggested by Dobreva has been employed [27]. The samples were heated
in a differential scanning calorimeter (Pyris 1, Perkin Elmer) up to 170°C at a rate of heating
10°C/min. After 2 minutes at 170°C, cooling down to the room temperature was carried out at
rates of cooling 2, 5, 10, 20 and 40°C/min, respectively. Crystallization temperatures were
obtained from the DSC peak maxima. SEM and TEM are utilized to study aggregation of the
particles.
Within this thesis molecular dynamics (MD) and Monte Carlo (MC) methods are
employed. Molecular dynamics solves the Newton´s equation of motion with time, the
temperature or pressure being kept by coupling to thermostat or barostat, respectively. Monte
Carlo method, as suggested by its name, operates on the basics of chance events. The motion
is random and mimics the Boltzmann distribution function [28]. A united atom interaction
potential was used, in which polymer chains are represented by CH2 and CH3 beads that
interact via bonding and non-bonding interactions. The importance of using the realistic
potential has been shown as crucial for the balance between orienting and crystal packing

The Crystallization Kinetics in Semicrystalline Nanocomposites 2010
9
process. United atom force field for polyethylene melts derived by Paul and coworkers (PYS)
[29] has been employed in this thesis. The non-bonded potential for atoms separated by more
than three bonds follows the Lennard-Jones (LJ) relation [29]:
612 )/()/(4 rrENONBOND , (1)
where ε = 0.0504 kJ/mol and equilibrium reference distance σ = 4.01Å with a given cut off
distance of 12Å. LJ potential is particularly important in the bulk systems. By variation in LJ
particle-matrix interactions the different type of interactions has been set up (Table 2).
Weakly interacting Strongly interacting None Repulsive
Sigma 4.01Å 4.01Å 4.01Å 4.01Å
Epsilon 0.0504 kJ/mol 0.504 kJ/mol 0 kJ/mol 0.0504 kJ/mol
From 0.2 Å : 0 kJ/mol
Table 2: Lennard-Jones potential parameters
The system of 100 chains, each one containing 100 units, was generated by Monte
Carlo method respecting the potential field presented. The script was written in C/C++
programming language. The bond lengths and bond angles were kept constant and the
torsional angles were distributed according to the Boltzmann distribution at the given
temperature. The bulk sample was generated at the reduced density 0.3g/cm3, because at
higher densities the probability to find the acceptable free The Nose-Hoover temperature
coupling was utilized with time constant t = 0.1ps. As for the single chain system, velocities
at the temperature 500K were generated by the Maxwell distribution and first 5ns of the
simulation were taken as equilibration of the system.
The nanoparticles consisted of 46 Lennard-Jones particles bound to form icosahedral
shape (Figure 4). It was inserted into the nanocomposite prior the generation of the melt .The
diameter of the particle was 2nm. Consequently, the sample was allowed to equilibrate at
500K for 1ns.
Figure 4: The nanoparticle representation. The Lennard-Jones particles are in the tips of the
icosahedral object. The interaction radius of each particle is dependent on the filler-matrix
interaction type (Table 2).

The Crystallization Kinetics in Semicrystalline Nanocomposites 2010
10
According to Yamamoto [30], the crystal surface was defined as the aligned chains in
the xy plane with the interlayer spacing of 3.78 nm which corresponds to the crystal facet
(100). The starting simulation box was 27x80x70A. As we are investigating the crystal
growth itself not the nuclei formation or initiation period, this definition of the crystal surface
has proven to be in line with the polymer physics.
The standard measure of order used in polymer systems is the global bond
orientational parameter at time t
2
1
2
)()(3)(
tttS
ji
, (2)
where νi(t) is the orientation vector of atom i at time t, defined by the chord from atom i-1 to
atom i+1, and the average is taken over all pairs i and j. However, in order to calculate the
spatial distribution of order within the simulation box a local orientation order must be
defined. The method implemented by Waheed [31] based on the convolutions of the local
chain orientation vectors with spatial box functions is utilized. .
For nanocomposites, the samples were equilibrated for 1ns at the temperature of 500K.
The simulation was conducted in the NVT ensemble (constant number of particles (N),
volume (V) and temperature (T)) at the temperature of 400K. The molecular simulation
package Gromacs 4.0.5 [32] has been used to perform the computer simulation and Visual
Molecular Dynamics [33] was utilized for visualization. The computational cost was 25.797
Mnbf/s, simulations were conducted to 100ns. The scheme of the model arrangements is
shown in Figure 5.
Figure 5: The experiment arrangement for single particle and two particles. The arrows sign
the distance from the crystal surface and the inter-particle distance, respectively. C stands for
the distance from the crystal surface and P for the distance of particle centers, respectively.
Crystal surface
C
P
C
P
Crystal surface
C

The Crystallization Kinetics in Semicrystalline Nanocomposites 2010
11
RESULTS
The nucleation effect and aggregation of the fillers
Although this work is primarily focused on the subsequent spherulite growth, it is
important to investigate the possible heterogeneous nucleation activity and the aggregation
effects of the fillers that could affect the crystallization kinetics and its interpretations,
significantly.
Utilizing the SEM micrographs and the method of Dobreva [27] suggests that the
silica nano-filler used in our experiments did not exhibit any significant nucleation activity in
HDPE matrix under the experimental conditions used.
Nanometer sized silica particles tend to form more complicated structures, depending
on the matrix – filler interaction type and solidification process [34]. In addition to forming
particle strings upon synthesis, the fumed silica has a strong tendency to aggregate in polymer
matrix similarly to colloids. This results in formation of island like structure of resin rich and
particle rich areas (Figure 3). The TEM micrograph on the right has been taken for the HDPE
filled with 8 volume % of fumed silica. Within this thesis, surface treatment of the silica
nanoparticles would introduce another entity into the matrix-filler interface, changing the
dynamics in the investigated area. Thus, to overcome the aggregation issue, the ensemble of
the representative samples of the nanocomposite was chosen and the results were averaged.
The Spherulite Growth Rate
The spherulite growth rate was investigated utilizing polarized optical light
microscopy equipped with a hot stage. The thickness of the sample for the experiments was 5-
10μm to allow the full development of the three dimensional structure. The growth rates were
measured isothermally with the medium level undercooling corresponding to crystallization
regime II where the effect of particles on the chain reptation is expected to be the most
pronounced. For polyethylene, this range corresponds to crystallization temperatures in the
range of 120-129 °C [13]. The results of 10 measurements were averaged to determine the
average growth rate, G.
The micrographs of the growing spherulites are shown in the Figure 6. They were
taken for the neat polyethylene at the temperature 127°C, the interval between the shots was 5
minutes and the right micrograph exhibits the final stage when the crystal growth observable
by the polarized microscopy is finished. The black areas correspond to the amorphous parts
while the light ones correspond to the crystalline phase. The light objects are crystals of
HDPE. In time, the spherulitic structure starts to emerge and grows until the crystals impinge
each other at the boundaries.

The Crystallization Kinetics in Semicrystalline Nanocomposites 2010
12
Figure 6: The micrographs of the growing spherulites in the neat HDPE at 127°C.
The micrograph on the right corresponds to the observable final structure.
The crystal growth rate was determined from the polarized optical light micrographs
taken automatically at suitable time intervals, as an increase of spherulite radius in time. As
expected, the growth of the spherulites was linear in time. Then, the final growth rate GII was
given by the slope of time dependence of spherulite radii. It can also be seen that the slope of
the linear R vs. t dependence decreased with the increasing filler content (Figure 7).
Figure 7: The example of the linear time dependence of spherulite radius R at the
temperature 125°C for HDPE/silica nanocomposite with filler content 0, 2, 4 and 8 volume %
(specific internal surface 0, 16, 32 and 64 m2/g of the filler in nanocomposite.
With the increasing area of the matrix-filler interface, for the sample with 8 volume %
of silica, the growth rate was reduced to approximately 20%of its value for neat PE. This
trend has been observed for the whole range of investigated temperatures in the crystallization
regime II. In agreement with the crystallization thermodynamics, the crystallization rates were
faster for higher undercooling (Fig. 8 on the left, melting temperature Tm = 135°C,
temperature of maximum crystallization velocity Tvmax = 46°C [3]). However, the trends of
the crystal growth dependence on the content of the fillers are very similar in the whole
0,0 0,2 0,4 0,6 0,8 1,0 1,2 1,4 1,6 1,8
2
4
6
8
10
12
14
16
18
125°C
Neat HDPE
2vol%
4vol%
8vol%
Sp
eru
lite
ra
diu
s R
(m)
Time (min)

The Crystallization Kinetics in Semicrystalline Nanocomposites 2010
13
temperature regime (Figure 8 on the right). The crystal growth was investigated, thus, the
nucleation time was not important in this experiments.
Figure 8: On the left, the growth rates dependence on the undercooling for the samples of
neat polyethylene and nanocomposite. The diffusion changes are more pronounced at lower
temperatures, there are only weak interaction present between the matrix and the filler. On
the right, trends of spherulite growth rate G in dependence on the matrix-filler interface area.
Comparison of experimental results with the L-H theory predictions
To be able to separate various contributions that cause the observed reduction of the
crystal growth rate, experimentally measured growth rate data were compared with the
predictions based on the Lauritzen Hoffman secondary surface nucleation theory with the
incorporated terms for activation energy of the reptation motion [12].
The growth rate observed via polarized light optical microscopy corresponds to the GII
in this theory. The activation energy Q*
D has been taken as a variable parameter to correlate
the calculated trends with experimental data. For the neat HDPE, the curve has been fitted to
the experimental data and corresponding activation energy value was found to be 24 kJ.mol-1
which is in excellent agreement with the activation energy for the reptation motion for PE
published in the literature which is in the range from 20 to 25 kJ/mol 37,38. The comparison
of L-H prediction for neat HDPE and the experimentally measured GII for the neat and silica
filled HDPE is shown in Figure 9.
Moreover, it was found that with increasing filler-matrix interface area, the Q*
D
calculated from the L-H theory followed the observed trends and increased significantly up to
the 108kJ.mol-1
for 8vol % of silica. Thus, it can be suggested that in the presence of the
weakly interacting surface, the reptation motion was retarded and extend of immobilization
increased with increasing filler-matrix interface area. Assuming interphase layer thickness
equal to approximately 1Rg (3.74 nm for the HDPE) the diffusion activation energy from the
L-H theory can be estimated as QDinterphase
= 2QDneat
. This trend was shown valid over the
entire undercooling regime II.
125 126 127 128
0,00
0,02
0,04
0,06
0,08
0,10
Neat HDPE
2vol% - filler surface area 14.1 m2/cm
3
4vol% - filler surface area 29.1 m2/cm
3
8vol% - filler surface area 61.8 m2/cm
3
Gro
wth
ra
te G
(m
/s)
Temperature (°C)
0 20 40 60 80
1E-4
1E-3
0,01
0,1
125°C
126°C
127°C
128°C
log
G (m
/s)
Filler surface area ( m2/cm
3 of the nanocomposite)

The Crystallization Kinetics in Semicrystalline Nanocomposites 2010
14
Figure 9: Spherulite growth rate of neat and nano-filled HDPE in dependence on
temperature.
Molecular weight scaling of the crystals growth rates
From reptation theory, the diffusion coefficient, D, dependence on molecular weight
M is predicted as 𝐷~𝑀−2 [40]. Including two additional effects, constraint release (CR) that
happens when a spatially confined chain moves out of the way of a given chain and, thus,
opens some space for lateral motion and contour length fluctuations (CLF), when the chain
contracts in its tube and after subsequent expansion it loses memory of the initial tube and the
D scales as 𝐷~𝑀−2.30±0.1 up to 𝑀 ≅ 103 instead of by reptation predicted 𝐷~𝑀−2 [41].
Since the crystal growth rate is measured in relatively thin films in our experiments, the
diffusion could be spatially limited to the two dimensions. The geometrical dimensions could
also be changed with the chains confinement due to the particle presence.
In this experimental study, the well defined polyethylenes with polydispersity index
close to 1 were utilized. For the molecular dynamics considerations, the number molecular
weight average,𝑀𝑛 , was used. The molecular weight was chosen to vary from 64800 to
146800.
Again, the growth rate of the crystal formation has been determined as a slope of
crystal radius time dependences. Similarly to the commercial HDPE, all R vs. t dependences
were linear. In agreement with the observations in commercial HDPE, the slopes are lower
with the increased matrix-filler interface area. As expected, crystallization temperature
exhibited much more pronounced effect for low molecular weight PE. It is important finding
that growth rate dependencies on temperature in the crystallization regime II are the similar
for the neat system and both nanocomposites that suggests that in the presence of the fillers no
additional change in the crystallization mechanism can be expected.
125 126 127 128
10-3
10-2
10-1
Neat PE
2vol%
4vol%
8vol%
GR
OW
TH
RA
TE
(
m.s
-1)
TEMPERATURE °C
Q*NEAT
= 24kJ.mol-1
Q*D
increases

The Crystallization Kinetics in Semicrystalline Nanocomposites 2010
15
The absolute value of GII decreased with increasing amount of silica and increasing
molecular weight of PE, however, the scaling exponent remained constant within the
experimental error (Table 3). The scaling of crystal growth rate with Mn obeys the reptation
plus CLF prediction, 𝐷~𝑀−2.30±0.1 , for both neat and filled PE. This supports the hypothesis
that chain reptation remains the main means of mass diffusion to the growing crystal face.
With the observed molecular weight scaling of crystals growth rates it is possible to suggest,
that the crystal growth rate reduction observable with addition of silica nanoparticles to the
PE is of the reptation type and can be contributed to the immobilization effect of the presence
of a large internal surface area.
Moreover, the dependence is of the same strength not as it would be expected with
changing fragility. Dynamic fragility of the glass forming liquids and fragility index,
respectively, reflect the rate of change of the dynamic properties with temperature. From the
point of molecular weight, lower molecular weight materials have a higher mobility and thus
shorter relaxation times. Thus, the lower fragility is connected with the weaker molecular
weight scaling.
Molecular weight
dependence
125°C 126°C 127°C
Neat PE -2.348 -2.348 -2.253
2 vol % filler -2.301 -1.967 -2.034
4 volume % filler -2.267 -2.161 -2.165
Table 3: Scaling of the crystal growth rate with molecular weight. The exponential
coefficients are listed here.
The increased entanglement density [42] can be one of the mechanisms causing the
retardation of chain reptation with adding the nanoparticles into the polymer matrix. In the
reptation theory [40], entanglement is viewed as a topological constraint to the chain
dynamics. The reduction of the crystal growth rate in the presence of fillers with large specific
surface area then can be a result of apparent increase of the effective number of entanglements
per chain reducing the reptation tube diameter. Considering the average entanglement length
of polyethylene chain in neat PE equal to 35 monomeric units [43], it is possible to ascribe the
decreased crystal growth rate to the increased number of effective entanglements (Figure 10).

The Crystallization Kinetics in Semicrystalline Nanocomposites 2010
16
Figure 10: The crystal growth rates at 125°C. The rate decreases with the increasing
of the filler content and with increasing molecular weight of the matrix. On the right, the
effective number of entanglements calculated from the crystal growth rates at 125°C.
For PE containing 2 volume % of silica, the number of effective entanglements was
increased by factor 1.41 and for PE containing 4vol% of silica by factor of 1.83. The same
trend is valid for all temperatures investigated (Figure 11). The trends still follow the reptation
expected scaling of the dependence on molecular weight. Based on these results, it can be
assumed that the reduction of the crystal growth rate can be interpreted as a result of increased
number of effective entanglements per a polymer chain, in agreement with the theory of the
chains immobilization at the particle surface.
Figure 11: Dependence of the growth rates based on the effective number of
entanglements calculated from the crystal growth rates at 125°C. Shift factors are 1 for neat
system, 1.41 for nanocomposite containing 2vol% of silica filler and 1.83 for nanocomposite
with 4vol% of fillers, respectively. The arrows show the matrices with in reality the same
molecular weight. On the right, plot of the growth rates based on the effective number of
entanglements calculated from the crystal growth rates at all temperatures, applying the shift
factors from the figure.
60 80 100 120 140 160
0,000
0,005
0,010
0,015
0,020
0,025
0,030
0,035
0,040
Gro
wth
ra
te G
(m
/s)
Molecular weight x 10-3
Neat PE
2 vol % filler
4 vol % filler
60 80 100 120 140 160
0
1000
2000
3000
4000
5000
6000
7000
Neat PE
2 vol % filler
4 vol % filler
Nu
mb
er
of e
nta
ng
lem
en
ts c
orr
esp
on
din
g
to
gro
wth
ra
te G
Molecular weight x 10-3
2000 3000 4000 5000 6000 7000 8000
0,000
0,005
0,010
0,015
0,020
0,025
0,030
0,035
0,040
Number of effective entanglements per chain
Neat PE
2 vol % filler
4 vol % filler
Gro
wth
ra
te G
(m
/s)
1000 2000 3000 4000 5000 6000 7000 8000
0,000
0,005
0,010
0,015
0,020
0,025
0,030
0,035
0,040 125°C
126°C
127°C
Gro
wth
ra
te G
(m
/s)
Number of effective entanglements per chain

The Crystallization Kinetics in Semicrystalline Nanocomposites 2010
17
Molecular dynamics simulations
The L-H theory provides sound support for the hypothesis that the crystal growth rate
reduction is mainly due to the immobilization of the chains at the particle surface and thus,
due to the retarded diffusion of chains to the growth front. However, due to its semi-empirical
nature, the need for a computer simulation arose. As the observed phenomena take place on
the molecular level, the molecular dynamics and Monte Carlo simulations were employed to
give further insight into the phenomena investigated. The systems were created step by step to
verify the physical basis of the given stage before moving to the higher stage. It is necessary
to bear in mind that computer simulation still posses many assumptions and limitations (e.g.
much shorter chains, short times, etc.) and, thus, they are used to show the trends rather than
to calculate actual values of parameters investigated.
Prior inserting the nanoparticle into the system the physical properties of chain and
bulk and the crystallization of the neat polymer was performed and compared with
experimentally available data.
Single chain system was created to the test of the physical properties and correctness
of the used parameters and methods. The chains of 1000, 2000, 3000 and 5000 units were
used as samples. Simulation temperatures were 500K, 400K, 300K, 200K and 100K. The
Nose-Hoover temperature coupling was utilized with time constant t = 0.1ps. Velocities at
given temperature were generated by the Maxwell distribution. First 5ns of the simulation
were taken as equilibration of the system. Neat PE has been modeled as an ensemble of 100
chains each consisting of 100 segments. The characteristic ratio was found to be 5.7 which is
in good agreement with Boyd and Philips giving value of 6 for the chain length of 100 units
[38]. The ratio of the chain radius of gyration and end-to-end distance was higher than 6, thus,
the systems due to the short chain lengths should not be treated as a Gaussian chain. The RG
calculated based on the theoretical model by Flory for the chain of 100 was 3.74 nm.
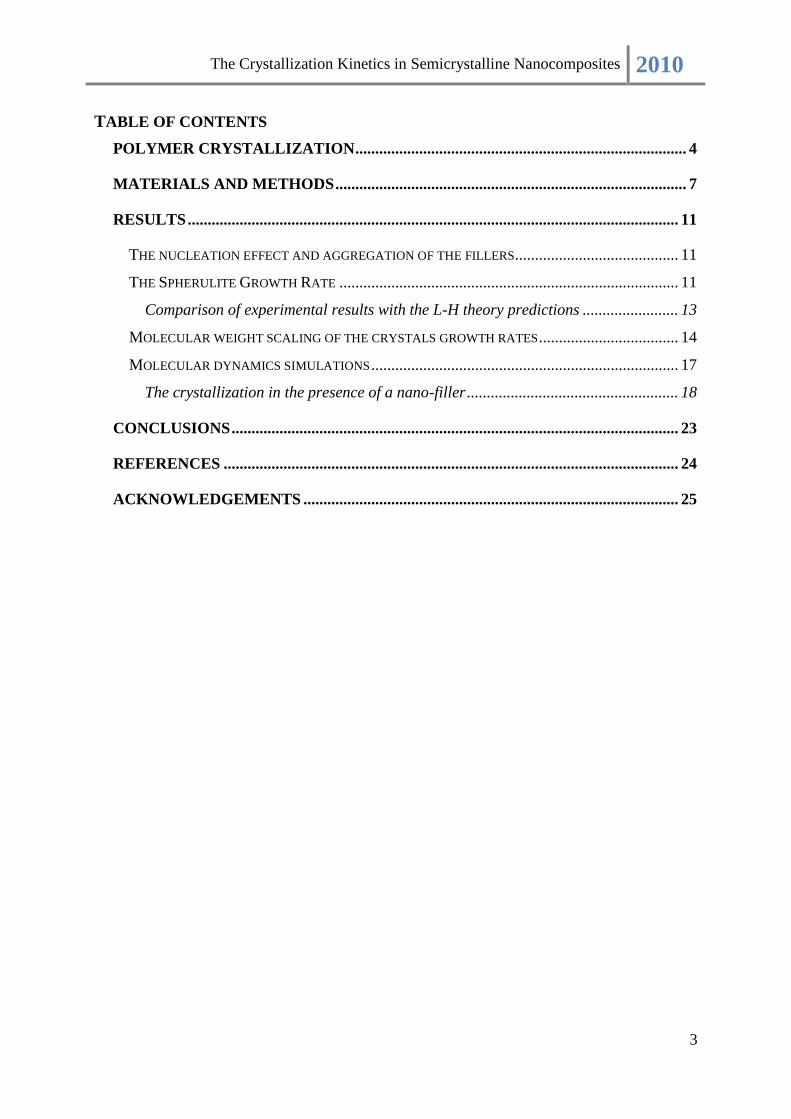
The crystal development was observed in three layers utilizing the order parameter
development, the example of the emerging order is shown in the Figure 12. During the
simulation, the additional crystalline order starts to develop on the primarily crystal surface.
The first peak on the left side of the graph stands for the primarily crystal surface, the second
and further are signifying the crystalline structure ordering. The peaks on the right emerge due
to the periodic boundary condition in the simulation settings.
The time dependence of the observed order parameters depicted in Figure 12 is similar
to that simulated by Waheed et al. [31] utilizing the Steel type potential field as a crystalline
surface. The green line corresponds to the order of the primarily inserted crystalline surface of
polyethylene, the black, red and blue show the order development in time for the newly
created crystalline layers. The growth rate of the composite was determined for each sample
by the completion of the ordering in the crystallization plane averaged over the first two
crystalline layers emerging during the simulation at the primary surface of polyethylene
crystal.
The Crystallization Kinetics in Semicrystalline Nanocomposites 2010
18
1 2 3 4 5 6 7
650
700
750
800
850
III. layer
II. layer
De
nsity (
kg
.m-3)
Distance from crystal surface (nm)
Crystal
surface
I. layer
0 20 40 60 80 100
0,0
0,1
0,2
0,0
0,1
0,2
0,3
0,4
0,5
0,6
0,7
0,8
0,9
1,0
Ord
er
pa
ram
ete
r
Time (ns)
I. crystal layer
II.crystal layer
III.crystal layer
Crystal surface(Full order)
Figure 12: Example of the density profiles utilized to detect the positions of the growing
layers. The minima between the peaks were used to set the layer boundaries for each
measurement on the left and example of the order parameter used to calculate the growth rate
or the crystalline order formation, respectively. The points are the times when the order was
analyzed. The simulation of each system was up to 100ns. For each simulation of this type
was analyzed.
The simulated crystal growth rate for the neat polymer was found to be 4.10–4
nm.ns-1
.
This value fits the theoretical predictions of van Krevelen and Strobl and is in agreement with
the simulations data of Waheed [3, 31, 36]. The maximal experimentally obtained value for
the crystal growth rate was of the order of 1.10–5
nm.ns–1.
The difference between
experimental and theoretical value could be ascribed to the higher molecular weight of the
experimentally measured samples and, thus, higher entanglement density. Also, simulation
techniques operate on molecular scale and experimental techniques probe the problem starting
on a macroscale, thus, the direct comparison can face a certain difficulties.
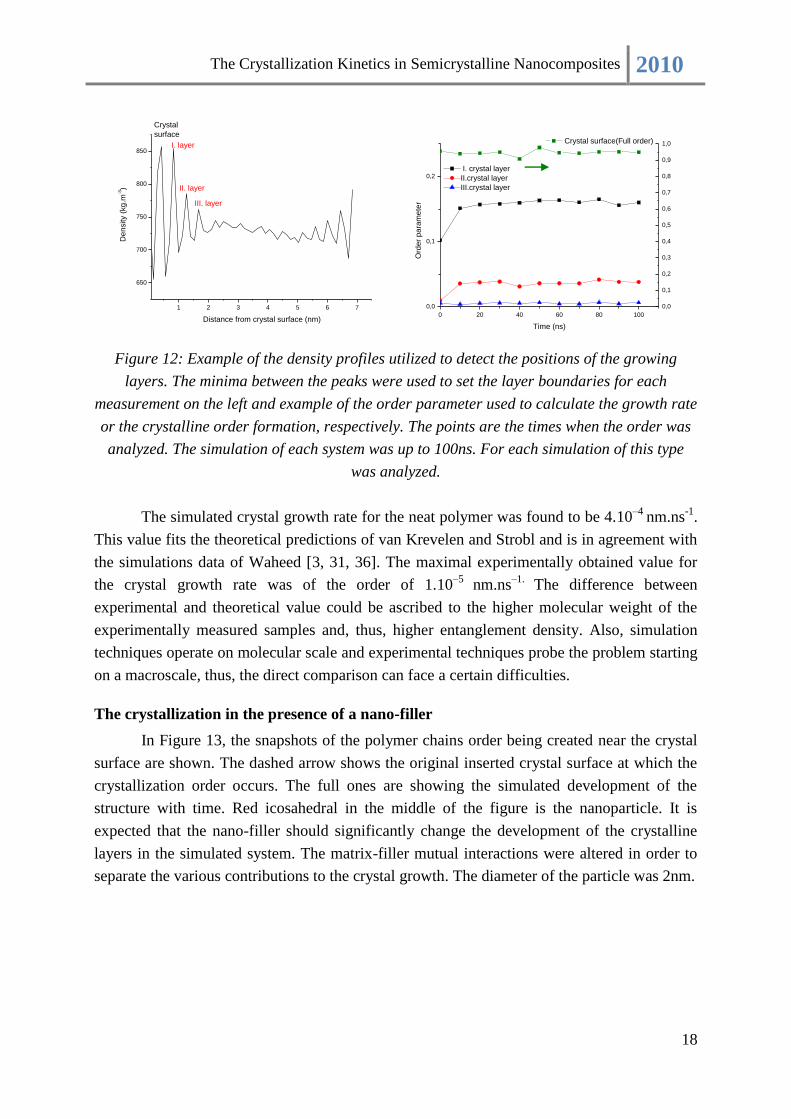
The crystallization in the presence of a nano-filler
In Figure 13, the snapshots of the polymer chains order being created near the crystal
surface are shown. The dashed arrow shows the original inserted crystal surface at which the
crystallization order occurs. The full ones are showing the simulated development of the
structure with time. Red icosahedral in the middle of the figure is the nanoparticle. It is
expected that the nano-filler should significantly change the development of the crystalline
layers in the simulated system. The matrix-filler mutual interactions were altered in order to
separate the various contributions to the crystal growth. The diameter of the particle was 2nm.
The Crystallization Kinetics in Semicrystalline Nanocomposites 2010
19
Figure 13: The snapshots of the crystal growth at the simulation start and after
30ns.The textured arrows stand for the primary crystal surface while the red full arrows
signify formation of the new lamellae in time of the computer simulation.
In Figure 14, one can compare that order development rates in the case of strongly or
weakly interacting particle is lower than in neat polymer. For the repulsive or non interacting
particle, no significant perturbation of the order development is observable, when the crystal
surface is in a distance from the particle (on the left 2.4 nm) where the entanglements can
transfer the immobilization effect to the distance more far from the actual immobilization site
at the particle surface. These trends are reproduced also when moving the particle closer to
the crystalline surface. When the primary crystal surface is close to a particle, the geometrical
constraints are becoming more pronounced. The emphasis has been given to the comparison
of the crystal growth rates with different type of interactions. As shown in Figure 13, the
experimentally observed retardation is dominant only in attractive system and increased with
the attractive interaction strength. The geometrical effects are supposed to happen due the
constraints imposed on the chains in the inter-particle spaces and distance of the particle from
the crystallizing surface. No increase in the growth rate for repulsive particle-matrix
interaction in comparison with the final growth rate in polymer suggested that the dynamic
fragility concept cannot be used. For the attractive filler-matrix potential, the chain packing at
the surface is more perturbed in comparison with a neat melt. This can result in a higher
structural frustration in a nanocomposite material.
Tim
e

The Crystallization Kinetics in Semicrystalline Nanocomposites 2010
20
Figure 14: The ordered structure development for the simulated HDPE
nanocomposite with silica content 1.81vol %, comparison of the various interaction types.
The values are taken relatively to the neat system. On the right, the relative crystal growth
rate for the various particle-chain interactions in dependence on the particle distance from
the crystal surface. Silica content 1.81vol %.
Even more insight into the phenomenon was given by simulating the effect of two
particles on GII. In the comparison with the results for one particle, it can clearly be seen that
adding second particle makes the simulation more realistic resulting in further decrease in the
crystalline order development rate depending on the particles-matrix interaction, mutual
position of the particles and the distance from the crystal surface.
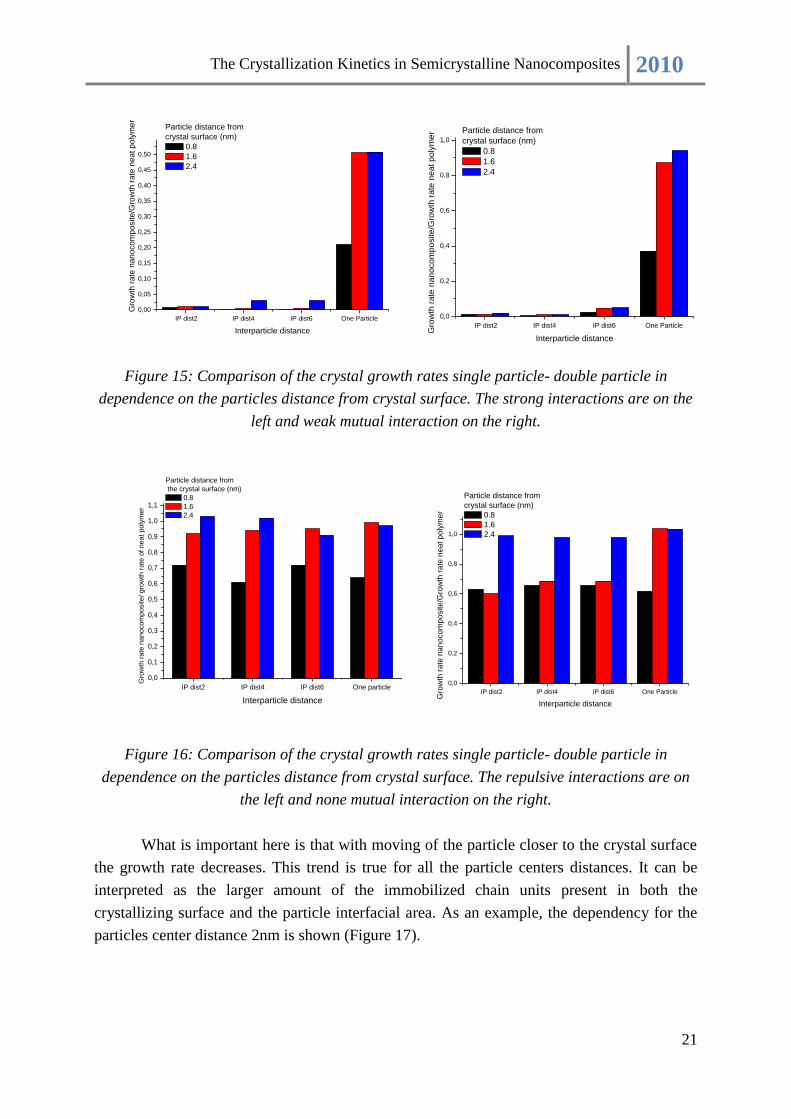
For strong attraction, the crystal growth is significantly retarded at all distances from
the surface investigated. This, in lesser extent, was valid also for the weakly interacting
systems (Figure 15). In contrast, the repulsive and non-interacting systems tend to slow down
the order formation only in the very close vicinity of the crystal surface. Very importantly, for
non-attractive systems, no significant difference was obtained between the tendencies of
system with one and two particles for the same distance from the crystal surface (Figure 16).
It is possible to see that the chain dynamics retardation in the vicinity of the particle
surface is controlled by the chain-particle interaction strength. The restrictions observable
also for the non-interacting and repulsive types never reach such a scale as in the case of
interacting filler.
I C R N Neat
0,0
0,2
0,4
0,6
0,8
1,0
Gro
wth
ra
te / g
row
th r
ate
of n
ea
t p
oly
me
r
Type of interaction
0,6 0,8 1,0 1,2 1,4 1,6 1,8 2,0 2,2 2,4 2,6
0,2
0,3
0,4
0,5
0,6
0,7
0,8
0,9
1,0
Strong
Weak
Repulsive
None
Gro
wth
rate
nanocom
posite/ gro
wth
rate
of neat poly
mer
Distance from the crystal surface (nm)
The Crystallization Kinetics in Semicrystalline Nanocomposites 2010
21
IP dist2 IP dist4 IP dist6 One Particle
0,00
0,05
0,10
0,15
0,20
0,25
0,30
0,35
0,40
0,45
0,50
Gro
wth
ra
te n
an
oco
mp
osite
/Gro
wth
ra
te n
ea
t p
oly
me
rParticle distance from
crystal surface (nm)
0.8
1.6
2.4
Interparticle distance IP dist2 IP dist4 IP dist6 One Particle
0,0
0,2
0,4
0,6
0,8
1,0
Gro
wth
ra
te n
an
oco
mp
osite
/Gro
wth
ra
te n
ea
t p
oly
me
r
Interparticle distance
Particle distance from
crystal surface (nm)
0.8
1.6
2.4
Figure 15: Comparison of the crystal growth rates single particle- double particle in
dependence on the particles distance from crystal surface. The strong interactions are on the
left and weak mutual interaction on the right.
IP dist2 IP dist4 IP dist6 One Particle
0,0
0,2
0,4
0,6
0,8
1,0
Gro
wth
ra
te n
an
oco
mp
osite
/Gro
wth
ra
te n
ea
t p
oly
me
r
Interparticle distance
Particle distance from
crystal surface (nm)
0.8
1.6
2.4
Figure 16: Comparison of the crystal growth rates single particle- double particle in
dependence on the particles distance from crystal surface. The repulsive interactions are on
the left and none mutual interaction on the right.
What is important here is that with moving of the particle closer to the crystal surface
the growth rate decreases. This trend is true for all the particle centers distances. It can be
interpreted as the larger amount of the immobilized chain units present in both the
crystallizing surface and the particle interfacial area. As an example, the dependency for the
particles center distance 2nm is shown (Figure 17).
IP dist2 IP dist4 IP dist6 One particle
0,0
0,1
0,2
0,3
0,4
0,5
0,6
0,7
0,8
0,9
1,0
1,1
Particle distance from
the crystal surface (nm)
0.8
1.6
2.4
Gro
wth
rate
nanocom
posite/ gro
wth
rate
of neat poly
mer
Interparticle distance

The Crystallization Kinetics in Semicrystalline Nanocomposites 2010
22
0,8 1,6 2,4
0,0
0,1
0,2
0,3
0,4
0,5
0,6
0,7
0,8
0,9
1,0
Gro
wth
ra
te n
an
oco
mp
osite
/Gro
wth
ra
te n
ea
t p
oly
me
r
Particle center distance from crystal surface (nm)
Type of interaction
Strong
Weak
Repulsive
None
S W R N
0,0
0,1
0,2
0,3
0,4
0,5
0,6
0,7
0,8
0,9
1,0
1,1
Gro
wth
ra
te n
an
oco
mp
osite
/Gro
wth
ra
te n
ea
t p
oly
me
r
Type of interaction
Particle distance
from crystal surface (nm)
0.8
1.6
2.4
Figure 17: The order development rates in dependence on the distance of the particles from
crystal surface and for various interaction types (left). The distance of particle centers is
constant (2nm). I stands for strong interaction, C-weak interaction, R-repulsive, N-non-
interactive system, respectively.
When moving particles closer to each other while keeping their distance from the
crystal surface constant, the vertical confinement enhanced the possibilities to create a simple
particle-polymer network via bridges or loops. The following figure (Figure 18) shows, that
with the decreasing inter-particle distance, the crystal growth rate remains unaffected within
the experimental error. These data suggest that the vertical confinement of the chains is not
playing an important role in the chains immobilization. It implies, the bridging effects had no
significant effect on the crystal growth rate in the model PE/silica nanocomposites.
2 4 6
0,0
0,2
0,4
0,6
0,8
1,0
Gro
wth
ra
te n
an
oco
mp
osite
/Gro
wth
ra
te n
ea
t p
oly
me
r
Particles center distance (nm)
Type of interaction
Strong
Weak
Repulsive
None
I C R N
0,0
0,1
0,2
0,3
0,4
0,5
0,6
0,7
0,8
0,9
1,0
1,1
Gro
wth
ra
te n
an
oco
mp
osite
/Gro
wth
ra
te n
ea
t p
oly
me
r
Type of interaction
Particle center distance (nm)
2
4
6
Figure 18: The order development rates in dependence on the distance of the particles centers
and for various interaction types (left). The distance from the crystal surface is constant
(2.4nm. I stand for strong interaction, C-weak interaction, R-repulsive, N-non-interactive.

The Crystallization Kinetics in Semicrystalline Nanocomposites 2010
23
CONCLUSIONS
Within frame of this PhD work the isothermal crystallization of neat HDPE has been
investigated using the polarized light optical microscope and hot stage. The results clearly
showed that the rate of spherulite growth was substantially decreased by the addition of silica
nanoparticles. In order to explain the observed crystallization behavior interpretation based on
the assumption that the segmental diffusion is considerably reduced in presence of
nanoparticles has been suggested. To verify the proposed hypothesis, the experimental data
were correlated with Lauritzen- Hoffman secondary surface nucleation theory. The role of the
fillers nucleation and aggregation was included. The nanocomposite nucleates
homogeneously and uniformly within the sample. Further on, the molecular dynamics
simulations on molecular level were performed.
The following evidence supporting the immobilization theory has been observed: The
correlation of the experimentally measured decrease in crystal growth rates with the
Lauritzen-Hoffman secondary surface nucleation theory clearly showed the increase of the
activation energy of the reptation motion with the increased internal surface area of the filler.
The molecular weight scaling was following the reptation prediction with the contour length
fluctuation included. The results clearly showed that the reduction of the crystal growth rates
can be interpreted via immobilization theory as the increased number of effective
entanglements. From the molecular dynamics simulation as the primary mechanism affecting
the morphology development was identified the mutual particle-matrix interaction type and
thus the immobilization of the chains at the filler surfaces. Based on these results, the crystal
growth and thus the morphology formation in the filled systems should be up to the certain
threshold tailored by altering the mutual interactions.
The significance of the obtained results is twofold. First, knowledge of the
fundamental processes affecting the chain dynamics in the presence of particles with size of
the order of the radius of gyration of the chains was gained. Second, quantification of the
relationships between structural variables, crystallization kinetics, crystalline structure and
deformation response in polyolefin nanocomposites can provide a base for developing new
advanced high volume polymer materials for a wide range of applications. The computer
model will help to understand and predict properties of semicrystalline nanocomposites by
allowing optimizing of the composition and processing conditions. Results of this research
can also contribute significantly to the basic understanding of the effects of chain
immobilization on various aspects of behavior of nanostructured polymeric systems in both
molten and solid state.
The Crystallization Kinetics in Semicrystalline Nanocomposites 2010
24
REFERENCES
[1] B. Wunderlich, Macromolecular physics vols. 1–3, Academic, New York (1976).
[2] Woodward, A.E., Atlas of polymer morphology. 1988, Munich, Hanser publishers, 25,47.
[3] van Krevelen, D.W., Properties of Polymers, Elsevier, Amsterdam, 1997.
[4] Strobl G., The physics of polymers, Springer, 2006.
[5] H. Tadokoro, Structure of crystalline polymers, John Wiley and Sons (1979).
[6] E.A. Colboun and J. Kendrick, previous termComputernext term simulation of polymers,
Longman Scientific & Technical (1994).
[7] G. Rutledge In: M. Kotelyanskii and D.N. Theodorou, Editors, Simulation methods for
polymers, Marcel Dekker, New York (2004).
[8] Interphases and mesophases in polymer crystallization. In: G. Allegra, Editor, Adv.
Polym. Sci. vols. 180, 181, 191, Springer, Berlin (2005).
[9] L. Mandelkern, Crystallization of polymers vols. 1–2, Cambridge University Press,
Edinburgh (2002).
[10] D.C. Bassett, Principles of polymer morphology, Cambridge University Press (1981).
[11] Yamamoto T., Orimi N., Urakami N., Sawada K., Molecular dynamics modeling of
polymer crystallization; from simple polymers to helical ones, Faraday Discuss., 2005,
128, 75-86.
[12] J.D. Hoffman and R.L. Miller, Polymer 38 (1997), p. 3151.
[13] K. Armistead and G. Goldbeck-Wood, Adv Polym Sci 100 (1992), p. 219.
[14] Hoffman, J. D.; Lauritzen, J. I. Jr.; J Res Natl Bur Stand - A 1961, 65, 297.
[15] Hoffman, J. D., Frolen, L.J. Ross, G.S., Lauritzen, J. I. Journal of Research of the
National Bureau of Standards Sectiona-Physics and Chemistry 1975,79(6),671-699.
[16] K. Kaji, K. Nishida, T. Kanaya, G. Matsuba, T. Konishi and M. Imai, Adv Polym Sci
191 (2005), p. 187.
[17] K. Kaji, K. Nishida, T. Kanaya, G. Matsuba, T. Konishi and M. Imai, Adv Polym Sci
191 (2005), p. 187.
[18] G. Reiter and J.U. Sommer, J Chem Phys 112 (2000), p. 4376.
[19] P. Huang, L. Zhu, S.Z.D. Chen, Q. Ge, R.P. Quirk and E. Thomas et al.,
Macromolecules 34 (2001), p. 6649.
[20] Y. Loo, R.A. Register and A.J. Ryan, Phys Rev Lett 84 (2000), p. 4120
[21] Nitta, K.; Asuka, B.; Liu, M.; Terano; Polymer 2006, 47, 6457.
[22] Waddon, A.J, Petrovic, Z.S.: Polymer Journal, 2002, 34, 876.
[23] Douglas, J., Kumar, S.: discussion within the workshop “Late night show on polymer
nanocomposites II, Brno, CR, 2009.
[24] Kalfus, J.; Jancar, J.; J Polym Sci: Part B: Polym Phys 2007, 45, 1380.
[25] Merna, J.: Koordinační polymerace alkenů katalytickými systémy na bázi
přechodových kovů. PhD thesis, FCH VUT Brno, 2005.
[26] Sheet: http://www.tri-iso.com/SiteAdmin/Portals/0/12_238_Irganox%201076.pdf
[27] Dobreva A, Gutzov I, J Non-Cryst Solids 1993; 162:1.
The Crystallization Kinetics in Semicrystalline Nanocomposites 2010
25
[28] Frenkel, D. and Smit, B. Understanding molecular simulations from algorithm to
applications, 2 edn, 2002, Academic press, San Diego.
[29] Paul, W. , Yoon D.Y. ,and Smith, G.D. Journal of Chemical Physics 103 1995, p.
1702.
[30] Yamamoto T., Orimi N., Urakami N., Sawada K., M, Faraday Discuss., 2005, 128, 75-
86.
[31] Waheed, N., Ko, M.J.m Rutledge, G,C., , Polymer 2005, 46,8689-8702.
[32] Hess, et al., J. Chem. Theory Comput. 4: 435-447, 2008.
[33] The images were made with VMD software support. VMD is developed with NIH
support by the Theoretical and Computational Biophysics group at the Beckman Institute,
University of Illinois at Urbana-Champaign.
[34] Kumar SK, NanoLett,2008.
[35] Kumar S, Late Night Show on Nanocomposites II, Brno, presentation,2009
[36] Strobl G., Prog. Polym. Sci, 31, 2006, 398-442.
[37] Zarzycki J, editor. Glasses and amorphous materials. Materials science and
technology, vol 9.
[38] Boyd, R.H, Philips, P.J., , Cambridge University Press.
[39] van Krevelen, D.W., Crystallinity of polymers and the means to influence the
crystallization process. Chimia 1978, 32(8),279-294.
[40] de Gennes, P.G., Cornell University press, Ithaca, 1979, NY.
[41] Ewen B., Richter D., Neutron Spin Echo Investigations on segmental dynamics of
polymers in melts, network and solutions. Vol 134, pp 1-130.2005.
[42] Bueche, F., In reinforcement of elastomers, Interscience: New York, 1965.
[43] Kremer, K. and Grest, G.S., , J. Chem. Phys. 1990, 92(8),5057-5086.
ACKNOWLEDGEMENTS
This work has been supported by Czech ministry of Education, Sports and Youth
project MSM 0021630501 and Czech Grant Agency project P205/10/2259.
Author would love to thank for help, support and motivation, when needed, for a
useful discussions and hints, personal example in both science and life. Meeting some of them
has changed my life in a significant way.
If I may name a few of many my acknowledgements go for, they would definitely be
Josef Jancar, Jaroslav Kučera, Lukáš Recman, Jirka Sadílek and Martin Moos.