THE COSTS OF RULES OF ORIGIN IN APPAREL: …unctad.org/en/docs/itcdtab40_en.pdfTHE COSTS OF RULES OF...
39
UNITED NATIONS CONFERENCE ON TRADE AND DEVELOPMENT POLICY ISSUES IN INTERNATIONAL TRADE AND COMMODITIES STUDY SERIES No. 39 THE COSTS OF RULES OF ORIGIN IN APPAREL: African preferential exports to the United States and the European Union by Alberto Portugal-Perez University of Geneva Switzerland UNITED NATIONS New York and Geneva, 2008
Transcript of THE COSTS OF RULES OF ORIGIN IN APPAREL: …unctad.org/en/docs/itcdtab40_en.pdfTHE COSTS OF RULES OF...
UNITED NATIONS CONFERENCE ON TRADE AND DEVELOPMENT
POLICY ISSUES IN INTERNATIONAL TRADE AND COMMODITIES
STUDY SERIES No. 39
THE COSTS OF RULES OF ORIGIN IN APPAREL:
African preferential exports to the United States
and the European Union
by
Alberto Portugal-Perez University of Geneva
Switzerland
UNITED NATIONS
New York and Geneva, 2008
ii
NOTE
The purpose of this series of studies is to analyse policy issues and to stimulate discussions in the area of international trade and development. The series includes studies by UNCTAD staff, as well as by distinguished researchers from academia. In keeping with the objective of the series, authors are encouraged to express their own views, which do not necessarily reflect the views of the United Nations.
The designations employed and the presentation of the material do not imply the expression of any opinion whatsoever on the part of the United Nations Secretariat concerning the legal status of any country, territory, city or area, or of its authorities, or concerning the delimitation of its frontiers or boundaries.
Material in this publication may be freely quoted or reprinted, but acknowledgement is requested, together with a reference to the document number. It would be appreciated if a copy of the publication containing the quotation or reprint were sent to the UNCTAD secretariat at the following address:
ChiefTrade Analysis Branch
Division on International Trade in Goods and Services, and Commodities United Nations Conference on Trade and Development
Palais des Nations CH-1211 Geneva
Switzerland
Series editor: Victor Ognivtsev
Officer-in-charge, Trade Analysis Branch
UNCTAD/ITCD/TAB/40
UNITED NATIONS PUBLICATION
ISSN 1607-8291
© Copyright United Nations 2008 All rights reserved
iii
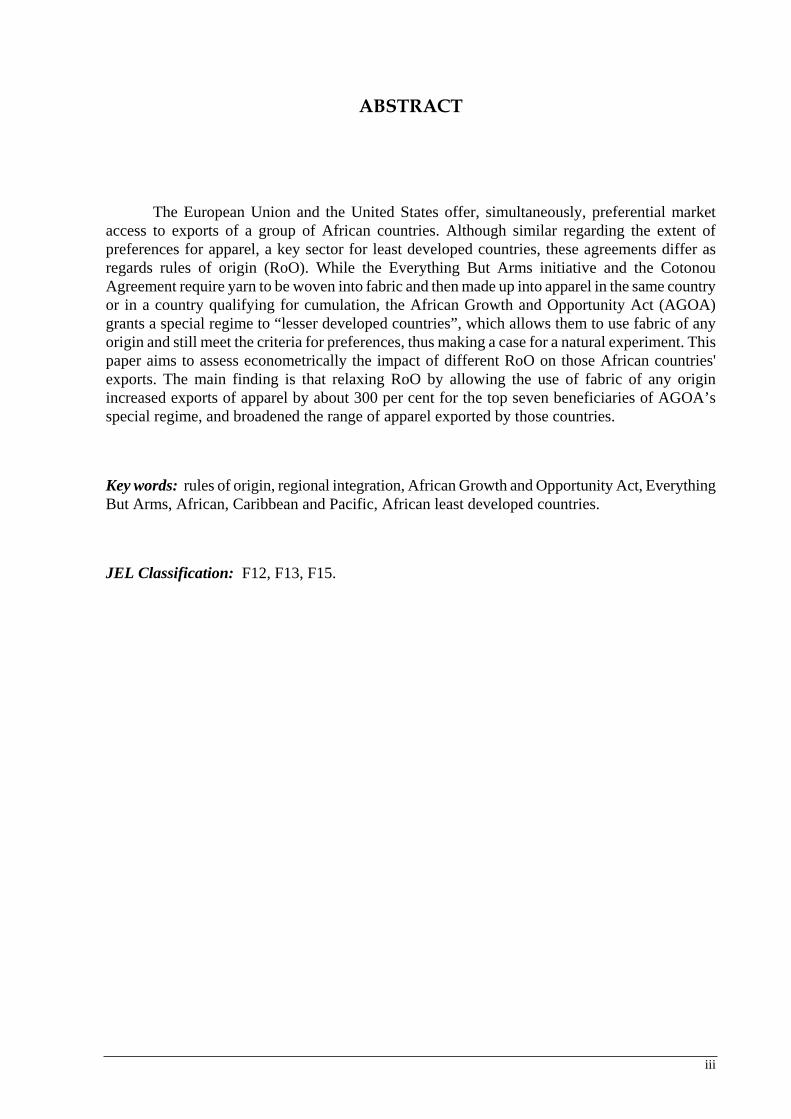
ABSTRACT
The European Union and the United States offer, simultaneously, preferential market access to exports of a group of African countries. Although similar regarding the extent of preferences for apparel, a key sector for least developed countries, these agreements differ as regards rules of origin (RoO). While the Everything But Arms initiative and the Cotonou Agreement require yarn to be woven into fabric and then made up into apparel in the same country or in a country qualifying for cumulation, the African Growth and Opportunity Act (AGOA) grants a special regime to “lesser developed countries”, which allows them to use fabric of any origin and still meet the criteria for preferences, thus making a case for a natural experiment. This paper aims to assess econometrically the impact of different RoO on those African countries' exports. The main finding is that relaxing RoO by allowing the use of fabric of any origin increased exports of apparel by about 300 per cent for the top seven beneficiaries of AGOA’s special regime, and broadened the range of apparel exported by those countries.
Key words: rules of origin, regional integration, African Growth and Opportunity Act, Everything But Arms, African, Caribbean and Pacific, African least developed countries.
JEL Classification: F12, F13, F15.
iv
ACKNOWLEDGEMENTS
I would like to thank Jaime de Melo for guidance, as well as Olivier Cadot, Céline Carrère, Marco Fugazza, Jaya Krishnakumar, Nicolas Schmitt, and participants in the Economic Seminar held at the World Trade Organization and the Seminar for Lemanic Young Researchers in Economics at the University of Geneva, for helpful comments on earlier versions of this paper.
v
CONTENTS
1. Introduction ............................................................................................................. 1
2. RoO, and EU and US preferential market access for African apparel .............. 2
2.1 EU preferential agreements and apparel .......................................................... 2
GSP and EBA ......................................................................................... 2
Cotonou Agreement................................................................................ 3
2.2 US preferences for apparel: AGOA ................................................................. 3
2.3 A natural experiment........................................................................................ 4
3. Model ........................................................................................................................ 8
4. Econometric evidence............................................................................................ 11
4.1 Data ................................................................................................................ 12
4.2 Results ............................................................................................................ 13
5. Conclusions ............................................................................................................ 21
References and bibliography............................................................................................ 22
Appendix 1 Derivation of expression (1.5)................................................................... 23
Appendix 2 Additional figures...................................................................................... 25
Appendix 3 Overview of rules of origin for T&A under some FTAs........................... 27
vi
List of Figures
Figure 2.1 US and EU MFN average tariffs ......................................................................5 Figure 2.2 Apparel exports of 22 countries benefiting from the AGOA SR, as at 2004.................................................................................6 Figure 2.3 US apparel imports from top seven exporters ..................................................7 Figure 3.1 The effects of: a) higher value content requirement; b) positive revenue shock; c) higher preferential margins; d) erosion of preferences due to a reduction of the MFN tariff...............................................................10 Figure 5.1 Variety of apparel exported by the six largest exporters to the United States.........................................................................................16
Figure A2.1 EU and US imports of knitted (HS-61) and non-knitted (HS-62) apparel ...........................................................................25 Figure A2.2 Map of AGOA, ACP and EBA in 2004..........................................................26
List of Tables
Table 2.1 Countries benefiting from the AGOA SR in 2004 ...........................................5 Table 4.1 Descriptive statistics .......................................................................................13 Table 4.2 Average effect of RoO....................................................................................14 Table 4.3 Estimation results: Temporal effects of RoO .................................................18 Table 4.4 Estimation results: RoO effects by exporters .................................................20
1
1. Introduction
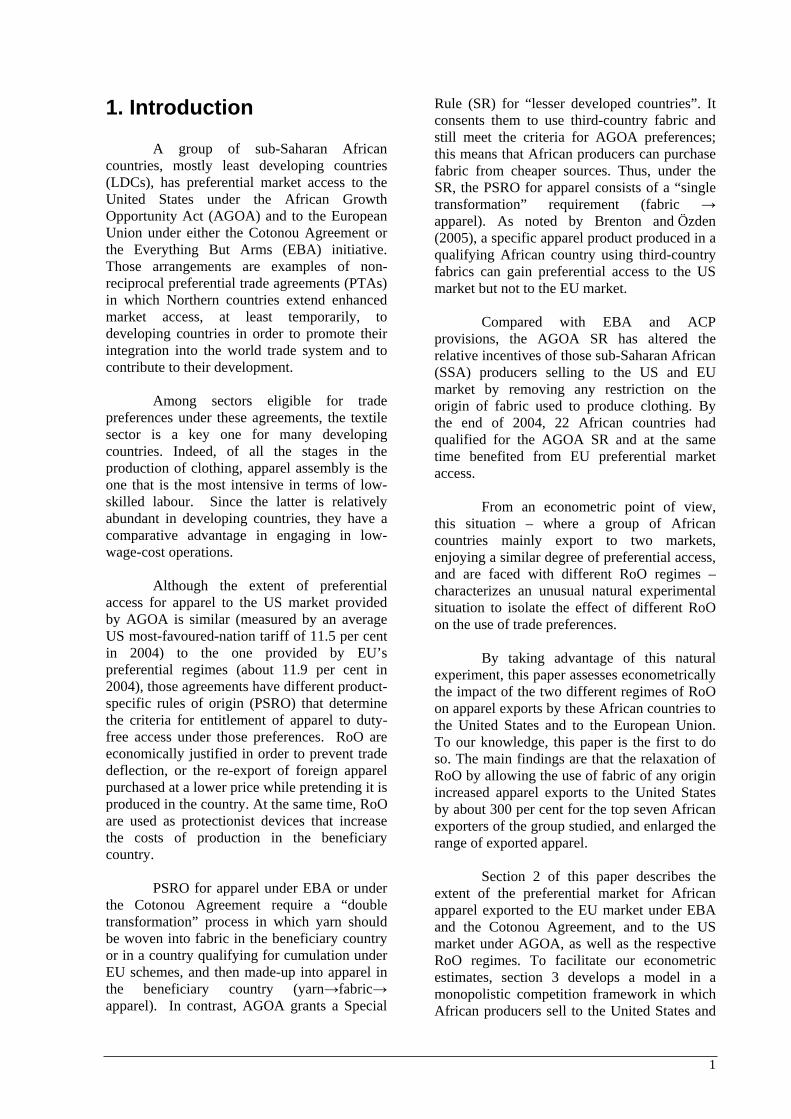
A group of sub-Saharan African countries, mostly least developing countries (LDCs), has preferential market access to the United States under the African Growth Opportunity Act (AGOA) and to the European Union under either the Cotonou Agreement or the Everything But Arms (EBA) initiative. Those arrangements are examples of non-reciprocal preferential trade agreements (PTAs) in which Northern countries extend enhanced market access, at least temporarily, to developing countries in order to promote their integration into the world trade system and to contribute to their development.
Among sectors eligible for trade preferences under these agreements, the textile sector is a key one for many developing countries. Indeed, of all the stages in the production of clothing, apparel assembly is the one that is the most intensive in terms of low-skilled labour. Since the latter is relatively abundant in developing countries, they have a comparative advantage in engaging in low-wage-cost operations.
Although the extent of preferential access for apparel to the US market provided by AGOA is similar (measured by an average US most-favoured-nation tariff of 11.5 per cent in 2004) to the one provided by EU’s preferential regimes (about 11.9 per cent in 2004), those agreements have different product-specific rules of origin (PSRO) that determine the criteria for entitlement of apparel to duty-free access under those preferences. RoO are economically justified in order to prevent trade deflection, or the re-export of foreign apparel purchased at a lower price while pretending it is produced in the country. At the same time, RoO are used as protectionist devices that increase the costs of production in the beneficiary country.
PSRO for apparel under EBA or under the Cotonou Agreement require a “double transformation” process in which yarn should be woven into fabric in the beneficiary country or in a country qualifying for cumulation under EU schemes, and then made-up into apparel in the beneficiary country (yarn fabricapparel). In contrast, AGOA grants a Special
Rule (SR) for “lesser developed countries”. It consents them to use third-country fabric and still meet the criteria for AGOA preferences; this means that African producers can purchase fabric from cheaper sources. Thus, under the SR, the PSRO for apparel consists of a “single transformation” requirement (fabric apparel). As noted by Brenton and Özden (2005), a specific apparel product produced in a qualifying African country using third-country fabrics can gain preferential access to the US market but not to the EU market.
Compared with EBA and ACP provisions, the AGOA SR has altered the relative incentives of those sub-Saharan African (SSA) producers selling to the US and EU market by removing any restriction on the origin of fabric used to produce clothing. By the end of 2004, 22 African countries had qualified for the AGOA SR and at the same time benefited from EU preferential market access.
From an econometric point of view, this situation – where a group of African countries mainly export to two markets, enjoying a similar degree of preferential access, and are faced with different RoO regimes – characterizes an unusual natural experimental situation to isolate the effect of different RoO on the use of trade preferences.
By taking advantage of this natural experiment, this paper assesses econometrically the impact of the two different regimes of RoO on apparel exports by these African countries to the United States and to the European Union. To our knowledge, this paper is the first to do so. The main findings are that the relaxation of RoO by allowing the use of fabric of any origin increased apparel exports to the United States by about 300 per cent for the top seven African exporters of the group studied, and enlarged the range of exported apparel.
Section 2 of this paper describes the extent of the preferential market for African apparel exported to the EU market under EBA and the Cotonou Agreement, and to the US market under AGOA, as well as the respective RoO regimes. To facilitate our econometric estimates, section 3 develops a model in a monopolistic competition framework in which African producers sell to the United States and
2
to the European Union and abide by RoO when selling to the latter, thus causing a rise in production costs. Section 4 provides a brief description of the empirical methodology used, the data and the results. Section 5 sets out conclusions.
2. RoO, and EU and US preferential market access for African apparel
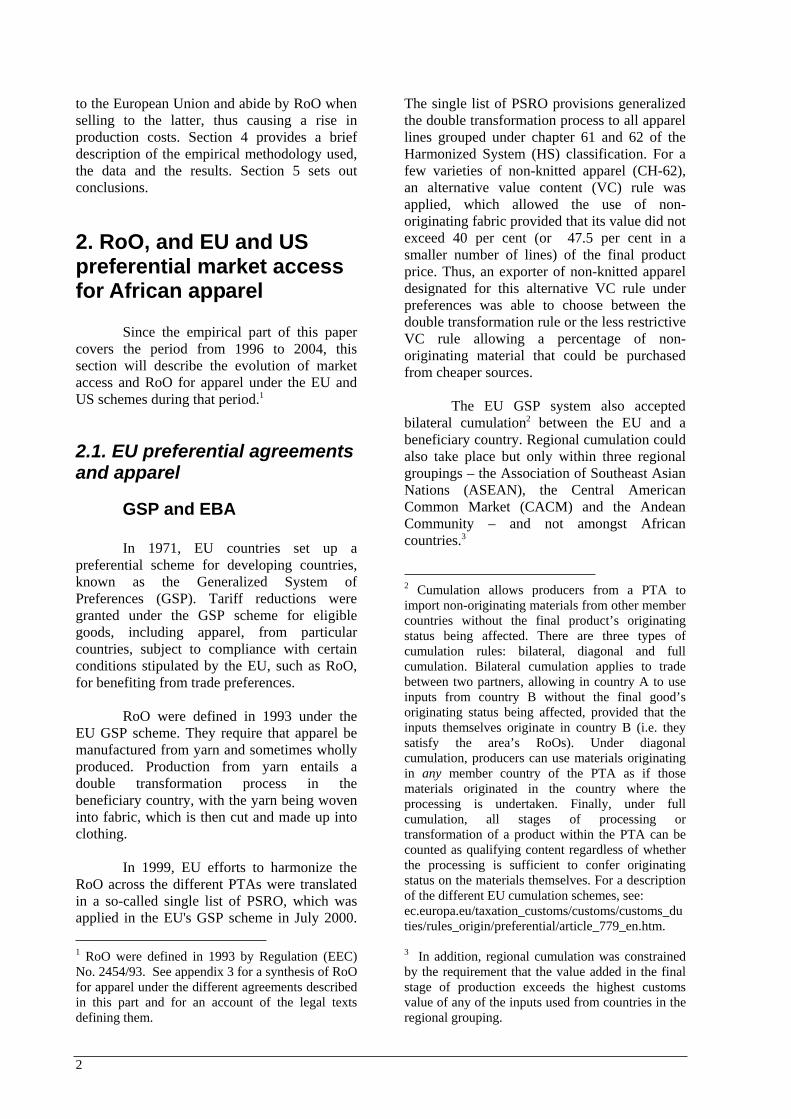
Since the empirical part of this paper covers the period from 1996 to 2004, this section will describe the evolution of market access and RoO for apparel under the EU and US schemes during that period.1
2.1. EU preferential agreements and apparel
GSP and EBA
In 1971, EU countries set up a preferential scheme for developing countries, known as the Generalized System of Preferences (GSP). Tariff reductions were granted under the GSP scheme for eligible goods, including apparel, from particular countries, subject to compliance with certain conditions stipulated by the EU, such as RoO, for benefiting from trade preferences.
RoO were defined in 1993 under the EU GSP scheme. They require that apparel be manufactured from yarn and sometimes wholly produced. Production from yarn entails a double transformation process in the beneficiary country, with the yarn being woven into fabric, which is then cut and made up into clothing.
In 1999, EU efforts to harmonize the RoO across the different PTAs were translated in a so-called single list of PSRO, which was applied in the EU's GSP scheme in July 2000.
1 RoO were defined in 1993 by Regulation (EEC) No. 2454/93. See appendix 3 for a synthesis of RoO for apparel under the different agreements described in this part and for an account of the legal texts defining them.
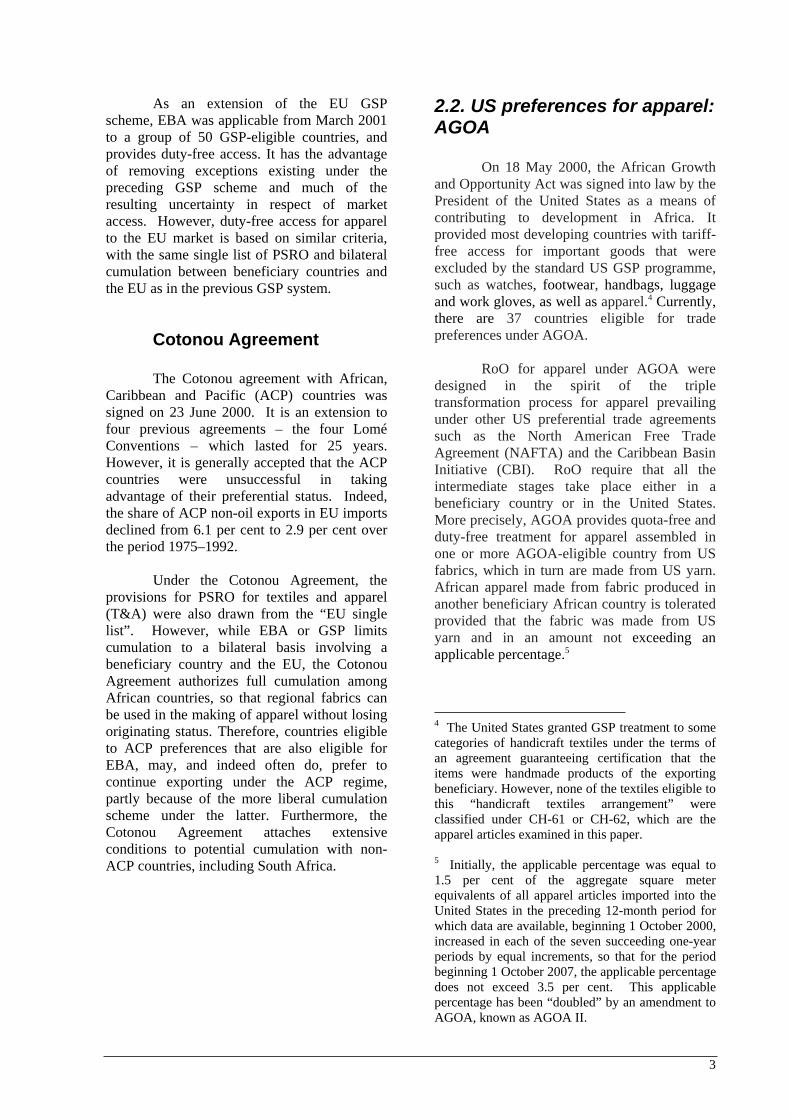
The single list of PSRO provisions generalized the double transformation process to all apparel lines grouped under chapter 61 and 62 of the Harmonized System (HS) classification. For a few varieties of non-knitted apparel (CH-62), an alternative value content (VC) rule was applied, which allowed the use of non-originating fabric provided that its value did not exceed 40 per cent (or 47.5 per cent in a smaller number of lines) of the final product price. Thus, an exporter of non-knitted apparel designated for this alternative VC rule under preferences was able to choose between the double transformation rule or the less restrictive VC rule allowing a percentage of non-originating material that could be purchased from cheaper sources.
The EU GSP system also accepted bilateral cumulation2 between the EU and a beneficiary country. Regional cumulation could also take place but only within three regional groupings – the Association of Southeast Asian Nations (ASEAN), the Central American Common Market (CACM) and the Andean Community – and not amongst African countries.3
2 Cumulation allows producers from a PTA to import non-originating materials from other member countries without the final product’s originating status being affected. There are three types of cumulation rules: bilateral, diagonal and full cumulation. Bilateral cumulation applies to trade between two partners, allowing in country A to use inputs from country B without the final good’s originating status being affected, provided that the inputs themselves originate in country B (i.e. they satisfy the area’s RoOs). Under diagonal cumulation, producers can use materials originating in any member country of the PTA as if those materials originated in the country where the processing is undertaken. Finally, under full cumulation, all stages of processing or transformation of a product within the PTA can be counted as qualifying content regardless of whether the processing is sufficient to confer originating status on the materials themselves. For a description of the different EU cumulation schemes, see: ec.europa.eu/taxation_customs/customs/customs_duties/rules_origin/preferential/article_779_en.htm.
3 In addition, regional cumulation was constrained by the requirement that the value added in the final stage of production exceeds the highest customs value of any of the inputs used from countries in the regional grouping.
3
As an extension of the EU GSP scheme, EBA was applicable from March 2001 to a group of 50 GSP-eligible countries, and provides duty-free access. It has the advantage of removing exceptions existing under the preceding GSP scheme and much of the resulting uncertainty in respect of market access. However, duty-free access for apparel to the EU market is based on similar criteria, with the same single list of PSRO and bilateral cumulation between beneficiary countries and the EU as in the previous GSP system.
Cotonou Agreement
The Cotonou agreement with African, Caribbean and Pacific (ACP) countries was signed on 23 June 2000. It is an extension to four previous agreements – the four Lomé Conventions – which lasted for 25 years. However, it is generally accepted that the ACP countries were unsuccessful in taking advantage of their preferential status. Indeed, the share of ACP non-oil exports in EU imports declined from 6.1 per cent to 2.9 per cent over the period 1975–1992.
Under the Cotonou Agreement, the provisions for PSRO for textiles and apparel (T&A) were also drawn from the “EU single list”. However, while EBA or GSP limits cumulation to a bilateral basis involving a beneficiary country and the EU, the Cotonou Agreement authorizes full cumulation among African countries, so that regional fabrics can be used in the making of apparel without losing originating status. Therefore, countries eligible to ACP preferences that are also eligible for EBA, may, and indeed often do, prefer to continue exporting under the ACP regime, partly because of the more liberal cumulation scheme under the latter. Furthermore, the Cotonou Agreement attaches extensive conditions to potential cumulation with non-ACP countries, including South Africa.
2.2. US preferences for apparel: AGOA
On 18 May 2000, the African Growth and Opportunity Act was signed into law by the President of the United States as a means of contributing to development in Africa. It provided most developing countries with tariff-free access for important goods that were excluded by the standard US GSP programme, such as watches, footwear, handbags, luggage and work gloves, as well as apparel.4 Currently, there are 37 countries eligible for trade preferences under AGOA.
RoO for apparel under AGOA were designed in the spirit of the triple transformation process for apparel prevailing under other US preferential trade agreements such as the North American Free Trade Agreement (NAFTA) and the Caribbean Basin Initiative (CBI). RoO require that all the intermediate stages take place either in a beneficiary country or in the United States. More precisely, AGOA provides quota-free and duty-free treatment for apparel assembled in one or more AGOA-eligible country from US fabrics, which in turn are made from US yarn. African apparel made from fabric produced in another beneficiary African country is tolerated provided that the fabric was made from US yarn and in an amount not exceeding an applicable percentage.5
4 The United States granted GSP treatment to some categories of handicraft textiles under the terms of an agreement guaranteeing certification that the items were handmade products of the exporting beneficiary. However, none of the textiles eligible to this “handicraft textiles arrangement” were classified under CH-61 or CH-62, which are the apparel articles examined in this paper.
5 Initially, the applicable percentage was equal to 1.5 per cent of the aggregate square meter equivalents of all apparel articles imported into the United States in the preceding 12-month period for which data are available, beginning 1 October 2000, increased in each of the seven succeeding one-year periods by equal increments, so that for the period beginning 1 October 2007, the applicable percentage does not exceed 3.5 per cent. This applicable percentage has been “doubled” by an amendment to AGOA, known as AGOA II.
4
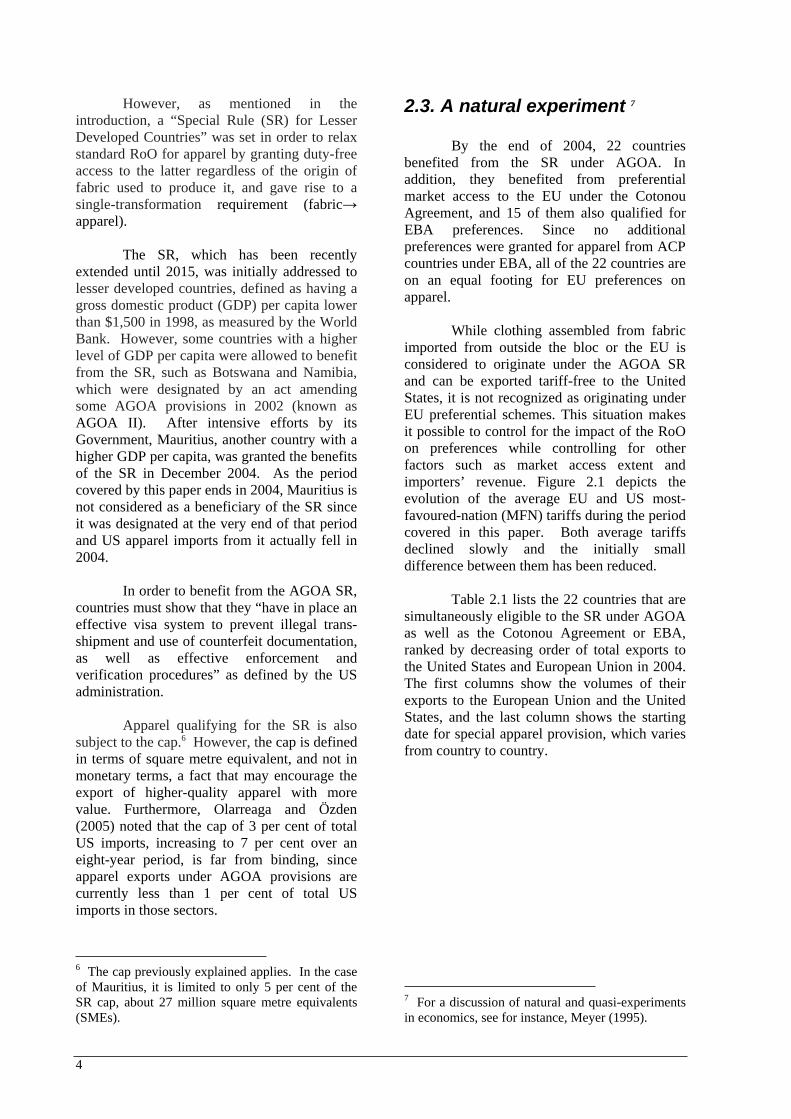
However, as mentioned in the introduction, a “Special Rule (SR) for Lesser Developed Countries” was set in order to relax standard RoO for apparel by granting duty-free access to the latter regardless of the origin of fabric used to produce it, and gave rise to a single-transformation requirement (fabricapparel).
The SR, which has been recently extended until 2015, was initially addressed to lesser developed countries, defined as having a gross domestic product (GDP) per capita lower than $1,500 in 1998, as measured by the World Bank. However, some countries with a higher level of GDP per capita were allowed to benefit from the SR, such as Botswana and Namibia, which were designated by an act amending some AGOA provisions in 2002 (known as AGOA II). After intensive efforts by its Government, Mauritius, another country with a higher GDP per capita, was granted the benefits of the SR in December 2004. As the period covered by this paper ends in 2004, Mauritius is not considered as a beneficiary of the SR since it was designated at the very end of that period and US apparel imports from it actually fell in 2004.
In order to benefit from the AGOA SR, countries must show that they “have in place an effective visa system to prevent illegal trans-shipment and use of counterfeit documentation, as well as effective enforcement and verification procedures” as defined by the US administration.
Apparel qualifying for the SR is also subject to the cap.6 However, the cap is defined in terms of square metre equivalent, and not in monetary terms, a fact that may encourage the export of higher-quality apparel with more value. Furthermore, Olarreaga and Özden (2005) noted that the cap of 3 per cent of total US imports, increasing to 7 per cent over an eight-year period, is far from binding, since apparel exports under AGOA provisions are currently less than 1 per cent of total US imports in those sectors.
6 The cap previously explained applies. In the case of Mauritius, it is limited to only 5 per cent of the SR cap, about 27 million square metre equivalents (SMEs).
2.3. A natural experiment 7
By the end of 2004, 22 countries benefited from the SR under AGOA. In addition, they benefited from preferential market access to the EU under the Cotonou Agreement, and 15 of them also qualified for EBA preferences. Since no additional preferences were granted for apparel from ACP countries under EBA, all of the 22 countries are on an equal footing for EU preferences on apparel.
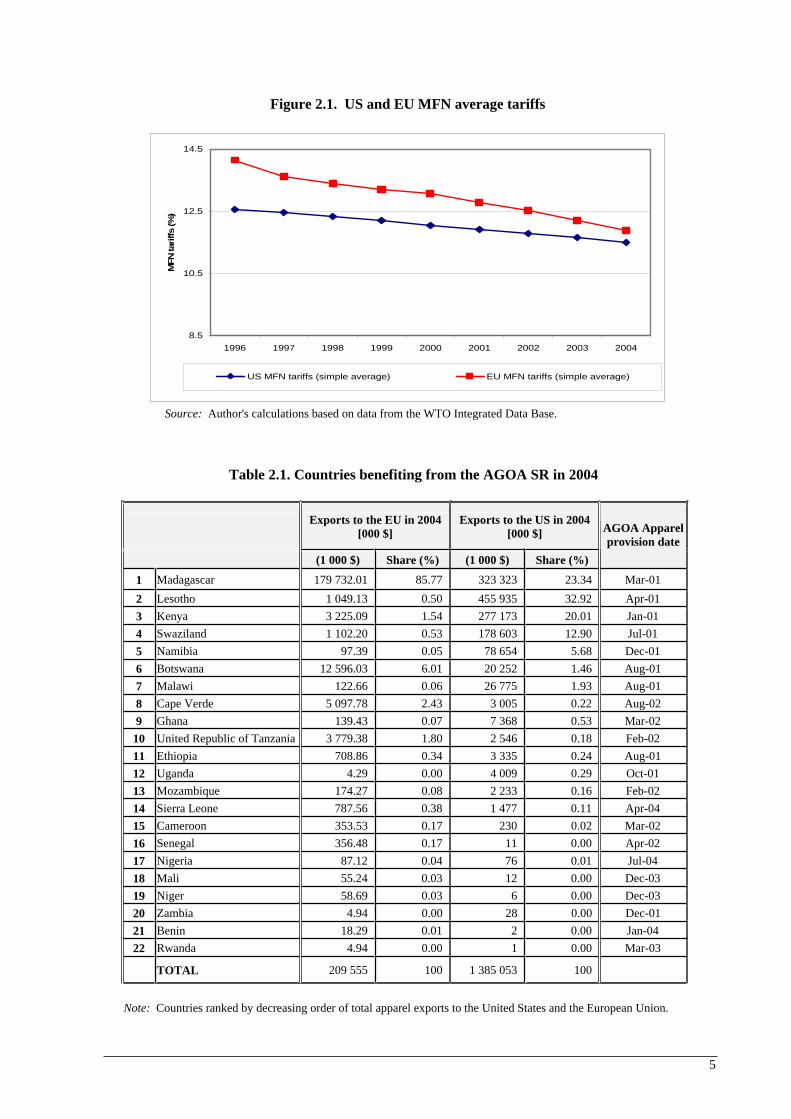
While clothing assembled from fabric imported from outside the bloc or the EU is considered to originate under the AGOA SR and can be exported tariff-free to the United States, it is not recognized as originating under EU preferential schemes. This situation makes it possible to control for the impact of the RoO on preferences while controlling for other factors such as market access extent and importers’ revenue. Figure 2.1 depicts the evolution of the average EU and US most-favoured-nation (MFN) tariffs during the period covered in this paper. Both average tariffs declined slowly and the initially small difference between them has been reduced.
Table 2.1 lists the 22 countries that are simultaneously eligible to the SR under AGOA as well as the Cotonou Agreement or EBA, ranked by decreasing order of total exports to the United States and European Union in 2004. The first columns show the volumes of their exports to the European Union and the United States, and the last column shows the starting date for special apparel provision, which varies from country to country.
7 For a discussion of natural and quasi-experiments in economics, see for instance, Meyer (1995).
5
Figure 2.1. US and EU MFN average tariffs
8.5
10.5
12.5
14.5
1996 1997 1998 1999 2000 2001 2002 2003 2004
MFN
tariffs (%
)
US MFN tariffs (simple average) EU MFN tariffs (simple average)
Source: Author's calculations based on data from the WTO Integrated Data Base.
Table 2.1. Countries benefiting from the AGOA SR in 2004
Exports to the EU in 2004
[000 $]
Exports to the US in 2004
[000 $]
(1 000 $) Share (%) (1 000 $) Share (%)
AGOA Apparel
provision date
1 Madagascar 179 732.01 85.77 323 323 23.34 Mar-01
2 Lesotho 1 049.13 0.50 455 935 32.92 Apr-01
3 Kenya 3 225.09 1.54 277 173 20.01 Jan-01
4 Swaziland 1 102.20 0.53 178 603 12.90 Jul-01
5 Namibia 97.39 0.05 78 654 5.68 Dec-01
6 Botswana 12 596.03 6.01 20 252 1.46 Aug-01
7 Malawi 122.66 0.06 26 775 1.93 Aug-01
8 Cape Verde 5 097.78 2.43 3 005 0.22 Aug-02
9 Ghana 139.43 0.07 7 368 0.53 Mar-02
10 United Republic of Tanzania 3 779.38 1.80 2 546 0.18 Feb-02
11 Ethiopia 708.86 0.34 3 335 0.24 Aug-01
12 Uganda 4.29 0.00 4 009 0.29 Oct-01
13 Mozambique 174.27 0.08 2 233 0.16 Feb-02
14 Sierra Leone 787.56 0.38 1 477 0.11 Apr-04
15 Cameroon 353.53 0.17 230 0.02 Mar-02
16 Senegal 356.48 0.17 11 0.00 Apr-02
17 Nigeria 87.12 0.04 76 0.01 Jul-04
18 Mali 55.24 0.03 12 0.00 Dec-03
19 Niger 58.69 0.03 6 0.00 Dec-03
20 Zambia 4.94 0.00 28 0.00 Dec-01
21 Benin 18.29 0.01 2 0.00 Jan-04
22 Rwanda 4.94 0.00 1 0.00 Mar-03
TOTAL 209 555 100 1 385 053 100
Note: Countries ranked by decreasing order of total apparel exports to the United States and the European Union.
6
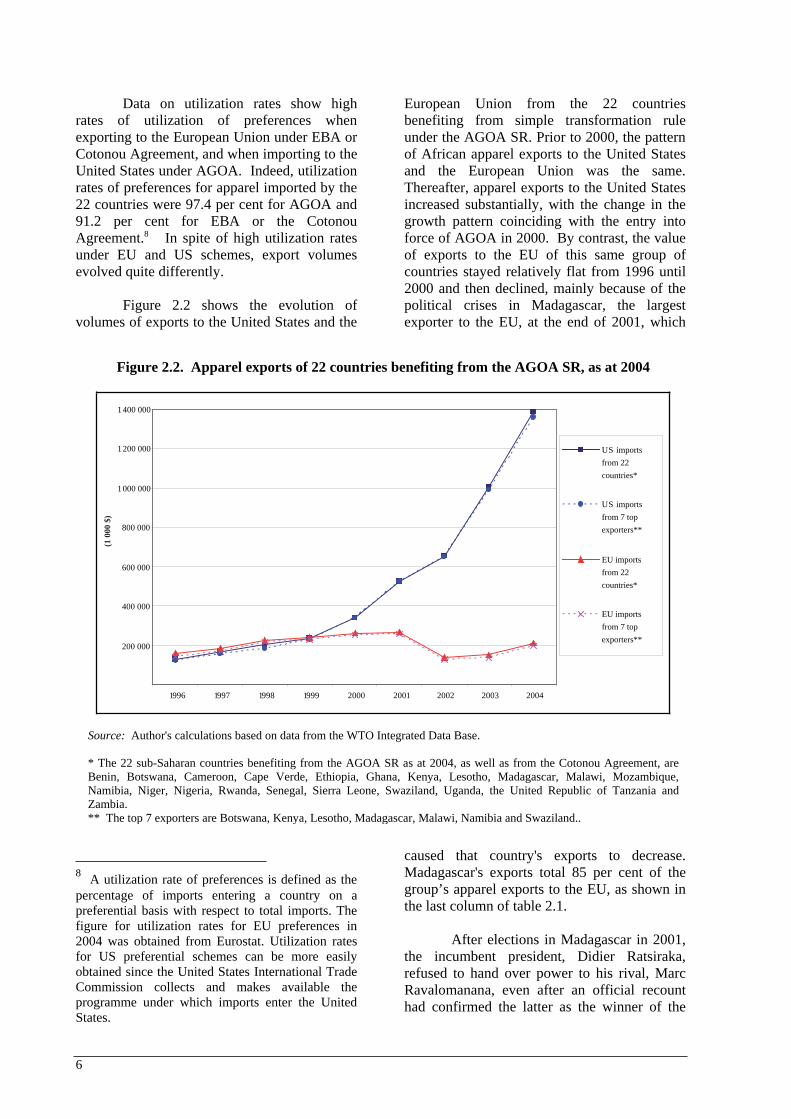
Data on utilization rates show high rates of utilization of preferences when exporting to the European Union under EBA or Cotonou Agreement, and when importing to the United States under AGOA. Indeed, utilization rates of preferences for apparel imported by the 22 countries were 97.4 per cent for AGOA and 91.2 per cent for EBA or the Cotonou Agreement.8 In spite of high utilization rates under EU and US schemes, export volumes evolved quite differently.
Figure 2.2 shows the evolution of volumes of exports to the United States and the
8 A utilization rate of preferences is defined as the
percentage of imports entering a country on a preferential basis with respect to total imports. The figure for utilization rates for EU preferences in 2004 was obtained from Eurostat. Utilization rates for US preferential schemes can be more easily obtained since the United States International Trade Commission collects and makes available the programme under which imports enter the United States.
European Union from the 22 countries benefiting from simple transformation rule under the AGOA SR. Prior to 2000, the pattern of African apparel exports to the United States and the European Union was the same. Thereafter, apparel exports to the United States increased substantially, with the change in the growth pattern coinciding with the entry into force of AGOA in 2000. By contrast, the value of exports to the EU of this same group of countries stayed relatively flat from 1996 until 2000 and then declined, mainly because of the political crises in Madagascar, the largest exporter to the EU, at the end of 2001, which
caused that country's exports to decrease. Madagascar's exports total 85 per cent of the group’s apparel exports to the EU, as shown in the last column of table 2.1.
After elections in Madagascar in 2001, the incumbent president, Didier Ratsiraka, refused to hand over power to his rival, Marc Ravalomanana, even after an official recount had confirmed the latter as the winner of the
Figure 2.2. Apparel exports of 22 countries benefiting from the AGOA SR, as at 2004
200 000
400 000
600 000
800 000
1 000 000
1 200 000
1 400 000
1996 1997 1998 1999 2000 2001 2002 2003 2004
US imports
from 22
countries*
US imports
from 7 top
exporters**
EU imports
from 22
countries*
EU imports
from 7 top
exporters**
(1 0
00 $
)
Source: Author's calculations based on data from the WTO Integrated Data Base.
* The 22 sub-Saharan countries benefiting from the AGOA SR as at 2004, as well as from the Cotonou Agreement, are Benin, Botswana, Cameroon, Cape Verde, Ethiopia, Ghana, Kenya, Lesotho, Madagascar, Malawi, Mozambique, Namibia, Niger, Nigeria, Rwanda, Senegal, Sierra Leone, Swaziland, Uganda, the United Republic of Tanzania and Zambia. ** The top 7 exporters are Botswana, Kenya, Lesotho, Madagascar, Malawi, Namibia and Swaziland..
7
election. This resulted in a political deadlock that lasted for many months, after violent clashes between rival supporters and a blockade of the capital. The Financial Times reported that “the blockade led to severe petrol shortages and the collapse of the fast-growing textile industry with the loss of about 150,000 jobs. Textile companies warned that orders from European and US clothing retailers had dried up”.9
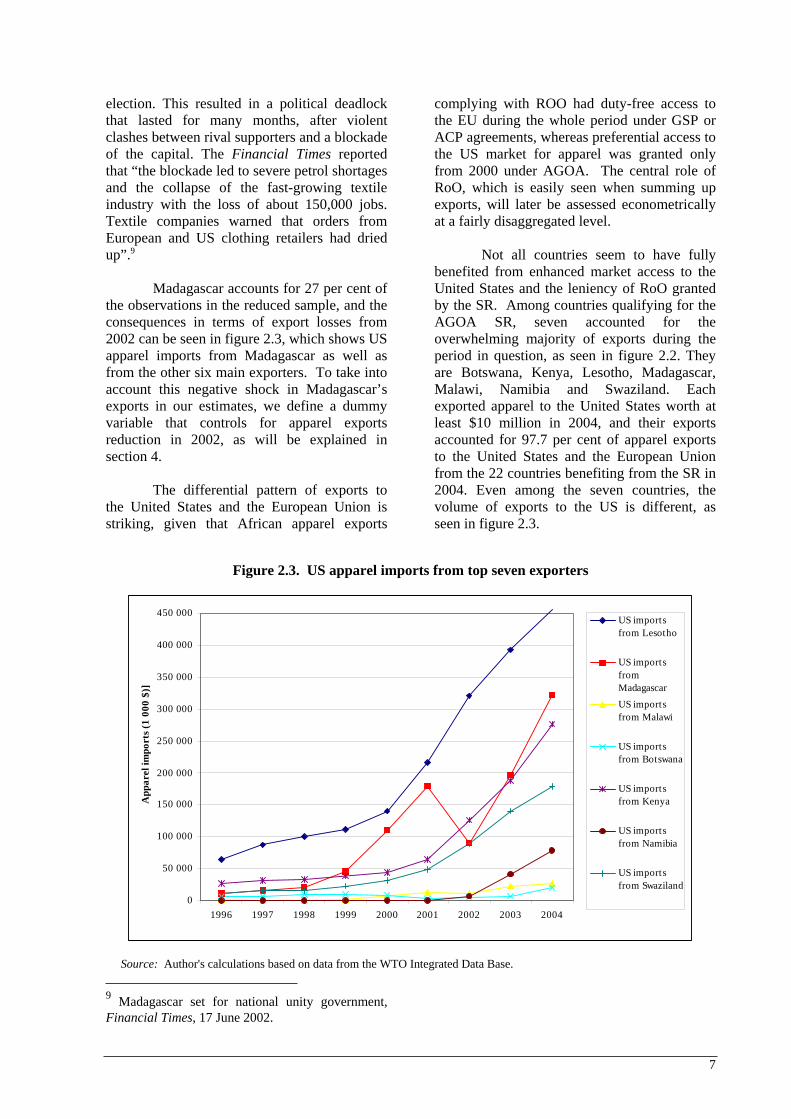
Madagascar accounts for 27 per cent of the observations in the reduced sample, and the consequences in terms of export losses from 2002 can be seen in figure 2.3, which shows US apparel imports from Madagascar as well as from the other six main exporters. To take into account this negative shock in Madagascar’s exports in our estimates, we define a dummy variable that controls for apparel exports reduction in 2002, as will be explained in section 4.
The differential pattern of exports to the United States and the European Union is striking, given that African apparel exports
9 Madagascar set for national unity government,
Financial Times, 17 June 2002.
complying with ROO had duty-free access to the EU during the whole period under GSP or ACP agreements, whereas preferential access to the US market for apparel was granted only from 2000 under AGOA. The central role of RoO, which is easily seen when summing up exports, will later be assessed econometrically at a fairly disaggregated level.
Not all countries seem to have fully benefited from enhanced market access to the United States and the leniency of RoO granted by the SR. Among countries qualifying for the AGOA SR, seven accounted for the overwhelming majority of exports during the period in question, as seen in figure 2.2. They are Botswana, Kenya, Lesotho, Madagascar, Malawi, Namibia and Swaziland. Each exported apparel to the United States worth at least $10 million in 2004, and their exports accounted for 97.7 per cent of apparel exports to the United States and the European Union from the 22 countries benefiting from the SR in 2004. Even among the seven countries, the volume of exports to the US is different, as seen in figure 2.3.
Figure 2.3. US apparel imports from top seven exporters
0
50 000
100 000
150 000
200 000
250 000
300 000
350 000
400 000
450 000
1996 1997 1998 1999 2000 2001 2002 2003 2004
Ap
pa
rel
imp
orts
(1
00
0 $
)]
US importsfrom Lesotho
US importsfromMadagascar
US importsfrom Malawi
US importsfrom Botswana
US importsfrom Kenya
US importsfrom Namibia
US importsfrom Swaziland
Source: Author's calculations based on data from the WTO Integrated Data Base.
8
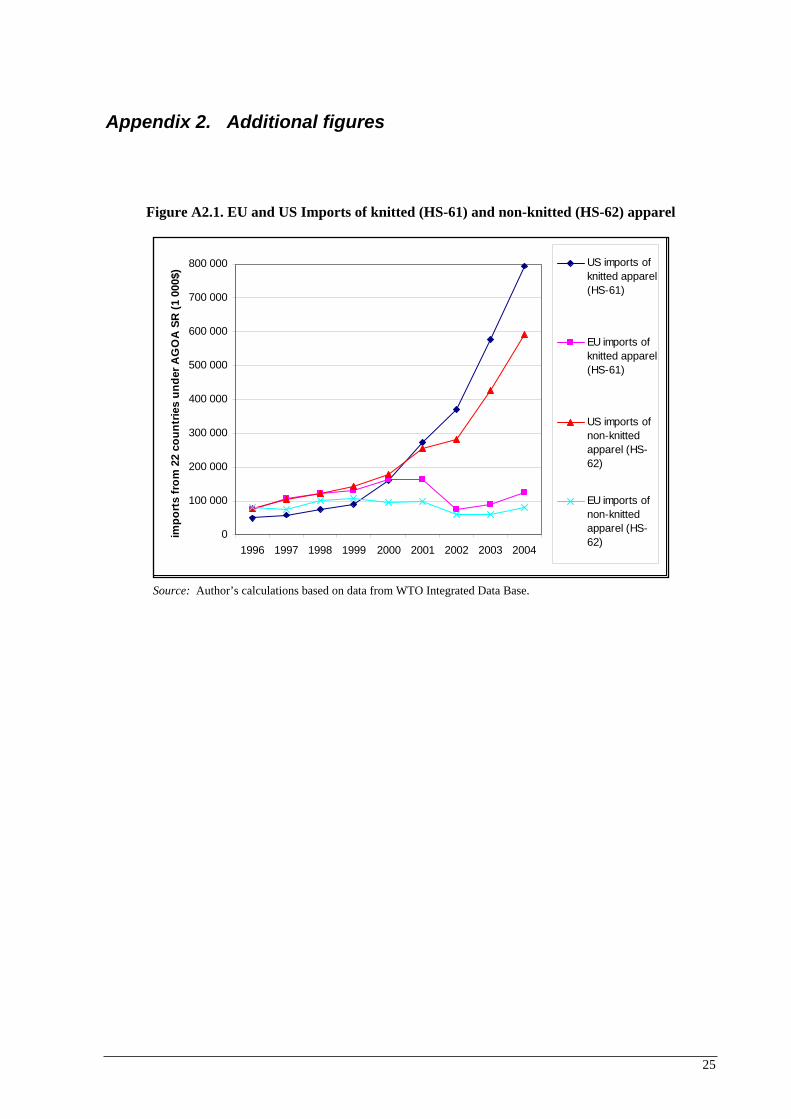
Apparel products are divided into two main categories: knitted (CH-61) and non-knitted (CH-62).10 The EU imports more knitted apparel than non-knitted. This pattern is in line with Brenton and Özden’s (2005) claim that RoO are more costly for non-knitted apparel than for knitted apparel since they imply that fabric has to come from either the EU or from another beneficiary country, as happens with the double transformation rule under EU schemes, whereas for knitted items this rule is less costly to satisfy since there is typically no fabric involved.
After AGOA entered into force, exports of knitted apparel to the United States exceeded exports of non-knitted apparel. A possible explanation is that machines for the former are less expensive than machines for the latter.
3. Model
A simple model will now be sketched out to show the effects of a RoO on costs and to facilitate the econometric estimates.
On the supply side, African apparel ( X ) is assembled by combining value added with intermediate good (fabric or textiles) using Leontief technology with an input–output
coefficient, Va : min ( , ); .V
VX f K L
a
Two types of fabric are distinguished according to their source, with textiles from each source considered a perfect substitute with textiles
from the other source. First, EUV represents fabric produced either domestically or imported from countries qualifying for cumulation under
EU schemes at price EU
Vp . Second, *V
designates inputs imported from the rest of the
world at price *Vp . Let V denote the total
quantity of intermediate used in the production
of apparel, that is *EUV V V , since textiles are assumed to be perfect substitutes.
10 Figure A.2.1 in appendix 2 shows US and EU imports of knitted and non-kintted apparel from the 22 beneficiaries of the AGOA SR.
Let X be the value-added cost
function dual to the value added production
function, f , and ' /X d X dX ,
the corresponding marginal cost function.
Perfect substitutability of intermediates implies that in the absence of an origin requirement, producers will choose the cheapest source, as is the case under the special regime for “lesser developed countries” under AGOA. The marginal cost of apparel exported to the United States is:
' min ,US EU
X V V VMC X a p p (1.1)
To qualify for EU preferences under EBA or the Cotonou Agreement, African exporters have to use fabric qualifying for cumulation at least in proportion r, with binding RoO specifying a minimum value content r(for simplicity expressed here as a proportion of
total intermediate use). When * EU
V Vp p , then EUV V and expression (1.1) also describes
the marginal cost of apparel exported to the EU.
But, when EU
V Vp p , the RoO becomes
binding and the marginal cost of apparel qualifying for preferences under EBA or the Cotonou Agreement is expressed by:
' 1EU EU
X V V VMC X a rp r p
(1.2)
Bearing in mind the small size of African producers, assume that price of textiles
,EU
V Vp p is fixed. Therefore, US
XMC is also
constant and EU
XMC r is an increasing
function of the content requirement r under
EBA and ACP ( / 0EU
XdMC r dr ).
Let kp be the internal price of African
apparel in country k , ,k K EU US .
Then, ,1k k pref kp t q , where ,k preft is the
tariff applied to African apparel by country k,
and kq is the border price (excluding tariff) of
African apparel sold in market k .
9
On the demand side, a representative consumer prizing variety maximizes his utility function. Then, the demand function for
African apparel in country k , k
DX , can be
thought as:
, ,k k k k
D wX p Y P , with / 0k k
DX p ,
/ 0k k
DX Y , and / 0k k
D wX P (1.3)
where kY is the income of country k ; k
wP is a
market price index of apparel substitute to African apparel that is imported under the MFN regime from other countries, such as Asian imports that were also subject to quotas. Then,
* ,1k k MFN
wP P t with *P being the
composite border price of apparel imported on a non-preferential basis and subject to an MFN
tariff ,k MFNt .
Profit-maximizing pricing for sellers of African apparel implies:
,1 .k
k k k pref k
Xk
pp X t MC
X
(1.4)
where kp is the inverse demand function
of country k .
Totally differentiating expression (1.4) leads to:
, ,0, 0, 0
k k k
k k pref k MFN
dX dX dX
dY dt dt,
for ,k K EU US , and 0EUdX
dr (1.5)
which establishes that a binding RoO (such as the double transformation rule) reduces export sales of EBA/ACP beneficiaries (see appendix 1 for the derivation).
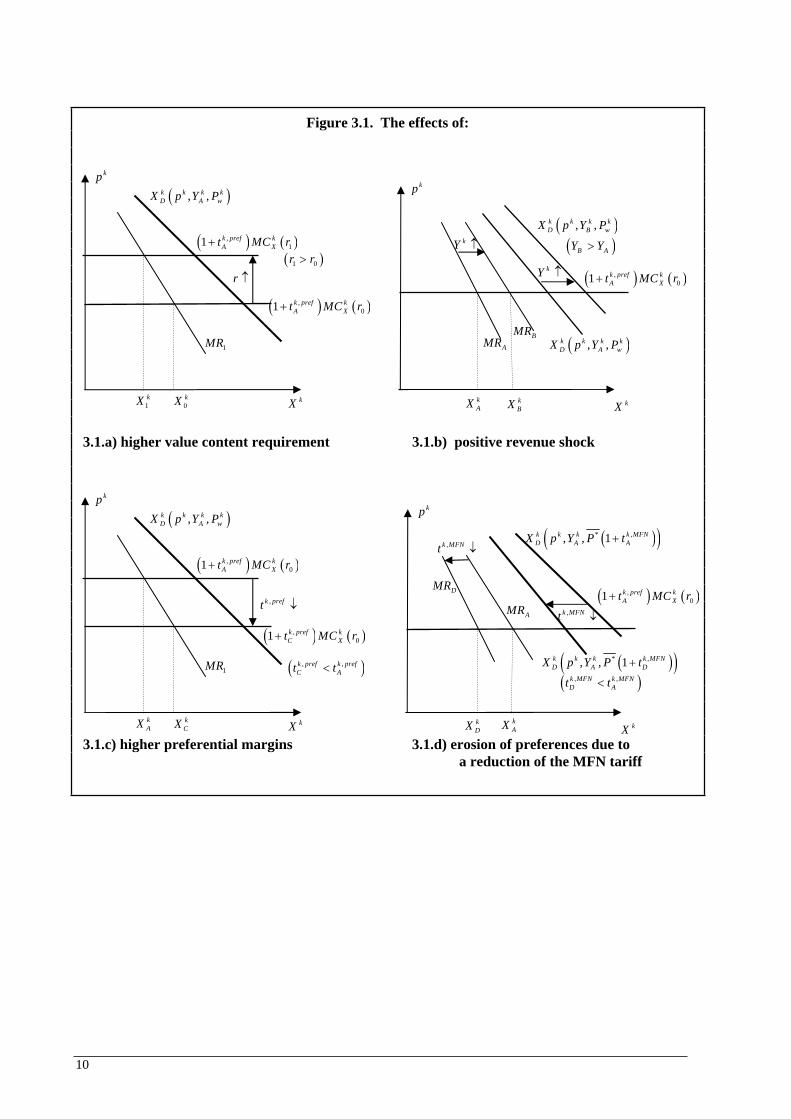
Figure 3.1 illustrates the intuition behind those four results. Figure 3.1.a shows the effect of increasing the value content (VC) requirement, which increases costs and reduces the volume of African imports.
A positive revenue shock boosts demand for African apparel as well as the marginal revenue (MR) of African apparel sellers, and increases apparel imports in country k, as shown in figure 3.1.b. Granting preferential access to African exports can be translated as a reduction of the preferential
tariff, ,k preft , at which African imports
complying with the VC requirement are subject, as illustrated in figure 3.1.c. Lower costs support higher imports of African apparel. Finally, figure 3.1.d illustrates the consequence of preference erosions caused by a reduction of MFN tariffs. Since substitutes to African apparel become cheaper, demand for African apparel shifts back, cutting the MR of apparel sellers and thus causing African imports to shrink.
10
Figure 3.1. The effects of:
3.1.a) higher value content requirement 3.1.b) positive revenue shock
3.1.c) higher preferential margins 3.1.d) erosion of preferences due to
a reduction of the MFN tariff
,01 k pref k
A Xt MC r
,11 k pref k
A Xt MC r
, ,k k k k
D A wX p Y P
1MR
kp
0kX1
kX
1 0r r
kX
r ,01 k pref k
A Xt MC r
, ,k k k k
D A wX p Y PAMR
kp
k
AX k
BX kX
kY
, ,k k k k
D B wX p Y P
BMR
B AY YkY
,01 k pref k
C Xt MC r
,01 k pref k
A Xt MC r
, ,k k k k
D A wX p Y P
1MR
kp
k
CXk
AX
, ,k pref k pref
C At t
kX
,k preft
,01 k pref k
A Xt MC r
* ,, , 1k k k k MFN
D A DX p Y P t
DMR
kp
k
DXk
AX kX
,k MFNt
* ,, , 1k k k k MFN
D A AX p Y P t
AMR
, ,k MFN k MFN
D At t
,k MFNt
11
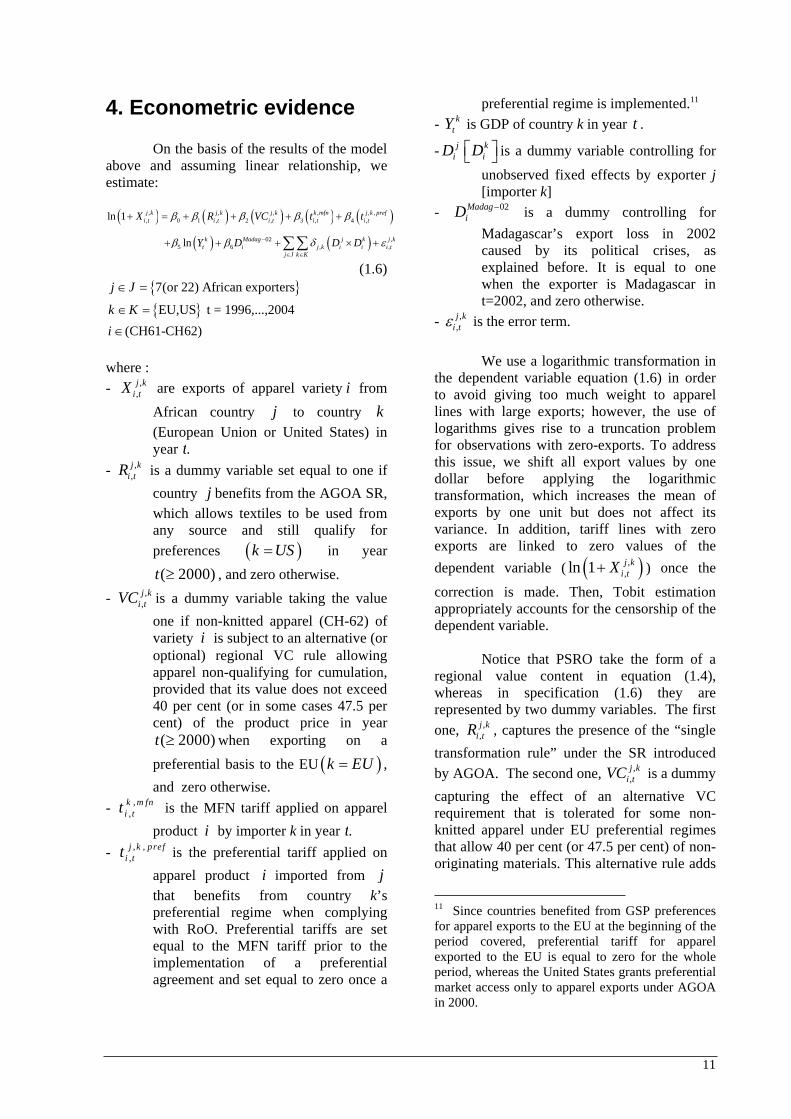
4. Econometric evidence
On the basis of the results of the model above and assuming linear relationship, we estimate:
, , , , , ,, 0 1 , 2 , 3 , 4 ,
02 ,5 6 , ,
ln 1
ln
j k j k j k k mfn j k pref
i t i t i t i t i t
k Madag j k j k
t i j k i i i t
j J k K
X R VC t t
Y D D D
(1.6) 7(or 22) African exportersj J
EU,USk K t = 1996,...,2004
(CH61-CH62)i
where :
- ,,j k
i tX are exports of apparel variety i from
African country j to country k
(European Union or United States) in year t.
- ,,j k
i tR is a dummy variable set equal to one if
country j benefits from the AGOA SR,
which allows textiles to be used from any source and still qualify for
preferences k US in year
( 2000)t , and zero otherwise.
- ,,j k
i tVC is a dummy variable taking the value
one if non-knitted apparel (CH-62) of variety i is subject to an alternative (or optional) regional VC rule allowing apparel non-qualifying for cumulation, provided that its value does not exceed 40 per cent (or in some cases 47.5 per cent) of the product price in year ( 2000)t when exporting on a
preferential basis to the EU k EU ,
and zero otherwise.
- ,,
k m fn
i tt is the MFN tariff applied on apparel
product i by importer k in year t.
- , ,,j k pref
i tt is the preferential tariff applied on
apparel product i imported from j
that benefits from country k’s preferential regime when complying with RoO. Preferential tariffs are set equal to the MFN tariff prior to the implementation of a preferential agreement and set equal to zero once a
preferential regime is implemented.11
- k
tY is GDP of country k in year t .
- j
iD k
iD is a dummy variable controlling for
unobserved fixed effects by exporter j
[importer k]
- 02Madag
iD is a dummy controlling for
Madagascar’s export loss in 2002 caused by its political crises, as explained before. It is equal to one when the exporter is Madagascar in t=2002, and zero otherwise.
- ,,j k
i t is the error term.
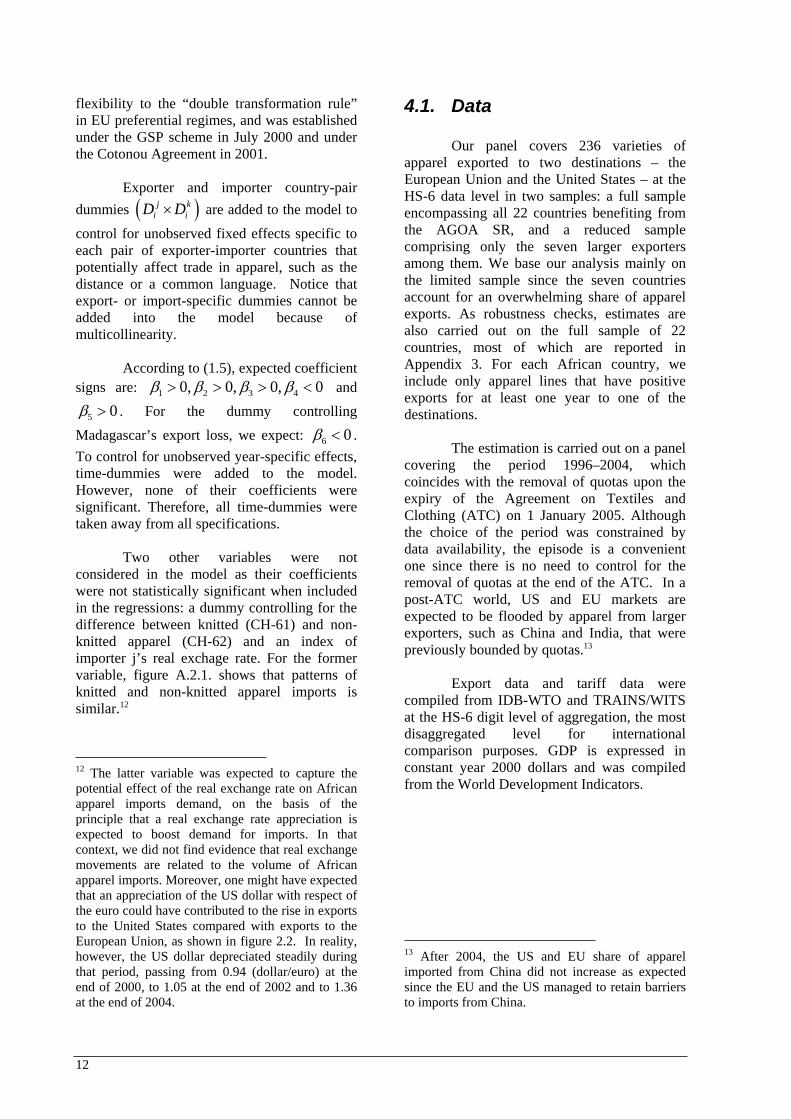
We use a logarithmic transformation in the dependent variable equation (1.6) in order to avoid giving too much weight to apparel lines with large exports; however, the use of logarithms gives rise to a truncation problem for observations with zero-exports. To address this issue, we shift all export values by one dollar before applying the logarithmic transformation, which increases the mean of exports by one unit but does not affect its variance. In addition, tariff lines with zero exports are linked to zero values of the
dependent variable ( ,,ln 1 j k
i tX ) once the
correction is made. Then, Tobit estimation appropriately accounts for the censorship of the dependent variable.
Notice that PSRO take the form of a regional value content in equation (1.4), whereas in specification (1.6) they are represented by two dummy variables. The first
one, ,,j k
i tR , captures the presence of the “single
transformation rule” under the SR introduced
by AGOA. The second one, ,,j k
i tVC is a dummy
capturing the effect of an alternative VC requirement that is tolerated for some non-knitted apparel under EU preferential regimes that allow 40 per cent (or 47.5 per cent) of non-originating materials. This alternative rule adds
11 Since countries benefited from GSP preferences for apparel exports to the EU at the beginning of the period covered, preferential tariff for apparel exported to the EU is equal to zero for the whole period, whereas the United States grants preferential market access only to apparel exports under AGOA in 2000.
12
flexibility to the “double transformation rule” in EU preferential regimes, and was established under the GSP scheme in July 2000 and under the Cotonou Agreement in 2001.
Exporter and importer country-pair
dummies j k
i iD D are added to the model to
control for unobserved fixed effects specific to each pair of exporter-importer countries that potentially affect trade in apparel, such as the distance or a common language. Notice that export- or import-specific dummies cannot be added into the model because of multicollinearity.
According to (1.5), expected coefficient
signs are: 1 2 3 40, 0, 0, 0 and
5 0 . For the dummy controlling
Madagascar’s export loss, we expect: 6 0 .
To control for unobserved year-specific effects, time-dummies were added to the model. However, none of their coefficients were significant. Therefore, all time-dummies were taken away from all specifications.
Two other variables were not considered in the model as their coefficients were not statistically significant when included in the regressions: a dummy controlling for the difference between knitted (CH-61) and non-knitted apparel (CH-62) and an index of importer j’s real exchage rate. For the former variable, figure A.2.1. shows that patterns of knitted and non-knitted apparel imports is similar.12
12 The latter variable was expected to capture the potential effect of the real exchange rate on African apparel imports demand, on the basis of the principle that a real exchange rate appreciation is expected to boost demand for imports. In that context, we did not find evidence that real exchange movements are related to the volume of African apparel imports. Moreover, one might have expected that an appreciation of the US dollar with respect of the euro could have contributed to the rise in exports to the United States compared with exports to the European Union, as shown in figure 2.2. In reality, however, the US dollar depreciated steadily during that period, passing from 0.94 (dollar/euro) at the end of 2000, to 1.05 at the end of 2002 and to 1.36 at the end of 2004.
4.1. Data
Our panel covers 236 varieties of apparel exported to two destinations – the European Union and the United States – at the HS-6 data level in two samples: a full sample encompassing all 22 countries benefiting from the AGOA SR, and a reduced sample comprising only the seven larger exporters among them. We base our analysis mainly on the limited sample since the seven countries account for an overwhelming share of apparel exports. As robustness checks, estimates are also carried out on the full sample of 22 countries, most of which are reported in Appendix 3. For each African country, we include only apparel lines that have positive exports for at least one year to one of the destinations.
The estimation is carried out on a panel covering the period 1996–2004, which coincides with the removal of quotas upon the expiry of the Agreement on Textiles and Clothing (ATC) on 1 January 2005. Although the choice of the period was constrained by data availability, the episode is a convenient one since there is no need to control for the removal of quotas at the end of the ATC. In a post-ATC world, US and EU markets are expected to be flooded by apparel from larger exporters, such as China and India, that were previously bounded by quotas.13
Export data and tariff data were compiled from IDB-WTO and TRAINS/WITS at the HS-6 digit level of aggregation, the most disaggregated level for international comparison purposes. GDP is expressed in constant year 2000 dollars and was compiled from the World Development Indicators.
13 After 2004, the US and EU share of apparel imported from China did not increase as expected since the EU and the US managed to retain barriers to imports from China.
13
The starting date of effective eligibility for the special clothing provision, which varies from beneficiary to beneficiary, was not usually set on 1 January of a given year over the period 2001-2004, as shown previously in table 2.1. Given that trade data are collected on an annual
basis, we set the dummy ,,j k
i tR equal to one for
the first year if country j has benefited from eligibility to benefits of the apparel provision for more than four months.14 For instance, Botswana and Malawi were eligible from August 2001, then the dummy is set equal to one for t=2001 and evidently for successive years (t 2002 ).
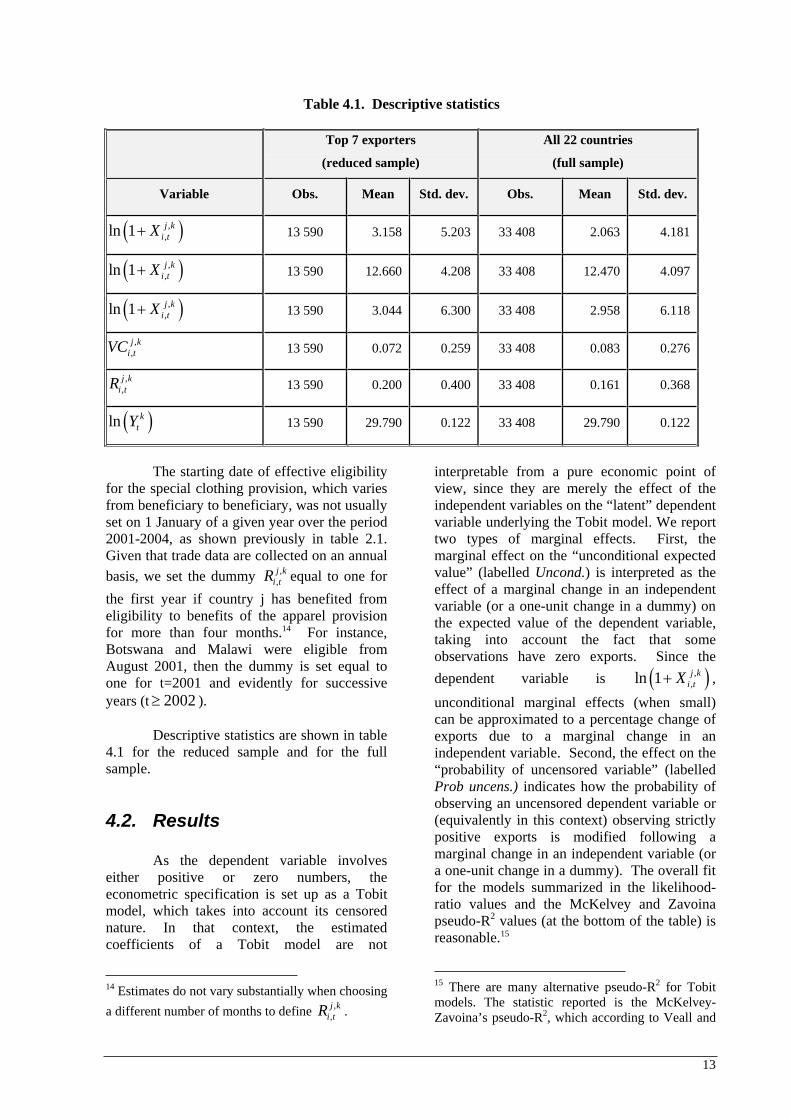
Descriptive statistics are shown in table 4.1 for the reduced sample and for the full sample.
4.2. Results
As the dependent variable involves either positive or zero numbers, the econometric specification is set up as a Tobit model, which takes into account its censored nature. In that context, the estimated coefficients of a Tobit model are not
14 Estimates do not vary substantially when choosing
a different number of months to define ,
,j k
i tR .
interpretable from a pure economic point of view, since they are merely the effect of the independent variables on the “latent” dependent variable underlying the Tobit model. We report two types of marginal effects. First, the marginal effect on the “unconditional expected value” (labelled Uncond.) is interpreted as the effect of a marginal change in an independent variable (or a one-unit change in a dummy) on the expected value of the dependent variable, taking into account the fact that some observations have zero exports. Since the
dependent variable is ,,ln 1 j k
i tX ,
unconditional marginal effects (when small) can be approximated to a percentage change of exports due to a marginal change in an independent variable. Second, the effect on the “probability of uncensored variable” (labelled Prob uncens.) indicates how the probability of observing an uncensored dependent variable or (equivalently in this context) observing strictly positive exports is modified following a marginal change in an independent variable (or a one-unit change in a dummy). The overall fit for the models summarized in the likelihood-ratio values and the McKelvey and Zavoina pseudo-R2 values (at the bottom of the table) is reasonable.15
15 There are many alternative pseudo-R2 for Tobit models. The statistic reported is the McKelvey-Zavoina’s pseudo-R2, which according to Veall and
Table 4.1. Descriptive statistics
Top 7 exporters
(reduced sample)
All 22 countries
(full sample)
Variable Obs. Mean Std. dev. Obs. Mean Std. dev.
,,ln 1 j k
i tX 13 590 3.158 5.203 33 408 2.063 4.181
,,ln 1 j k
i tX 13 590 12.660 4.208 33 408 12.470 4.097
,,ln 1 j k
i tX 13 590 3.044 6.300 33 408 2.958 6.118
,,j k
i tVC 13 590 0.072 0.259 33 408 0.083 0.276
,,j k
i tR 13 590 0.200 0.400 33 408 0.161 0.368
ln k
tY 13 590 29.790 0.122 33 408 29.790 0.122
14
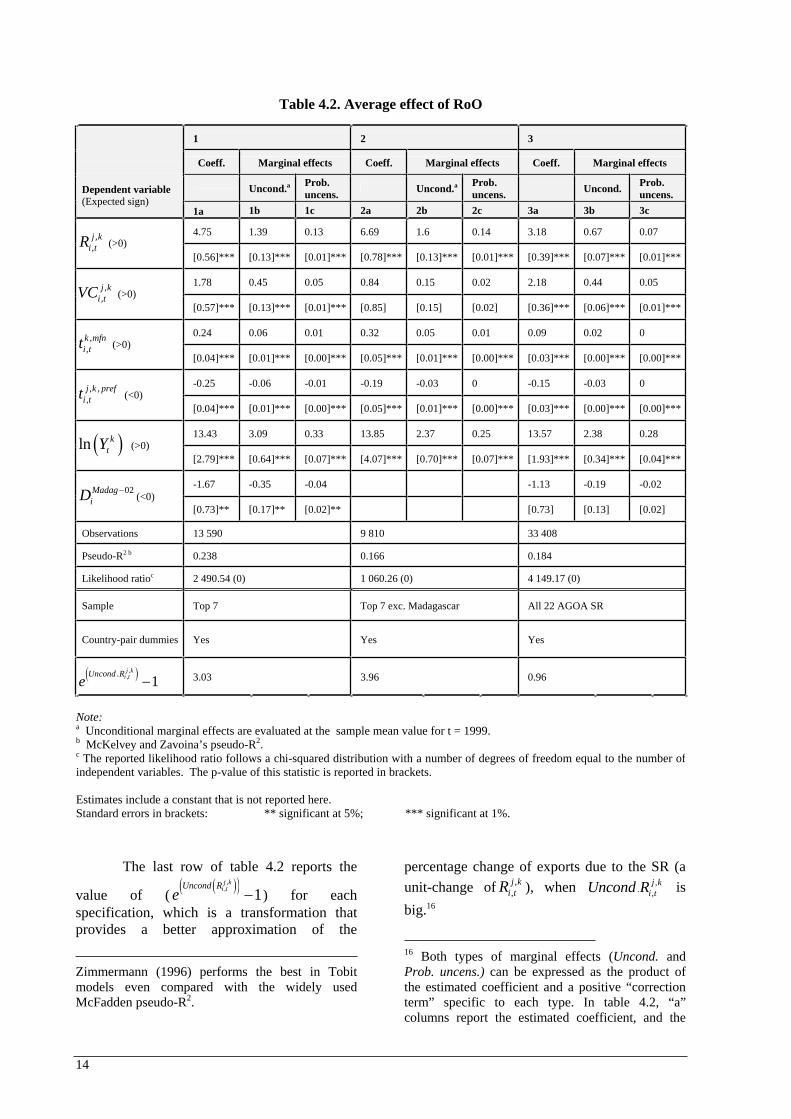
The last row of table 4.2 reports the
value of (,
,
1j k
i tUncond R
e ) for each specification, which is a transformation that provides a better approximation of the
Zimmermann (1996) performs the best in Tobit models even compared with the widely used McFadden pseudo-R2.
percentage change of exports due to the SR (a
unit-change of ,,j k
i tR ), when ,. ,
j k
i tUncond R is
big.16
16 Both types of marginal effects (Uncond. and Prob. uncens.) can be expressed as the product of the estimated coefficient and a positive “correction term” specific to each type. In table 4.2, “a” columns report the estimated coefficient, and the
Table 4.2. Average effect of RoO
1 2 3
Coeff. Marginal effects Coeff. Marginal effects Coeff. Marginal effects
Uncond.aProb.
uncens.Uncond.a
Prob.
uncens.Uncond.
Prob.
uncens. Dependent variable
(Expected sign) 1a 1b 1c 2a 2b 2c 3a 3b 3c
4.75 1.39 0.13 6.69 1.6 0.14 3.18 0.67 0.07 ,,j k
i tR (>0) [0.56]*** [0.13]*** [0.01]*** [0.78]*** [0.13]*** [0.01]*** [0.39]*** [0.07]*** [0.01]***
1.78 0.45 0.05 0.84 0.15 0.02 2.18 0.44 0.05 ,,j k
i tVC (>0) [0.57]*** [0.13]*** [0.01]*** [0.85] [0.15] [0.02] [0.36]*** [0.06]*** [0.01]***
0.24 0.06 0.01 0.32 0.05 0.01 0.09 0.02 0 ,,k mfn
i tt (>0) [0.04]*** [0.01]*** [0.00]*** [0.05]*** [0.01]*** [0.00]*** [0.03]*** [0.00]*** [0.00]***
-0.25 -0.06 -0.01 -0.19 -0.03 0 -0.15 -0.03 0 , ,,j k pref
i tt (<0) [0.04]*** [0.01]*** [0.00]*** [0.05]*** [0.01]*** [0.00]*** [0.03]*** [0.00]*** [0.00]***
13.43 3.09 0.33 13.85 2.37 0.25 13.57 2.38 0.28 ln k
tY (>0) [2.79]*** [0.64]*** [0.07]*** [4.07]*** [0.70]*** [0.07]*** [1.93]*** [0.34]*** [0.04]***
-1.67 -0.35 -0.04 -1.13 -0.19 -0.02 02Madag
iD (<0) [0.73]** [0.17]** [0.02]** [0.73] [0.13] [0.02]
Observations 13 590 9 810 33 408
Pseudo-R2 b 0.238 0.166 0.184
Likelihood ratioc 2 490.54 (0) 1 060.26 (0) 4 149.17 (0)
Sample Top 7 Top 7 exc. Madagascar All 22 AGOA SR
Country-pair dummies Yes Yes Yes
,,.
1j k
i tUncond Re 3.03 3.96 0.96
Note:a Unconditional marginal effects are evaluated at the sample mean value for t = 1999. b McKelvey and Zavoina’s pseudo-R2.c The reported likelihood ratio follows a chi-squared distribution with a number of degrees of freedom equal to the number ofindependent variables. The p-value of this statistic is reported in brackets.
Estimates include a constant that is not reported here. Standard errors in brackets: ** significant at 5%; *** significant at 1%.
15
Columns 1a to 1c report estimates for equation (1.6) (specification 1). All coefficient signs are as expected. The same applies to other specifications in table 4.2. In specification 1, as shown at the bottom of column 1b, the elimination of the restriction on the origin of fabric by the SR is associated with an increase of exports by a factor of 3.03 (= 303 per cent) when correcting the unconditional marginal effect to provide a better approximation of the relative increase in exports.17 18
Concerning tariff rates, since its unconditional marginal effects are small, a 1
per cent decrease in the MFN tariff, ,,
k m fn
i tt , is
associated with a decrease in African apparel exports of about 6 per cent, ceteris paribus. Symmetrically, a percentage point decrease in
preferential tariffs ,,
k p re f
i tt is related to a 6 per
cent increase in exports. The high responsiveness of apparel imports to a change in tariffs can be attributed to the high protection prevalent in the apparel sector in the European Union and in the United States and to the huge rents involved.
The marginal effect of ln(Y) on the
expected value of ,,ln 1 j k
i tX can be
marginal effects are reported in columns b and c. Each type of “correction term” is a function of the values set for all independent variables (here evaluated at 1999, the year before the SR went into effect). Moreover, both types of “correction terms” are situated between zero and one, that fact implying that the estimated coefficient in column a is the upper bound of the marginal effects given at the bottom of the table (i.e. 475 per cent versus 303 per cent for specification 1).
17 When the natural experiment is restricted to US imports before and after AGOA by reducing the sample only to African exports to the United States, the marginal effect of the SR does not change significantly, increasing slightly to 323 per cent (not reported here).
18 To check whether ,,j k
i tR is well-specified, we
define two other SR dummies for all countries by supposing that the SR started one year after the
baseline year at which the original ,,j k
i tR was defined,
as well as one year before it. When ,,j k
i tR was
replaced by these “misspecified” dummies, the estimated pseudo-R2 were indeed smaller.
interpreted as an income elasticity of the demand for African apparel imports. In specification 1, this elasticity is equal to 3,09.
The presence of an alternative VC requirement for some non-knitted apparel (CH62) is associated with an increase of more than 45 per cent in exports in those lines. Not surprisingly, easing-up the EU double transformation rule by allowing just a percentage of non-qualifying fabric is associated with an increase in exports smaller than that associated with simply removing restrictions on the origin of fabric, as under the AGOA SR. Madagascar’s export loss in 2002 due to its political crises is about 35 per cent, as captured by the unconditional marginal effect
of 02Madag
iD .19
The theoretical model in section 4 describes the effect of different variables on the volume of exports, and not on the range of exports. To observe how export diversification occurs, data available at the firm level or the plant level is required. However, the change in the probability of having positive exports induced by a change in a regressor can be computed at the tariff line with the Tobit model without additional data. "C" columns in table 4.2 report those marginal effects (labelled Prob.
uncens.)
As shown in column 1c, there is a 13 per cent greater probability of having positive exports on tariff lines benefiting from the SR
induced by ,,j k
i tR . This can be interpreted as
evidence of the role of the SR regarding export growth at the extensive margin (i.e. a greater probability of exporting varieties that would not be exported in the absence of the SR). Indeed, easing-up RoO cuts down exports costs under preferential arrangements, and this creates an incentive to export diversification.
19 Dummies controlling for additional Madagascar export loss in successive years are excluded, since their coefficients are not significant.
16
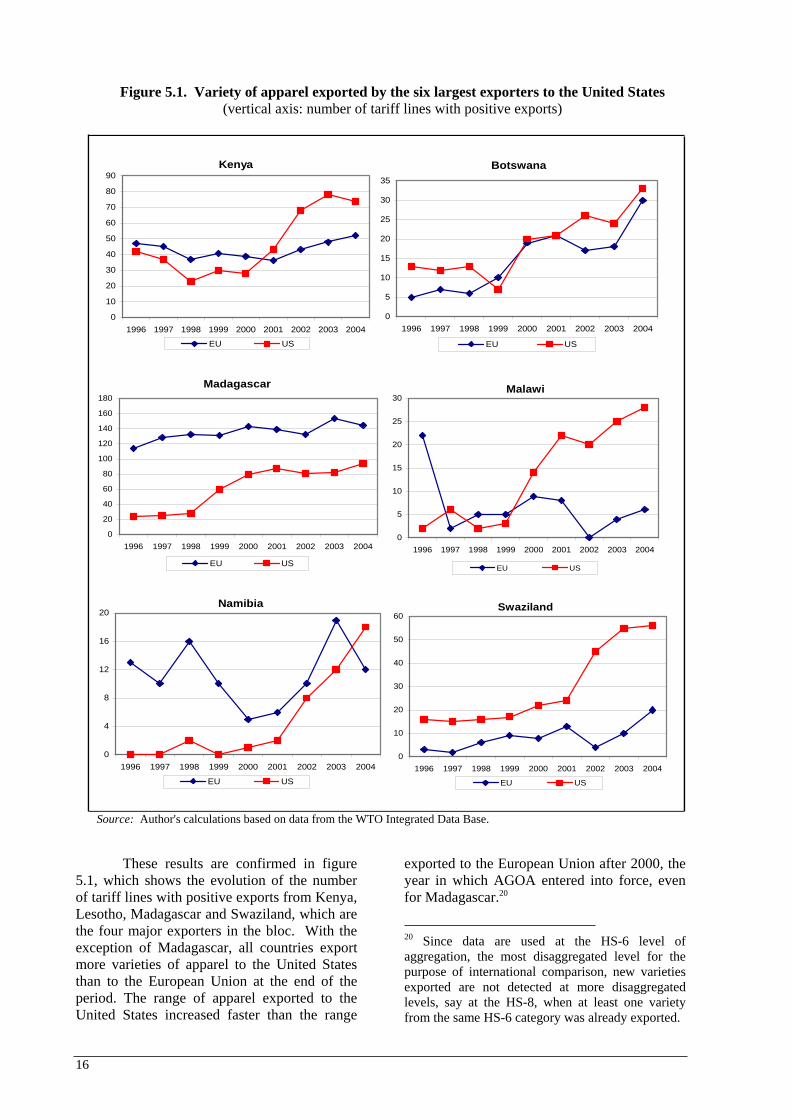
These results are confirmed in figure 5.1, which shows the evolution of the number of tariff lines with positive exports from Kenya, Lesotho, Madagascar and Swaziland, which are the four major exporters in the bloc. With the exception of Madagascar, all countries export more varieties of apparel to the United States than to the European Union at the end of the period. The range of apparel exported to the United States increased faster than the range
exported to the European Union after 2000, the year in which AGOA entered into force, even for Madagascar.20
20 Since data are used at the HS-6 level of aggregation, the most disaggregated level for the purpose of international comparison, new varieties exported are not detected at more disaggregated levels, say at the HS-8, when at least one variety from the same HS-6 category was already exported.
Figure 5.1. Variety of apparel exported by the six largest exporters to the United States
(vertical axis: number of tariff lines with positive exports)
Kenya
0
10
20
30
40
50
60
70
80
90
1996 1997 1998 1999 2000 2001 2002 2003 2004
EU US
Madagascar
0
20
40
60
80
100
120
140
160
180
1996 1997 1998 1999 2000 2001 2002 2003 2004
EU US
Namibia
0
4
8
12
16
20
1996 1997 1998 1999 2000 2001 2002 2003 2004
EU US
Botswana
0
5
10
15
20
25
30
35
1996 1997 1998 1999 2000 2001 2002 2003 2004
EU US
Malawi
0
5
10
15
20
25
30
1996 1997 1998 1999 2000 2001 2002 2003 2004
EU US
Swaziland
0
10
20
30
40
50
60
1996 1997 1998 1999 2000 2001 2002 2003 2004
EU US
Source: Author's calculations based on data from the WTO Integrated Data Base.
17
Compared with the exports of other African exporters, Madagascar’s exports follow a different pattern due to its political crisis in 2002, as seen in figure 2.3. Since Madagascar is the largest exporter of apparel in our group and accounts for about a third of all observations in the reduced sample, we remove Madagascar from the sample to estimate specification 2, so as to compare those estimates with the previous ones. For subsequent estimates, the discussion is mainly focused on variables related to RoO and their unconditional marginal effects, as other estimates do not diverge substantially across specifications.
The effect of the SR on expected exports goes up to a 3.96 factor (= 396 per cent), as shown in last row of column 2b. Indeed, removal of Madagascar from the sample makes it appear that other exporters have benefited relatively more from AGOA SR. On the other hand, the effect of the alternative VC requirement on exports to the European Union decreases and is no longer significant. This result is consistent with the fact that Madagascar is by far the largest exporter to the European Union, and a main beneficiary of the flexibility provided by the alternative VC requirement under EU preferences.
In specification 3, we consider the whole sample of 22 countries eligible for the SR (columns 3a, 3b and 3c). Here, the export growth rate due to the SR decreases to 0.96 (= 96 per cent). As expected, this figure, which represents the “average” effect of the special provision on apparel is lower than in previous specifications, since countries not managing to increase exports significantly were included in the sample, even if they were made eligible for the AGOA SR.21 The marginal effect of ln(Y) is now equal to 2.37, a more plausible value that do not vary greatly in next specifications.
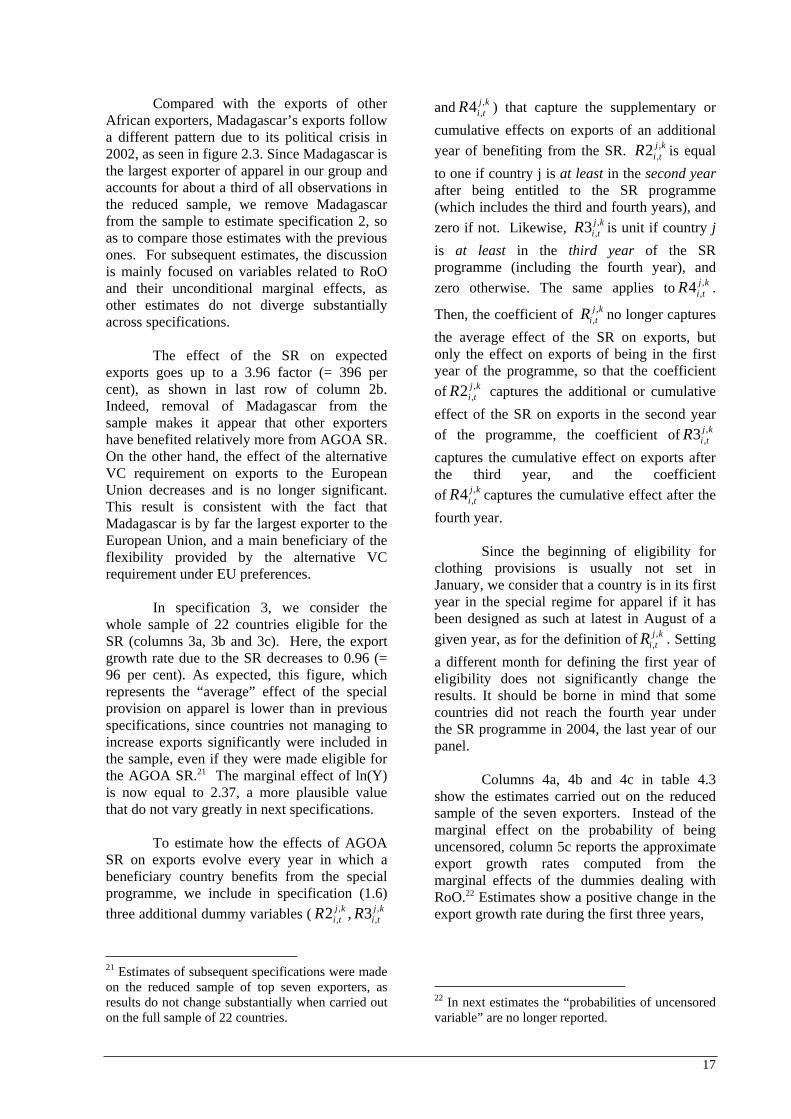
To estimate how the effects of AGOA SR on exports evolve every year in which a beneficiary country benefits from the special programme, we include in specification (1.6)
three additional dummy variables ( , ,, ,2 , 3j k j k
i t i tR R
21 Estimates of subsequent specifications were made on the reduced sample of top seven exporters, as results do not change substantially when carried out on the full sample of 22 countries.
and ,,4 j k
i tR ) that capture the supplementary or
cumulative effects on exports of an additional
year of benefiting from the SR. ,,2 j k
i tR is equal
to one if country j is at least in the second year
after being entitled to the SR programme (which includes the third and fourth years), and
zero if not. Likewise, ,,3 j k
i tR is unit if country j
is at least in the third year of the SR programme (including the fourth year), and
zero otherwise. The same applies to ,,4 j k
i tR .
Then, the coefficient of ,,j k
i tR no longer captures
the average effect of the SR on exports, but only the effect on exports of being in the first year of the programme, so that the coefficient
of ,,2 j k
i tR captures the additional or cumulative
effect of the SR on exports in the second year
of the programme, the coefficient of ,,3 j k
i tR
captures the cumulative effect on exports after the third year, and the coefficient
of ,,4 j k
i tR captures the cumulative effect after the
fourth year.
Since the beginning of eligibility for clothing provisions is usually not set in January, we consider that a country is in its first year in the special regime for apparel if it has been designed as such at latest in August of a
given year, as for the definition of ,,j k
i tR . Setting
a different month for defining the first year of eligibility does not significantly change the results. It should be borne in mind that some countries did not reach the fourth year under the SR programme in 2004, the last year of our panel.
Columns 4a, 4b and 4c in table 4.3 show the estimates carried out on the reduced sample of the seven exporters. Instead of the marginal effect on the probability of being uncensored, column 5c reports the approximate export growth rates computed from the marginal effects of the dummies dealing with RoO.22 Estimates show a positive change in the export growth rate during the first three years,
22 In next estimates the “probabilities of uncensored variable” are no longer reported.

18
Table 4.3. Estimation results: Temporal effects of RoO
4 5
Coeff. Marginal effects Coeff. Marginal effects
Uncond.a . 1Uncond Re Uncond.a . 1Uncond R
e
4a 4b 4c 5a 5b 5c
3.24 0.88 1.41 4.3 0.91 1.48 ,,j k
i tR[0.70]*** [0.16]*** [0.96]*** [0.16]***
1.91 0.48 0.62 2.78 0.54 0.72 ,,2 j k
i tR[0.78]** [0.18]*** [1.03]*** [0.17]***
0.75 0.18 0.20 1.9 0.35 0.42 ,,3 j k
i tR[0.77] [0.18] [1.00]* [0.17]**
-0.02 0 0 0.18 0.03 0.03 ,,4 j k
i tR[0.84] [0.19] [1.26] [0.21]
1.99 0.51 1.27 0.23 ,,j k
i tVC[0.57]*** [0.13]*** [0.85] [0.14]
0.25 0.06 0.33 0.06 ,,k mfn
i tt[0.04]*** [0.01]*** [0.05]*** [0.01]***
-0.27 -0.06 -0.22 -0.04 , ,,j k pref
i tt[0.04]*** [0.01]*** [0.05]*** [0.01]***
10.26 2.35 7.26 1.23 ln k
tY
[2.97]*** [0.68]*** [4.30]* [0.73]*
-1.71 -0.36 02M adag
iD[0.77]** [0.18]**
Observations 13 590 9 810
Pseudo R2 b 0.24 0.17
Likelihood ratioc 2 505.18 (0) 1 083.42 (0)
Sample Top 7 Top 7 exc. Madagascar
Country-pair dummies Yes Yes
Note:a Unconditional marginal effects are evaluated at the sample mean value for t = 1999. b McKelvey and Zavoina’s pseudo-R2.c The reported likelihood ratio follows a chi-squared distribution with a number of degrees of freedom equal to the number of independent variables. The p-value of this statistic is reported in brackets.
Estimates include a constant that is not reported here. Standard errors in brackets: *significant at 10%; ** significant at 5%; *** significant at 1%.
19
(although ,,3 j k
i tR is not significant), and a
negative and non-significant change for the last year. The greatest change in export growth is registered during the first year. This is evidence that preferential exports increased immediately after the implementation of the SR. According to corrected unconditional marginal effects reported in column 4c, exports increase on average by 140 per cent after the first year, and by 200 per cent (= 140 per cent + 60 per cent) after the second year.
When Madagascar is removed from the reduced sample (specification 5), the marginal effects of all SR coefficients increase slightly. All of them are now positive and the cumulative effect for the third year becomes significant. According to estimates, exports increase on average by 147 per cent after the first year, by 220 per cent (= 148 per cent + 72 per cent) after the second year and by 262 per cent (= 220 per cent + 42 per cent) after the third year. There is evidence of “dynamic learning effects” as export growth rates for countries benefiting from the SR continue to increase for at least the first three years of the programme. Again, VC is no longer significant once Madagascar has been removed from the sample.
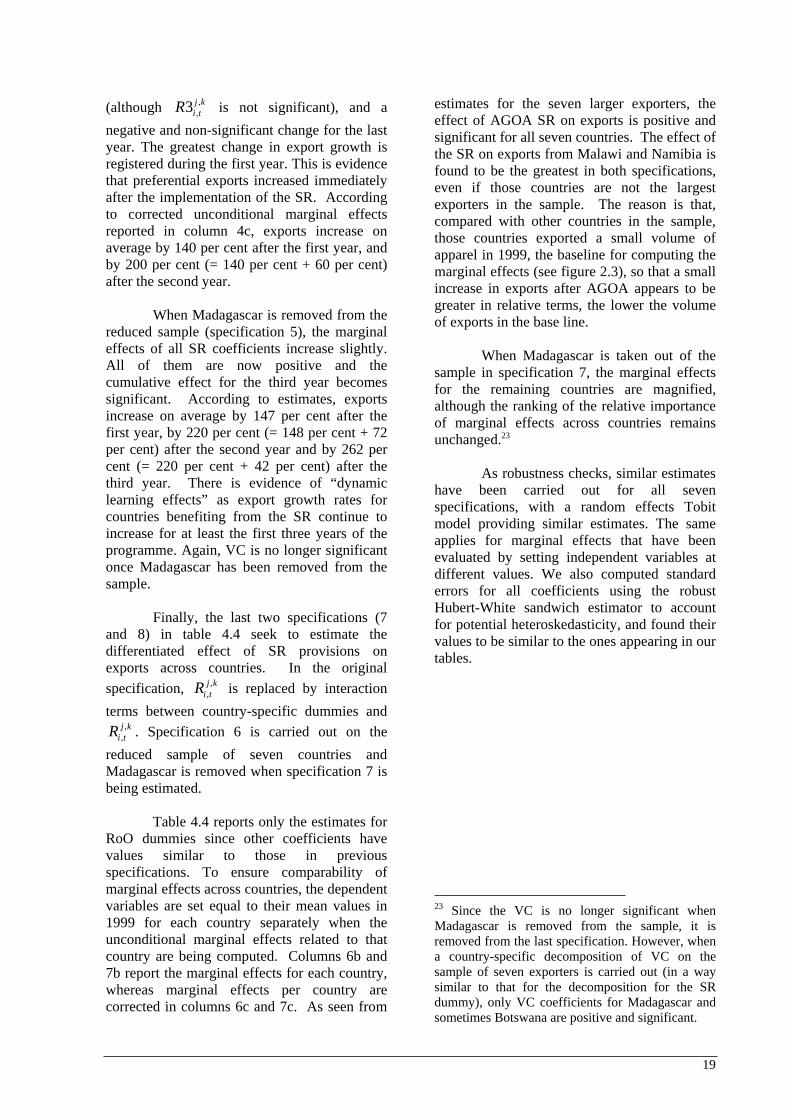
Finally, the last two specifications (7 and 8) in table 4.4 seek to estimate the differentiated effect of SR provisions on exports across countries. In the original
specification, ,,j k
i tR is replaced by interaction
terms between country-specific dummies and ,
,j k
i tR . Specification 6 is carried out on the
reduced sample of seven countries and Madagascar is removed when specification 7 is being estimated.
Table 4.4 reports only the estimates for RoO dummies since other coefficients have values similar to those in previous specifications. To ensure comparability of marginal effects across countries, the dependent variables are set equal to their mean values in 1999 for each country separately when the unconditional marginal effects related to that country are being computed. Columns 6b and 7b report the marginal effects for each country, whereas marginal effects per country are corrected in columns 6c and 7c. As seen from
estimates for the seven larger exporters, the effect of AGOA SR on exports is positive and significant for all seven countries. The effect of the SR on exports from Malawi and Namibia is found to be the greatest in both specifications, even if those countries are not the largest exporters in the sample. The reason is that, compared with other countries in the sample, those countries exported a small volume of apparel in 1999, the baseline for computing the marginal effects (see figure 2.3), so that a small increase in exports after AGOA appears to be greater in relative terms, the lower the volume of exports in the base line.
When Madagascar is taken out of the sample in specification 7, the marginal effects for the remaining countries are magnified, although the ranking of the relative importance of marginal effects across countries remains unchanged.23
As robustness checks, similar estimates have been carried out for all seven specifications, with a random effects Tobit model providing similar estimates. The same applies for marginal effects that have been evaluated by setting independent variables at different values. We also computed standard errors for all coefficients using the robust Hubert-White sandwich estimator to account for potential heteroskedasticity, and found their values to be similar to the ones appearing in our tables.
23 Since the VC is no longer significant when Madagascar is removed from the sample, it is removed from the last specification. However, when a country-specific decomposition of VC on the sample of seven exporters is carried out (in a way similar to that for the decomposition for the SR dummy), only VC coefficients for Madagascar and sometimes Botswana are positive and significant.
20
Table 4.4. Estimation results: RoO effects, by exporters
6 7
Coeff. Marginal effects Coeff. Marginal effects
Uncond. 1Unconde Uncond. 1Uncond
e
6a 6b 6c 7a 7b 7c
2.52 0.55 a 0.73 3.67 0.83 1.29 ,,
Bot j k
i i tD R[1.29]* [0.24]** [1.52]** [0.28]***
3.15 0.98 a 1.66 4.47 1.41 3.10 ,,
Ken j k
i i tD R[0.86]*** [0.23]*** [1.04]*** [0.27]***
5.89 1.54 a 3.66 7.32 1.95 6.03 ,,
Les j k
i i tD R[0.94]*** [0.18]*** [1.13]*** [0.21]***
3.94 1.86 a 5.42 ,,
Mad j k
i i tD R[0.84]*** [0.34]***
9.9 3.6 a 7.94 12.08 2.76 14.80 ,,
Mala j k
i i tD R[1.59]*** [0.36]*** [1.87]*** [0.22]***
15.41 6.92 a 14.03 18.06 3.3 26.11 ,,
Nam j k
i i tD R[2.42]*** [0.54]*** [2.82]*** [0.15]***
6.41 1.3 a 2.67 8.2 1.72 4.58 ,,
Swa j k
i i tD R[1.13]*** [0.15]*** [1.35]*** [0.18]***
1.78 0.44 b 0.55 ,,j k
i tVC[0.57]*** [0.13]***
Observations 13 590 9 810
Pseudo R2 b 0.24 0.19
Likelihood ratioc 2 495.17 (0) 1 067.32 (0)
Sample Top 7 Top 7 excl. Madagascar
Country-pair dummies Yes Yes
Note:a Unconditional marginal effects are evaluated at the country mean value for t = 1999. b McKelvey and Zavoina’s pseudo-R2.c The reported likelihood ratio follows a chi-squared distribution with a number of degrees of freedom equal to the number of independent variables. The p-value of this statistic is reported in brackets.
Estimates include constants and other dependent variables that are not reported here. Standard errors in brackets: *significant at 10%; ** significant at 5%; *** significant at 1%.
21
5. Conclusions
This paper has quantified the effect on exports of relaxing RoO for apparel produced in sub-Saharan African countries, which consisted in the removal of restrictions on the origin of intermediates granted by the SR of AGOA. It comes to several conclusions. First, taking advantage of this quasi-natural experiment setting whereby exports from those countries to the European Union and the United States benefited approximately from the same preferential margin of 10 per cent in both markets under EBA and AGOA, and controlling for other factors, we found that AGOA SR increased apparel exports from the seven main exporters by about 300 per cent. None of the time-dummy coefficients were significant, a fact that suggests that the model is appropriate. This large effect is particularly noteworthy since an analysis based solely on the high utilization rates of preferences might erroneously conclude that the special (“double transformation”) requirements in T&A had little effect.
Second, the detailed analysis at the product level revealed that less restrictive RoO are associated with an expansion of the range of exported apparel. Indeed, under preferential market access, more lenient RoO reduce costs for exporters and may encourage export diversification or export growth at the extensive margin. To our knowledge, this is the first research that has looked at the relationship between RoO and export diversification.
Third, the results suggest learning effects. With respect to the dynamic effects of AGOA SR, we found evidence that the uptake of preferences is gradual over time, taking place in the first three years during which a country benefits from the SR.
The research also revealed that the impact of the AGOA SR on exports is different across countries. Since the SR was not introduced in the same year for all countries, these results strongly suggest that differences in RoO accounted for differences in performance. As to the uneven effects of the SR across the sample (e.g. the quality of infrastructure, political and social stability, governance, fiscal policies aimed at attracting foreign investment),
these could not be controlled for in this research.24
Two policy conclusions policy emerge from the study. First, since the uptake of preferences seems to be gradual over time, it may be too early to assess the performance of some countries under the SR. Furthermore, many analysts believe that the primary reason of Asian investment in apparel industries in the African countries was to circumvent US barriers to imports from Asian countries. But the removal of quotas at end of the ATC and of any other barriers will erode preferences for apparel exported by those countries in subsequent years, a fact that highlights the importance of lenient RoO.
Second, strict RoO have often been justified as a means of supporting more processing in developing countries by encouraging integrated production within a country, or within groups of countries through cumulation schemes, as in the case of T&A. However, at least in the case of T&A, RoO have a perverse effect as they discourage the developing of exports at the intensive margin, as well as at the extensive margin, through product diversification which contributes to reducing volatility. In sum, development-friendly policies would benefit from making RoO requirements less stringent.
24 For instance, Lesotho, one of the successful exporters, managed to attract foreign investment in the textiles industry by offering a low corporate tax and further tax concessions for locating factories in towns outside Maseru, the capital. Furthermore, the political and social environment was felt by foreign investors to be more stable after a period of political instability. The result was a sudden increase in foreign investment, mainly originating from Asia, and Lesotho became one of the largest exporters to the United States among countries eligible for the AGOA SR. For an early account of the case of Lesotho, see “Lesotho seen as gateway to US market: trade agreements have eased access for investors and helped diversify employment opportunities for locals”, Financial Times, 23 August 2001.
22
References and bibliography
Anson J, Cadot O, Estevadeordal A, Suwa-Eisenmann A, de Melo J and Tumurchudur B (2005). Rules of origin in North–South preferential trading arrangements with an application to NAFTA. Review of International
Economics, 13(3): 501–17.
Brenton P and Imagawa H (2004). Rules of origin, trade and customs. In: Sokol J and de Wulf L, eds., The Customs
Modernization Handbook. Washington, DC: World Bank.
Brenton P and Özden C (2005). Trade preferences for apparel and the role of rules of origin: the case of Africa. Washington, DC: World Bank, mimeo.
Cadot O, Carrère C, de Melo J and Portugal-Perez A (2005). Market access and welfare under free trade agreements: textiles under NAFTA. World Bank
Economic Review, 19(3): 415–430.
Cadot O, Estevadeordal A, Suwa-Eisenmann A and Verdier T, eds. (2006a). The Origin
of Goods: Rules of Origin in Regional Trade Agreements. London: Oxford University Press.
Cadot O, Estevadeordal A and Suwa-Eisenmann A (2006b). Rules of origin as export subsidies. In: Cadot et al., eds. (2006a).
Cadot O, Carrère C, de Melo J and Tumurchudur B (2006c). Product specific rules of origin in EU and US preferential trading arrangements: an assessment. World Trade Review, 199–225 (also CEPR DP#4998).
Carrère C and de Melo J (2006). Are different rules of origin equally costly? Estimates from NAFTA. In: Cadot et al., eds. (2006a).
Erasmus H, Flatters F and Kirk R (2006). Rules of origin as tools of development? Lessons from SADC. In Cadot et al., eds. (2006a).
Estevadeordal A (2000). Negotiating preferential access: the case of the North American Free Trade Agreement. Journal of World Trade,
34(1): 141–66.
Estevadeordal A and Suominen K (2006). Mapping and measuring rules of origin around the world. In: Cadot et al., eds. (2006a).
Krueger A (1999). Free trade agreements as protectionist devices: rules of origin. In: Melvin JR, Moore JC and Riezman R, eds. Trade, Theory and
Econometrics: Essays in Honor of John
C. Chipman. New York, Routledge Press: 91–101.
Meyer, B D (1995). "Natural and quasi-experiments in economics", Journal of
Business and Economic Statistics,American Statistical Association, 13(2): 151–161.
Olarreaga M and Özden C (2005). AGOA and apparel: who captures the tariff rent in the presence of preferential market access? World Economy, 28(1):63–77.
Rivoli P (2005). The Travels of a T-Shirt in The
Global Economy: An Economist
Examines the Markets, Power, and
Politics of World Trade. New York, John Wiley & Sons.
Rodriguez PL (2001). Rules of origin with multi-stage production. World
Economy, 24(2): 201–220.
Veall M and Zimmermann K (1996). Pseudo-R2 measures for some common limited dependent variable models. Journal of
Economic Surveys, 10(3): 241–259,
Wooldridge JM (2001). Econometric Analysis
of Cross Section and Panel Data.
Cambridge, MIT Press.
23
Appendix 1. Derivation of expression (1.5)
Profit- maximizing pricing for sellers of African apparel implies:
,, ,
, , 1k k k k
wk k k k k k pref k
w Xk
p X Y Pp X Y P X t MC
X (1.4)
where kp is the inverse demand function of country k and * ,1k k MFN
wP P t .
Totally differentiating expression (1.4), we obtain:
2 2,
2
2, , * * ,
2 1
1 0
k k k k k
Xk k pref k k k
k k k k kk
k k k
Xk k pref k pref k k MFN
X k k k
w w
p p MC p pX t dX X dY
X X X Y YX
MC p pMC dt t dr P X P dt
r X P P
Since we assumed: 0k
X
k
MC
X, we have :
, , 0k k k pref k MFNA dX B dY C dt D dr E dt (A1)
Where:2
22
k k
k
kk
p pA X
XX ,
2 k k
k
k k k
p pB X
X Y Y, k
XC MC ;
,1k
Xk prefMC
D tr
, and2
* *k k
k
k k k
w w
p pE P X P
X P P.
Then from (A1) :
0A if and only if 2
22
k k
k
kk
p pX
XX, which is verified, for instance, if we assume a linear
demand function , so that2
20
k
k
p
X.
0B if and only if 2 k k
k
k k k
p pX
X Y Y, which is verified, for instance, when we assume that
2 k
k k
p
X Y>0.
0C and 0D .
24
0E if and only if 2 k k
k
k k k
w w
p pX
X P P, which is verified, for instance, when we assume that
2 k
k k
w
p
X P>0.
Then,
,0, 0, 0
k k EU
k k pref
dX dX dXB C D
dY A dt A dr A and
,0
k
k MFN
dX E
dt A
25
Appendix 2. Additional figures
Figure A2.1. EU and US Imports of knitted (HS-61) and non-knitted (HS-62) apparel
Source: Author’s calculations based on data from WTO Integrated Data Base.
0
100 000
200 000
300 000
400 000
500 000
600 000
700 000
800 000
1996 1997 1998 1999 2000 2001 2002 2003 2004
imp
ort
s f
rom
22 c
ou
ntr
ies u
nd
er
AG
OA
SR
(1 0
00$)
US imports of
knitted apparel
(HS-61)
EU imports of
knitted apparel
(HS-61)
US imports of
non-knitted
apparel (HS-
62)
EU imports of
non-knitted
apparel (HS-
62)
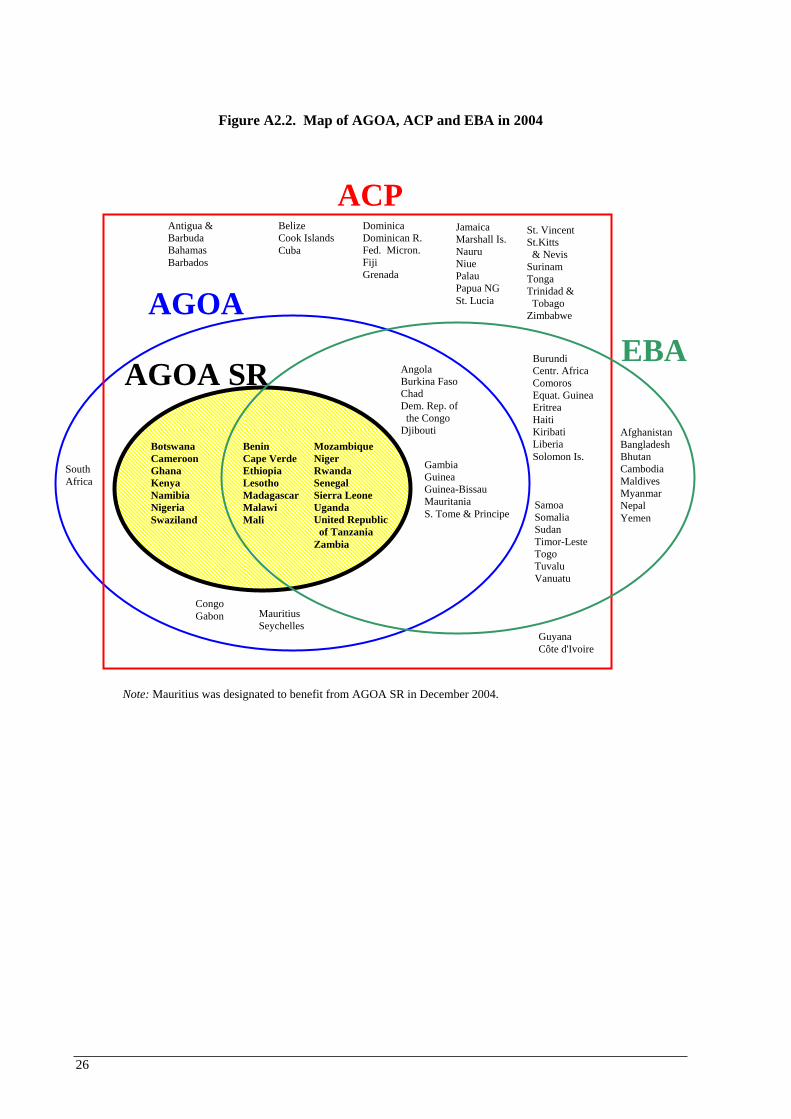
26
Figure A2.2. Map of AGOA, ACP and EBA in 2004
Note: Mauritius was designated to benefit from AGOA SR in December 2004.
Benin
Cape Verde
Ethiopia
Lesotho
Madagascar
Malawi
Mali
Mozambique
Niger
Rwanda
Senegal
Sierra Leone
Uganda
United Republic
of Tanzania
Zambia
Botswana
Cameroon
Ghana
Kenya
Namibia
Nigeria
Swaziland
Gambia GuineaGuinea-BissauMauritania S. Tome & Principe
CongoGabon
Burundi Centr. Africa Comoros Equat. Guinea EritreaHaitiKiribatiLiberia Solomon Is.
Samoa Somalia SudanTimor-Leste Togo Tuvalu Vanuatu
BelizeCook Islands Cuba
GuyanaCôte d'Ivoire
Jamaica Marshall Is. Nauru NiuePalauPapua NG St. Lucia
St. Vincent St.Kitts & Nevis Surinam Tonga Trinidad & Tobago Zimbabwe
SouthAfrica
AfghanistanBangladeshBhutanCambodia MaldivesMyanmar NepalYemen
ACP
AGOA
AGOA SR EBA
Antigua & Barbuda Bahamas Barbados
Dominica Dominican R. Fed. Micron. FijiGrenada
AngolaBurkina Faso ChadDem. Rep. of the Congo Djibouti
MauritiusSeychelles
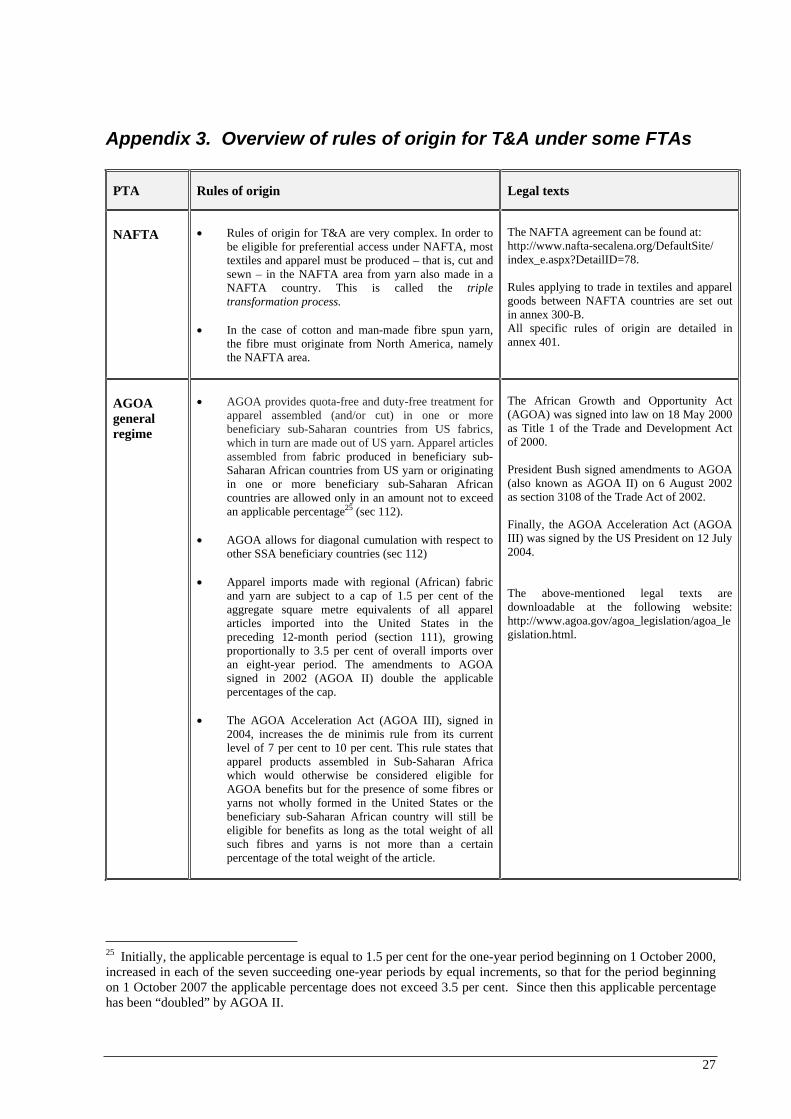
27
Appendix 3. Overview of rules of origin for T&A under some FTAs
PTA Rules of origin Legal texts
NAFTA Rules of origin for T&A are very complex. In order to be eligible for preferential access under NAFTA, most textiles and apparel must be produced – that is, cut and sewn – in the NAFTA area from yarn also made in a NAFTA country. This is called the triple
transformation process.
In the case of cotton and man-made fibre spun yarn, the fibre must originate from North America, namely the NAFTA area.
The NAFTA agreement can be found at: http://www.nafta-secalena.org/DefaultSite/index_e.aspx?DetailID=78.
Rules applying to trade in textiles and apparel goods between NAFTA countries are set out in annex 300-B. All specific rules of origin are detailed in annex 401.
AGOA
general
regime
AGOA provides quota-free and duty-free treatment for apparel assembled (and/or cut) in one or more beneficiary sub-Saharan countries from US fabrics, which in turn are made out of US yarn. Apparel articles assembled from fabric produced in beneficiary sub-Saharan African countries from US yarn or originating in one or more beneficiary sub-Saharan African countries are allowed only in an amount not to exceed an applicable percentage25 (sec 112).
AGOA allows for diagonal cumulation with respect to other SSA beneficiary countries (sec 112)
Apparel imports made with regional (African) fabric and yarn are subject to a cap of 1.5 per cent of the aggregate square metre equivalents of all apparel articles imported into the United States in the preceding 12-month period (section 111), growing proportionally to 3.5 per cent of overall imports over an eight-year period. The amendments to AGOA signed in 2002 (AGOA II) double the applicable percentages of the cap.
The AGOA Acceleration Act (AGOA III), signed in 2004, increases the de minimis rule from its current level of 7 per cent to 10 per cent. This rule states that apparel products assembled in Sub-Saharan Africa which would otherwise be considered eligible for AGOA benefits but for the presence of some fibres or yarns not wholly formed in the United States or the beneficiary sub-Saharan African country will still be eligible for benefits as long as the total weight of all such fibres and yarns is not more than a certain percentage of the total weight of the article.
The African Growth and Opportunity Act (AGOA) was signed into law on 18 May 2000 as Title 1 of the Trade and Development Act of 2000.
President Bush signed amendments to AGOA (also known as AGOA II) on 6 August 2002 as section 3108 of the Trade Act of 2002.
Finally, the AGOA Acceleration Act (AGOA III) was signed by the US President on 12 July 2004.
The above-mentioned legal texts are downloadable at the following website: http://www.agoa.gov/agoa_legislation/agoa_legislation.html.
25 Initially, the applicable percentage is equal to 1.5 per cent for the one-year period beginning on 1 October 2000, increased in each of the seven succeeding one-year periods by equal increments, so that for the period beginning on 1 October 2007 the applicable percentage does not exceed 3.5 per cent. Since then this applicable percentage has been “doubled” by AGOA II.
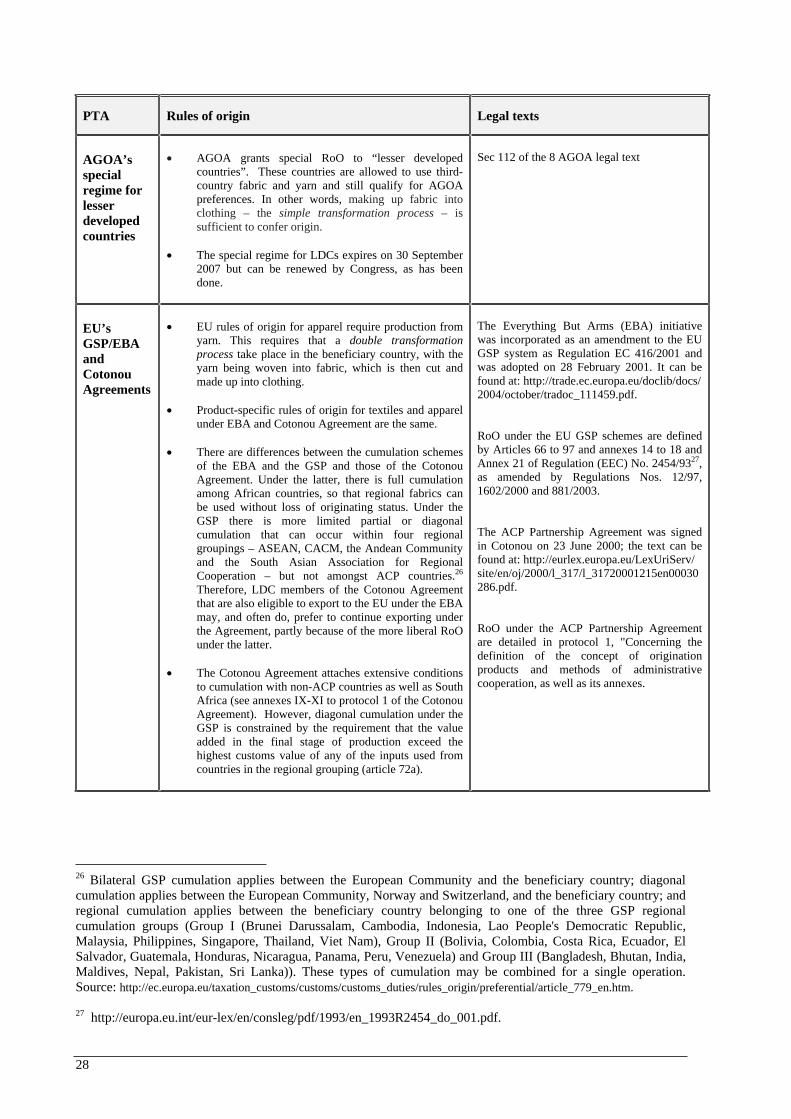
28
PTA Rules of origin Legal texts
AGOA’s
special
regime for
lesser
developed
countries
AGOA grants special RoO to “lesser developed countries”. These countries are allowed to use third-country fabric and yarn and still qualify for AGOA preferences. In other words, making up fabric into clothing – the simple transformation process – is sufficient to confer origin.
The special regime for LDCs expires on 30 September 2007 but can be renewed by Congress, as has been done.
Sec 112 of the 8 AGOA legal text
EU’s
GSP/EBA
and
Cotonou
Agreements
EU rules of origin for apparel require production from yarn. This requires that a double transformation
process take place in the beneficiary country, with the yarn being woven into fabric, which is then cut and made up into clothing.
Product-specific rules of origin for textiles and apparel under EBA and Cotonou Agreement are the same.
There are differences between the cumulation schemes of the EBA and the GSP and those of the Cotonou Agreement. Under the latter, there is full cumulation among African countries, so that regional fabrics can be used without loss of originating status. Under the GSP there is more limited partial or diagonal cumulation that can occur within four regional groupings – ASEAN, CACM, the Andean Community and the South Asian Association for Regional Cooperation – but not amongst ACP countries.26
Therefore, LDC members of the Cotonou Agreement that are also eligible to export to the EU under the EBA may, and often do, prefer to continue exporting under the Agreement, partly because of the more liberal RoO under the latter.
The Cotonou Agreement attaches extensive conditions to cumulation with non-ACP countries as well as South Africa (see annexes IX-XI to protocol 1 of the Cotonou Agreement). However, diagonal cumulation under the GSP is constrained by the requirement that the value added in the final stage of production exceed the highest customs value of any of the inputs used from countries in the regional grouping (article 72a).
The Everything But Arms (EBA) initiative was incorporated as an amendment to the EU GSP system as Regulation EC 416/2001 and was adopted on 28 February 2001. It can be found at: http://trade.ec.europa.eu/doclib/docs/ 2004/october/tradoc_111459.pdf.
RoO under the EU GSP schemes are defined by Articles 66 to 97 and annexes 14 to 18 and Annex 21 of Regulation (EEC) No. 2454/9327,as amended by Regulations Nos. 12/97, 1602/2000 and 881/2003.
The ACP Partnership Agreement was signed in Cotonou on 23 June 2000; the text can be found at: http://eurlex.europa.eu/LexUriServ/site/en/oj/2000/l_317/l_31720001215en00030286.pdf.
RoO under the ACP Partnership Agreement are detailed in protocol 1, "Concerning the definition of the concept of origination products and methods of administrative cooperation, as well as its annexes.
26 Bilateral GSP cumulation applies between the European Community and the beneficiary country; diagonal cumulation applies between the European Community, Norway and Switzerland, and the beneficiary country; and regional cumulation applies between the beneficiary country belonging to one of the three GSP regional cumulation groups (Group I (Brunei Darussalam, Cambodia, Indonesia, Lao People's Democratic Republic, Malaysia, Philippines, Singapore, Thailand, Viet Nam), Group II (Bolivia, Colombia, Costa Rica, Ecuador, El Salvador, Guatemala, Honduras, Nicaragua, Panama, Peru, Venezuela) and Group III (Bangladesh, Bhutan, India, Maldives, Nepal, Pakistan, Sri Lanka)). These types of cumulation may be combined for a single operation. Source: http://ec.europa.eu/taxation_customs/customs/customs_duties/rules_origin/preferential/article_779_en.htm.
27 http://europa.eu.int/eur-lex/en/consleg/pdf/1993/en_1993R2454_do_001.pdf.
29
UNCTAD Study Series on
POLICY ISSUES IN INTERNATIONAL TRADE
AND COMMODITIES
No. 1 Erich Supper, Is there effectively a level playing field for developing country
exports?, 2001, 138 p. Sales No. E.00.II.D.22.
No. 2 Arvind Panagariya, E-commerce, WTO and developing countries, 2000, 24 p. Sales No. E.00.II.D.23.
No. 3 Joseph Francois, Assessing the results of general equilibrium studies of
multilateral trade negotiations, 2000, 26 p. Sales No. E.00.II.D.24.
No. 4 John Whalley, What can the developing countries infer from the Uruguay Round
models for future negotiations?, 2000, 29 p. Sales No. E.00.II.D.25.
No. 5 Susan Teltscher, Tariffs, taxes and electronic commerce: Revenue implications
for developing countries, 2000, 57 p. Sales No. E.00.II.D.36.
No. 6 Bijit Bora, Peter J. Lloyd, Mari Pangestu, Industrial policy and the WTO, 2000, 47 p. Sales No. E.00.II.D.26.
No. 7 Emilio J. Medina-Smith, Is the export-led growth hypothesis valid for developing
countries? A case study of Costa Rica, 2001, 49 p. Sales No. E.01.II.D.8.
No. 8 Christopher Findlay, Service sector reform and development strategies: Issues
and research priorities, 2001, 24 p. Sales No. E.01.II.D.7.
No. 9 Inge Nora Neufeld, Anti-dumping and countervailing procedures – Use or abuse?
Implications for developing countries, 2001, 33 p. Sales No. E.01.II.D.6.
No. 10 Robert Scollay, Regional trade agreements and developing countries: The case of
the Pacific Islands’ proposed free trade agreement, 2001, 45 p. Sales No. E.01.II.D.16.
No. 11 Robert Scollay and John Gilbert, An integrated approach to agricultural trade and
development issues: Exploring the welfare and distribution issues, 2001, 43 p. Sales No. E.01.II.D.15.
No. 12 Marc Bacchetta and Bijit Bora, Post-Uruguay round market access barriers for
industrial products, 2001, 50 p. Sales No. E.01.II.D.23.
No. 13 Bijit Bora and Inge Nora Neufeld, Tariffs and the East Asian financial crisis, 2001, 30 p. Sales No. E.01.II.D.27.
30
No. 14 Bijit Bora, Lucian Cernat, Alessandro Turrini, Duty and quota-free access for
LDCs: Further evidence from CGE modelling, 2002, 130 p. Sales No. E.01.II.D.22.
No. 15 Bijit Bora, John Gilbert, Robert Scollay, Assessing regional trading arrangements
in the Asia-Pacific, 2001, 29 p. Sales No. E.01.II.D.21.
No. 16 Lucian Cernat, Assessing regional trade arrangements: Are South-South RTAs
more trade diverting?, 2001, 24 p. Sales No. E.01.II.D.32.
No. 17 Bijit Bora, Trade related investment measures and the WTO: 1995-2001, 2002.
No. 18 Bijit Bora, Aki Kuwahara, Sam Laird, Quantification of non-tariff measures, 2002, 42 p. Sales No. E.02.II.D.8.
No. 19 Greg McGuire, Trade in services – Market access opportunities and the benefits
of liberalization for developing economies, 2002, 45 p. Sales No. E.02.II.D.9.
No. 20 Alessandro Turrini, International trade and labour market performance: Major
findings and open questions, 2002, 30 p. Sales No. E.02.II.D.10.
No. 21 Lucian Cernat, Assessing south-south regional integration: Same issues, many
metrics, 2003, 32 p. Sales No. E.02.II.D.11.
No. 22 Kym Anderson, Agriculture, trade reform and poverty reduction: Implications
for Sub-Saharan Africa, 2004, 30 p. Sales No. E.04.II.D.5.
No. 23 Ralf Peters and David Vanzetti, Shifting sands: Searching for a compromise in the
WTO negotiations on agriculture, 2004, 46 p. Sales No. E.04.II.D.4.
No. 24 Ralf Peters and David Vanzetti, User manual and handbook on Agricultural
Trade Policy Simulation Model (ATPSM), 2004, 45 p. Sales No. E.04.II.D.3.
No. 25 Khalil Rahman, Crawling out of snake pit: Special and differential treatment and
post-Cancun imperatives, 2004.
No. 26 Marco Fugazza, Export performance and its determinants: Supply and demand
constraints, 2004, 57 p. Sales No. E.04.II.D.20.
No. 27 Luis Abugattas, Swimming in the spaghetti bowl: Challenges for developing
countries under the “New Regionalism”, 2004, 30 p. Sales No. E.04.II.D.38.
No. 28 David Vanzetti, Greg McGuire and Prabowo, Trade policy at the crossroads – The
Indonesian story, 2005, 40 p. Sales No. E.04.II.D.40.
No. 29 Simonetta Zarrilli, International trade in GMOs and GM products: National and
multilateral legal frameworks, 2005, 57 p. Sales No. E.04.II.D.41.
31
No. 30 Sam Laird, David Vanzetti and Santiago Fernández de Córdoba, Smoke and
mirrors: Making sense of the WTO industrial tariff negotiations, 2006, Sales No. E.05.II.D.16.
No. 31 David Vanzetti, Santiago Fernandez de Córdoba and Veronica Chau, Banana split:
How EU policies divide global producers, 2005, 27 p. Sales No. E.05.II.D.17.
No. 32 Ralf Peters, Roadblock to reform: The persistence of agricultural export
subsidies, 2006, 43 p. Sales No. E.05.II.D.18.
No. 33 Marco Fugazza and David Vanzetti, A South-South survival strategy: The
potential for trade among developing countries, 2006, 25 p.
No. 34 Andrew Cornford, The global implementation of Basel II: Prospects and
outstanding problems, 2006, 30 p.
No. 35 Lakshmi Puri, IBSA: An emerging trinity in the new geography of international
trade, 2007, 50 p.
No. 36 Craig VanGrasstek, The challenges of trade policymaking: Analysis,
communication and representation, 2008, 45 p.
No. 37 Sudip Ranjan Basu, A new way to link development to institutions, policies and
geography, 2008, 50 p.
No. 38 Marco Fugazza and Jean-Christophe Maur, Non-tariff barriers in computable
general equilibrium modelling, 2008, 25 p.
No. 39 Alberto Portugal-Perez, The costs of rules of origin in apparel: African
preferential exports to the United States and the European Union, 2008, 35 p.
32
United Nations publications may be obtained from bookstores and distributors throughout the world. Please consult your bookstore or write to:
United Nations Publications
All orders from North America, Latin America, the Caribbean and Asia and the Pacific
should be sent to: United Nations Publications Room DC2-853, 2 UN Plaza New York, NY 10017, USA Telephone: (212) 963-8302, Toll Free 1-800-253-9646 (North America only) Fax: (212) 963-3489 E-mail: [email protected]
Customers in Europe, Africa and the Middle East should send their orders to: Section des Ventes et Commercialisation Bureau E-4, CH-1211 Geneva 10, Switzerland Telephone: 41 (22) 917-2613/2614 Fax: 41 (22) 917-0027 E-mail: [email protected]
Since 1999, the Trade Analysis Branch of the Division on International Trade in Goods and Services, and Commodities of UNCTAD has been carrying out policy-oriented analytical work aimed at improving the understanding of current and emerging issues in international trade and development. In order to improve the quality of the work of the Branch, it would be useful to receive the views of readers on this and other similar publications. It would therefore be greatly appreciated if you could complete the following questionnaire and return to:
Trade Analysis Branch, DITCRm. E-8076
United Nations Conference on Trade and DevelopmentPalais des Nations
CH-1211 Geneva 10, Switzerland
1. Name and address of respondent (optional):
2. Which of the following describes your area of work?
Government Public enterprise
Private enterprise institution Academic or research
International organization Media
Not-for-profi t organization Other (specify) _________________
3. In which country do you work? _________________________________________
4. Did you fi nd this publication Very useful Of some use Li le use to your work?
5. What is your assessment of the contents of this publication? Excellent Good Adequate Poor
6. Other comments:
QUESTIONNAIRE
UNCTAD Study series on
POLICY ISSUES IN INTERNATIONAL TRADE
AND COMMODITIES
(Study series no. 39: The costs of rules of origin in apparel:African preferential exports to the United States and the European Union)
Readership Survey