The Costs of Bankruptcy: Chapter 7 Liquidation versus ...
51
THE JOURNAL OF FINANCE • VOL. LXI, NO. 3 • JUNE 2006 The Costs of Bankruptcy: Chapter 7 Liquidation versus Chapter 11 Reorganization ARTURO BRIS, IVO WELCH, and NING ZHU ∗ ABSTRACT Our paper explores a comprehensive sample of small and large corporate bankruptcies in Arizona and New York from 1995 to 2001. Bankruptcy costs are very heterogeneous and sensitive to the measurement method used. We find that Chapter 7 liquidations appear to be no faster or cheaper (in terms of direct expense) than Chapter 11 reor- ganizations. However, Chapter 11 seems to preserve assets better, thereby allowing creditors to recover relatively more. Our paper also provides a large number of further empirical regularities. OUR PAPER ANALYZES THE LARGEST SAMPLE OF CORPORATE bankruptcies to date. We research approximately 300 cases from the Arizona and New York federal bankruptcy courts from 1995 to 2001. These cases consist of (1) both publicly traded and privately held corporations, and (2) both Chapter 7 liquidations and Chapter 11 reorganizations. This sample is practically the entire population of unique corporate bankruptcies in these courts. Our paper’s primary objective is to measure how the two available bankruptcy procedures differ, especially but not only in terms of cost. We explore four vari- ables, namely: the change in the estate’s value during bankruptcy (a measure of indirect costs), the time spent in bankruptcy (another and more common measure of indirect costs), the expenses submitted to and approved by the bankruptcy court (a measure of direct costs), and the recovery rates for credi- tors and APR violations. Our most important findings are that Chapter 7 liq- uidations are not cheaper than Chapter 11 reorganizations, particularly after we control for endogenous self-selection of firms into bankruptcy procedure. Bankruptcy professionals (attorneys, accountants, trustees) regularly end up with most of the post-bankruptcy firm’s value in Chapter 7. ∗ Arturo Bris is at IMD Yale School of Management, and ECGI. Ivo Welch is at Brown Uni- versity Department of Economics and the National Bureau of Economics Research (NBER). Ning Zhu is at the University of California at Davis. We wish to thank our team of research assistants: Stephanie Mastrobuono, Carolina Velosa, Theresa Kwon, Vanessa Janowski, and Jennifer Gao. We also thank Ed Altman, Douglas Baird, Judge Samuel Bufford, Espen Eckbo, Hulya Eraslan, Rick Green, Edith Hotchkiss, Steven Kaplan, Edward Morrison, Dina Naples-Layish, David Scharfstein (our discussant at the American Finance Association meetings), and Alan Schwartz for their in- dividual comments. We thank seminar audiences at the American Finance Association, the Uni- versity of Southern California, New York University, Columbia University, the European Finance Association, Insead University, and the NBER. Finally, we thank both a terrific anonymous referee and Rick Green (the editor), who were willing to bear with us through mediocre earlier drafts. 1253
Transcript of The Costs of Bankruptcy: Chapter 7 Liquidation versus ...
THE JOURNAL OF FINANCE • VOL. LXI, NO. 3 • JUNE 2006
The Costs of Bankruptcy: Chapter 7 Liquidationversus Chapter 11 Reorganization
ARTURO BRIS, IVO WELCH, and NING ZHU∗
ABSTRACT
Our paper explores a comprehensive sample of small and large corporate bankruptciesin Arizona and New York from 1995 to 2001. Bankruptcy costs are very heterogeneousand sensitive to the measurement method used. We find that Chapter 7 liquidationsappear to be no faster or cheaper (in terms of direct expense) than Chapter 11 reor-ganizations. However, Chapter 11 seems to preserve assets better, thereby allowingcreditors to recover relatively more. Our paper also provides a large number of furtherempirical regularities.
OUR PAPER ANALYZES THE LARGEST SAMPLE OF CORPORATE bankruptcies to date. Weresearch approximately 300 cases from the Arizona and New York federalbankruptcy courts from 1995 to 2001. These cases consist of (1) both publiclytraded and privately held corporations, and (2) both Chapter 7 liquidations andChapter 11 reorganizations. This sample is practically the entire population ofunique corporate bankruptcies in these courts.
Our paper’s primary objective is to measure how the two available bankruptcyprocedures differ, especially but not only in terms of cost. We explore four vari-ables, namely: the change in the estate’s value during bankruptcy (a measureof indirect costs), the time spent in bankruptcy (another and more commonmeasure of indirect costs), the expenses submitted to and approved by thebankruptcy court (a measure of direct costs), and the recovery rates for credi-tors and APR violations. Our most important findings are that Chapter 7 liq-uidations are not cheaper than Chapter 11 reorganizations, particularly afterwe control for endogenous self-selection of firms into bankruptcy procedure.Bankruptcy professionals (attorneys, accountants, trustees) regularly end upwith most of the post-bankruptcy firm’s value in Chapter 7.
∗Arturo Bris is at IMD Yale School of Management, and ECGI. Ivo Welch is at Brown Uni-versity Department of Economics and the National Bureau of Economics Research (NBER). NingZhu is at the University of California at Davis. We wish to thank our team of research assistants:Stephanie Mastrobuono, Carolina Velosa, Theresa Kwon, Vanessa Janowski, and Jennifer Gao. Wealso thank Ed Altman, Douglas Baird, Judge Samuel Bufford, Espen Eckbo, Hulya Eraslan, RickGreen, Edith Hotchkiss, Steven Kaplan, Edward Morrison, Dina Naples-Layish, David Scharfstein(our discussant at the American Finance Association meetings), and Alan Schwartz for their in-dividual comments. We thank seminar audiences at the American Finance Association, the Uni-versity of Southern California, New York University, Columbia University, the European FinanceAssociation, Insead University, and the NBER. Finally, we thank both a terrific anonymous refereeand Rick Green (the editor), who were willing to bear with us through mediocre earlier drafts.
1253
1254 The Journal of Finance
Our paper challenges the conclusions of earlier literature that suggest thatbankruptcy costs are “modest.” Instead, we interpret the data as telling usthat bankruptcy costs are very heterogeneous. Moreover, bankruptcy costs aremeasurement sensitive. For example, the conclusions one draws depend onwhether one uses at-bankruptcy declared values or end-of-bankruptcy declaredvalues, whether one believes the value declarations filed by management, andwhether one reports means or medians. At the onset of bankruptcy, the eventualcosts are quite predictable and different across cases. The regression suggestsfitted values that range between 0% and 20% of assets.
Given that our study is the first to our knowledge that has access to acomplete sample of ordinary corporate bankruptcies, we indulge in an ex-ploration of bankruptcy-related variables. We uncover a number of interest-ing regularities—too numerous to list comprehensively here. For example,bankruptcy courts approve almost all requested expenses; the three phasesof Chapter 11 bankruptcies take about equally long; firm scale is stronglyrelated to the presence of a creditors’ committee, to the choice of Chap-ter, and to total and debtor bankruptcy expenses; firm scale is fairly unre-lated to percent value changes in bankruptcy, time needed to emerge frombankruptcy, and creditor recovery rates; the larger the management’s own-ership, the longer is the delay in filing a reorganization plan; the particularbankruptcy judge matters for APR violations and length of time in bankruptcy,but not recovery rates; and, creditor organization (bank presence, creditors’committee, number of creditors) and indebtedness often matters (but not in allregressions).
We review the literature in Section I and describe the data in Section II. Weexamine asset values changes in bankruptcy in Section III, bankruptcy dura-tion in Section IV, legal and administrative court-reported fees and creditorrecovery in Section V, and APR violations in Section VI. We take a brief look atthe role of courts and judges in Section VII, before we conclude in Section VIII.
I. Related Literature
Our paper is related to the literature that focuses on estimating the costsof two bankruptcy procedures: cash auction procedures (i.e., Chapter 7s) andnegotiation procedures (i.e., Chapter 11s).
With respect to Chapter 11 reorganizations, the literature offers mixed con-clusions, perhaps due to variation in sample sizes and sample periods. Pre-vious results mostly draw conclusions from the relatively small number ofpublic corporations. Warner (1977) finds that the direct costs of Chapter 11bankruptcy—compensation provided to lawyers, accountants, consultants, andexpert witnesses—for 11 railroads are about 4% of the market value of the firm1 year prior to default. Altman (1984) calculates these costs to be about 7.5% offirm value using a broader sample of 19 bankrupt companies from 1974 to 1978.Using 105 Chapter 11 cases from the Western District of Oklahoma, Ang, Chua,and McConnell (1982) report that administrative fees are about 7.5% of the to-tal liquidating value of the bankrupt corporation’s assets. Weiss (1990), Betker
Costs of Bankruptcy 1255
(1995), and Tashjian, Lease, and McConnell (1996) provide similar estimates,relying on samples of 31 public Chapter 11 firms, 75 public and private Chap-ter 11 firms, and 49 pre-packed Chapter 11 firms, respectively. Lubben (2000)calculates in his sample of 22 firms from 1994 that the cost of legal counselin Chapter 11 bankruptcy represents about 1.8% of the distressed firm’s totalassets, though it can be as high as 5% in some cases—in the average case, thedebtor spends $500,000 on lawyers, and creditors spend $230,000. LoPucki andDoherty (2004) examine professional fees in a sample of 48 cases from 1998 to2002, mostly from Delaware and New York. They report that professional feesare 1.4% of the debtor’s total assets at the beginning of the bankruptcy case.Our view from reading the literature is that it is divided. For example, Altman(1984), Hotchkiss (1995), and Weiss and Wruck (1998), among others, considerChapter 11 costs to be high, whereas Alderson and Betker (1995), Gilson (1997),and Maksimovic and Phillips (1998) consider costs to be low.
There is less evidence regarding bankruptcy-related cash auction systems.Pulvino (1998) examines commercial aircraft sales, and finds that asset firesales can depress asset values. Stromberg (2000) also finds that asset fire salesand resales to management can lead to striking inefficiencies in the cash auc-tion system. Lawless et al. (1994) and White (1984) find that bankruptcy costsconsumed a large fraction of pre-bankruptcy assets in small Chapter 7 casesbefore the 1994 Bankruptcy Reform Act.
The controversy is even more lively when it comes to APR violations and re-covery rates. Franks and Torous (1989) find that APR violations are frequent ina sample of 30 firms. Eberhart, Moore, and Roenfeldt (1990) and Betker (1995)confirm regular APR violations under Chapter 11, arguing that this may under-mine the efficiency of ex ante contracts. Such Chapter 11 violations—we docu-ment that on occasion judges have deliberately used them to punish parties—are in contrast to a strict APR adherence in Chapter 7 procedure. When it comesto recovery rates, Pulvino (1999) exploits a large sample of Chapter 7 and Chap-ter 11 filings by nine U.S. airlines (43 subsidiary or individual airplane sales inChapter 7 and 107 in Chapter 11) and finds that prices obtained in asset salesby firms reorganized under Chapter 11 are not greater than those obtained byChapter 7 firms. However, Pulvino does not report information on bankruptcycosts, and his sample is not representative of the typical bankruptcy. Our studyoffers the most comprehensive data for both Chapter 7 and Chapter 11 withinthe United State. Moreover, we examine various measures of bankruptcy costswith the same sample.
Some recent studies turn their attention to bankruptcy procedures outsidethe United States. Using a rich data set from Swedish bankruptcy courts,Stromberg (2000) cautions that the efficiency of the cash auction proceduremay be severely impaired by how the assets are auctioned. Eckbo and Thorburn(2002, 2003) show that both the outcome of the auction procedure and the re-sulting management turnover can vary dramatically, depending on CEO privatebenefits and the strategic role played by major creditors. Ravid and Sundgren(1998) find that the U.S. bankruptcy system is more efficient than the Finnishcode, which is essentially an auction procedure. In contrast, Thorburn (2000)
1256 The Journal of Finance
argues that the Swedish auction system is much faster and much cheaper thanthe U.S. Chapter 11 process.
Our conclusion that Chapter 7 liquidation has very little to offer unsecuredcreditors differs so markedly from Thorburn (2000) that elaboration is in order.Both studies explore bankruptcy procedures that are essentially cash auctions.Thorburn (2000) shows that the Swedish procedure has slightly higher directcosts than either Chapter 7 or Chapter 11 in the United States but Swedishbankruptcy takes only 2.4 months to complete, versus the 23 months we doc-ument for the U.S. Chapter 7 procedure. We find that unsecured creditors inChapter 7 rarely receive anything, although unsecured creditors in Chapter 11do recover about one-third to one-half of their claims. This is not attributableto differing degrees of indebtedness or firm size.
There are at least four possible explanations for the discrepancy betweenstudies. First, the majority of the Swedish bankrupt firms (74% of samplefirms in Thorburn (2000)) are sold as “going concerns,” whereby the appointedtrustees have to run the business until the case is closed. In this case, being timeconstrained and running multiple bankruptcies at the same time may motivatethe trustees to sell the bankrupt firm sooner rather than later. In contrast, U.S.firms in Chapter 7 cases usually cease as going concerns immediately after thetrustee takes over—the trustee’s major responsibility is to oversee and liqui-date the remaining assets rather than manage the bankrupt firm. Second, thespeed with which the Swedish trustees handle cases directly influences theirreputations and future employment opportunities (Stromberg (2000, p. 2647)).In contrast, U.S. trustees are neither judged nor compensated by the speedwith which they handle cases (U.S. Bankruptcy Code §326(a)). Third, SwedishBankruptcy Law forbids running the firm’s operations for more than 1 year,except under extraordinary circumstances and only if the court approves such(Stromberg (2000)). In contrast, the U.S. Code puts no limit on the length ofthe proceedings. Fourth, a myriad of other economic and noneconomic differ-ences between the two countries, ranging from judicial to cultural differences,influence the way in which bankruptcy happens.
II. Bankrupt Firm Characteristics
A. The Sample
Our sample consists of all corporate bankruptcies filed under Chapter 7and Chapter 11 between 1995 and 2001 in the Federal Bankruptcy Courts ofArizona (AZ) and Southern New York (NY) with sufficient data. Only these twocourts have made their past cases available on the Pacer (Public Access to CourtElectronic Records) service, which provides the full-text source for bankruptcydocuments. From 1995 to 2001, each court handled about 5,200 businessbankruptcies, which places both of them around rank 15 among the 94 U.S.bankruptcy courts. About half of all bankruptcy cases are routinely dismissedor transferred to other courts shortly after filing—we omit such cases. Fur-ther, we delete about 2,000 cases that are subsidiaries of one company, rather
Costs of Bankruptcy 1257
than individual bankruptcy cases. We also exclude bankruptcies designated as“pre-packs,” which can take as little as 2 weeks to resolve. After eliminatingand consolidating such cases, there are “only” 225 unique corporate Chapter 11cases and “only” 61 unique corporate Chapter 7 cases. We believe this is thelargest and most comprehensive sample of corporate bankruptcies assembledfor an academic paper. We note, however, that the sample period unfortunatelydoes not include a recession.
Our Chapter 11 sample is roughly equally split across NY (117 cases) andAZ (108 cases), but there are more Chapter 7 cases in NY (50 cases) than in AZ(11 cases). As of late 2004, eleven Chapter 11 cases in AZ had not yet closed.When required, we estimate the remaining duration from bankruptcy casesthat had taken at least as long, but had already closed. Our results reportedbelow—especially the inference about time in bankruptcy—do not change if wesimply winsorize these cases as if they were closed at the end of our sample orif we omit them.
All data are hand coded from the full bankruptcy documents. Although theforms are standardized, each firm reported its information in a different for-mat. Some firms did not even report basic data, such as assets, despite a legalrequirement to do so. In some cases, we have no choice but to discard the entireobservation. In other cases, we can use an observation in some tests, but not inothers.
To summarize, our database is quite comprehensive and tracks firm historyfrom bankruptcy filing through September 2004. This database provides infor-mation on firm characteristics, creditor characteristics, judge characteristicsand behavior, expenses, duration of proceedings, recovery rates, frequency ofAPR violations, and case outcome. Because we cannot possibly hope to describehere all interesting correlations in our data, we make our database publiclyavailable to researchers, so that any interested reader can recompute the rele-vant statistics.
B. Pre-bankruptcy Firm Characteristics
Table I describes the characteristics of our firms as they entered bankruptcy.The median Chapter 11 bankruptcy is about 10 times as large as the medianChapter 7 bankruptcy—the mean difference is greater because the sample con-tains some extremely large Chapter 11 cases. (Subsequent results are equallyweighted to not place too much weight on such firms.) Differences in indebted-ness are surprisingly modest—the typical Chapter 7 case is no more underwaterthan the typical Chapter 11 case. Chapter 11 firms seem to have more secureddebt, but the median fraction of secured creditors is the same. (Two Chapter 7and two Chapter 11 cases had exclusively secured debt; 44 Chapter 11 casesand 20 Chapter 7 cases had exclusively unsecured debt.) The median Chapter11 firm—much larger in terms of assets—has about twice as many creditors asthe median Chapter 7 firm. In our Chapter 7 cases, at least one bank is amongsecured creditors in 31% of our cases and among unsecured creditors in 37%of our cases. In our Chapter 11 cases, a bank is among secured creditors in

1258 The Journal of Finance
Table IDescriptive Statistics
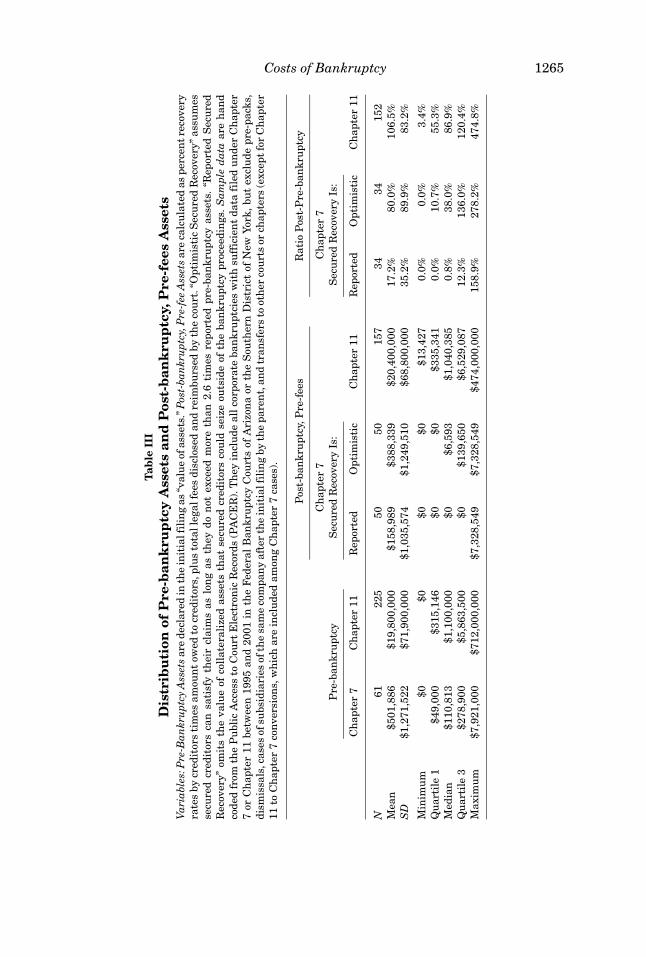
Sample data are handcoded from the Public Access to Court Electronic Records (PACER). Theyinclude all corporate bankruptcies with sufficient data filed under Chapter 7 or Chapter 11 between1995 and 2001 in the Federal Bankruptcy Courts of Arizona or the Southern District of NewYork, but exclude pre-packs, dismissals, cases of subsidiaries of the same company after the initialfiling by the parent, and transfers to other courts or chapters (except for Chapter 11 to Chapter 7conversions, which are included among Chapter 7 cases).
N Mean SD Min Median Max
Pre-bankruptcy Chapter 7 61 $501,886 $1,271,522 $0 $110,813 $7,921,000assets Chapter 11 225 $19,800,000 $71,900,000 $0 $1,200,000 $712,000,000
Debt/assets ratio Chapter 7 56 5.37 12.81 0.09 1.68 88.96Chapter 11 221 5.71 30.20 0.01 1.25 370.15
Secured debt to Chapter 7 36 37.03% 42.22% 0% 12.30% 100%total debt ratio Chapter 11 222 47.64% 36.52% 0% 45.94% 100%
Total number of Chapter 7 58 27 33 0 12 158creditors Chapter 11 216 159 538 1 23 5004
% of secured Chapter 7 58 4.56% 4.88% 0% 8.70% 5.06%creditors Chapter 11 216 4.49% 10.53% 0% 8.70% 16.29%
Secured debt Chapter 7 45 31.11% 46.82% 0 0 1includesbanks (Y/N) Chapter 11 176 36.93% 48.40% 0 0 1
Unsecured debt Chapter 7 46 36.96% 48.80% 0 0 1includesbanks (Y/N) Chapter 11 176 18.18% 38.68% 0 0 1
Equity owned Chapter 7 61 32.19% 44.31% 0% 0% 100%by managers Chapter 11 225 42.59% 45.27% 0% 20% 100%
37% of our cases, and among unsecured creditors in 18% of our cases.1 Finally,managers tend to own more equity in Chapter 11 cases than in Chapter 7 cases.Though not reported here, AZ and NY cases tend to be similar in terms of thevariables reported in Table I.
C. Determinants of Choice of Procedure
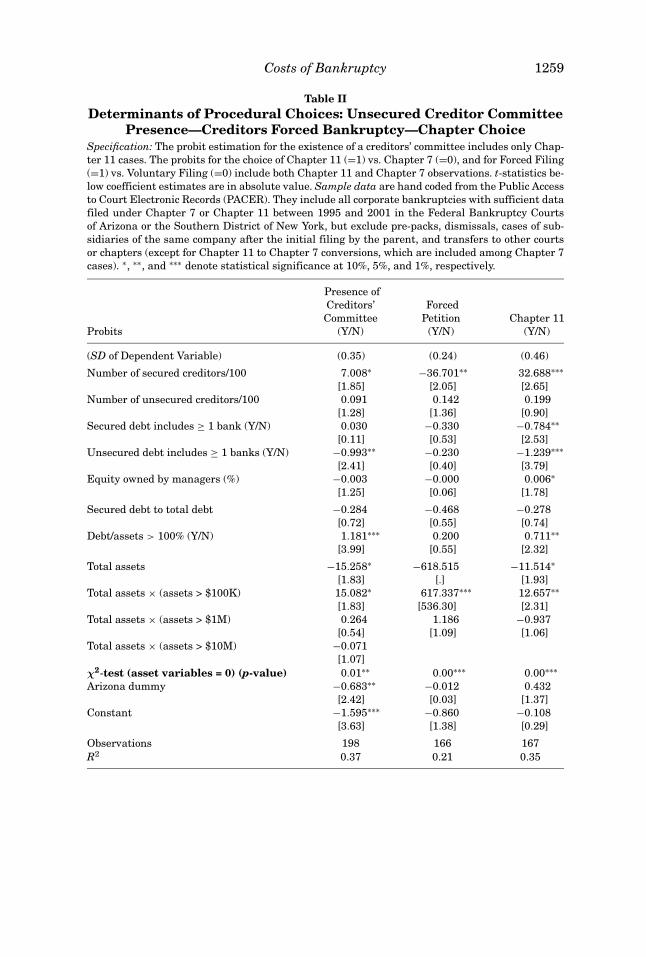
Table II investigates whether firms systematically begin their bankruptciesdifferently in terms of three binary choices: whether they work with an unse-cured creditors’ committee, whether they file voluntarily, and whether they filefor Chapter 7 (vs. Chapter 11). These choices are endogenous, and self-selection
1 This masks the fact that banks are usually the secured and senior creditor (see Welch (1997)).In Chapter 11 (Chapter 7), of 176 (24) sample cases with both secured and unsecured credit, 39(2) had a bank among the secured creditors, and 7 (5) had a bank among unsecured creditors. Tocomplete the picture, 75 (9) had both secured and unsecured creditors but no banks; 55 (8) hadboth secured and unsecured creditors both including a bank.
Costs of Bankruptcy 1259
Table IIDeterminants of Procedural Choices: Unsecured Creditor Committee
Presence—Creditors Forced Bankruptcy—Chapter ChoiceSpecification: The probit estimation for the existence of a creditors’ committee includes only Chap-ter 11 cases. The probits for the choice of Chapter 11 (=1) vs. Chapter 7 (=0), and for Forced Filing(=1) vs. Voluntary Filing (=0) include both Chapter 11 and Chapter 7 observations. t-statistics be-low coefficient estimates are in absolute value. Sample data are hand coded from the Public Accessto Court Electronic Records (PACER). They include all corporate bankruptcies with sufficient datafiled under Chapter 7 or Chapter 11 between 1995 and 2001 in the Federal Bankruptcy Courtsof Arizona or the Southern District of New York, but exclude pre-packs, dismissals, cases of sub-sidiaries of the same company after the initial filing by the parent, and transfers to other courtsor chapters (except for Chapter 11 to Chapter 7 conversions, which are included among Chapter 7cases). ∗, ∗∗, and ∗∗∗ denote statistical significance at 10%, 5%, and 1%, respectively.
Presence ofCreditors’ ForcedCommittee Petition Chapter 11
Probits (Y/N) (Y/N) (Y/N)
(SD of Dependent Variable) (0.35) (0.24) (0.46)
Number of secured creditors/100 7.008∗ −36.701∗∗ 32.688∗∗∗[1.85] [2.05] [2.65]
Number of unsecured creditors/100 0.091 0.142 0.199[1.28] [1.36] [0.90]
Secured debt includes ≥ 1 bank (Y/N) 0.030 −0.330 −0.784∗∗[0.11] [0.53] [2.53]
Unsecured debt includes ≥ 1 banks (Y/N) −0.993∗∗ −0.230 −1.239∗∗∗[2.41] [0.40] [3.79]
Equity owned by managers (%) −0.003 −0.000 0.006∗[1.25] [0.06] [1.78]
Secured debt to total debt −0.284 −0.468 −0.278[0.72] [0.55] [0.74]
Debt/assets > 100% (Y/N) 1.181∗∗∗ 0.200 0.711∗∗[3.99] [0.55] [2.32]
Total assets −15.258∗ −618.515 −11.514∗[1.83] [.] [1.93]
Total assets × (assets > $100K) 15.082∗ 617.337∗∗∗ 12.657∗∗[1.83] [536.30] [2.31]
Total assets × (assets > $1M) 0.264 1.186 −0.937[0.54] [1.09] [1.06]
Total assets × (assets > $10M) −0.071[1.07]
χ2-test (asset variables = 0) (p-value) 0.01∗∗ 0.00∗∗∗ 0.00∗∗∗Arizona dummy −0.683∗∗ −0.012 0.432
[2.42] [0.03] [1.37]Constant −1.595∗∗∗ −0.860 −0.108
[3.63] [1.38] [0.29]
Observations 198 166 167R2 0.37 0.21 0.35
1260 The Journal of Finance
could contaminate our later attempts to determine the influence of other vari-ables on procedural costs and outcome. Thus, in later regressions, we controlfor the self-selection into bankruptcy chapter (Chapter 7 or Chapter 11). Wealso experiment with endogeneity control for the other two choices (committeeand who filed), but this ultimately matters little, so we do not report the relatedresults.
Creditors’ Committee. The court appointed a committee to represent unse-cured creditors in 45 out of our 225 Chapter 11 cases. The left probit investigatesthe formation of a creditors’ committee, which represents unsecured creditors.Under §1102 and §1103 of the Code, the trustee shall appoint a committee ofcreditors consisting of the persons that had the seven largest claims againstthe debtor. The committee has the right to employ attorneys, accountants, andother experts, and to request reimbursement from the court. Table II showsthat the formation of a committee is reasonably predictable, with an R2 of 37%.Firms with large scale (assets), firms in NY, firms without a bank among theunsecured debt (which could conceivably represent the unsecured creditors tothe court), and very underwater firms tend to form creditors committees.
Petition Source. Under §301(a) of the Code, creditors can force bankruptcy if atleast three secured creditors are out of money. Their claims must aggregate to atleast $10,000 more than the value of any lien on property of the debtor securingsuch claims in order for an involuntary petition to be eligible for filing by thesecreditors. If there are fewer than 12 secured creditors, the petition can be filed byone or more of such holders who holds in the aggregate at least $10,000 of suchclaims. Therefore, under the bankruptcy code, forced filings are only possiblewhen secured creditors are sufficiently concentrated. In our sample, 161 out of166 of our bankruptcies were filed “voluntarily” by the firm (presumably undercreditor threat), rather than forced by creditors. Our middle probit predictswhether some variables change this propensity. Only two variables stand out:our five forced firms were relatively smaller ($1.5 million on average) and hadfewer secured creditors.
Bankruptcy Chapter. The focus of our paper is the most important choice ofa bankrupt firm—whether to file for Chapter 7 or Chapter 11. If firms identifi-ably self-select, then it could be misleading to compare the cost of procedures,without controlling for endogeneity of chapter choice. The right probit showsthat the choice of procedure is indeed correlated with a number of identifiablefirm characteristics.
In the text, we often report the standardized beta coefficient for regressionvariables, and use this to gauge the relative importance of different variables(provided we have statistical significance). We multiply the estimated coeffi-cient by the standard deviation of the independent variable, and divide it bythe standard deviation of the dependent variable. The resulting number mea-sures what fraction of the range of the dependent variable is implied to beexplained by the range of the independent variable. The standardized beta isone among a number of reasonable measures of economic significance.
Listing the variables that help predict the choice of procedure, in rough orderof importance:
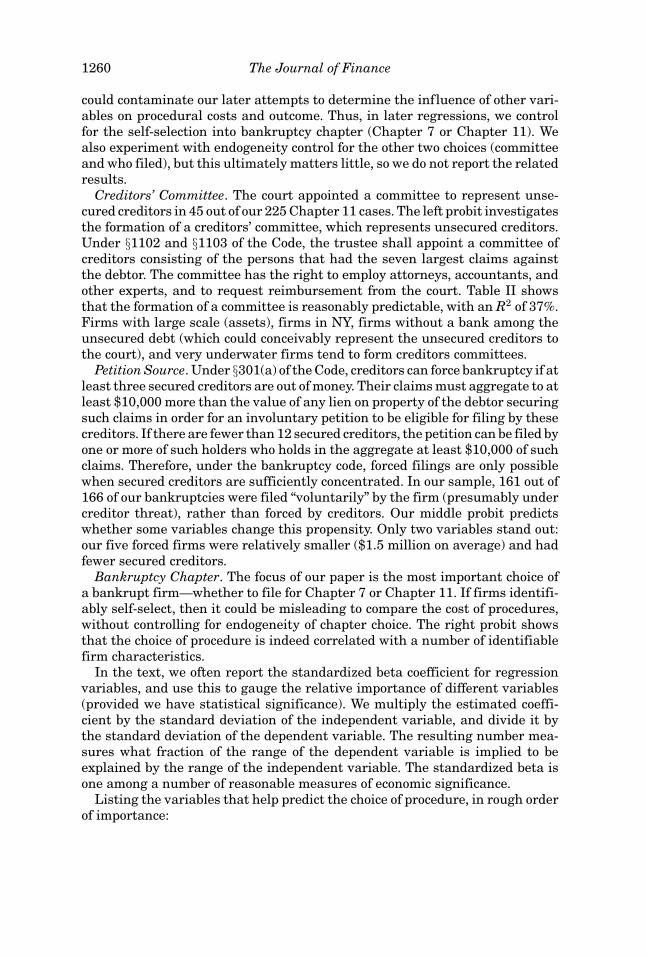
Costs of Bankruptcy 1261� Firms are more likely to file for Chapter 11 when they are not tiny. Forassets above $100,000, estimated coefficients need to be added to ascer-tain size. The propensity to reorganize is thus strongest in the $100,000 to$1 million category, and is still positive but diminishing when assets areabove $1 million. (Reducing the number and type of asset controls makesno difference in later results.)� Although Chapter 11 cases are larger, there is considerable overlap—fromthe perspective of asset scale, a good number of firms could have choseneither procedure. This is even easier to see in Figure 1 below.� Firms that have a large number of secured creditors are more likely to filefor Chapter 11 reorganization than Chapter 7 liquidation (standardizedbeta, 240%). This could point to coordination problems among creditors,with debtors recognizing that Chapter 11 could overcome this type of ob-stacle and result in a viable reorganized firm after bankruptcy.
10 100 1000 10000 100000
1100
10000
Assets at Bankruptcy–Start
1 +
Ass
ets
at B
ankr
uptc
y–E
nd, befo
re F
ees
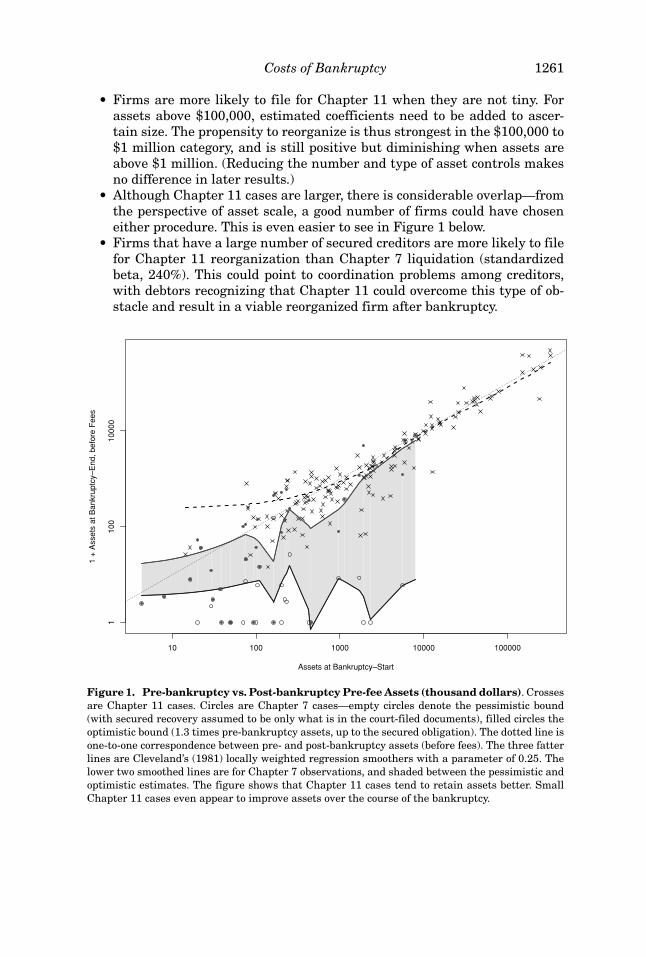
Figure 1. Pre-bankruptcy vs. Post-bankruptcy Pre-fee Assets (thousand dollars). Crossesare Chapter 11 cases. Circles are Chapter 7 cases—empty circles denote the pessimistic bound(with secured recovery assumed to be only what is in the court-filed documents), filled circles theoptimistic bound (1.3 times pre-bankruptcy assets, up to the secured obligation). The dotted line isone-to-one correspondence between pre- and post-bankruptcy assets (before fees). The three fatterlines are Cleveland’s (1981) locally weighted regression smoothers with a parameter of 0.25. Thelower two smoothed lines are for Chapter 7 observations, and shaded between the pessimistic andoptimistic estimates. The figure shows that Chapter 11 cases tend to retain assets better. SmallChapter 11 cases even appear to improve assets over the course of the bankruptcy.
1262 The Journal of Finance� Firms in which a bank is a creditor—especially an unsecured creditor—aremore likely to choose liquidation over reorganization (standardized beta,130%). This is consistent with the view that pre-bankruptcy negotiationsare more likely to occur when the main creditor is a bank, and this bankhas already shown itself unwilling to compromise.� Firms that are more underwater tend to prefer Chapter 11 reorganizationover Chapter 7 liquidation (standardized beta, 80%). This could imply thatfirms not underwater that filed for Chapter 7 did so under economic, ratherthan financial, distress.
We use this probit regression as a first-stage control for endogenousself-selection in subsequent “treatment” and “Heckman (1979)” second-stageregressions. We also experiment with first-stage probits that rely on fewer, morecarefully chosen variables, and with probits that focus only on observationsused in a particular second-stage regression. Such first-stage variations makelittle or no difference in the second-stage regression results reported below. (Inretrospect, this is not surprising. Regressions are fairly robust to endogeneityin terms of coefficient estimates other than the coefficient estimate of the spe-cific first-stage procedural choice variable itself. This is the case in Heckman(1979), and such is the case here.)
III. Indirect Bankruptcy Cost: Reported AssetValue Changes during Bankruptcy
A. Descriptive Statistics
Upon entering bankruptcy, firms must fill out a standard form with decla-rations of their business outlook and financial situations, specifically their as-sets. (Debtors later collect more information, including more detailed financialstatements.) Many firms exercise discretion in filling out the form. For instance,some firms report values excluding intangible assets, while other firms includethem. Moreover, the reported numbers are not necessarily market values—especially for intangible assets, this could itself depend on whether the firmcontinues, is parceled up, or liquidated. (Unfortunately, we do not have datato distinguish between tangible and intangible assets.) Yet, these are the mostaccurate valuations available to academic research, so the reader must remaincognizant of their limitations.
At the end of bankruptcy, we again obtain information on firms’ valuesthrough the declaration of the distributions. Our exit valuations are the sum ofinterim and final expert fees and creditor recovery—some of these were explic-itly reported to be zero. (We never impute zero for missing or dubious values!)However, there is one important complication. In Chapter 11, when assets aresold, regardless of whether they are collateral, the cash returns to the estateand is thus recorded in the case. In Chapter 7, however, secured creditors canlay claim on their security, because continuation is not an argument that the
Costs of Bankruptcy 1263
firm can muster to resist seizure.2 For such direct asset seizures, both assetsand claims should not appear in the final Chapter 7 bankruptcy declaration.Moreover, we cannot track the seizures because such claims are only recordedin the local courthouse that corresponds to where the assets are located. Be-cause there is not even a central directory of where assets might be located,we cannot possibly trace them. Hence, we must consider the recorded Chapter7 distributed assets to secured creditors (and the post-Chapter 7 assets) as alower bound. For measuring at-exit values, our paper thus entertains two ver-sions for secured creditor recovery. The lower, pessimistic bound uses only therecorded distributions in bankruptcy. For an upper, very optimistic bound, wedouble the highest observed total distribution to secured creditors in Chapter7 (1.3 times the pre-bankruptcy assets). We therefore assume here that up to1.3 × 2 = 2.6 times reported pre-bankruptcy assets were available to satisfy(up to 100% of) the secured claims.3 In most but not all cases, this de facto as-sumes full satisfaction of secured claims. In contrast, the post-bankruptcy assetvalues and therefore recovery statistics for unsecured creditors are at least astrustworthy for Chapter 7 cases as they are for Chapter 11 cases.
The change in firm value during bankruptcy is interesting for two reasons.First, it can be considered a noisy measure of the indirect cost of bankruptcy.Second, earlier research typically measures legal fees as a fraction of reportedassets upon entry into bankruptcy. However, such fees may appear relativelysmall either if at-entry bankruptcy assets are overstated, or if the bankruptcy it-self dissipates assets rapidly—in which case, not much may be left to distributein fees.
The left columns in Table III show that the median Chapter 11 case entersbankruptcy about 10 times larger than the typical Chapter 7 case. (The meanassets are 40 times larger.) The 75th percentile of Chapter 7 cases is aboutthe same size as the 25th percentile of Chapter 11 cases. The middle columnsshow that total assets at the conclusion of bankruptcy, available to satisfy both
2 When a firm enters bankruptcy, there is an automatic stay of all collection efforts, includingforeclosure of liens. A creditor can move to vacate the stay. The two principal criteria for vacationof a stay of secured creditor collection are: (a) the debtor has no equity in the collateral; and(b) the collateral is not necessary for an effective reorganization. A debtor in Chapter 7 has nochance to survive, and thus criterion (b) is always satisfied for Chapter 7. Regarding (a), if there isequity above the value of the secured creditor’s lien, the trustee will sell the collateral and remitthe average to general creditors. If there is no equity, criterion (a) is satisfied and the creditorforecloses. Because Chapter 7 debtors usually have no equity in the collateral (Table I shows thatthe median equity holdings of management ownership in Chapter 11 cases is zero; equity holdings ofmanagement is the only equity information for which we have reliable information), there usuallyis no secured property to be listed in an asset schedule. In contrast, in Chapter 11, for obviousreasons, the stay is commonly not vacated. And if the firm emerges, the secured creditor’s liencontinues (or it is given new debt), but the property usually stays.
3 If one assumes 100% recovery for secured creditors, our results are robust—after eliminatingone case, in which secured creditors were owed $169 million and the firm recorded $7.9 million inpre-bankruptcy assets and $7.3 million in secured payout, that is, where 100% assumed recoverywould come to 90 times the assets. Not reported: Our results also hold up if we winsorize dependentand independent variables at reasonable levels.
1264 The Journal of Finance
experts and creditors, are considerably smaller than assets upon entry intobankruptcy for Chapter 7 cases. The right columns show that even assumingour overly optimistic secured recovery rate, Chapter 7 assets drop by at least20% in mean and 62% in median. Assuming our overly pessimistic reported-onlycreditor recovery, the median Chapter 7 dissipates substantially all its assets,even before any fees are paid. In contrast, our Chapter 11 cases report thatthey exited bankruptcy with assets that were pretty similar to those reportedupon entry into bankruptcy. The median value change is −13%; the mean valuechange is +7%. (Not reported, there is no obvious scale difference between casesfiled in NY and AZ.)
Of course, firms, lawyers, unsecured creditors, and managers—though notthe secured creditors—have incentives to overstate assets at Chapter 11 exit.Because it is not clear how accurate Chapter 11 post-bankruptcy values are,and because we suspect some value padding at bankruptcy exit, we try totrack the firms. For our 225 Chapter 11 cases, we cannot locate 64 firms af-ter bankruptcy. Of the remaining 161 firms, 11 still remained in the originalbankruptcy process. Thus, we can determine the eventual fate of about 150Chapter 11s: 15 firms emerged and later filed for Chapter 7, 53 were later liq-uidated, 78 continued as independent companies, 3 merged, and 1 refiled forChapter 11. Thus, despite gaining value in Chapter 11, only about half of ourChapter 11 firms seem to ultimately survive healthy. We consider this to be amild indication that the Chapter 11 exit values are optimistic.4
Figure 1 plots Chapter 7 and Chapter 11 assets before and after bankruptcy.The figure shows that the pessimistic lower bound for Chapter 7 cases is uni-formly such that post-bankruptcy values are less than pre-bankruptcy, withone exception for the highest valued Chapter 7 case.5 Even if we use the upperbound—our optimistic secured recovery, in which we gross up some observationsto twice the pre-bankruptcy asset values—the Chapter 7 value decline seemsworse than the Chapter 11 value decline. Equally remarkable to us, Chapter 11cases asset changes are very heterogeneous. However, a one-to-one correspon-dence on average between pre- and post-bankruptcy recorded assets is not anunreasonable assumption, especially for larger bankruptcies—even though inone outlying Chapter 11 case, post-bankruptcy assets were over 10 times pre-bankruptcy assets.6 There is also some regression to the meaning—the lowest
4 Kahl (2002) shows that in about one-third of the 102 firms in his sample of Chapter 11 cases,the firm survives as an independent company.
5 ES& US Corporation (Case NY-99-10280) is our largest Chapter 7 case, a real estate holdingcompany with one asset, a building at 34–36 West 32nd Street in New York. Its bankruptcy startedout as a Chapter 11, but the secured creditors managed to convince Judge Gallet that the companyhad no good reorganization plan. It was therefore converted into a Chapter 7 bankruptcy, in whichthe secured creditors received the building, and were therefore fully satisfied. It is the only Chapter7 case for which we find post-bankruptcy assets equal to pre-bankruptcy assets.
6 Quick Interiors (Case NY-97-45020) had declared assets of $76,484 at bankruptcy entry. Oddly,secured creditors were owed $129,064 and were paid in full. Further, fees of $677,105 were paid,mostly to the creditors’ committee. This again makes it clear how important it is to check robustnessof results, winsorize, etc.
Costs of Bankruptcy 1265
Tab
leII
ID
istr
ibu
tion
ofP
re-b
ank
rup
tcy
Ass
ets
and
Pos
t-b
ank
rup
tcy,
Pre
-fee
sA
sset
sV
aria
bles
:Pre
-Ban
kru
ptcy
Ass
ets
are
decl
ared
inth
ein
itia
lfil
ing
as“v
alu
eof
asse
ts.”
Pos
t-ba
nkr
upt
cy,P
re-f
eeA
sset
sar
eca
lcu
late
das
perc
entr
ecov
ery
rate
sby
cred
itor
sti
mes
amou
nt
owed
tocr
edit
ors,
plu
sto
tall
egal
fees
disc
lose
dan
dre
imbu
rsed
byth
eco
urt
.“O
ptim
isti
cS
ecu
red
Rec
over
y”as
sum
esse
cure
dcr
edit
ors
can
sati
sfy
thei
rcl
aim
sas
lon
gas
they
don
otex
ceed
mor
eth
an2.
6ti
mes
repo
rted
pre-
ban
kru
ptcy
asse
ts.
“Rep
orte
dS
ecu
red
Rec
over
y”om
its
the
valu
eof
coll
ater
aliz
edas
sets
that
secu
red
cred
itor
sco
uld
seiz
eou
tsid
eof
the
ban
kru
ptcy
proc
eedi
ngs
.S
ampl
ed
ata
are
han
dco
ded
from
the
Pu
blic
Acc
ess
toC
ourt
Ele
ctro
nic
Rec
ords
(PA
CE
R).
Th
eyin
clu
deal
lcor
pora
teba
nkr
upt
cies
wit
hsu
ffic
ien
tda
tafi
led
un
der
Ch
apte
r7
orC
hap
ter
11be
twee
n19
95an
d20
01in
the
Fed
eral
Ban
kru
ptcy
Cou
rts
ofA
rizo
na
orth
eS
outh
ern
Dis
tric
tof
New
York
,bu
tex
clu
depr
e-pa
cks,
dism
issa
ls,c
ases
ofsu
bsid
iari
esof
the
sam
eco
mpa
ny
afte
rth
ein
itia
lfil
ing
byth
epa
ren
t,an
dtr
ansf
ers
toot
her
cou
rts
orch
apte
rs(e
xcep
tfo
rC
hap
ter
11to
Ch
apte
r7
con
vers
ion
s,w
hic
har
ein
clu
ded
amon
gC
hap
ter
7ca
ses)
.
Pos
t-ba
nkr
upt
cy,P
re-f
ees
Rat
ioP
ost-
Pre
-ban
kru
ptcy
Ch
apte
r7
Ch
apte
r7
Pre
-ban
kru
ptcy
Sec
ure
dR
ecov
ery
Is:
Sec
ure
dR
ecov
ery
Is:
Ch
apte
r7
Ch
apte
r11
Rep
orte
dO
ptim
isti
cC
hap
ter
11R
epor
ted
Opt
imis
tic
Ch
apte
r11
N61
225
5050
157
3434
152
Mea
n$5
01,8
86$1
9,80
0,00
0$1
58,9
89$3
88,3
39$2
0,40
0,00
017
.2%
80.0
%10
6.5%
SD
$1,2
71,5
22$7
1,90
0,00
0$1
,035
,574
$1,2
49,5
10$6
8,80
0,00
035
.2%
89.9
%83
.2%
Min
imu
m$0
$0$0
$0$1
3,42
70.
0%0.
0%3.
4%Q
uar
tile
1$4
9,00
0$3
15,1
46$0
$0$3
35,3
410.
0%10
.7%
55.3
%M
edia
n$1
10,8
13$1
,100
,000
$0$6
,593
$1,0
40,3
850.
8%38
.0%
86.9
%Q
uar
tile
3$2
78,9
00$5
,863
,500
$0$1
39,6
50$6
,529
,087
12.3
%13
6.0%
120.
4%M
axim
um
$7,9
21,0
00$7
12,0
00,0
00$7
,328
,549
$7,3
28,5
49$4
74,0
00,0
0015
8.9%
278.
2%47
4.8%
1266 The Journal of Finance
pre-bankruptcy asset Chapter 11 cases tend to end up with relatively moreassets post-bankruptcy.
Our first conclusion is that this evidence does not suggest that Chapter 7cases are better at retaining value throughout the bankruptcy process thanChapter 11 cases. There are a number of possible explanations. First, Chapter 7liquidations could be fire sales at the wrong time (as in Shleifer and Vishny(1992)). However, this is not consistent with the fact that the typical Chapter 7case takes 2 years to unwind. Second, it could be that Chapter 11 firms are morepessimistic in estimating firm value at bankruptcy entry—although there is noex ante reason to believe this. Third, Chapter 11 firms could be more optimisticin estimating firm value at bankruptcy exit, which is in the interest of some, butnot all parties, and for which we provide some anecdotal evidence (poor ultimatecorporate survivorship) above. Fourth, a combination of the preceding factorscould be at work. Without an independent and unbiased value assessment,these causes cannot be disentangled.
Our second conclusion will be that the measurement of the estate value inbankruptcy—and therefore the measurement of fees as a fraction of the estatevalue, as we show below—is sensitive to specification and sample.
B. Determinants
In this section, we try to answer the following questions: How well do firmshold their value during the bankruptcy process before we subtract the directbankruptcy costs? Is the poor performance of Chapter 7 cases due to differencesin firm type or due to measurable factors? Or is the performance just equallybad in all bankruptcies?
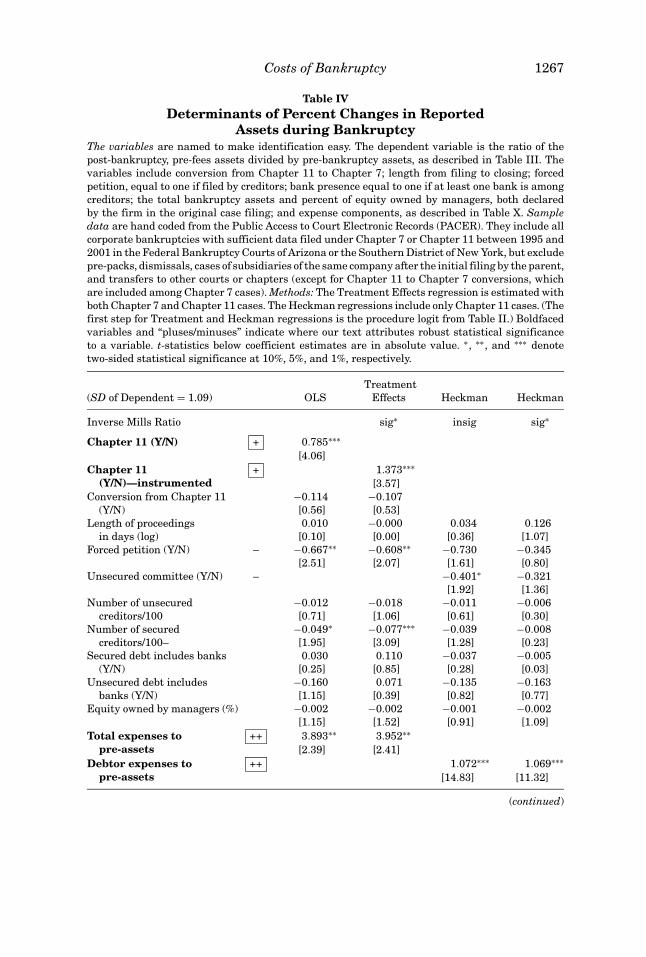
Table IV introduces our reporting format for second-stage regressions. Weattempt to entertain the same set of regressors in all regressions. As indepen-dent variables, we usually include: multiple nonlinear controls for assets; thedegree to which the firm is underwater; the fraction of debt that is secured;the number of creditors, both secured and unsecured; the presence of a bankamong creditors, secured or unsecured; the presence of a creditors’ committee;7
whether the firm or creditors initiate bankruptcy; and the jurisdiction. In theright-most Heckman regressions, we also control for fixed effects caused bydifferences in judges.
Our most interesting variables relate to the observed choice of procedure.The left-most regression is simple ordinary least squares (OLS), which ignoresself-selection but does include the actual choice of chapter as a dummy. Thecoefficient measures both the influence of the procedure itself, and the dif-ferences between firms that choose Chapter 7 and firms that choose Chap-ter 11—the self-sorting effect. The remaining three regressions seek to disen-tangle these two effects by relying on the predictions from the procedural choice
7 These are creditor coordination measures. The number of unsecured creditors matters less thanthe number of secured creditors because unsecured creditors are often syndicated in a creditors’committee and therefore can behave as a single creditor.
Costs of Bankruptcy 1267
Table IVDeterminants of Percent Changes in Reported
Assets during BankruptcyThe variables are named to make identification easy. The dependent variable is the ratio of thepost-bankruptcy, pre-fees assets divided by pre-bankruptcy assets, as described in Table III. Thevariables include conversion from Chapter 11 to Chapter 7; length from filing to closing; forcedpetition, equal to one if filed by creditors; bank presence equal to one if at least one bank is amongcreditors; the total bankruptcy assets and percent of equity owned by managers, both declaredby the firm in the original case filing; and expense components, as described in Table X. Sampledata are hand coded from the Public Access to Court Electronic Records (PACER). They include allcorporate bankruptcies with sufficient data filed under Chapter 7 or Chapter 11 between 1995 and2001 in the Federal Bankruptcy Courts of Arizona or the Southern District of New York, but excludepre-packs, dismissals, cases of subsidiaries of the same company after the initial filing by the parent,and transfers to other courts or chapters (except for Chapter 11 to Chapter 7 conversions, whichare included among Chapter 7 cases). Methods: The Treatment Effects regression is estimated withboth Chapter 7 and Chapter 11 cases. The Heckman regressions include only Chapter 11 cases. (Thefirst step for Treatment and Heckman regressions is the procedure logit from Table II.) Boldfacedvariables and “pluses/minuses” indicate where our text attributes robust statistical significanceto a variable. t-statistics below coefficient estimates are in absolute value. ∗, ∗∗, and ∗∗∗ denotetwo-sided statistical significance at 10%, 5%, and 1%, respectively.
Treatment(SD of Dependent = 1.09) OLS Effects Heckman Heckman
Inverse Mills Ratio sig∗ insig sig∗
Chapter 11 (Y/N) + 0.785∗∗∗
[4.06]Chapter 11
(Y/N)—instrumented+ 1.373∗∗∗
[3.57]Conversion from Chapter 11
(Y/N)−0.114 −0.107[0.56] [0.53]
Length of proceedingsin days (log)
0.010 −0.000 0.034 0.126[0.10] [0.00] [0.36] [1.07]
Forced petition (Y/N) – −0.667∗∗ −0.608∗∗ −0.730 −0.345[2.51] [2.07] [1.61] [0.80]
Unsecured committee (Y/N) – −0.401∗ −0.321[1.92] [1.36]
Number of unsecuredcreditors/100
−0.012 −0.018 −0.011 −0.006[0.71] [1.06] [0.61] [0.30]
Number of securedcreditors/100–
−0.049∗ −0.077∗∗∗ −0.039 −0.008[1.95] [3.09] [1.28] [0.23]
Secured debt includes banks(Y/N)
0.030 0.110 −0.037 −0.005[0.25] [0.85] [0.28] [0.03]
Unsecured debt includesbanks (Y/N)
−0.160 0.071 −0.135 −0.163[1.15] [0.39] [0.82] [0.77]
Equity owned by managers (%) −0.002 −0.002 −0.001 −0.002[1.15] [1.52] [0.91] [1.09]
Total expenses topre-assets
++ 3.893∗∗ 3.952∗∗
[2.39] [2.41]Debtor expenses to
pre-assets++ 1.072∗∗∗ 1.069∗∗∗
[14.83] [11.32]
(continued)
1268 The Journal of Finance
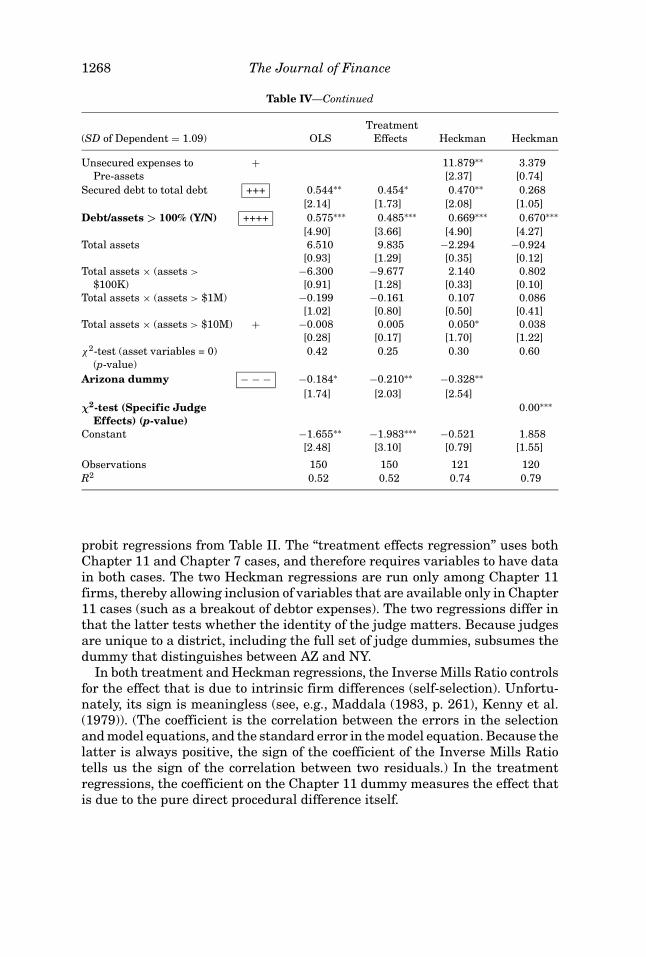
Table IV—Continued
Treatment(SD of Dependent = 1.09) OLS Effects Heckman Heckman
Unsecured expenses toPre-assets
+ 11.879∗∗ 3.379[2.37] [0.74]
Secured debt to total debt +++ 0.544∗∗ 0.454∗ 0.470∗∗ 0.268[2.14] [1.73] [2.08] [1.05]
Debt/assets > 100% (Y/N) ++++ 0.575∗∗∗ 0.485∗∗∗ 0.669∗∗∗ 0.670∗∗∗
[4.90] [3.66] [4.90] [4.27]Total assets 6.510 9.835 −2.294 −0.924
[0.93] [1.29] [0.35] [0.12]Total assets × (assets >
$100K)−6.300 −9.677 2.140 0.802[0.91] [1.28] [0.33] [0.10]
Total assets × (assets > $1M) −0.199 −0.161 0.107 0.086[1.02] [0.80] [0.50] [0.41]
Total assets × (assets > $10M) + −0.008 0.005 0.050∗ 0.038[0.28] [0.17] [1.70] [1.22]
χ2-test (asset variables = 0)(p-value)
0.42 0.25 0.30 0.60
Arizona dummy − − − −0.184∗ −0.210∗∗ −0.328∗∗
[1.74] [2.03] [2.54]χ2-test (Specific Judge
Effects) (p-value)0.00∗∗∗
Constant −1.655∗∗ −1.983∗∗∗ −0.521 1.858[2.48] [3.10] [0.79] [1.55]
Observations 150 150 121 120R2 0.52 0.52 0.74 0.79
probit regressions from Table II. The “treatment effects regression” uses bothChapter 11 and Chapter 7 cases, and therefore requires variables to have datain both cases. The two Heckman regressions are run only among Chapter 11firms, thereby allowing inclusion of variables that are available only in Chapter11 cases (such as a breakout of debtor expenses). The two regressions differ inthat the latter tests whether the identity of the judge matters. Because judgesare unique to a district, including the full set of judge dummies, subsumes thedummy that distinguishes between AZ and NY.
In both treatment and Heckman regressions, the Inverse Mills Ratio controlsfor the effect that is due to intrinsic firm differences (self-selection). Unfortu-nately, its sign is meaningless (see, e.g., Maddala (1983, p. 261), Kenny et al.(1979)). (The coefficient is the correlation between the errors in the selectionand model equations, and the standard error in the model equation. Because thelatter is always positive, the sign of the coefficient of the Inverse Mills Ratiotells us the sign of the correlation between two residuals.) In the treatmentregressions, the coefficient on the Chapter 11 dummy measures the effect thatis due to the pure direct procedural difference itself.
Costs of Bankruptcy 1269
While the four regression specifications do have different economic mean-ings, a variable that matters in all of them is easiest to interpret. Thus, next tothe variable name, we visually indicate whether a variable is statistically sig-nificant with a “+” or “−” for each regression, and we box those variables thatare universally significant. These visuals ensure that in-text interpretationsremain reasonably consistent. We also try various stepwise regressions,and note in the text instances in which variables seem not particularlyrobust.
Table IV explains percent changes in assets during bankruptcy, using thepessimistic “reported-only” scenario on secured recovery. We shall note wherethis matters.
Ceteris paribus, the average Chapter 11 case retains value 78% better thanthe average Chapter 7 case (standardized beta, 30%). Controlling for self-selection (the effect of which differs by specification) increases this numberto 137% (standardized beta, 50%). Unreported, under the pessimistic sce-nario, the average Chapter 11 case does “only” 35% better in the OLS regres-sion, and 75% better after controlling for self-selection (both with t-statisticsof 1.5).
Therefore, our evidence suggests that it is the Chapter 11 procedure itself,and not the self-selection, that results in better reported asset retention inbankruptcy—regardless of the type of firm that chooses Chapter 11. This couldalso be because Chapter 11 overstates the remaining assets. We conclude thatChapter 11 as a procedure is no worse for asset retention than Chapter 7: De-pending on the assumption about secured creditor recovery, Chapter 7 assetretention is somewhere between “statistically significantly worse” and “consid-erably but not statistically significantly worse.” The self-selection componentpartially, but never fully, obscures this relationship.
A number of other variables have interesting correlations here, too. Debtorexpenses or total bankruptcy expenses are not associated with less asset re-tention. Both variables not only come in statistically significantly positive butare also the most economically significant variables (standardized coefficientsof around 80% and 60%, respectively.) The regressions suggest that some othervariables may play less economically or statistically important roles. Firmsthat are very underwater seem to retain value significantly better—almost50% better (standardized beta, 20%–25%). In some stepwise regressions, thisvariable loses its economic importance however. Next, the fraction of secureddebt among total debt matters, if not controlled for judge (standardized beta ofaround 10%–20%). The other statistically significant variables (such as the AZdummy and the forced petition) have less than 10% standardized beta. Finally,the identity of the judge matters.
Surprisingly, the scale of the estate does not seem to matter strongly for assetretention. As a set, the four asset variables are statistically insignificant. Toassess the effect of, say, a $5 million firm, one needs to add the coefficient esti-mates. When both Chapter 7 and Chapter 11 cases are included, the (summed)coefficient is always nonnegative. There is no clear monotonicity—larger cases
1270 The Journal of Finance
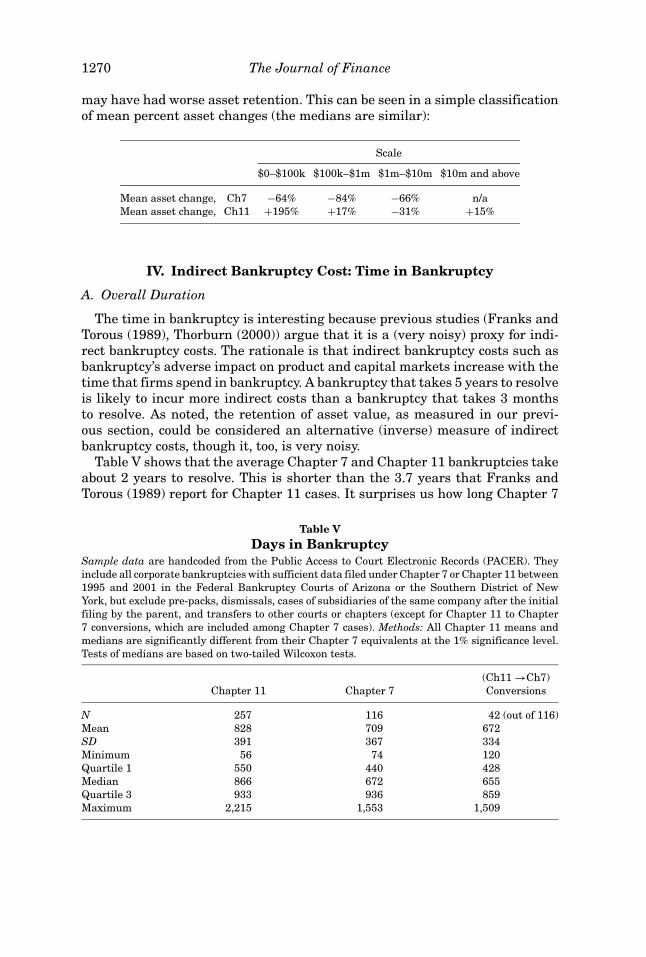
may have had worse asset retention. This can be seen in a simple classificationof mean percent asset changes (the medians are similar):
Scale
$0–$100k $100k–$1m $1m–$10m $10m and above
Mean asset change, Ch7 −64% −84% −66% n/aMean asset change, Ch11 +195% +17% −31% +15%
IV. Indirect Bankruptcy Cost: Time in Bankruptcy
A. Overall Duration
The time in bankruptcy is interesting because previous studies (Franks andTorous (1989), Thorburn (2000)) argue that it is a (very noisy) proxy for indi-rect bankruptcy costs. The rationale is that indirect bankruptcy costs such asbankruptcy’s adverse impact on product and capital markets increase with thetime that firms spend in bankruptcy. A bankruptcy that takes 5 years to resolveis likely to incur more indirect costs than a bankruptcy that takes 3 monthsto resolve. As noted, the retention of asset value, as measured in our previ-ous section, could be considered an alternative (inverse) measure of indirectbankruptcy costs, though it, too, is very noisy.
Table V shows that the average Chapter 7 and Chapter 11 bankruptcies takeabout 2 years to resolve. This is shorter than the 3.7 years that Franks andTorous (1989) report for Chapter 11 cases. It surprises us how long Chapter 7
Table VDays in Bankruptcy
Sample data are handcoded from the Public Access to Court Electronic Records (PACER). Theyinclude all corporate bankruptcies with sufficient data filed under Chapter 7 or Chapter 11 between1995 and 2001 in the Federal Bankruptcy Courts of Arizona or the Southern District of NewYork, but exclude pre-packs, dismissals, cases of subsidiaries of the same company after the initialfiling by the parent, and transfers to other courts or chapters (except for Chapter 11 to Chapter7 conversions, which are included among Chapter 7 cases). Methods: All Chapter 11 means andmedians are significantly different from their Chapter 7 equivalents at the 1% significance level.Tests of medians are based on two-tailed Wilcoxon tests.
(Ch11 →Ch7)Chapter 11 Chapter 7 Conversions
N 257 116 42 (out of 116)Mean 828 709 672SD 391 367 334Minimum 56 74 120Quartile 1 550 440 428Median 866 672 655Quartile 3 933 936 859Maximum 2,215 1,553 1,509
Costs of Bankruptcy 1271
cases take: It appears that ordinary managerial agency problems are notresponsible for the bankruptcy process lengthiness, because Chapter 7 casesare conducted by elected trustees, whose interest should be to wind down thecase, and no longer in the interest of the firm but only of the creditors. Thefact that our Chapter 7 cases take so long also contrasts with Thorburn (2000),which finds that the Swedish cash auction system takes only 2 months. Whilethe Swedish cash auction system seems to be more efficient in terms of time,this seems peculiar to the Swedish system—it does not apply to U.S.-style liq-uidation of assets.
Conversions: We can classify cases that start out as Chapter 11 but thenconvert into Chapter 7 as Chapter 7 cases. Such conversions from Chapter 11to Chapter 7 are governed by §1019 of the U.S. Bankruptcy Code, which statesthat, upon the conversion, a new period for filing claims starts. The debtor-in-possession or trustee previously acting in the Chapter 11 must turn over tothe Chapter 7 trustee all records and property of the estate under its control.Under §1112(a), the debtor can convert a case to Chapter 7, except when (a) thedebtor is not a debtor-in-possession, or (b) the case originally commenced as aninvoluntary case or converted into a Chapter 11 as an involuntary case.
Table V also shows how the conversions differ. Forty-two cases with data con-verted, with these liquidations taking a total of 672 days on average (196 daysin Chapter 11, and 476 in Chapter 7). This is shorter than either pure proce-dure, but not statistically significantly different from the total length of pureChapter 7 of 709 days. The same inference obtains for the median, where thetotal length of Chapter 11 conversions to Chapter 7 is 655. This is not signifi-cantly different from the median length of a pure Chapter 7 case, which is 672days. However, in the regressions in Table VI, we find that, controlling for othercharacteristics, our 42 Chapter 7 to Chapter 11 conversions take about 1 yearlonger.
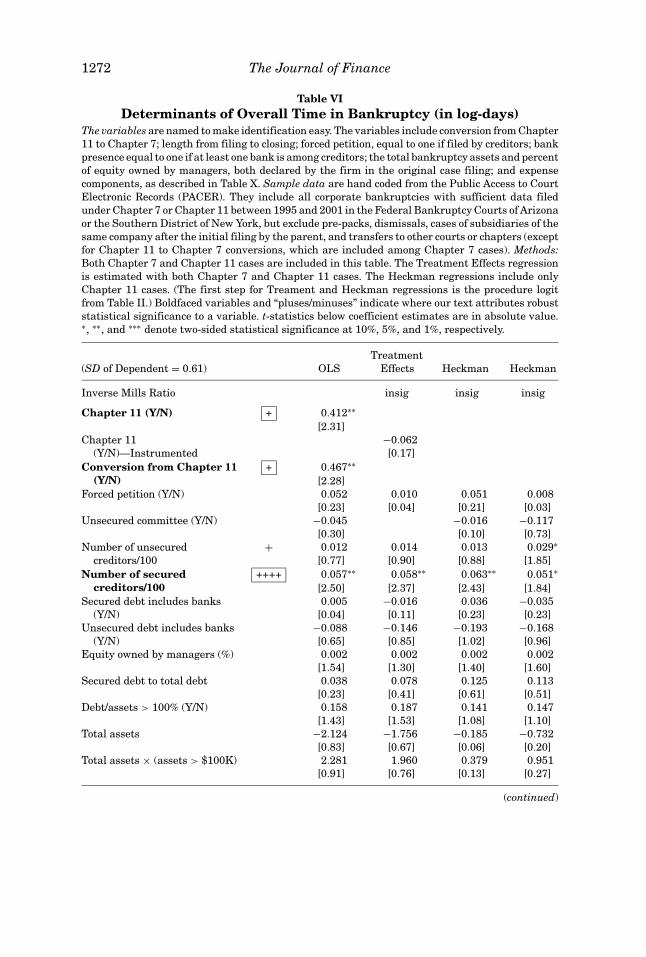
Table VI explains the log of the time in bankruptcy. Our OLS regression in-dicates that firms in Chapter 11 took longer than firms in Chapter 7. The esti-mated coefficient of 0.41 (standardized beta, 24%) suggests that the dummy canexplain about two-thirds of the observed heterogeneity in bankruptcy duration(0.61). Our remaining regressions disentangle this effect into a self-selection-induced effect and a procedure-induced effect. We find that the estimated coef-ficient for the latter not only becomes insignificant, but even reverses in signwhen we control for the former. It therefore appears that Chapter 11 takeslonger only because the types of firms that choose Chapter 11 intrinsicallyneed more time. Our evidence therefore suggests that the procedure itself doesnot increase indirect costs when measured by duration.
With regards to our other variables, there are only four variables that matter.First, conversions from Chapter 11 to Chapter 7 take longer (economic signifi-cance, 21%). Second, firms with more secured creditors tend to spend more timein bankruptcy. However, the standardized beta is only a modest 5%–7% percent,and the significance disappears in some stepwise regressions. Third, the judge-fixed effects come in highly significant—the particular judge drawn to handlethe case appears to play a role in how long a case takes, holding constant our
1272 The Journal of Finance
Table VIDeterminants of Overall Time in Bankruptcy (in log-days)
The variables are named to make identification easy. The variables include conversion from Chapter11 to Chapter 7; length from filing to closing; forced petition, equal to one if filed by creditors; bankpresence equal to one if at least one bank is among creditors; the total bankruptcy assets and percentof equity owned by managers, both declared by the firm in the original case filing; and expensecomponents, as described in Table X. Sample data are hand coded from the Public Access to CourtElectronic Records (PACER). They include all corporate bankruptcies with sufficient data filedunder Chapter 7 or Chapter 11 between 1995 and 2001 in the Federal Bankruptcy Courts of Arizonaor the Southern District of New York, but exclude pre-packs, dismissals, cases of subsidiaries of thesame company after the initial filing by the parent, and transfers to other courts or chapters (exceptfor Chapter 11 to Chapter 7 conversions, which are included among Chapter 7 cases). Methods:Both Chapter 7 and Chapter 11 cases are included in this table. The Treatment Effects regressionis estimated with both Chapter 7 and Chapter 11 cases. The Heckman regressions include onlyChapter 11 cases. (The first step for Treament and Heckman regressions is the procedure logitfrom Table II.) Boldfaced variables and “pluses/minuses” indicate where our text attributes robuststatistical significance to a variable. t-statistics below coefficient estimates are in absolute value.∗, ∗∗, and ∗∗∗ denote two-sided statistical significance at 10%, 5%, and 1%, respectively.
Treatment(SD of Dependent = 0.61) OLS Effects Heckman Heckman
Inverse Mills Ratio insig insig insig
Chapter 11 (Y/N) + 0.412∗∗
[2.31]Chapter 11
(Y/N)—Instrumented−0.062[0.17]
Conversion from Chapter 11(Y/N)
+ 0.467∗∗
[2.28]Forced petition (Y/N) 0.052 0.010 0.051 0.008
[0.23] [0.04] [0.21] [0.03]Unsecured committee (Y/N) −0.045 −0.016 −0.117
[0.30] [0.10] [0.73]Number of unsecured
creditors/100+ 0.012 0.014 0.013 0.029∗
[0.77] [0.90] [0.88] [1.85]Number of secured
creditors/100++++ 0.057∗∗ 0.058∗∗ 0.063∗∗ 0.051∗
[2.50] [2.37] [2.43] [1.84]Secured debt includes banks
(Y/N)0.005 −0.016 0.036 −0.035
[0.04] [0.11] [0.23] [0.23]Unsecured debt includes banks
(Y/N)−0.088 −0.146 −0.193 −0.168[0.65] [0.85] [1.02] [0.96]
Equity owned by managers (%) 0.002 0.002 0.002 0.002[1.54] [1.30] [1.40] [1.60]
Secured debt to total debt 0.038 0.078 0.125 0.113[0.23] [0.41] [0.61] [0.51]
Debt/assets > 100% (Y/N) 0.158 0.187 0.141 0.147[1.43] [1.53] [1.08] [1.10]
Total assets −2.124 −1.756 −0.185 −0.732[0.83] [0.67] [0.06] [0.20]
Total assets × (assets > $100K) 2.281 1.960 0.379 0.951[0.91] [0.76] [0.13] [0.27]
(continued)
Costs of Bankruptcy 1273
Table VI—Continued
Treatment(SD of Dependent = 0.61) OLS Effects Heckman Heckman
Total assets × (assets > $1M) −0.121 −0.155 −0.150 −0.164[0.71] [0.88] [0.80] [0.95]
Total assets × (assets > $10M) −− −0.035 −0.048∗ −0.043 −0.054∗[1.41] [1.73] [1.37] [1.75]
χ2-test (asset variables = 0)(p-value)
0.45 0.25 0.56 0.28
Arizona dummy −0.062 −0.035 −0.061[0.65] [0.36] [0.51]
χ2-test (Specific JudgeEffects) (p-value)
0.01∗∗
Constant 5.874∗∗∗ 6.262∗∗∗ 6.188∗∗∗ 5.925∗∗∗[31.46] [23.38] [23.72] [19.57]
Observations 195 195 165 164R2 0.10 0.09 0.07 0.26
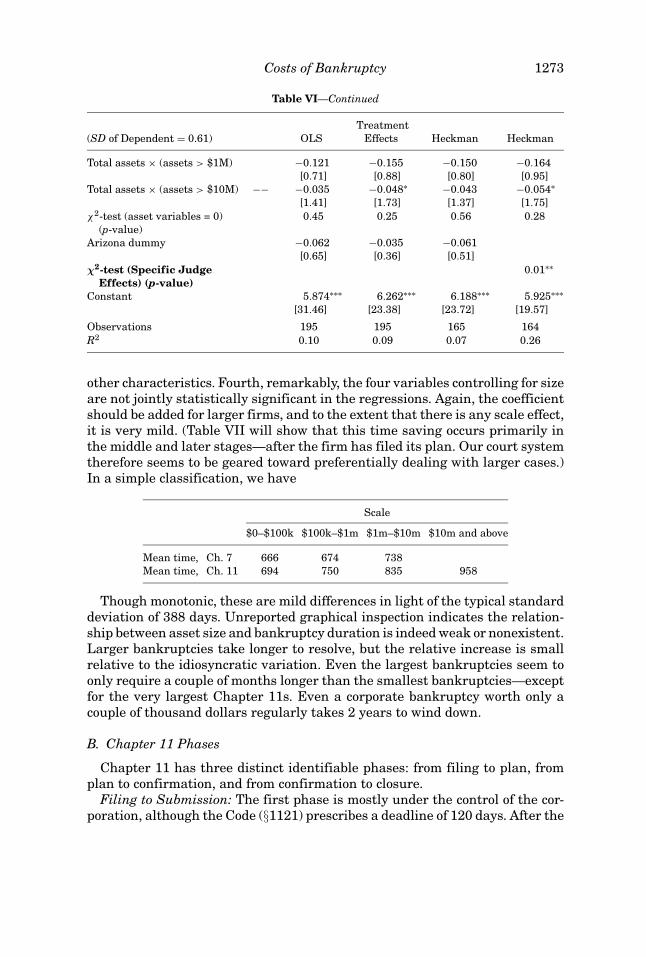
other characteristics. Fourth, remarkably, the four variables controlling for sizeare not jointly statistically significant in the regressions. Again, the coefficientshould be added for larger firms, and to the extent that there is any scale effect,it is very mild. (Table VII will show that this time saving occurs primarily inthe middle and later stages—after the firm has filed its plan. Our court systemtherefore seems to be geared toward preferentially dealing with larger cases.)In a simple classification, we have
Scale
$0–$100k $100k–$1m $1m–$10m $10m and above
Mean time, Ch. 7 666 674 738Mean time, Ch. 11 694 750 835 958
Though monotonic, these are mild differences in light of the typical standarddeviation of 388 days. Unreported graphical inspection indicates the relation-ship between asset size and bankruptcy duration is indeed weak or nonexistent.Larger bankruptcies take longer to resolve, but the relative increase is smallrelative to the idiosyncratic variation. Even the largest bankruptcies seem toonly require a couple of months longer than the smallest bankruptcies—exceptfor the very largest Chapter 11s. Even a corporate bankruptcy worth only acouple of thousand dollars regularly takes 2 years to wind down.
B. Chapter 11 Phases
Chapter 11 has three distinct identifiable phases: from filing to plan, fromplan to confirmation, and from confirmation to closure.
Filing to Submission: The first phase is mostly under the control of the cor-poration, although the Code (§1121) prescribes a deadline of 120 days. After the
1274 The Journal of Finance
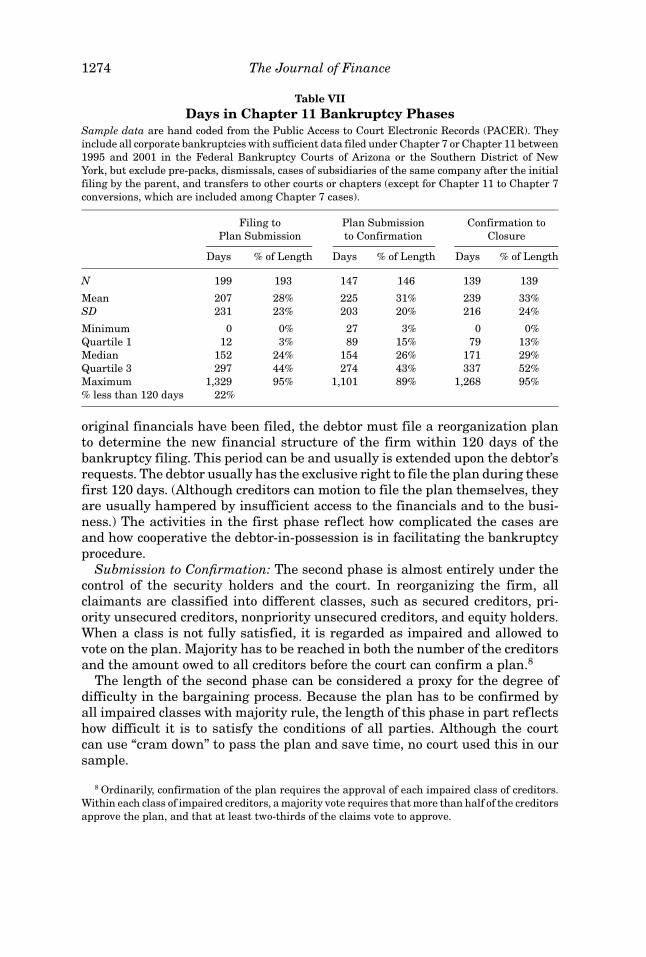
Table VIIDays in Chapter 11 Bankruptcy Phases
Sample data are hand coded from the Public Access to Court Electronic Records (PACER). Theyinclude all corporate bankruptcies with sufficient data filed under Chapter 7 or Chapter 11 between1995 and 2001 in the Federal Bankruptcy Courts of Arizona or the Southern District of NewYork, but exclude pre-packs, dismissals, cases of subsidiaries of the same company after the initialfiling by the parent, and transfers to other courts or chapters (except for Chapter 11 to Chapter 7conversions, which are included among Chapter 7 cases).
Filing to Plan Submission Confirmation toPlan Submission to Confirmation Closure
Days % of Length Days % of Length Days % of Length
N 199 193 147 146 139 139
Mean 207 28% 225 31% 239 33%SD 231 23% 203 20% 216 24%
Minimum 0 0% 27 3% 0 0%Quartile 1 12 3% 89 15% 79 13%Median 152 24% 154 26% 171 29%Quartile 3 297 44% 274 43% 337 52%Maximum 1,329 95% 1,101 89% 1,268 95%% less than 120 days 22%
original financials have been filed, the debtor must file a reorganization planto determine the new financial structure of the firm within 120 days of thebankruptcy filing. This period can be and usually is extended upon the debtor’srequests. The debtor usually has the exclusive right to file the plan during thesefirst 120 days. (Although creditors can motion to file the plan themselves, theyare usually hampered by insufficient access to the financials and to the busi-ness.) The activities in the first phase reflect how complicated the cases areand how cooperative the debtor-in-possession is in facilitating the bankruptcyprocedure.
Submission to Confirmation: The second phase is almost entirely under thecontrol of the security holders and the court. In reorganizing the firm, allclaimants are classified into different classes, such as secured creditors, pri-ority unsecured creditors, nonpriority unsecured creditors, and equity holders.When a class is not fully satisfied, it is regarded as impaired and allowed tovote on the plan. Majority has to be reached in both the number of the creditorsand the amount owed to all creditors before the court can confirm a plan.8
The length of the second phase can be considered a proxy for the degree ofdifficulty in the bargaining process. Because the plan has to be confirmed byall impaired classes with majority rule, the length of this phase in part reflectshow difficult it is to satisfy the conditions of all parties. Although the courtcan use “cram down” to pass the plan and save time, no court used this in oursample.
8 Ordinarily, confirmation of the plan requires the approval of each impaired class of creditors.Within each class of impaired creditors, a majority vote requires that more than half of the creditorsapprove the plan, and that at least two-thirds of the claims vote to approve.
Costs of Bankruptcy 1275
Confirmation to Closure: The third phase is often dedicated to the implemen-tation of the plan and the final disbursement of fees to professional experts(lawyers, auditors, etc.). It is thus under the control of management and thecourt. The management of the debtor then sets out to implement the confirmedplan. The length of the third phase should be influenced less by stakeholdergaming and more by the scale of the case, rather than by the manager’s incen-tive. Large cases usually involve more claimants and complex financial struc-ture, which can prolong the process of distributing the assets. There could alsobe potentially greater opposition during the process of plan implementationif there are more stakeholders or complicated financial structures. Althoughdebtor management may still have some incentive to delay the process, theyshould be more cooperative with the new creditors and equity holders than inthe previous two phases in order to retain their jobs. Therefore, the length ofthe third phase should mostly reflect how complicated the cases are instead ofhow efficient the procedure is.
Table VII shows that the three phases take about equally long on average.Only 22% of our firms meet the 120-day legal deadline to file a plan.
Not reported, debtors in AZ take only 165 days on average to propose a plan,while debtors in NY take 296 days—almost twice as long. However, the plantakes as long to confirm in AZ as in NY (200 days in both). Implementation isagain faster in AZ (207 days) than in NY (257). The differences in the first andthird phases are statistically significant.
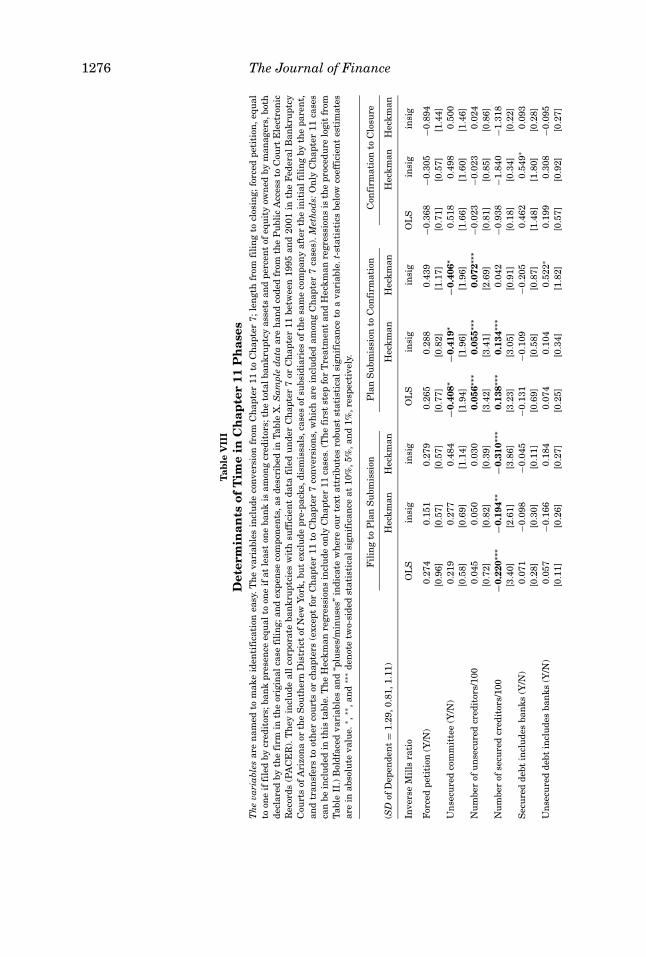
Table VIII explains the lengths of the three individual Chapter 11 phases:from filing to plan (Panel A), from plan to approval (Panel B), and from approvalto emergence (Panel C).
We cannot explore the effect of procedural choice, because these three phasesapply only to Chapter 11. However, the Inverse Mills Ratio tells us that self-selection seems not to have mattered, as to other variables.
Filing to Submission: There are two important variables that explain howlong management takes to file a plan. First, firms with more secured cred-itors tend to file faster. Although this effect also appears in the overall timerequired regression (Table VI), it is even stronger here because the credi-tors do not appear necessarily as eager to approve the plan (Phase 2) whenthere are more of them. Second, and more interestingly, when managementowns more of the firm, the first phase tends to drag on (standardized beta,20%–30%). This may indicate that managers with more of their own moneyat stake “play the option” of keeping the firm alive, and are reluctant toresolve the bankruptcy. (In 17% of our Chapter 7 cases and 37% of ourChapter 11 cases, entrepreneurs own a majority of shares in the firm.)
Submission to Acceptance: There are two important variables that explainhow long it takes to confirm the plan. First, firms with more unsecuredcreditors take longer to confirm (standardized beta, approximately 30%).Second, an unsecured creditors’ committee substantially reduces this time(standardized beta, again about 30%). This is evidence of coordination prob-lems, which are remedied by the presence of a coordinating organ. There is
1276 The Journal of Finance
Tab
leV
III
Det
erm
inan
tsof
Tim
ein
Ch
apte
r11
Ph
ases
Th
eva
riab
les
are
nam
edto
mak
eid
enti
fica
tion
easy
.Th
eva
riab
les
incl
ude
con
vers
ion
from
Ch
apte
r11
toC
hap
ter
7;le
ngt
hfr
omfi
lin
gto
clos
ing;
forc
edpe
titi
on,e
qual
toon
eif
file
dby
cred
itor
s;ba
nk
pres
ence
equ
alto
one
ifat
leas
ton
eba
nk
isam
ong
cred
itor
s;th
eto
talb
ankr
upt
cyas
sets
and
perc
ent
ofeq
uit
yow
ned
bym
anag
ers,
both
decl
ared
byth
efi
rmin
the
orig
inal
case
fili
ng;
and
expe
nse
com
pon
ents
,as
desc
ribe
din
Tab
leX
.Sam
ple
dat
aar
eh
and
code
dfr
omth
eP
ubl
icA
cces
sto
Cou
rtE
lect
ron
icR
ecor
ds(P
AC
ER
).T
hey
incl
ude
all
corp
orat
eba
nkr
upt
cies
wit
hsu
ffic
ien
tda
tafi
led
un
der
Ch
apte
r7
orC
hap
ter
11be
twee
n19
95an
d20
01in
the
Fed
eral
Ban
kru
ptcy
Cou
rts
ofA
rizo
na
orth
eS
outh
ern
Dis
tric
tof
New
York
,bu
tex
clu
depr
e-pa
cks,
dism
issa
ls,c
ases
ofsu
bsid
iari
esof
the
sam
eco
mpa
ny
afte
rth
ein
itia
lfil
ing
byth
epa
ren
t,an
dtr
ansf
ers
toot
her
cou
rts
orch
apte
rs(e
xcep
tfo
rC
hap
ter
11to
Ch
apte
r7
con
vers
ion
s,w
hic
har
ein
clu
ded
amon
gC
hap
ter
7ca
ses)
.Met
hod
s:O
nly
Ch
apte
r11
case
sca
nbe
incl
ude
din
this
tabl
e.T
he
Hec
kman
regr
essi
ons
incl
ude
only
Ch
apte
r11
case
s.(T
he
firs
tst
epfo
rT
reat
men
tan
dH
eckm
anre
gres
sion
sis
the
proc
edu
relo
git
from
Tab
leII
.)B
oldf
aced
vari
able
san
d“p
luse
s/m
inu
ses”
indi
cate
wh
ere
our
text
attr
ibu
tes
robu
stst
atis
tica
lsi
gnif
ican
ceto
ava
riab
le.t
-sta
tist
ics
belo
wco
effi
cien
tes
tim
ates
are
inab
solu
teva
lue.
∗ ,∗∗
,an
d∗∗
∗de
not
etw
o-si
ded
stat
isti
cals
ign
ific
ance
at10
%,5
%,a
nd
1%,r
espe
ctiv
ely.
Fil
ing
toP
lan
Su
bmis
sion
Pla
nS
ubm
issi
onto
Con
firm
atio
nC
onfi
rmat
ion
toC
losu
re
(SD
ofD
epen
den
t=
1.29
,0.8
1,1.
11)
Hec
kman
Hec
kman
Hec
kman
Hec
kman
Hec
kman
Hec
kman
Inve
rse
Mil
lsra
tio
OL
Sin
sig
insi
gO
LS
insi
gin
sig
OL
Sin
sig
insi
g
For
ced
peti
tion
(Y/N
)0.
274
0.15
10.
279
0.26
50.
288
0.43
9−0
.368
−0.3
05−0
.894
[0.9
6][0
.57]
[0.5
7][0
.77]
[0.8
2][1
.17]
[0.7
1][0
.57]
[1.4
4]U
nse
cure
dco
mm
itte
e(Y
/N)
0.21
90.
277
0.48
4−
0.40
8∗−
0.41
9∗−
0.40
6∗0.
518
0.49
80.
500
[0.5
8][0
.69]
[1.1
4][1
.94]
[1.9
6][1
.96]
[1.6
6][1
.60]
[1.4
6]N
um
ber
ofu
nse
cure
dcr
edit
ors/
100
0.04
50.
050
0.03
00.
056∗
∗∗0.
055∗
∗∗0.
072∗
∗∗−0
.023
−0.0
230.
024
[0.7
2][0
.82]
[0.3
9][3
.42]
[3.4
1][2
.69]
[0.8
1][0
.85]
[0.8
6]N
um
ber
ofse
cure
dcr
edit
ors/
100
−0.
220∗
∗∗−
0.19
4∗∗
−0.
310∗
∗∗0.
138∗
∗∗0.
134∗
∗∗0.
042
−0.9
38−1
.840
−1.3
18[3
.40]
[2.6
1][3
.86]
[3.2
3][3
.05]
[0.9
1][0
.18]
[0.3
4][0
.22]
Sec
ure
dde
btin
clu
des
ban
ks(Y
/N)
0.07
1−0
.098
−0.0
45−0
.131
−0.1
09−0
.205
0.46
20.
549∗
0.09
3[0
.28]
[0.3
0][0
.11]
[0.6
9][0
.58]
[0.8
7][1
.48]
[1.8
0][0
.28]
Un
secu
red
debt
incl
ude
sba
nks
(Y/N
)0.
057
−0.1
660.
184
0.07
40.
104
0.52
2∗0.
199
0.30
8−0
.095
[0.1
1][0
.26]
[0.2
7][0
.25]
[0.3
4][1
.82]
[0.5
7][0
.92]
[0.2
7]
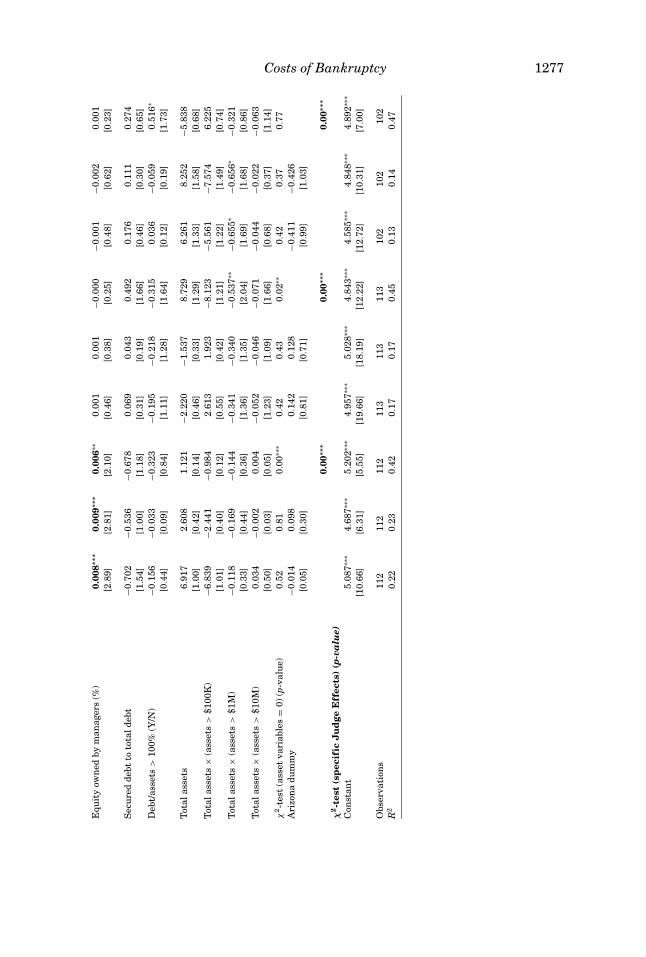
Costs of Bankruptcy 1277
Equ
ity
own
edby
man
ager
s(%
)0.
008∗
∗∗0.
009∗
∗∗0.
006∗
∗0.
001
0.00
1−0
.000
−0.0
01−0
.002
0.00
1[2
.89]
[2.8
1][2
.10]
[0.4
6][0
.38]
[0.2
5][0
.48]
[0.6
2][0
.23]
Sec
ure
dde
btto
tota
ldeb
t−0
.702
−0.5
36−0
.678
0.06
90.
043
0.49
20.
176
0.11
10.
274
[1.5
4][1
.00]
[1.1
8][0
.31]
[0.1
9][1
.66]
[0.4
6][0
.30]
[0.6
5]D
ebt/
asse
ts>
100%
(Y/N
)−0
.156
−0.0
33−0
.323
−0.1
95−0
.218
−0.3
150.
036
−0.0
590.
516∗
[0.4
4][0
.09]
[0.8
4][1
.11]
[1.2
8][1
.64]
[0.1
2][0
.19]
[1.7
3]
Tot
alas
sets
6.91
72.
608
1.12
1−2
.220
−1.5
378.
729
6.26
18.
252
−5.8
38[1
.00]
[0.4
2][0
.14]
[0.4
6][0
.33]
[1.2
9][1
.33]
[1.5
8][0
.68]
Tot
alas
sets
×(a
sset
s>
$100
K)
−6.8
39−2
.441
−0.9
842.
613
1.92
3−8
.123
−5.5
61−7
.574
6.22
5[1
.01]
[0.4
0][0
.12]
[0.5
5][0
.42]
[1.2
1][1
.22]
[1.4
9][0
.74]
Tot
alas
sets
×(a
sset
s>
$1M
)−0
.118
−0.1
69−0
.144
−0.3
41−0
.340
−0.5
37∗∗
−0.6
55∗
−0.6
56∗
−0.3
21[0
.33]
[0.4
4][0
.36]
[1.3
6][1
.35]
[2.0
4][1
.69]
[1.6
8][0
.86]
Tot
alas
sets
×(a
sset
s>
$10M
)0.
034
−0.0
020.
004
−0.0
52−0
.046
−0.0
71−0
.044
−0.0
22−0
.063
[0.5
0][0
.03]
[0.0
5][1
.23]
[1.0
9][1
.66]
[0.6
8][0
.37]
[1.1
4]χ
2-t
est
(ass
etva
riab
les
=0)
(p-v
alu
e)0.
520.
810.
00∗∗
∗0.
420.
430.
02∗∗
0.42
0.37
0.77
Ari
zon
adu
mm
y−0
.014
0.09
80.
142
0.12
8−0
.411
−0.4
26[0
.05]
[0.3
0][0
.81]
[0.7
1][0
.99]
[1.0
3]
χ2-t
est
(sp
ecif
icJ
ud
geE
ffec
ts)
(p-v
alu
e)0.
00∗∗
∗0.
00∗∗
∗0.
00∗∗
∗
Con
stan
t5.
087∗
∗∗4.
687∗
∗∗5.
202∗
∗∗4.
957∗
∗∗5.
028∗
∗∗4.
843∗
∗∗4.
585∗
∗∗4.
848∗
∗∗4.
892∗
∗∗
[10.
66]
[6.3
1][5
.55]
[19.
66]
[18.
19]
[12.
22]
[12.
72]
[10.
31]
[7.0
0]
Obs
erva
tion
s11
211
211
211
311
311
310
210
210
2R
20.
220.
230.
420.
170.
170.
450.
130.
140.
47
1278 The Journal of Finance
also mild evidence that coordination problems also play a role in how longsecured creditors require, but this is subsumed by the judge effects.
Acceptance to Emergence: There are no variables that explain how long ittakes for a firm with a confirmed plan to depart bankruptcy.
The identity of the judge matters for all three phases. Firm scale may or maynot play a role, depending on specification. In a simple classification:
Scale
$0–$100k $100k–$1m $1m–$10m $10m and above
Mean number of days, First phase 285 231 343 144Mean number of days, Second phase 133 190 139 252Mean number of days, Third phase 112 210 224 339
Only the third phase shows monotonicity. Not reported, the lengths of thefirst phase (plan filing) of a Chapter 11 has a modest +0.10 correlation withthe length of the second phase and a modest +0.25 correlation with the lengthof the third phase; the latter two have a −0.15 correlation, each seemingly ableto substitute for the other.
V. Direct Bankruptcy Costs: Court-Declared Expenses
A. Descriptive Statistics
We now turn our attention toward direct expenses and their components.Chapter 7 expenses have three major cost components, namely, the trusteeexpenses,9 accountant expenses, and debtor attorney expenses. Chapter 11reorganizations have two identifiable reimbursable cost components, namely,debtor expenses and unsecured creditors’ committee expenses. In both cases, di-rect costs exclude bankruptcy filing fees, and the salary collected by the debtor’smanagement is not really a bankruptcy cost because managers have to be paidfor running the firm in any event.
Direct expenses are not only relatively easier to measure than indirect ex-penses, but they have also already attracted much attention in previous work.LoPucki and Doherty (2004) report direct bankruptcy costs of 1.4%. Warner(1977) reports 4%. Ang et al. (1982), Weiss (1990), and Betker (1995) reportdirect expenses of about 7.5%. In Sweden, Thorburn (2000) reports 13.2%. All
9 Bankruptcy trustees in Chapter 7 and Chapter 11 are compensated according to mechanisticstipulations, usually a fixed amount plus some additional amount depending on the asset size ofthe case. Trustee compensation is governed by §330 of the Code, subject to the limits imposed in§326(a). The trustee’s compensation cannot “exceed 25% on the first $5,000 or less, 10% on anyamount in excess of $5,000 but not in excess of $50,000, 5% on any amount in excess of $50,000 butnot in excess of $1,000,000, and reasonable compensation not to exceed 3% of such moneys in excessof $1,000,000, upon all moneys [sic] disbursed or turned over in the case by the trustee to parties ininterest, excluding the debtor, but including holders of secured claims.” This compensation schememakes trustee costs a larger fraction of direct bankruptcy costs in smaller cases with less assetvalue to be distributed.
Costs of Bankruptcy 1279
of these are relative to asset value at entry into bankruptcy. The studied sam-ples are typically small, but their value estimates are more reliable than ourown because they restrict themselves to publicly traded companies, for whichmarket value estimates can be readily obtained. It is not immediately clearwhy estimates differ across studies. Although many of the discrepancies maybe sample-specific, our findings below indicate that differences induced by mea-surement could easily have played a role.
The left columns in Table IX measure fees as a fraction of pre-bankruptcyassets. Our 57 Chapter 7 cases have a mean expense ratio of about 8.1%, whichis lower than the 16.9% reported in Chapter 11 (driven by four large outliers).The median expense ratio in Chapter 7 is a slightly higher 2.5% than the 1.9%in Chapter 11. With only 57 observations in Chapter 7, the difference is notstatistically significant so one should not overread this difference. The evidencesuggests that the typical pre-bankruptcy expense ratios are roughly similaracross procedures.
The extremes here may be as interesting as the central statistics. Reportedreimbursed expenses are less than 1% of firm value in about 40%–45% of ourcases—and exactly zero in about 35% of all Chapter 7 cases and 20% of allChapter 11 cases. (These are not cases for which we cannot locate data [eitherfees or assets], so this is a real effect. In a number of Chapter 11 cases, thereare no unsecured creditors’ committees and/or the unsecured creditors do notreceive reimbursement. If the debtor does not ask for reimbursement either,the court-recorded Chapter 11 expenses are $0.)
The middle columns use post-bankruptcy assets as the denominator—Table III shows that assets can be very different at exit than at entry. Be-cause at-exit values are the sum of fees and creditor recovery, it now matterswhether we choose pessimistic or optimistic secured recovery rates in Chap-ter 7; this middle category also has the fewest observations due to data avail-ability. Table IX shows that 68% of our Chapter 7 cases use up all assets to payfor expenses under the pessimistic reported-only secured recovery scenario. Inthe optimistic 2.6-times-grossed-up scenario (in this case, we gain 17 cases forwhich we have no reported secured recovery, but can impute a recovery), wefind that this number drops to 29%, and the bankruptcy expense still remainsaround 38% of assets on average, with a median of 10%.
The right columns introduce a different denominator, total liabilities, whichsuffers from less declaration uncertainty—and offers more observations. How-ever, this normalization masks the degree to which the firm is underwater. (Wecan control for some of this in the regressions.) In Chapter 11, average fees asa fraction of liabilities amount to around 1.4% in medians, and a hefty 11.5%in means, due to four outliers with fees-to-liability ratios of 140%, 290%, 520%,and 555%.10 Chapter 7 seems to be cheaper, with expenses per dollar liabilityonly 2.9% in means and 0.4% in medians.
10 American Business Fundings, case AZ-00-01782, owed $50,201 and suffered fees of $278,831.Quick Interiors, Inc., NY-97-45020, owed $129,064 and suffered fees of $677,105. George Goldring,NY-96-44577 owed $46,277 and suffered fees of $133,745. Jenny Fashions, Inc., owed $277,468,and suffered fees of $394,535.
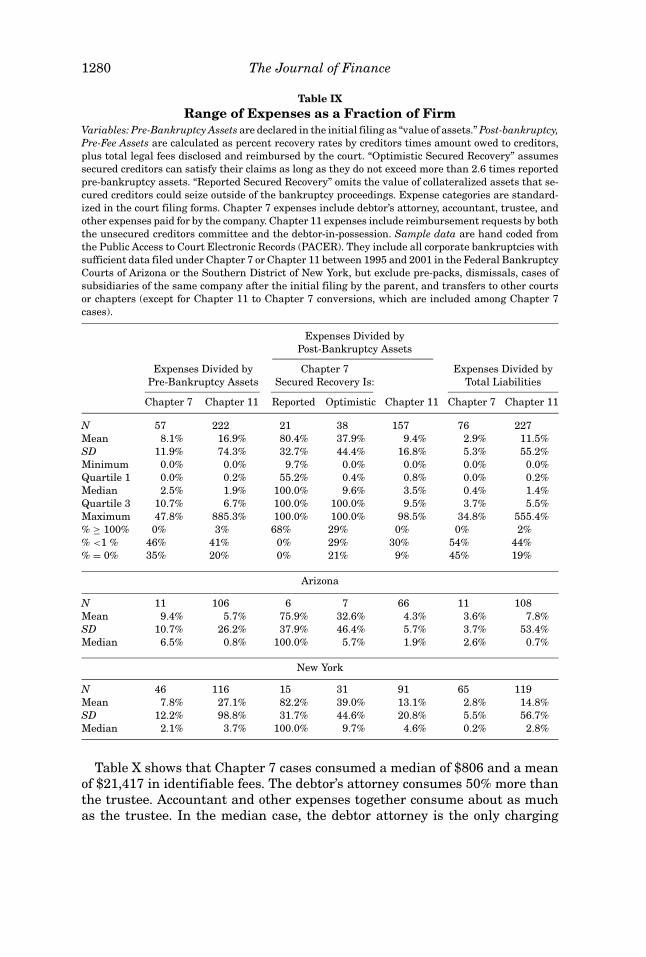
1280 The Journal of Finance
Table IXRange of Expenses as a Fraction of Firm
Variables: Pre-Bankruptcy Assets are declared in the initial filing as “value of assets.” Post-bankruptcy,Pre-Fee Assets are calculated as percent recovery rates by creditors times amount owed to creditors,plus total legal fees disclosed and reimbursed by the court. “Optimistic Secured Recovery” assumessecured creditors can satisfy their claims as long as they do not exceed more than 2.6 times reportedpre-bankruptcy assets. “Reported Secured Recovery” omits the value of collateralized assets that se-cured creditors could seize outside of the bankruptcy proceedings. Expense categories are standard-ized in the court filing forms. Chapter 7 expenses include debtor’s attorney, accountant, trustee, andother expenses paid for by the company. Chapter 11 expenses include reimbursement requests by boththe unsecured creditors committee and the debtor-in-possession. Sample data are hand coded fromthe Public Access to Court Electronic Records (PACER). They include all corporate bankruptcies withsufficient data filed under Chapter 7 or Chapter 11 between 1995 and 2001 in the Federal BankruptcyCourts of Arizona or the Southern District of New York, but exclude pre-packs, dismissals, cases ofsubsidiaries of the same company after the initial filing by the parent, and transfers to other courtsor chapters (except for Chapter 11 to Chapter 7 conversions, which are included among Chapter 7cases).
Expenses Divided byPost-Bankruptcy Assets
Expenses Divided by Chapter 7 Expenses Divided byPre-Bankruptcy Assets Secured Recovery Is: Total Liabilities
Chapter 7 Chapter 11 Reported Optimistic Chapter 11 Chapter 7 Chapter 11
N 57 222 21 38 157 76 227Mean 8.1% 16.9% 80.4% 37.9% 9.4% 2.9% 11.5%SD 11.9% 74.3% 32.7% 44.4% 16.8% 5.3% 55.2%Minimum 0.0% 0.0% 9.7% 0.0% 0.0% 0.0% 0.0%Quartile 1 0.0% 0.2% 55.2% 0.4% 0.8% 0.0% 0.2%Median 2.5% 1.9% 100.0% 9.6% 3.5% 0.4% 1.4%Quartile 3 10.7% 6.7% 100.0% 100.0% 9.5% 3.7% 5.5%Maximum 47.8% 885.3% 100.0% 100.0% 98.5% 34.8% 555.4%% ≥ 100% 0% 3% 68% 29% 0% 0% 2%% <1 % 46% 41% 0% 29% 30% 54% 44%% = 0% 35% 20% 0% 21% 9% 45% 19%
Arizona
N 11 106 6 7 66 11 108Mean 9.4% 5.7% 75.9% 32.6% 4.3% 3.6% 7.8%SD 10.7% 26.2% 37.9% 46.4% 5.7% 3.7% 53.4%Median 6.5% 0.8% 100.0% 5.7% 1.9% 2.6% 0.7%
New York
N 46 116 15 31 91 65 119Mean 7.8% 27.1% 82.2% 39.0% 13.1% 2.8% 14.8%SD 12.2% 98.8% 31.7% 44.6% 20.8% 5.5% 56.7%Median 2.1% 3.7% 100.0% 9.7% 4.6% 0.2% 2.8%
Table X shows that Chapter 7 cases consumed a median of $806 and a meanof $21,417 in identifiable fees. The debtor’s attorney consumes 50% more thanthe trustee. Accountant and other expenses together consume about as muchas the trustee. In the median case, the debtor attorney is the only charging
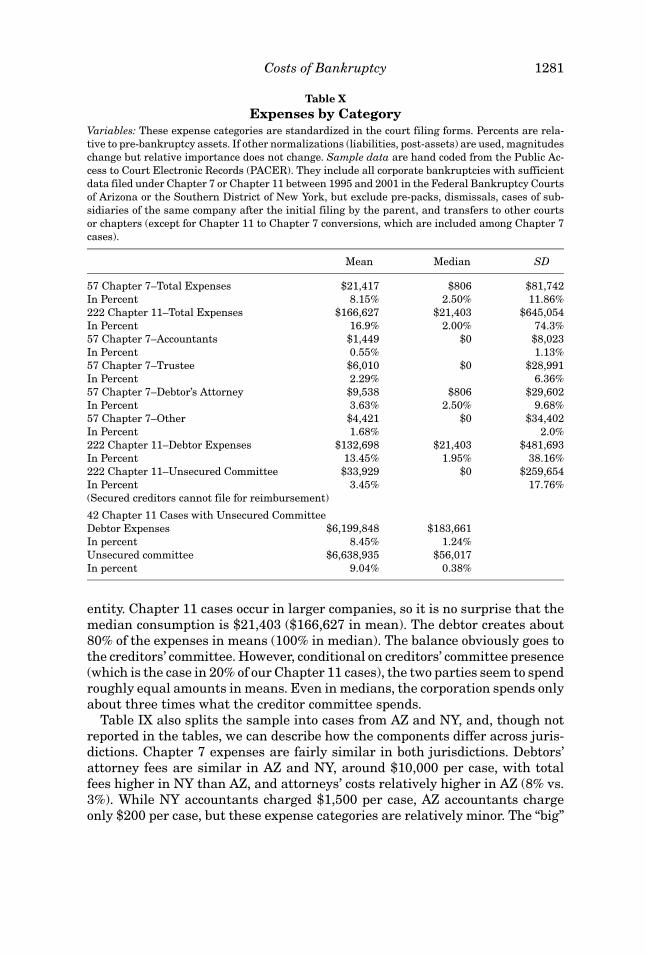
Costs of Bankruptcy 1281
Table XExpenses by Category
Variables: These expense categories are standardized in the court filing forms. Percents are rela-tive to pre-bankruptcy assets. If other normalizations (liabilities, post-assets) are used, magnitudeschange but relative importance does not change. Sample data are hand coded from the Public Ac-cess to Court Electronic Records (PACER). They include all corporate bankruptcies with sufficientdata filed under Chapter 7 or Chapter 11 between 1995 and 2001 in the Federal Bankruptcy Courtsof Arizona or the Southern District of New York, but exclude pre-packs, dismissals, cases of sub-sidiaries of the same company after the initial filing by the parent, and transfers to other courtsor chapters (except for Chapter 11 to Chapter 7 conversions, which are included among Chapter 7cases).
Mean Median SD
57 Chapter 7–Total Expenses $21,417 $806 $81,742In Percent 8.15% 2.50% 11.86%222 Chapter 11–Total Expenses $166,627 $21,403 $645,054In Percent 16.9% 2.00% 74.3%57 Chapter 7–Accountants $1,449 $0 $8,023In Percent 0.55% 1.13%57 Chapter 7–Trustee $6,010 $0 $28,991In Percent 2.29% 6.36%57 Chapter 7–Debtor’s Attorney $9,538 $806 $29,602In Percent 3.63% 2.50% 9.68%57 Chapter 7–Other $4,421 $0 $34,402In Percent 1.68% 2.0%222 Chapter 11–Debtor Expenses $132,698 $21,403 $481,693In Percent 13.45% 1.95% 38.16%222 Chapter 11–Unsecured Committee $33,929 $0 $259,654In Percent 3.45% 17.76%(Secured creditors cannot file for reimbursement)
42 Chapter 11 Cases with Unsecured CommitteeDebtor Expenses $6,199,848 $183,661In percent 8.45% 1.24%Unsecured committee $6,638,935 $56,017In percent 9.04% 0.38%
entity. Chapter 11 cases occur in larger companies, so it is no surprise that themedian consumption is $21,403 ($166,627 in mean). The debtor creates about80% of the expenses in means (100% in median). The balance obviously goes tothe creditors’ committee. However, conditional on creditors’ committee presence(which is the case in 20% of our Chapter 11 cases), the two parties seem to spendroughly equal amounts in means. Even in medians, the corporation spends onlyabout three times what the creditor committee spends.
Table IX also splits the sample into cases from AZ and NY, and, though notreported in the tables, we can describe how the components differ across juris-dictions. Chapter 7 expenses are fairly similar in both jurisdictions. Debtors’attorney fees are similar in AZ and NY, around $10,000 per case, with totalfees higher in NY than AZ, and attorneys’ costs relatively higher in AZ (8% vs.3%). While NY accountants charged $1,500 per case, AZ accountants chargeonly $200 per case, but these expense categories are relatively minor. The “big”
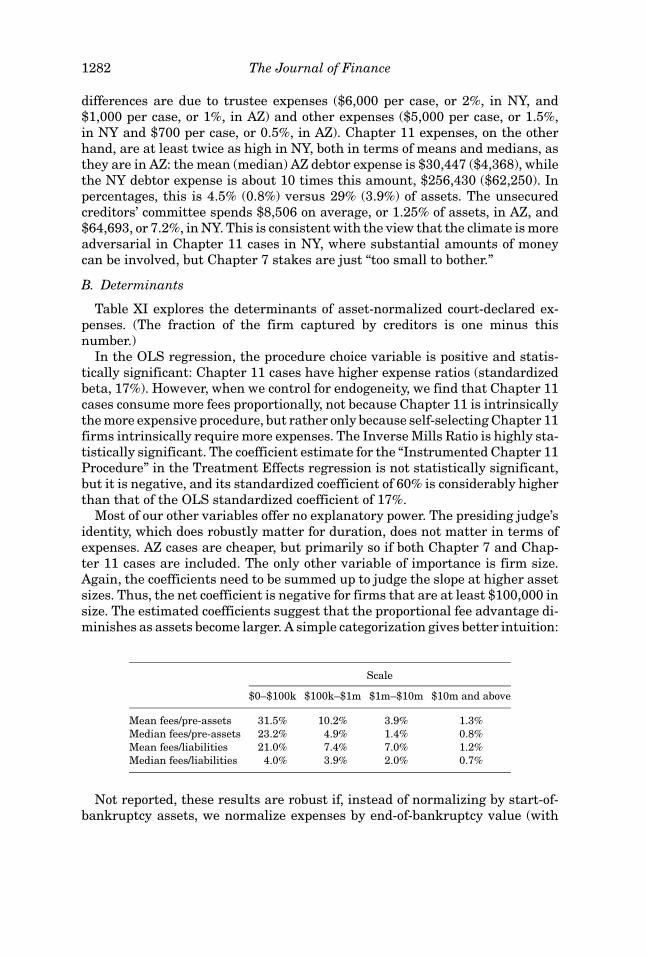
1282 The Journal of Finance
differences are due to trustee expenses ($6,000 per case, or 2%, in NY, and$1,000 per case, or 1%, in AZ) and other expenses ($5,000 per case, or 1.5%,in NY and $700 per case, or 0.5%, in AZ). Chapter 11 expenses, on the otherhand, are at least twice as high in NY, both in terms of means and medians, asthey are in AZ: the mean (median) AZ debtor expense is $30,447 ($4,368), whilethe NY debtor expense is about 10 times this amount, $256,430 ($62,250). Inpercentages, this is 4.5% (0.8%) versus 29% (3.9%) of assets. The unsecuredcreditors’ committee spends $8,506 on average, or 1.25% of assets, in AZ, and$64,693, or 7.2%, in NY. This is consistent with the view that the climate is moreadversarial in Chapter 11 cases in NY, where substantial amounts of moneycan be involved, but Chapter 7 stakes are just “too small to bother.”
B. Determinants
Table XI explores the determinants of asset-normalized court-declared ex-penses. (The fraction of the firm captured by creditors is one minus thisnumber.)
In the OLS regression, the procedure choice variable is positive and statis-tically significant: Chapter 11 cases have higher expense ratios (standardizedbeta, 17%). However, when we control for endogeneity, we find that Chapter 11cases consume more fees proportionally, not because Chapter 11 is intrinsicallythe more expensive procedure, but rather only because self-selecting Chapter 11firms intrinsically require more expenses. The Inverse Mills Ratio is highly sta-tistically significant. The coefficient estimate for the “Instrumented Chapter 11Procedure” in the Treatment Effects regression is not statistically significant,but it is negative, and its standardized coefficient of 60% is considerably higherthan that of the OLS standardized coefficient of 17%.
Most of our other variables offer no explanatory power. The presiding judge’sidentity, which does robustly matter for duration, does not matter in terms ofexpenses. AZ cases are cheaper, but primarily so if both Chapter 7 and Chap-ter 11 cases are included. The only other variable of importance is firm size.Again, the coefficients need to be summed up to judge the slope at higher assetsizes. Thus, the net coefficient is negative for firms that are at least $100,000 insize. The estimated coefficients suggest that the proportional fee advantage di-minishes as assets become larger. A simple categorization gives better intuition:
Scale
$0–$100k $100k–$1m $1m–$10m $10m and above
Mean fees/pre-assets 31.5% 10.2% 3.9% 1.3%Median fees/pre-assets 23.2% 4.9% 1.4% 0.8%Mean fees/liabilities 21.0% 7.4% 7.0% 1.2%Median fees/liabilities 4.0% 3.9% 2.0% 0.7%
Not reported, these results are robust if, instead of normalizing by start-of-bankruptcy assets, we normalize expenses by end-of-bankruptcy value (with
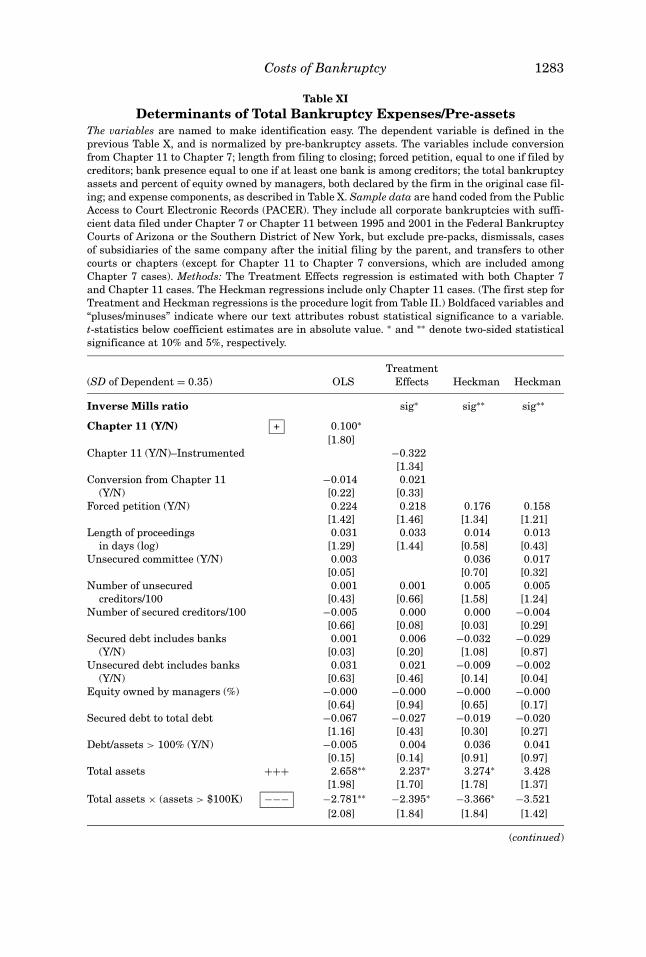
Costs of Bankruptcy 1283
Table XIDeterminants of Total Bankruptcy Expenses/Pre-assets
The variables are named to make identification easy. The dependent variable is defined in theprevious Table X, and is normalized by pre-bankruptcy assets. The variables include conversionfrom Chapter 11 to Chapter 7; length from filing to closing; forced petition, equal to one if filed bycreditors; bank presence equal to one if at least one bank is among creditors; the total bankruptcyassets and percent of equity owned by managers, both declared by the firm in the original case fil-ing; and expense components, as described in Table X. Sample data are hand coded from the PublicAccess to Court Electronic Records (PACER). They include all corporate bankruptcies with suffi-cient data filed under Chapter 7 or Chapter 11 between 1995 and 2001 in the Federal BankruptcyCourts of Arizona or the Southern District of New York, but exclude pre-packs, dismissals, casesof subsidiaries of the same company after the initial filing by the parent, and transfers to othercourts or chapters (except for Chapter 11 to Chapter 7 conversions, which are included amongChapter 7 cases). Methods: The Treatment Effects regression is estimated with both Chapter 7and Chapter 11 cases. The Heckman regressions include only Chapter 11 cases. (The first step forTreatment and Heckman regressions is the procedure logit from Table II.) Boldfaced variables and“pluses/minuses” indicate where our text attributes robust statistical significance to a variable.t-statistics below coefficient estimates are in absolute value. ∗ and ∗∗ denote two-sided statisticalsignificance at 10% and 5%, respectively.
Treatment(SD of Dependent = 0.35) OLS Effects Heckman Heckman
Inverse Mills ratio sig∗ sig∗∗ sig∗∗
Chapter 11 (Y/N) + 0.100∗
[1.80]Chapter 11 (Y/N)–Instrumented −0.322
[1.34]Conversion from Chapter 11
(Y/N)−0.014 0.021[0.22] [0.33]
Forced petition (Y/N) 0.224 0.218 0.176 0.158[1.42] [1.46] [1.34] [1.21]
Length of proceedingsin days (log)
0.031 0.033 0.014 0.013[1.29] [1.44] [0.58] [0.43]
Unsecured committee (Y/N) 0.003 0.036 0.017[0.05] [0.70] [0.32]
Number of unsecuredcreditors/100
0.001 0.001 0.005 0.005[0.43] [0.66] [1.58] [1.24]
Number of secured creditors/100 −0.005 0.000 0.000 −0.004[0.66] [0.08] [0.03] [0.29]
Secured debt includes banks(Y/N)
0.001 0.006 −0.032 −0.029[0.03] [0.20] [1.08] [0.87]
Unsecured debt includes banks(Y/N)
0.031 0.021 −0.009 −0.002[0.63] [0.46] [0.14] [0.04]
Equity owned by managers (%) −0.000 −0.000 −0.000 −0.000[0.64] [0.94] [0.65] [0.17]
Secured debt to total debt −0.067 −0.027 −0.019 −0.020[1.16] [0.43] [0.30] [0.27]
Debt/assets > 100% (Y/N) −0.005 0.004 0.036 0.041[0.15] [0.14] [0.91] [0.97]
Total assets +++ 2.658∗∗ 2.237∗ 3.274∗ 3.428[1.98] [1.70] [1.78] [1.37]
Total assets × (assets > $100K) −−− −2.781∗∗ −2.395∗ −3.366∗ −3.521[2.08] [1.84] [1.84] [1.42]
(continued)
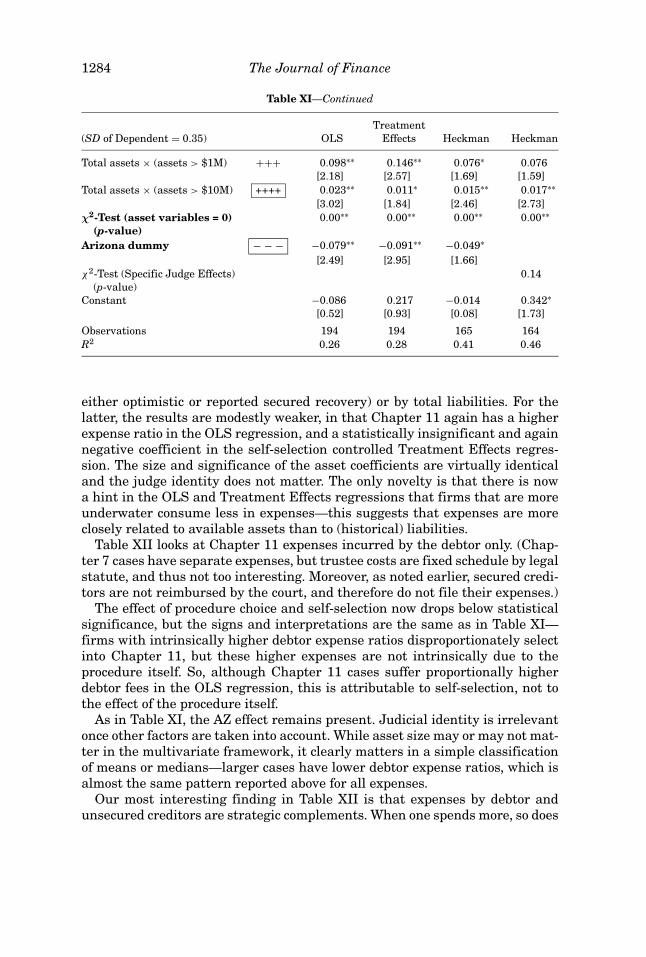
1284 The Journal of Finance
Table XI—Continued
Treatment(SD of Dependent = 0.35) OLS Effects Heckman Heckman
Total assets × (assets > $1M) +++ 0.098∗∗ 0.146∗∗ 0.076∗ 0.076[2.18] [2.57] [1.69] [1.59]
Total assets × (assets > $10M) ++++ 0.023∗∗ 0.011∗ 0.015∗∗ 0.017∗∗
[3.02] [1.84] [2.46] [2.73]χ2-Test (asset variables = 0)
(p-value)0.00∗∗ 0.00∗∗ 0.00∗∗ 0.00∗∗
Arizona dummy − − − −0.079∗∗ −0.091∗∗ −0.049∗
[2.49] [2.95] [1.66]χ2-Test (Specific Judge Effects)
(p-value)0.14
Constant −0.086 0.217 −0.014 0.342∗[0.52] [0.93] [0.08] [1.73]
Observations 194 194 165 164R2 0.26 0.28 0.41 0.46
either optimistic or reported secured recovery) or by total liabilities. For thelatter, the results are modestly weaker, in that Chapter 11 again has a higherexpense ratio in the OLS regression, and a statistically insignificant and againnegative coefficient in the self-selection controlled Treatment Effects regres-sion. The size and significance of the asset coefficients are virtually identicaland the judge identity does not matter. The only novelty is that there is nowa hint in the OLS and Treatment Effects regressions that firms that are moreunderwater consume less in expenses—this suggests that expenses are moreclosely related to available assets than to (historical) liabilities.
Table XII looks at Chapter 11 expenses incurred by the debtor only. (Chap-ter 7 cases have separate expenses, but trustee costs are fixed schedule by legalstatute, and thus not too interesting. Moreover, as noted earlier, secured credi-tors are not reimbursed by the court, and therefore do not file their expenses.)
The effect of procedure choice and self-selection now drops below statisticalsignificance, but the signs and interpretations are the same as in Table XI—firms with intrinsically higher debtor expense ratios disproportionately selectinto Chapter 11, but these higher expenses are not intrinsically due to theprocedure itself. So, although Chapter 11 cases suffer proportionally higherdebtor fees in the OLS regression, this is attributable to self-selection, not tothe effect of the procedure itself.
As in Table XI, the AZ effect remains present. Judicial identity is irrelevantonce other factors are taken into account. While asset size may or may not mat-ter in the multivariate framework, it clearly matters in a simple classificationof means or medians—larger cases have lower debtor expense ratios, which isalmost the same pattern reported above for all expenses.
Our most interesting finding in Table XII is that expenses by debtor andunsecured creditors are strategic complements. When one spends more, so does
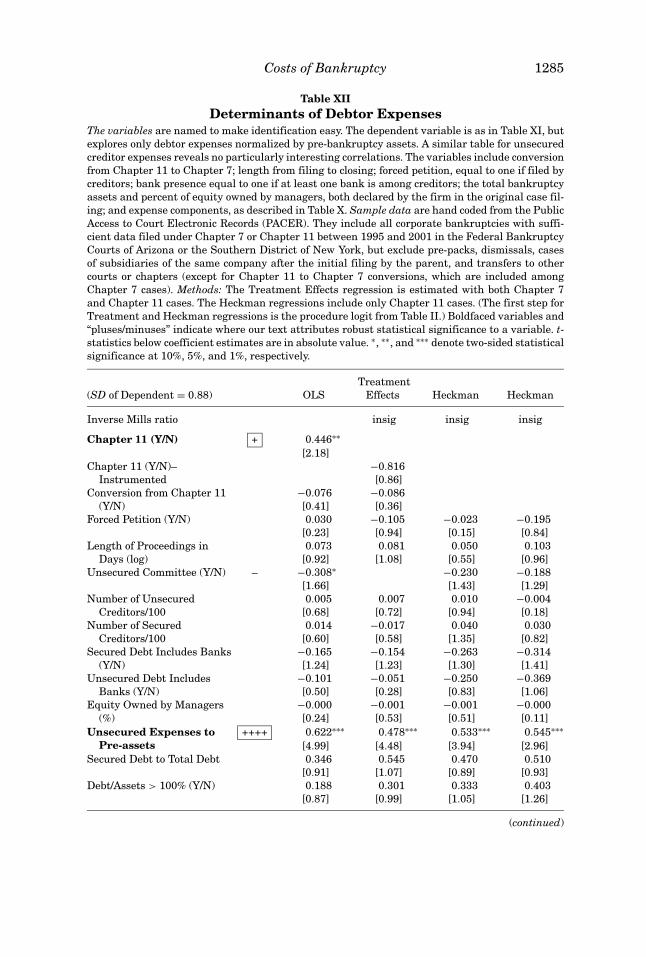
Costs of Bankruptcy 1285
Table XIIDeterminants of Debtor Expenses
The variables are named to make identification easy. The dependent variable is as in Table XI, butexplores only debtor expenses normalized by pre-bankruptcy assets. A similar table for unsecuredcreditor expenses reveals no particularly interesting correlations. The variables include conversionfrom Chapter 11 to Chapter 7; length from filing to closing; forced petition, equal to one if filed bycreditors; bank presence equal to one if at least one bank is among creditors; the total bankruptcyassets and percent of equity owned by managers, both declared by the firm in the original case fil-ing; and expense components, as described in Table X. Sample data are hand coded from the PublicAccess to Court Electronic Records (PACER). They include all corporate bankruptcies with suffi-cient data filed under Chapter 7 or Chapter 11 between 1995 and 2001 in the Federal BankruptcyCourts of Arizona or the Southern District of New York, but exclude pre-packs, dismissals, casesof subsidiaries of the same company after the initial filing by the parent, and transfers to othercourts or chapters (except for Chapter 11 to Chapter 7 conversions, which are included amongChapter 7 cases). Methods: The Treatment Effects regression is estimated with both Chapter 7and Chapter 11 cases. The Heckman regressions include only Chapter 11 cases. (The first step forTreatment and Heckman regressions is the procedure logit from Table II.) Boldfaced variables and“pluses/minuses” indicate where our text attributes robust statistical significance to a variable. t-statistics below coefficient estimates are in absolute value. ∗, ∗∗, and ∗∗∗ denote two-sided statisticalsignificance at 10%, 5%, and 1%, respectively.
Treatment(SD of Dependent = 0.88) OLS Effects Heckman Heckman
Inverse Mills ratio insig insig insig
Chapter 11 (Y/N) + 0.446∗∗
[2.18]Chapter 11 (Y/N)–
Instrumented−0.816[0.86]
Conversion from Chapter 11(Y/N)
−0.076 −0.086[0.41] [0.36]
Forced Petition (Y/N) 0.030 −0.105 −0.023 −0.195[0.23] [0.94] [0.15] [0.84]
Length of Proceedings inDays (log)
0.073 0.081 0.050 0.103[0.92] [1.08] [0.55] [0.96]
Unsecured Committee (Y/N) – −0.308∗ −0.230 −0.188[1.66] [1.43] [1.29]
Number of UnsecuredCreditors/100
0.005 0.007 0.010 −0.004[0.68] [0.72] [0.94] [0.18]
Number of SecuredCreditors/100
0.014 −0.017 0.040 0.030[0.60] [0.58] [1.35] [0.82]
Secured Debt Includes Banks(Y/N)
−0.165 −0.154 −0.263 −0.314[1.24] [1.23] [1.30] [1.41]
Unsecured Debt IncludesBanks (Y/N)
−0.101 −0.051 −0.250 −0.369[0.50] [0.28] [0.83] [1.06]
Equity Owned by Managers(%)
−0.000 −0.001 −0.001 −0.000[0.24] [0.53] [0.51] [0.11]
Unsecured Expenses toPre-assets
++++ 0.622∗∗∗ 0.478∗∗∗ 0.533∗∗∗ 0.545∗∗∗
[4.99] [4.48] [3.94] [2.96]Secured Debt to Total Debt 0.346 0.545 0.470 0.510
[0.91] [1.07] [0.89] [0.93]Debt/Assets > 100% (Y/N) 0.188 0.301 0.333 0.403
[0.87] [0.99] [1.05] [1.26]
(continued)
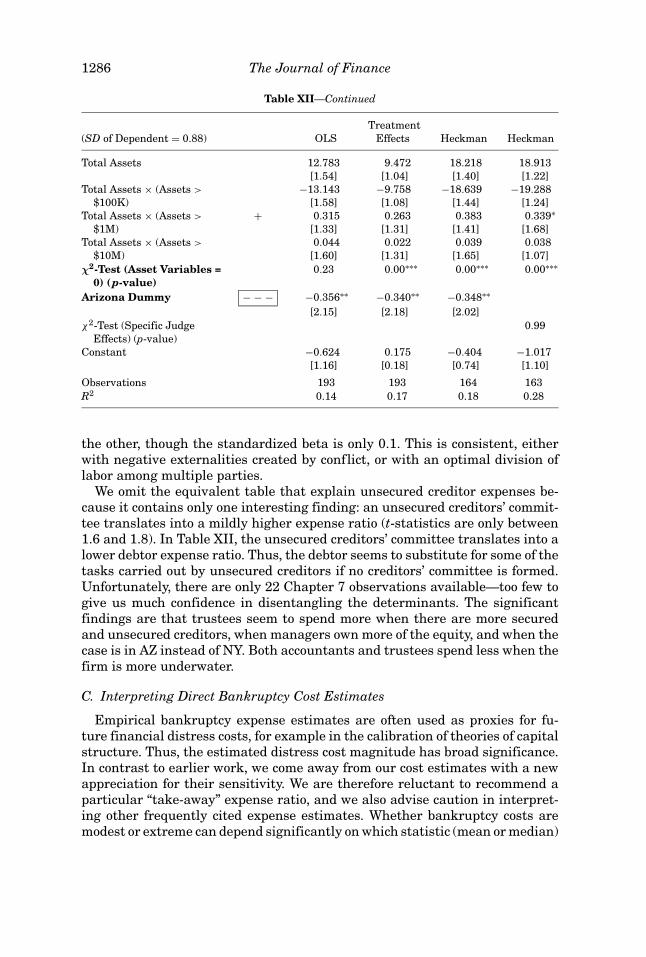
1286 The Journal of Finance
Table XII—Continued
Treatment(SD of Dependent = 0.88) OLS Effects Heckman Heckman
Total Assets 12.783 9.472 18.218 18.913[1.54] [1.04] [1.40] [1.22]
Total Assets × (Assets >
$100K)−13.143 −9.758 −18.639 −19.288
[1.58] [1.08] [1.44] [1.24]Total Assets × (Assets >
$1M)+ 0.315 0.263 0.383 0.339∗
[1.33] [1.31] [1.41] [1.68]Total Assets × (Assets >
$10M)0.044 0.022 0.039 0.038
[1.60] [1.31] [1.65] [1.07]χ2-Test (Asset Variables =
0) (p-value)0.23 0.00∗∗∗ 0.00∗∗∗ 0.00∗∗∗
Arizona Dummy − − − −0.356∗∗ −0.340∗∗ −0.348∗∗
[2.15] [2.18] [2.02]χ2-Test (Specific Judge
Effects) (p-value)0.99
Constant −0.624 0.175 −0.404 −1.017[1.16] [0.18] [0.74] [1.10]
Observations 193 193 164 163R2 0.14 0.17 0.18 0.28
the other, though the standardized beta is only 0.1. This is consistent, eitherwith negative externalities created by conflict, or with an optimal division oflabor among multiple parties.
We omit the equivalent table that explain unsecured creditor expenses be-cause it contains only one interesting finding: an unsecured creditors’ commit-tee translates into a mildly higher expense ratio (t-statistics are only between1.6 and 1.8). In Table XII, the unsecured creditors’ committee translates into alower debtor expense ratio. Thus, the debtor seems to substitute for some of thetasks carried out by unsecured creditors if no creditors’ committee is formed.Unfortunately, there are only 22 Chapter 7 observations available—too few togive us much confidence in disentangling the determinants. The significantfindings are that trustees seem to spend more when there are more securedand unsecured creditors, when managers own more of the equity, and when thecase is in AZ instead of NY. Both accountants and trustees spend less when thefirm is more underwater.
C. Interpreting Direct Bankruptcy Cost Estimates
Empirical bankruptcy expense estimates are often used as proxies for fu-ture financial distress costs, for example in the calibration of theories of capitalstructure. Thus, the estimated distress cost magnitude has broad significance.In contrast to earlier work, we come away from our cost estimates with a newappreciation for their sensitivity. We are therefore reluctant to recommend aparticular “take-away” expense ratio, and we also advise caution in interpret-ing other frequently cited expense estimates. Whether bankruptcy costs aremodest or extreme can depend significantly on which statistic (mean or median)
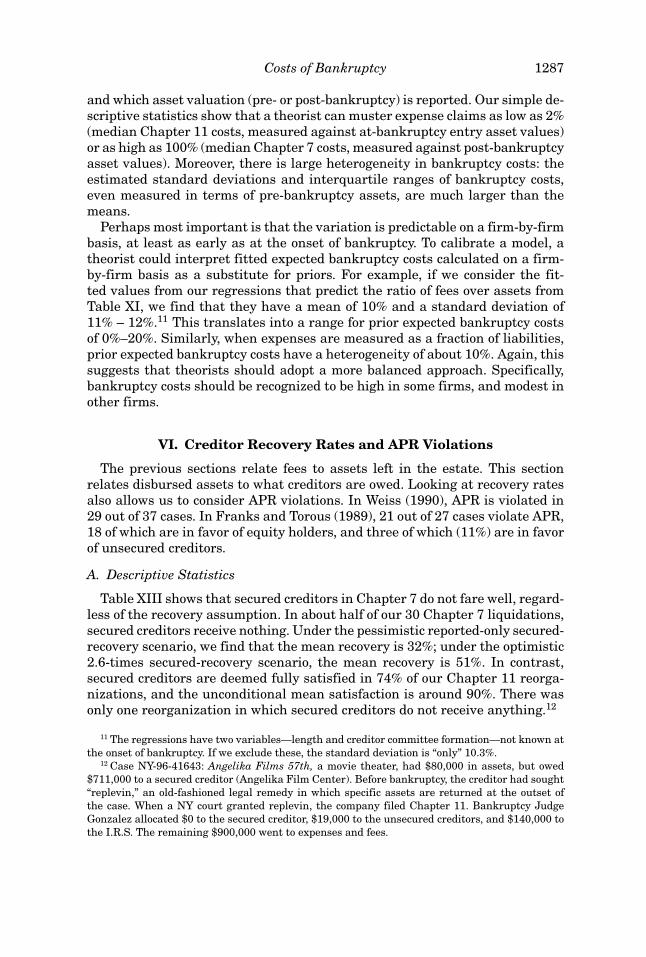
Costs of Bankruptcy 1287
and which asset valuation (pre- or post-bankruptcy) is reported. Our simple de-scriptive statistics show that a theorist can muster expense claims as low as 2%(median Chapter 11 costs, measured against at-bankruptcy entry asset values)or as high as 100% (median Chapter 7 costs, measured against post-bankruptcyasset values). Moreover, there is large heterogeneity in bankruptcy costs: theestimated standard deviations and interquartile ranges of bankruptcy costs,even measured in terms of pre-bankruptcy assets, are much larger than themeans.
Perhaps most important is that the variation is predictable on a firm-by-firmbasis, at least as early as at the onset of bankruptcy. To calibrate a model, atheorist could interpret fitted expected bankruptcy costs calculated on a firm-by-firm basis as a substitute for priors. For example, if we consider the fit-ted values from our regressions that predict the ratio of fees over assets fromTable XI, we find that they have a mean of 10% and a standard deviation of11% – 12%.11 This translates into a range for prior expected bankruptcy costsof 0%–20%. Similarly, when expenses are measured as a fraction of liabilities,prior expected bankruptcy costs have a heterogeneity of about 10%. Again, thissuggests that theorists should adopt a more balanced approach. Specifically,bankruptcy costs should be recognized to be high in some firms, and modest inother firms.
VI. Creditor Recovery Rates and APR Violations
The previous sections relate fees to assets left in the estate. This sectionrelates disbursed assets to what creditors are owed. Looking at recovery ratesalso allows us to consider APR violations. In Weiss (1990), APR is violated in29 out of 37 cases. In Franks and Torous (1989), 21 out of 27 cases violate APR,18 of which are in favor of equity holders, and three of which (11%) are in favorof unsecured creditors.
A. Descriptive Statistics
Table XIII shows that secured creditors in Chapter 7 do not fare well, regard-less of the recovery assumption. In about half of our 30 Chapter 7 liquidations,secured creditors receive nothing. Under the pessimistic reported-only secured-recovery scenario, we find that the mean recovery is 32%; under the optimistic2.6-times secured-recovery scenario, the mean recovery is 51%. In contrast,secured creditors are deemed fully satisfied in 74% of our Chapter 11 reorga-nizations, and the unconditional mean satisfaction is around 90%. There wasonly one reorganization in which secured creditors do not receive anything.12
11 The regressions have two variables—length and creditor committee formation—not known atthe onset of bankruptcy. If we exclude these, the standard deviation is “only” 10.3%.
12 Case NY-96-41643: Angelika Films 57th, a movie theater, had $80,000 in assets, but owed$711,000 to a secured creditor (Angelika Film Center). Before bankruptcy, the creditor had sought“replevin,” an old-fashioned legal remedy in which specific assets are returned at the outset ofthe case. When a NY court granted replevin, the company filed Chapter 11. Bankruptcy JudgeGonzalez allocated $0 to the secured creditor, $19,000 to the unsecured creditors, and $140,000 tothe I.R.S. The remaining $900,000 went to expenses and fees.
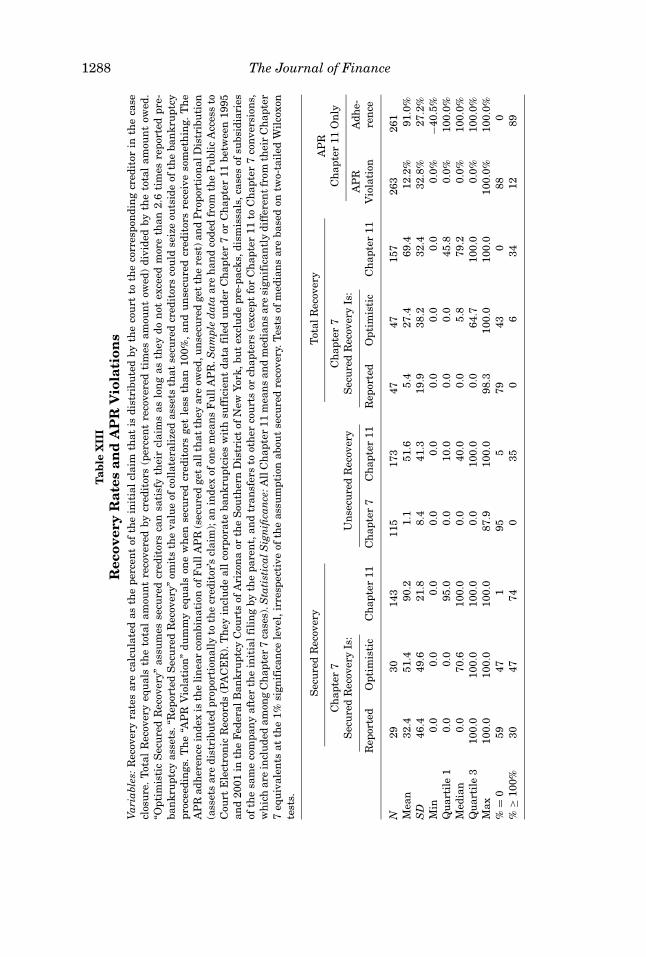
1288 The Journal of Finance
Tab
leX
III
Rec
over
yR
ates
and
AP
RV
iola
tion
sV
aria
bles
:Rec
over
yra
tes
are
calc
ula
ted
asth
epe
rcen
tof
the
init
ial
clai
mth
atis
dist
ribu
ted
byth
eco
urt
toth
eco
rres
pon
din
gcr
edit
orin
the
case
clos
ure
.T
otal
Rec
over
yeq
ual
sth
eto
tal
amou
nt
reco
vere
dby
cred
itor
s(p
erce
nt
reco
vere
dti
mes
amou
nt
owed
)di
vide
dby
the
tota
lam
oun
tow
ed.
“Opt
imis
tic
Sec
ure
dR
ecov
ery”
assu
mes
secu
red
cred
itor
sca
nsa
tisf
yth
eir
clai
ms
aslo
ng
asth
eydo
not
exce
edm
ore
than
2.6
tim
esre
port
edpr
e-ba
nkr
upt
cyas
sets
.“R
epor
ted
Sec
ure
dR
ecov
ery”
omit
sth
eva
lue
ofco
llat
eral
ized
asse
tsth
atse
cure
dcr
edit
ors
cou
ldse
ize
outs
ide
ofth
eba
nkr
upt
cypr
ocee
din
gs.
Th
e“A
PR
Vio
lati
on”
dum
my
equ
als
one
wh
ense
cure
dcr
edit
ors
get
less
than
100%
,an
du
nse
cure
dcr
edit
ors
rece
ive
som
eth
ing.
Th
eA
PR
adh
eren
cein
dex
isth
eli
nea
rco
mbi
nat
ion
ofF
ull
AP
R(s
ecu
red
get
allt
hat
they
are
owed
,un
secu
red
get
the
rest
)an
dP
ropo
rtio
nal
Dis
trib
uti
on(a
sset
sar
edi
stri
bute
dpr
opor
tion
ally
toth
ecr
edit
or’s
clai
m);
anin
dex
ofon
em
ean
sF
ull
AP
R.S
ampl
ed
ata
are
han
dco
ded
from
the
Pu
blic
Acc
ess
toC
ourt
Ele
ctro
nic
Rec
ords
(PA
CE
R).
Th
eyin
clu
deal
lco
rpor
ate
ban
kru
ptci
esw
ith
suff
icie
nt
data
file
du
nde
rC
hap
ter
7or
Ch
apte
r11
betw
een
1995
and
2001
inth
eF
eder
alB
ankr
upt
cyC
ourt
sof
Ari
zon
aor
the
Sou
ther
nD
istr
ict
ofN
ewYo
rk,b
ut
excl
ude
pre-
pack
s,di
smis
sals
,cas
esof
subs
idia
ries
ofth
esa
me
com
pan
yaf
ter
the
init
ialf
ilin
gby
the
pare
nt,
and
tran
sfer
sto
oth
erco
urt
sor
chap
ters
(exc
ept
for
Ch
apte
r11
toC
hap
ter
7co
nve
rsio
ns,
wh
ich
are
incl
ude
dam
ong
Ch
apte
r7
case
s).S
tati
stic
alS
ign
ifica
nce
:All
Ch
apte
r11
mea
ns
and
med
ian
sar
esi
gnif
ican
tly
diff
eren
tfr
omth
eir
Ch
apte
r7
equ
ival
ents
atth
e1%
sign
ific
ance
leve
l,ir
resp
ecti
veof
the
assu
mpt
ion
abou
tse
cure
dre
cove
ry.T
ests
ofm
edia
ns
are
base
don
two-
tail
edW
ilco
xon
test
s.
Sec
ure
dR
ecov
ery
Tot
alR
ecov
ery
AP
RC
hap
ter
7C
hap
ter
7C
hap
ter
11O
nly
Sec
ure
dR
ecov
ery
Is:
Un
secu
red
Rec
over
yS
ecu
red
Rec
over
yIs
:A
PR
Adh
e-R
epor
ted
Opt
imis
tic
Ch
apte
r11
Ch
apte
r7
Ch
apte
r11
Rep
orte
dO
ptim
isti
cC
hap
ter
11V
iola
tion
ren
ce
N29
3014
311
517
347
4715
726
326
1M
ean
32.4
51.4
90.2
1.1
51.6
5.4
27.4
69.4
12.2
%91
.0%
SD
46.4
49.6
21.8
8.4
41.3
19.9
38.2
32.4
32.8
%27
.2%
Min
0.0
0.0
0.0
0.0
0.0
0.0
0.0
0.0
0.0%
−40.
5%Q
uar
tile
10.
00.
095
.00.
010
.00.
00.
045
.80.
0%10
0.0%
Med
ian
0.0
70.6
100.
00.
040
.00.
05.
879
.20.
0%10
0.0%
Qu
arti
le3
100.
010
0.0
100.
00.
010
0.0
0.0
64.7
100.
00.
0%10
0.0%
Max
100.
010
0.0
100.
087
.910
0.0
98.3
100.
010
0.0
100.
0%10
0.0%
%=
059
471
955
7943
088
0%
≥10
0%30
4774
035
06
3412
89
Costs of Bankruptcy 1289
Fortunately, unlike secured recovery rates, our unsecured recovery rates are,if anything, more reliable in Chapter 7 liquidations than in Chapter 11 reor-ganizations. We find that unsecured creditors receive nothing in 95% of ourChapter 7 cases. The mean recovery rate is 1%, all driven by one case.13 Unse-cured creditors in Chapter 11 are more fortunate. Their mean (median) recoveryrate was 52% (40%).14
Putting secured and unsecured recovery together shows that creditors inChapter 11 reorganizations fare significantly better (mean 69%, median 79%)than creditors in Chapter 7 liquidations. Even in the optimistic 2.6-timessecured-recovery scenario, the mean is 27% and the median is 6%. In the pes-simistic scenario, this drops to 5.4% and 0%, respectively.
In Chapter 7, APR is always followed. Therefore, Table XIII reports only onAPR violations in Chapter 11 reorganizations. In 88% of these cases, APR isstrictly followed, and in 12% it is modified. The final column computes an APRindex: for a case that follows proportional allocation (i.e., ignores APR), theindex is zero. For a firm that follows absolute priority, the index is one. Theaverage index is 91%, though even the 25th percentile is 100%. There is oneoutlier that yields an APR adherence index of –40.5%.15 Compared to earlierstudies, we find fewer APR violations in our sample. Although violations in favorof equity are not comparable with violations in favor of unsecured creditors,there are no public equity holders in most of our cases. (Private equity doesnot seem to receive anything in our cases, but many entrepreneurs are bothunsecured lenders and equity holders.)
Conversions: Not reported, recovery rates for Chapter 7 conversions fromChapter 11 do not differ statistically from pure Chapter 7 cases. The mean re-covery rate for secured creditors is 12.75% (median 0%), and the mean recoveryrate for unsecured creditors is 2.20% (median is 0%). In total, creditors recover4.3% of their total claims (median 0%), and 28.32% (median 4.78%) if we as-sume the maximum recovery by secured creditors of 2.6 times pre-bankruptcyassets. Relative to the post-bankruptcy value of the assets, creditors receive11.74% (median 0%). The remaining assets go to pay fees.
13 In NY-98-22754, World Wide Auto Parts, secured creditors received $122,586 (100%) and un-secured creditors received $38,914 (87.5%).
14 Tax agencies were also unsecured claimants (generally with priority over other unsecuredclaimants) in many cases, and are counted as such in our paper. (A tax payment counts as arecovery.) The average Chapter 11 tax claim was 25% of assets in NY and 9% of assets in AZ, 14%of liabilities in NY and 3% in AZ. The median tax claim, however, was always $0. Although we donot have data on tax collections in Chapter 7, from reading the filings, it is our impression that inmany Chapter 7 liquidations, taxes receive most or all unsecured assets.
15 In case AZ-98-0466, Marlaine Associates, NV, Inc., secured creditors were owed $75,000(23% under proportional allocation); unsecured creditors were owed $250,000 (77%). Judge Baumawarded secured creditors 50% of what they were owed ($37,500/$75,000), and unsecured credi-tors 68.75% of what they were owed ($171,875/$250,000). Under proportional allocation, securedcreditors would have received 23%× $209,375≈$63,812. The actual recovery of $37,500 yields anAPR adherence index of –40.5.
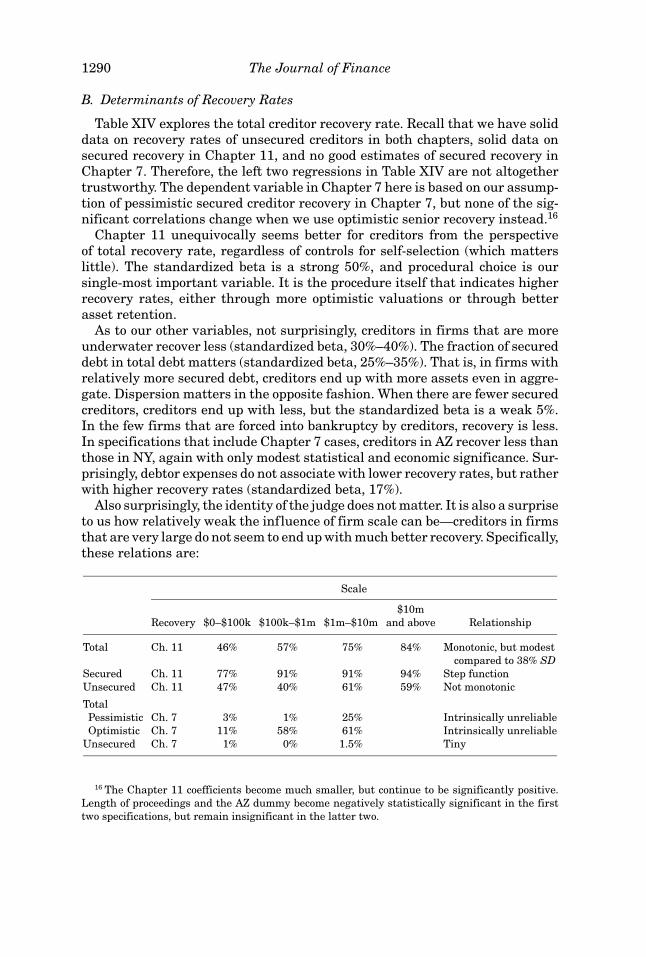
1290 The Journal of Finance
B. Determinants of Recovery Rates
Table XIV explores the total creditor recovery rate. Recall that we have soliddata on recovery rates of unsecured creditors in both chapters, solid data onsecured recovery in Chapter 11, and no good estimates of secured recovery inChapter 7. Therefore, the left two regressions in Table XIV are not altogethertrustworthy. The dependent variable in Chapter 7 here is based on our assump-tion of pessimistic secured creditor recovery in Chapter 7, but none of the sig-nificant correlations change when we use optimistic senior recovery instead.16
Chapter 11 unequivocally seems better for creditors from the perspectiveof total recovery rate, regardless of controls for self-selection (which matterslittle). The standardized beta is a strong 50%, and procedural choice is oursingle-most important variable. It is the procedure itself that indicates higherrecovery rates, either through more optimistic valuations or through betterasset retention.
As to our other variables, not surprisingly, creditors in firms that are moreunderwater recover less (standardized beta, 30%–40%). The fraction of secureddebt in total debt matters (standardized beta, 25%–35%). That is, in firms withrelatively more secured debt, creditors end up with more assets even in aggre-gate. Dispersion matters in the opposite fashion. When there are fewer securedcreditors, creditors end up with less, but the standardized beta is a weak 5%.In the few firms that are forced into bankruptcy by creditors, recovery is less.In specifications that include Chapter 7 cases, creditors in AZ recover less thanthose in NY, again with only modest statistical and economic significance. Sur-prisingly, debtor expenses do not associate with lower recovery rates, but ratherwith higher recovery rates (standardized beta, 17%).
Also surprisingly, the identity of the judge does not matter. It is also a surpriseto us how relatively weak the influence of firm scale can be—creditors in firmsthat are very large do not seem to end up with much better recovery. Specifically,these relations are:
Scale
$10mRecovery $0–$100k $100k–$1m $1m–$10m and above Relationship
Total Ch. 11 46% 57% 75% 84% Monotonic, but modestcompared to 38% SD
Secured Ch. 11 77% 91% 91% 94% Step functionUnsecured Ch. 11 47% 40% 61% 59% Not monotonic
TotalPessimistic Ch. 7 3% 1% 25% Intrinsically unreliableOptimistic Ch. 7 11% 58% 61% Intrinsically unreliable
Unsecured Ch. 7 1% 0% 1.5% Tiny
16 The Chapter 11 coefficients become much smaller, but continue to be significantly positive.Length of proceedings and the AZ dummy become negatively statistically significant in the firsttwo specifications, but remain insignificant in the latter two.
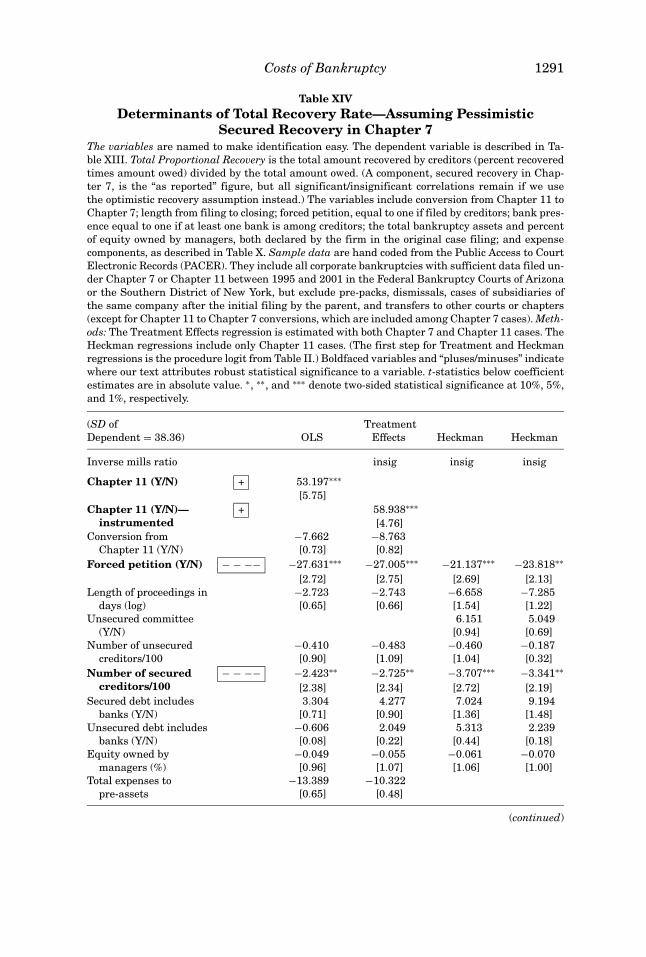
Costs of Bankruptcy 1291
Table XIVDeterminants of Total Recovery Rate—Assuming Pessimistic
Secured Recovery in Chapter 7The variables are named to make identification easy. The dependent variable is described in Ta-ble XIII. Total Proportional Recovery is the total amount recovered by creditors (percent recoveredtimes amount owed) divided by the total amount owed. (A component, secured recovery in Chap-ter 7, is the “as reported” figure, but all significant/insignificant correlations remain if we usethe optimistic recovery assumption instead.) The variables include conversion from Chapter 11 toChapter 7; length from filing to closing; forced petition, equal to one if filed by creditors; bank pres-ence equal to one if at least one bank is among creditors; the total bankruptcy assets and percentof equity owned by managers, both declared by the firm in the original case filing; and expensecomponents, as described in Table X. Sample data are hand coded from the Public Access to CourtElectronic Records (PACER). They include all corporate bankruptcies with sufficient data filed un-der Chapter 7 or Chapter 11 between 1995 and 2001 in the Federal Bankruptcy Courts of Arizonaor the Southern District of New York, but exclude pre-packs, dismissals, cases of subsidiaries ofthe same company after the initial filing by the parent, and transfers to other courts or chapters(except for Chapter 11 to Chapter 7 conversions, which are included among Chapter 7 cases). Meth-ods: The Treatment Effects regression is estimated with both Chapter 7 and Chapter 11 cases. TheHeckman regressions include only Chapter 11 cases. (The first step for Treatment and Heckmanregressions is the procedure logit from Table II.) Boldfaced variables and “pluses/minuses” indicatewhere our text attributes robust statistical significance to a variable. t-statistics below coefficientestimates are in absolute value. ∗, ∗∗, and ∗∗∗ denote two-sided statistical significance at 10%, 5%,and 1%, respectively.
(SD of TreatmentDependent = 38.36) OLS Effects Heckman Heckman
Inverse mills ratio insig insig insig
Chapter 11 (Y/N) + 53.197∗∗∗
[5.75]Chapter 11 (Y/N)—
instrumented+ 58.938∗∗∗
[4.76]Conversion from
Chapter 11 (Y/N)−7.662 −8.763[0.73] [0.82]
Forced petition (Y/N) − − −− −27.631∗∗∗ −27.005∗∗∗ −21.137∗∗∗ −23.818∗∗
[2.72] [2.75] [2.69] [2.13]Length of proceedings in
days (log)−2.723 −2.743 −6.658 −7.285[0.65] [0.66] [1.54] [1.22]
Unsecured committee(Y/N)
6.151 5.049[0.94] [0.69]
Number of unsecuredcreditors/100
−0.410 −0.483 −0.460 −0.187[0.90] [1.09] [1.04] [0.32]
Number of securedcreditors/100
− − −− −2.423∗∗ −2.725∗∗ −3.707∗∗∗ −3.341∗∗
[2.38] [2.34] [2.72] [2.19]Secured debt includes
banks (Y/N)3.304 4.277 7.024 9.194
[0.71] [0.90] [1.36] [1.48]Unsecured debt includes
banks (Y/N)−0.606 2.049 5.313 2.239[0.08] [0.22] [0.44] [0.18]
Equity owned bymanagers (%)
−0.049 −0.055 −0.061 −0.070[0.96] [1.07] [1.06] [1.00]
Total expenses topre-assets
−13.389 −10.322[0.65] [0.48]
(continued)
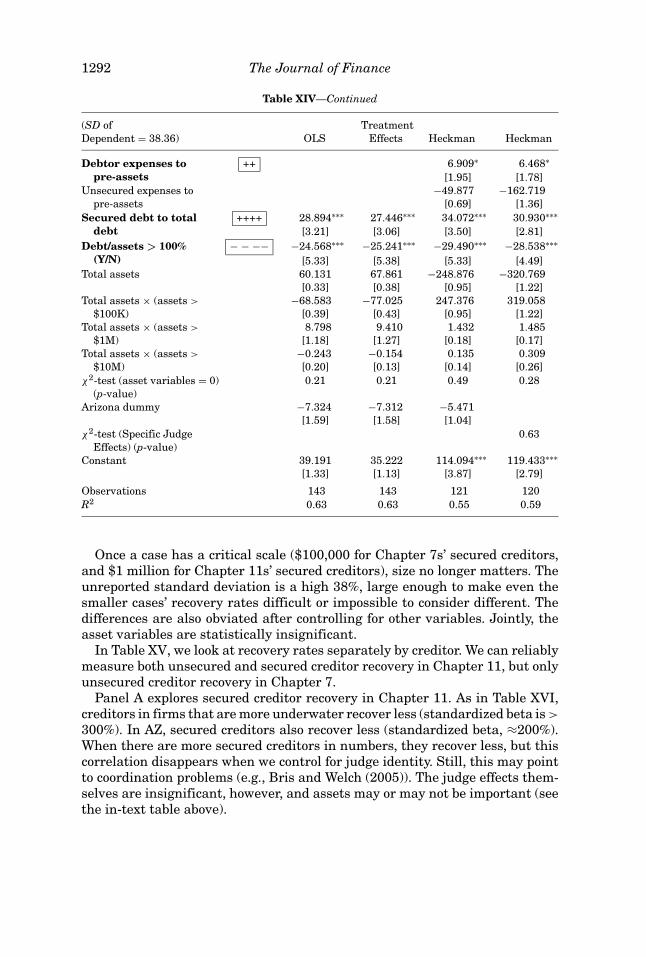
1292 The Journal of Finance
Table XIV—Continued
(SD of TreatmentDependent = 38.36) OLS Effects Heckman Heckman
Debtor expenses topre-assets
++ 6.909∗ 6.468∗
[1.95] [1.78]Unsecured expenses to
pre-assets−49.877 −162.719
[0.69] [1.36]Secured debt to total
debt++++ 28.894∗∗∗ 27.446∗∗∗ 34.072∗∗∗ 30.930∗∗∗
[3.21] [3.06] [3.50] [2.81]Debt/assets > 100%
(Y/N)− − −− −24.568∗∗∗ −25.241∗∗∗ −29.490∗∗∗ −28.538∗∗∗
[5.33] [5.38] [5.33] [4.49]Total assets 60.131 67.861 −248.876 −320.769
[0.33] [0.38] [0.95] [1.22]Total assets × (assets >
$100K)−68.583 −77.025 247.376 319.058
[0.39] [0.43] [0.95] [1.22]Total assets × (assets >
$1M)8.798 9.410 1.432 1.485
[1.18] [1.27] [0.18] [0.17]Total assets × (assets >
$10M)−0.243 −0.154 0.135 0.309[0.20] [0.13] [0.14] [0.26]
χ2-test (asset variables = 0)(p-value)
0.21 0.21 0.49 0.28
Arizona dummy −7.324 −7.312 −5.471[1.59] [1.58] [1.04]
χ2-test (Specific JudgeEffects) (p-value)
0.63
Constant 39.191 35.222 114.094∗∗∗ 119.433∗∗∗[1.33] [1.13] [3.87] [2.79]
Observations 143 143 121 120R2 0.63 0.63 0.55 0.59
Once a case has a critical scale ($100,000 for Chapter 7s’ secured creditors,and $1 million for Chapter 11s’ secured creditors), size no longer matters. Theunreported standard deviation is a high 38%, large enough to make even thesmaller cases’ recovery rates difficult or impossible to consider different. Thedifferences are also obviated after controlling for other variables. Jointly, theasset variables are statistically insignificant.
In Table XV, we look at recovery rates separately by creditor. We can reliablymeasure both unsecured and secured creditor recovery in Chapter 11, but onlyunsecured creditor recovery in Chapter 7.
Panel A explores secured creditor recovery in Chapter 11. As in Table XVI,creditors in firms that are more underwater recover less (standardized beta is >
300%). In AZ, secured creditors also recover less (standardized beta, ≈200%).When there are more secured creditors in numbers, they recover less, but thiscorrelation disappears when we control for judge identity. Still, this may pointto coordination problems (e.g., Bris and Welch (2005)). The judge effects them-selves are insignificant, however, and assets may or may not be important (seethe in-text table above).
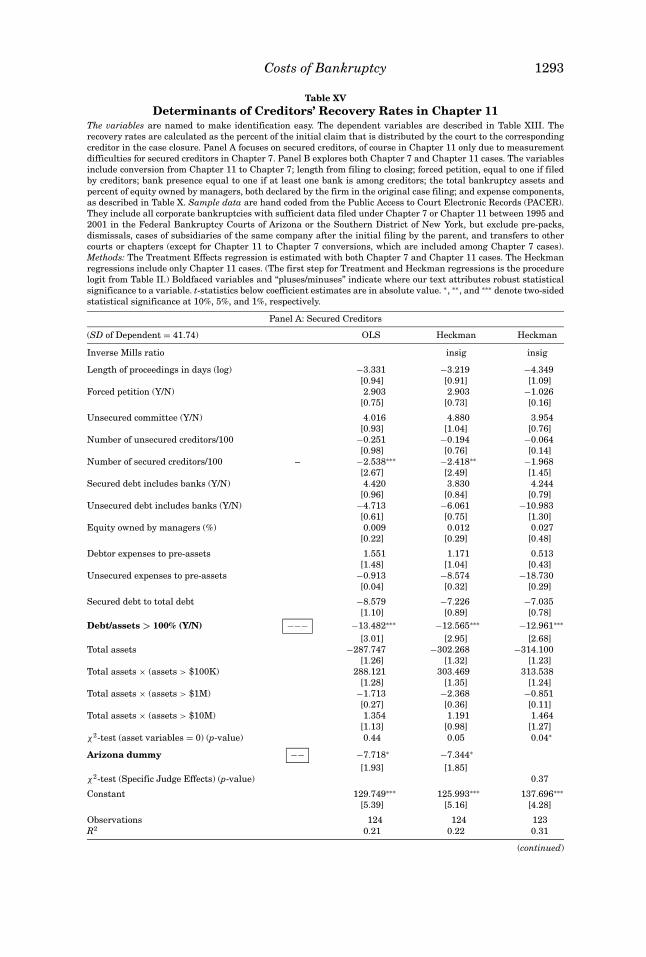
Costs of Bankruptcy 1293
Table XVDeterminants of Creditors’ Recovery Rates in Chapter 11
The variables are named to make identification easy. The dependent variables are described in Table XIII. Therecovery rates are calculated as the percent of the initial claim that is distributed by the court to the correspondingcreditor in the case closure. Panel A focuses on secured creditors, of course in Chapter 11 only due to measurementdifficulties for secured creditors in Chapter 7. Panel B explores both Chapter 7 and Chapter 11 cases. The variablesinclude conversion from Chapter 11 to Chapter 7; length from filing to closing; forced petition, equal to one if filedby creditors; bank presence equal to one if at least one bank is among creditors; the total bankruptcy assets andpercent of equity owned by managers, both declared by the firm in the original case filing; and expense components,as described in Table X. Sample data are hand coded from the Public Access to Court Electronic Records (PACER).They include all corporate bankruptcies with sufficient data filed under Chapter 7 or Chapter 11 between 1995 and2001 in the Federal Bankruptcy Courts of Arizona or the Southern District of New York, but exclude pre-packs,dismissals, cases of subsidiaries of the same company after the initial filing by the parent, and transfers to othercourts or chapters (except for Chapter 11 to Chapter 7 conversions, which are included among Chapter 7 cases).Methods: The Treatment Effects regression is estimated with both Chapter 7 and Chapter 11 cases. The Heckmanregressions include only Chapter 11 cases. (The first step for Treatment and Heckman regressions is the procedurelogit from Table II.) Boldfaced variables and “pluses/minuses” indicate where our text attributes robust statisticalsignificance to a variable. t-statistics below coefficient estimates are in absolute value. ∗, ∗∗, and ∗∗∗ denote two-sidedstatistical significance at 10%, 5%, and 1%, respectively.
Panel A: Secured Creditors
(SD of Dependent = 41.74) OLS Heckman Heckman
Inverse Mills ratio insig insig
Length of proceedings in days (log) −3.331 −3.219 −4.349[0.94] [0.91] [1.09]
Forced petition (Y/N) 2.903 2.903 −1.026[0.75] [0.73] [0.16]
Unsecured committee (Y/N) 4.016 4.880 3.954[0.93] [1.04] [0.76]
Number of unsecured creditors/100 −0.251 −0.194 −0.064[0.98] [0.76] [0.14]
Number of secured creditors/100 – −2.538∗∗∗ −2.418∗∗ −1.968[2.67] [2.49] [1.45]
Secured debt includes banks (Y/N) 4.420 3.830 4.244[0.96] [0.84] [0.79]
Unsecured debt includes banks (Y/N) −4.713 −6.061 −10.983[0.61] [0.75] [1.30]
Equity owned by managers (%) 0.009 0.012 0.027[0.22] [0.29] [0.48]
Debtor expenses to pre-assets 1.551 1.171 0.513[1.48] [1.04] [0.43]
Unsecured expenses to pre-assets −0.913 −8.574 −18.730[0.04] [0.32] [0.29]
Secured debt to total debt −8.579 −7.226 −7.035[1.10] [0.89] [0.78]
Debt/assets > 100% (Y/N) −−− −13.482∗∗∗ −12.565∗∗∗ −12.961∗∗∗
[3.01] [2.95] [2.68]Total assets −287.747 −302.268 −314.100
[1.26] [1.32] [1.23]Total assets × (assets > $100K) 288.121 303.469 313.538
[1.28] [1.35] [1.24]Total assets × (assets > $1M) −1.713 −2.368 −0.851
[0.27] [0.36] [0.11]Total assets × (assets > $10M) 1.354 1.191 1.464
[1.13] [0.98] [1.27]χ2-test (asset variables = 0) (p-value) 0.44 0.05 0.04∗
Arizona dummy −− −7.718∗ −7.344∗
[1.93] [1.85]χ2-test (Specific Judge Effects) (p-value) 0.37
Constant 129.749∗∗∗ 125.993∗∗∗ 137.696∗∗∗
[5.39] [5.16] [4.28]
Observations 124 124 123R2 0.21 0.22 0.31
(continued)
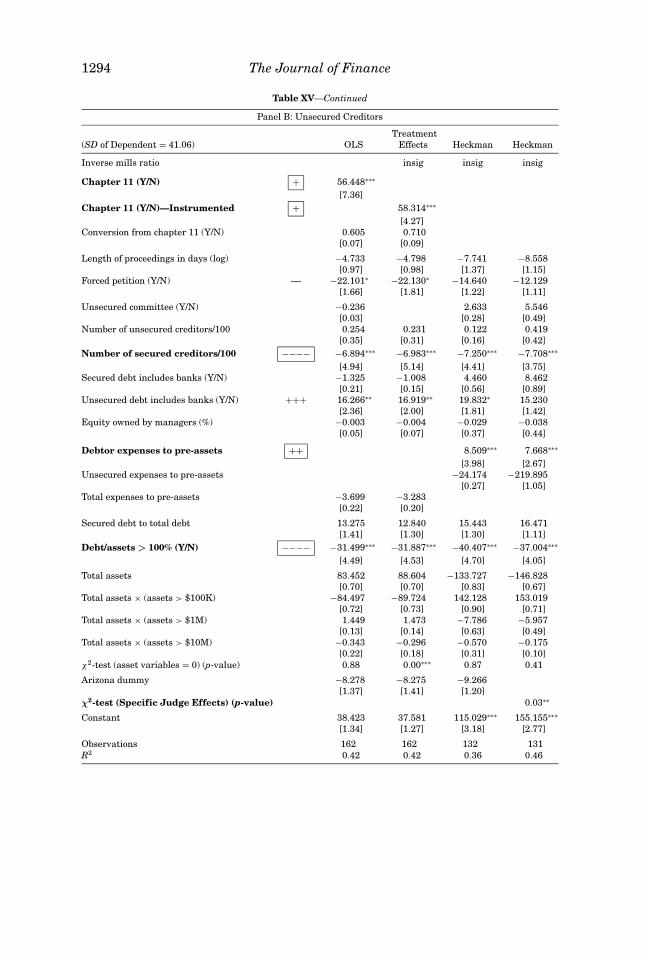
1294 The Journal of Finance
Table XV—Continued
Panel B: Unsecured Creditors
Treatment(SD of Dependent = 41.06) OLS Effects Heckman Heckman
Inverse mills ratio insig insig insig
Chapter 11 (Y/N) + 56.448∗∗∗
[7.36]Chapter 11 (Y/N)—Instrumented + 58.314∗∗∗
[4.27]Conversion from chapter 11 (Y/N) 0.605 0.710
[0.07] [0.09]
Length of proceedings in days (log) −4.733 −4.798 −7.741 −8.558[0.97] [0.98] [1.37] [1.15]
Forced petition (Y/N) –– −22.101∗ −22.130∗ −14.640 −12.129[1.66] [1.81] [1.22] [1.11]
Unsecured committee (Y/N) −0.236 2.633 5.546[0.03] [0.28] [0.49]
Number of unsecured creditors/100 0.254 0.231 0.122 0.419[0.35] [0.31] [0.16] [0.42]
Number of secured creditors/100 −−−− −6.894∗∗∗ −6.983∗∗∗ −7.250∗∗∗ −7.708∗∗∗
[4.94] [5.14] [4.41] [3.75]Secured debt includes banks (Y/N) −1.325 −1.008 4.460 8.462
[0.21] [0.15] [0.56] [0.89]Unsecured debt includes banks (Y/N) +++ 16.266∗∗ 16.919∗∗ 19.832∗ 15.230
[2.36] [2.00] [1.81] [1.42]Equity owned by managers (%) −0.003 −0.004 −0.029 −0.038
[0.05] [0.07] [0.37] [0.44]
Debtor expenses to pre-assets ++ 8.509∗∗∗ 7.668∗∗∗
[3.98] [2.67]Unsecured expenses to pre-assets −24.174 −219.895
[0.27] [1.05]Total expenses to pre-assets −3.699 −3.283
[0.22] [0.20]
Secured debt to total debt 13.275 12.840 15.443 16.471[1.41] [1.30] [1.30] [1.11]
Debt/assets > 100% (Y/N) −−−− −31.499∗∗∗ −31.887∗∗∗ −40.407∗∗∗ −37.004∗∗∗
[4.49] [4.53] [4.70] [4.05]
Total assets 83.452 88.604 −133.727 −146.828[0.70] [0.70] [0.83] [0.67]
Total assets × (assets > $100K) −84.497 −89.724 142.128 153.019[0.72] [0.73] [0.90] [0.71]
Total assets × (assets > $1M) 1.449 1.473 −7.786 −5.957[0.13] [0.14] [0.63] [0.49]
Total assets × (assets > $10M) −0.343 −0.296 −0.570 −0.175[0.22] [0.18] [0.31] [0.10]
χ2-test (asset variables = 0) (p-value) 0.88 0.00∗∗∗ 0.87 0.41
Arizona dummy −8.278 −8.275 −9.266[1.37] [1.41] [1.20]
χ2-test (Specific Judge Effects) (p-value) 0.03∗∗
Constant 38.423 37.581 115.029∗∗∗ 155.155∗∗∗
[1.34] [1.27] [3.18] [2.77]
Observations 162 162 132 131R2 0.42 0.42 0.36 0.46
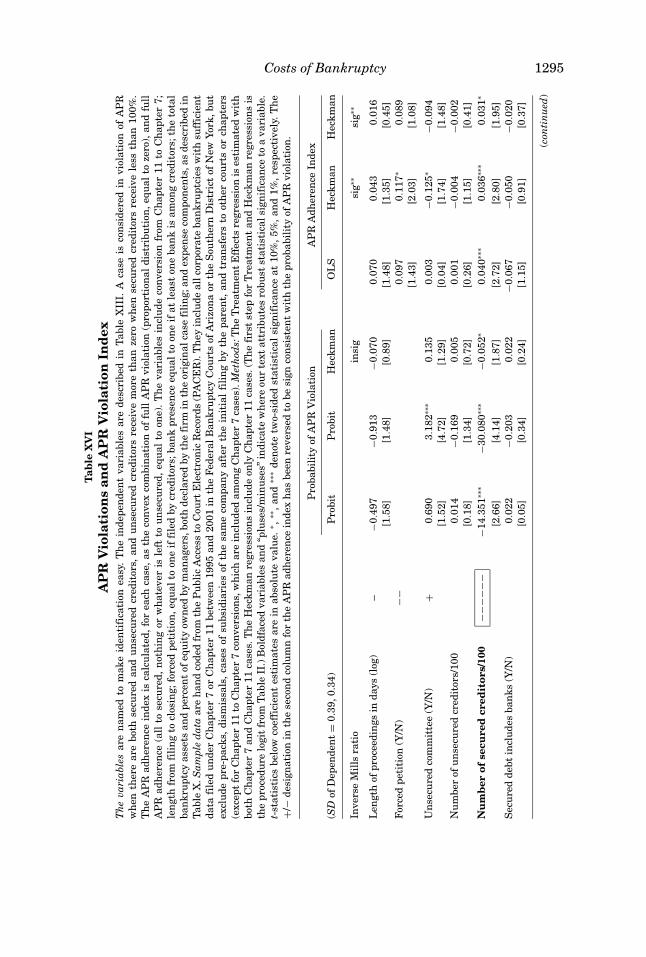
Costs of Bankruptcy 1295T
able
XV
IA
PR
Vio
lati
ons
and
AP
RV
iola
tion
Ind
exT
he
vari
able
sar
en
amed
tom
ake
iden
tifi
cati
onea
sy.
Th
ein
depe
nde
nt
vari
able
sar
ede
scri
bed
inT
able
XII
I.A
case
isco
nsi
dere
din
viol
atio
nof
AP
Rw
hen
ther
ear
ebo
thse
cure
dan
du
nse
cure
dcr
edit
ors,
and
un
secu
red
cred
itor
sre
ceiv
em
ore
than
zero
wh
ense
cure
dcr
edit
ors
rece
ive
less
than
100%
.T
he
AP
Rad
her
ence
inde
xis
calc
ula
ted,
for
each
case
,as
the
con
vex
com
bin
atio
nof
full
AP
Rvi
olat
ion
(pro
port
ion
aldi
stri
buti
on,e
qual
toze
ro),
and
full
AP
Rad
her
ence
(all
tose
cure
d,n
oth
ing
orw
hat
ever
isle
ftto
un
secu
red,
equ
alto
one)
.T
he
vari
able
sin
clu
deco
nve
rsio
nfr
omC
hap
ter
11to
Ch
apte
r7;
len
gth
from
fili
ng
tocl
osin
g;fo
rced
peti
tion
,equ
alto
one
iffi
led
bycr
edit
ors;
ban
kpr
esen
ceeq
ual
toon
eif
atle
ast
one
ban
kis
amon
gcr
edit
ors;
the
tota
lba
nkr
upt
cyas
sets
and
perc
ent
ofeq
uit
yow
ned
bym
anag
ers,
both
decl
ared
byth
efi
rmin
the
orig
inal
case
fili
ng;
and
expe
nse
com
pon
ents
,as
desc
ribe
din
Tab
leX
.Sam
ple
dat
aar
eh
and
code
dfr
omth
eP
ubl
icA
cces
sto
Cou
rtE
lect
ron
icR
ecor
ds(P
AC
ER
).T
hey
incl
ude
allc
orpo
rate
ban
kru
ptci
esw
ith
suff
icie
nt
data
file
du
nde
rC
hap
ter
7or
Ch
apte
r11
betw
een
1995
and
2001
inth
eF
eder
alB
ankr
upt
cyC
ourt
sof
Ari
zon
aor
the
Sou
ther
nD
istr
ict
ofN
ewYo
rk,b
ut
excl
ude
pre-
pack
s,di
smis
sals
,ca
ses
ofsu
bsid
iari
esof
the
sam
eco
mpa
ny
afte
rth
ein
itia
lfi
lin
gby
the
pare
nt,
and
tran
sfer
sto
oth
erco
urt
sor
chap
ters
(exc
ept
for
Ch
apte
r11
toC
hap
ter
7co
nve
rsio
ns,
wh
ich
are
incl
ude
dam
ong
Ch
apte
r7
case
s).M
eth
ods:
Th
eT
reat
men
tE
ffec
tsre
gres
sion
ises
tim
ated
wit
hbo
thC
hap
ter
7an
dC
hap
ter
11ca
ses.
Th
eH
eckm
anre
gres
sion
sin
clu
deon
lyC
hap
ter
11ca
ses.
(Th
efi
rst
step
for
Tre
atm
ent
and
Hec
kman
regr
essi
ons
isth
epr
oced
ure
logi
tfr
omT
able
II.)
Bol
dfac
edva
riab
les
and
“plu
ses/
min
use
s”in
dica
tew
her
eou
rte
xtat
trib
ute
sro
bust
stat
isti
cals
ign
ific
ance
toa
vari
able
.t-
stat
isti
csbe
low
coef
fici
ent
esti
mat
esar
ein
abso
lute
valu
e.∗ ,
∗∗,a
nd
∗∗∗
den
ote
two-
side
dst
atis
tica
lsi
gnif
ican
ceat
10%
,5%
,an
d1%
,res
pect
ivel
y.T
he
+/−
desi
gnat
ion
inth
ese
con
dco
lum
nfo
rth
eA
PR
adh
eren
cein
dex
has
been
reve
rsed
tobe
sign
con
sist
ent
wit
hth
epr
obab
ilit
yof
AP
Rvi
olat
ion
.
Pro
babi
lity
ofA
PR
Vio
lati
onA
PR
Adh
eren
ceIn
dex
(SD
ofD
epen
den
t=
0.39
,0.3
4)P
robi
tP
robi
tH
eckm
anO
LS
Hec
kman
Hec
kman
Inve
rse
Mil
lsra
tio
insi
gsi
g∗∗si
g∗∗
Len
gth
ofpr
ocee
din
gsin
days
(log
)–
−0.4
97−0
.913
−0.0
700.
070
0.04
30.
016
[1.5
8][1
.48]
[0.8
9][1
.48]
[1.3
5][0
.45]
For
ced
peti
tion
(Y/N
)−−
0.09
70.
117∗
0.08
9[1
.43]
[2.0
3][1
.08]
Un
secu
red
com
mit
tee
(Y/N
)+
0.69
03.
182∗∗
∗0.
135
0.00
3−0
.125
∗−0
.094
[1.5
2][4
.72]
[1.2
9][0
.04]
[1.7
4][1
.48]
Nu
mbe
rof
un
secu
red
cred
itor
s/10
00.
014
−0.1
690.
005
0.00
1−0
.004
−0.0
02[0
.18]
[1.3
4][0
.72]
[0.2
6][1
.15]
[0.4
1]N
um
ber
ofse
cure
dcr
edit
ors/
100
−−−−
−−−1
4.35
1∗∗∗
−30.
080∗∗
∗−0
.052
∗0.
040∗∗
∗0.
036∗∗
∗0.
031∗
[2.6
6][4
.14]
[1.8
7][2
.72]
[2.8
0][1
.95]
Sec
ure
dde
btin
clu
des
ban
ks(Y
/N)
0.02
2−0
.203
0.02
2−0
.067
−0.0
50−0
.020
[0.0
5][0
.34]
[0.2
4][1
.15]
[0.9
1][0
.37]
(con
tin
ued
)
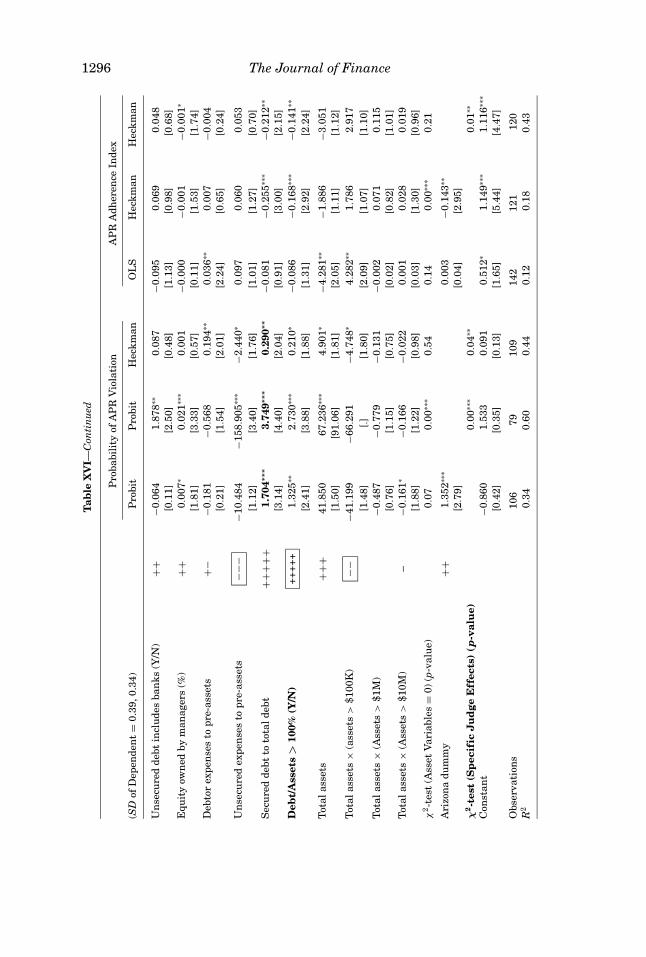
1296 The Journal of FinanceT
able
XV
I—C
onti
nu
ed
Pro
babi
lity
ofA
PR
Vio
lati
onA
PR
Adh
eren
ceIn
dex
(SD
ofD
epen
den
t=
0.39
,0.3
4)P
robi
tP
robi
tH
eckm
anO
LS
Hec
kman
Hec
kman
Un
secu
red
debt
incl
ude
sba
nks
(Y/N
)++
−0.0
641.
878∗∗
0.08
7−0
.095
0.06
90.
048
[0.1
1][2
.50]
[0.4
8][1
.13]
[0.9
8][0
.68]
Equ
ity
own
edby
man
ager
s(%
)++
0.00
7∗0.
021∗∗
∗0.
001
−0.0
00−0
.001
−0.0
01∗
[1.8
1][3
.33]
[0.5
7][0
.11]
[1.5
3][1
.74]
Deb
tor
expe
nse
sto
pre-
asse
ts+−
−0.1
81−0
.568
0.19
4∗∗0.
036∗∗
0.00
7−0
.004
[0.2
1][1
.54]
[2.0
1][2
.24]
[0.6
5][0
.24]
Un
secu
red
expe
nse
sto
pre-
asse
ts−−
−−1
0.48
4−1
58.9
05∗∗
∗−2
.440
∗0.
097
0.06
00.
053
[1.1
2][3
.40]
[1.7
6][1
.01]
[1.2
7][0
.70]
Sec
ure
dde
btto
tota
ldeb
t++
+++
1.70
4∗∗∗
3.74
9∗∗∗
0.29
0∗∗
−0.0
81−0
.255
∗∗∗
−0.2
12∗∗
[3.1
4][4
.40]
[2.0
4][0
.91]
[3.0
0][2
.15]
Deb
t/A
sset
s>
100%
(Y/N
)++
+++
1.32
5∗∗2.
730∗∗
∗0.
210∗
−0.0
86−0
.168
∗∗∗
−0.1
41∗∗
[2.4
1][3
.88]
[1.8
8][1
.31]
[2.9
2][2
.24]
Tot
alas
sets
+++
41.8
5067
.236
∗∗∗
4.90
1∗−4
.281
∗∗−1
.886
−3.0
51[1
.50]
[91.
06]
[1.8
1][2
.05]
[1.1
1][1
.12]
Tot
alas
sets
×(a
sset
s>
$100
K)
−−−4
1.19
9−6
6.29
1−4
.748
∗4.
282∗∗
1.78
62.
917
[1.4
8][.
][1
.80]
[2.0
9][1
.07]
[1.1
0]T
otal
asse
ts×
(Ass
ets
>$1
M)
−0.4
87−0
.779
−0.1
31−0
.002
0.07
10.
115
[0.7
6][1
.15]
[0.7
5][0
.02]
[0.8
2][1
.01]
Tot
alas
sets
×(A
sset
s>
$10M
)–
−0.1
61∗
−0.1
66−0
.022
0.00
10.
028
0.01
9[1
.88]
[1.2
2][0
.98]
[0.0
3][1
.30]
[0.9
6]χ
2-t
est
(Ass
etV
aria
bles
=0)
(p-v
alu
e)0.
070.
00∗∗
∗0.
540.
140.
00∗∗
∗0.
21
Ari
zon
adu
mm
y++
1.35
2∗∗∗
0.00
3−0
.143
∗∗
[2.7
9][0
.04]
[2.9
5]χ
2-t
est
(Sp
ecif
icJ
ud
geE
ffec
ts)
(p-v
alu
e)0.
00∗∗
∗0.
04∗∗
0.01
∗∗
Con
stan
t−0
.860
1.53
30.
091
0.51
2∗1.
149∗∗
∗1.
116∗∗
∗
[0.4
2][0
.35]
[0.1
3][1
.65]
[5.4
4][4
.47]
Obs
erva
tion
s10
679
109
142
121
120
R2
0.34
0.60
0.44
0.12
0.18
0.43
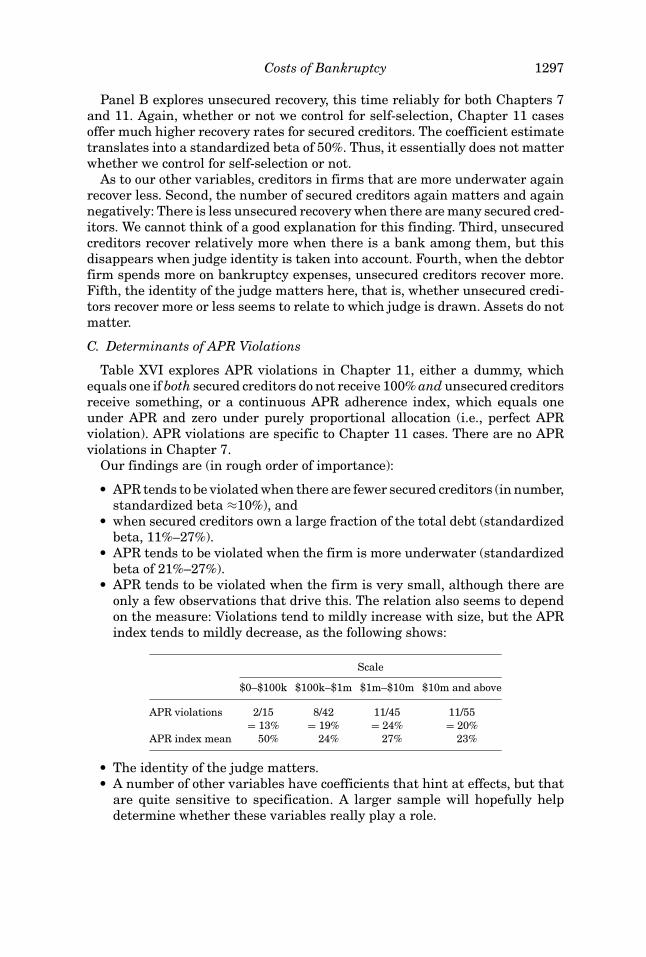
Costs of Bankruptcy 1297
Panel B explores unsecured recovery, this time reliably for both Chapters 7and 11. Again, whether or not we control for self-selection, Chapter 11 casesoffer much higher recovery rates for secured creditors. The coefficient estimatetranslates into a standardized beta of 50%. Thus, it essentially does not matterwhether we control for self-selection or not.
As to our other variables, creditors in firms that are more underwater againrecover less. Second, the number of secured creditors again matters and againnegatively: There is less unsecured recovery when there are many secured cred-itors. We cannot think of a good explanation for this finding. Third, unsecuredcreditors recover relatively more when there is a bank among them, but thisdisappears when judge identity is taken into account. Fourth, when the debtorfirm spends more on bankruptcy expenses, unsecured creditors recover more.Fifth, the identity of the judge matters here, that is, whether unsecured credi-tors recover more or less seems to relate to which judge is drawn. Assets do notmatter.
C. Determinants of APR Violations
Table XVI explores APR violations in Chapter 11, either a dummy, whichequals one if both secured creditors do not receive 100% and unsecured creditorsreceive something, or a continuous APR adherence index, which equals oneunder APR and zero under purely proportional allocation (i.e., perfect APRviolation). APR violations are specific to Chapter 11 cases. There are no APRviolations in Chapter 7.
Our findings are (in rough order of importance):� APR tends to be violated when there are fewer secured creditors (in number,standardized beta ≈10%), and� when secured creditors own a large fraction of the total debt (standardizedbeta, 11%–27%).� APR tends to be violated when the firm is more underwater (standardizedbeta of 21%–27%).� APR tends to be violated when the firm is very small, although there areonly a few observations that drive this. The relation also seems to dependon the measure: Violations tend to mildly increase with size, but the APRindex tends to mildly decrease, as the following shows:
Scale
$0–$100k $100k–$1m $1m–$10m $10m and above
APR violations 2/15 8/42 11/45 11/55= 13% = 19% = 24% = 20%
APR index mean 50% 24% 27% 23%� The identity of the judge matters.� A number of other variables have coefficients that hint at effects, but thatare quite sensitive to specification. A larger sample will hopefully helpdetermine whether these variables really play a role.
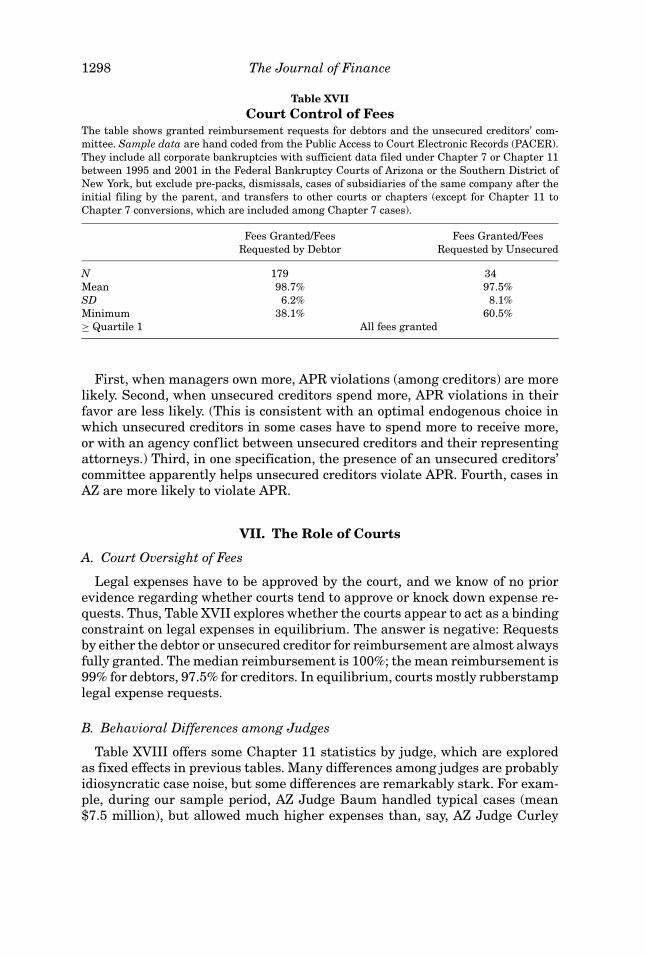
1298 The Journal of Finance
Table XVIICourt Control of Fees
The table shows granted reimbursement requests for debtors and the unsecured creditors’ com-mittee. Sample data are hand coded from the Public Access to Court Electronic Records (PACER).They include all corporate bankruptcies with sufficient data filed under Chapter 7 or Chapter 11between 1995 and 2001 in the Federal Bankruptcy Courts of Arizona or the Southern District ofNew York, but exclude pre-packs, dismissals, cases of subsidiaries of the same company after theinitial filing by the parent, and transfers to other courts or chapters (except for Chapter 11 toChapter 7 conversions, which are included among Chapter 7 cases).
Fees Granted/Fees Fees Granted/FeesRequested by Debtor Requested by Unsecured
N 179 34Mean 98.7% 97.5%SD 6.2% 8.1%Minimum 38.1% 60.5%≥ Quartile 1 All fees granted
First, when managers own more, APR violations (among creditors) are morelikely. Second, when unsecured creditors spend more, APR violations in theirfavor are less likely. (This is consistent with an optimal endogenous choice inwhich unsecured creditors in some cases have to spend more to receive more,or with an agency conflict between unsecured creditors and their representingattorneys.) Third, in one specification, the presence of an unsecured creditors’committee apparently helps unsecured creditors violate APR. Fourth, cases inAZ are more likely to violate APR.
VII. The Role of Courts
A. Court Oversight of Fees
Legal expenses have to be approved by the court, and we know of no priorevidence regarding whether courts tend to approve or knock down expense re-quests. Thus, Table XVII explores whether the courts appear to act as a bindingconstraint on legal expenses in equilibrium. The answer is negative: Requestsby either the debtor or unsecured creditor for reimbursement are almost alwaysfully granted. The median reimbursement is 100%; the mean reimbursement is99% for debtors, 97.5% for creditors. In equilibrium, courts mostly rubberstamplegal expense requests.
B. Behavioral Differences among Judges
Table XVIII offers some Chapter 11 statistics by judge, which are exploredas fixed effects in previous tables. Many differences among judges are probablyidiosyncratic case noise, but some differences are remarkably stark. For exam-ple, during our sample period, AZ Judge Baum handled typical cases (mean$7.5 million), but allowed much higher expenses than, say, AZ Judge Curley
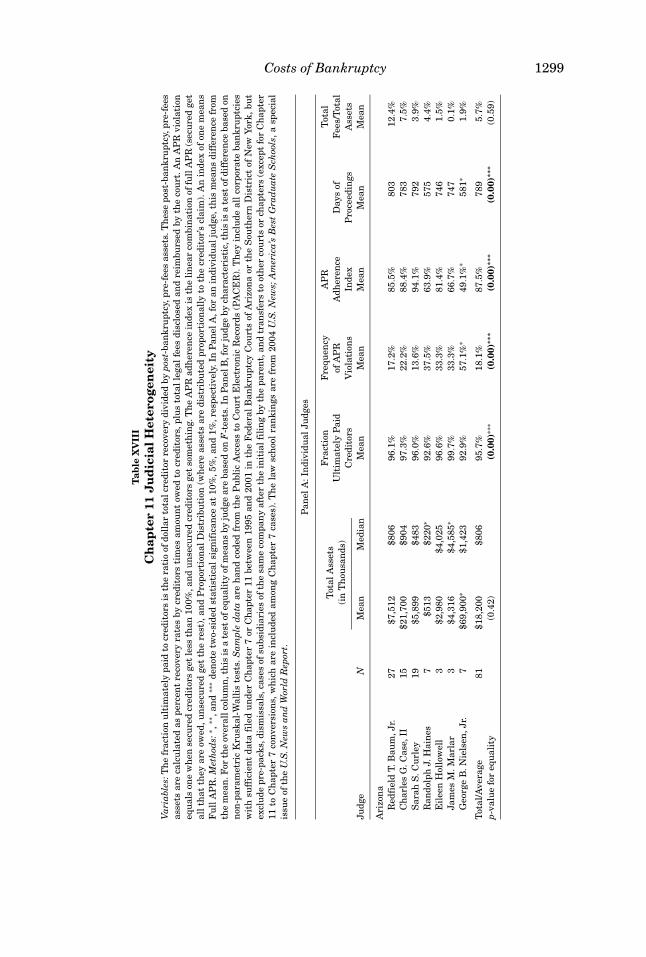
Costs of Bankruptcy 1299
Tab
leX
VII
I
Ch
apte
r11
Ju
dic
ial
Het
erog
enei
tyV
aria
bles
:Th
efr
acti
onu
ltim
atel
ypa
idto
cred
itor
sis
the
rati
oof
doll
arto
talc
redi
tor
reco
very
divi
ded
bypo
st-b
ankr
upt
cy,p
re-f
ees
asse
ts.T
hes
epo
st-b
ankr
upt
cy,p
re-f
ees
asse
tsar
eca
lcu
late
das
perc
ent
reco
very
rate
sby
cred
itor
sti
mes
amou
nt
owed
tocr
edit
ors,
plu
sto
tall
egal
fees
disc
lose
dan
dre
imbu
rsed
byth
eco
urt
.An
AP
Rvi
olat
ion
equ
als
one
wh
ense
cure
dcr
edit
ors
get
less
than
100%
,an
du
nse
cure
dcr
edit
ors
get
som
eth
ing.
Th
eA
PR
adh
eren
cein
dex
isth
eli
nea
rco
mbi
nat
ion
offu
llA
PR
(sec
ure
dge
tal
lth
atth
eyar
eow
ed,u
nse
cure
dge
tth
ere
st),
and
Pro
port
ion
alD
istr
ibu
tion
(wh
ere
asse
tsar
edi
stri
bute
dpr
opor
tion
ally
toth
ecr
edit
or’s
clai
m).
An
inde
xof
one
mea
ns
Fu
llA
PR
.Met
hod
s:∗ ,
∗∗,a
nd
∗∗∗
den
ote
two-
side
dst
atis
tica
lsig
nif
ican
ceat
10%
,5%
,an
d1%
,res
pect
ivel
y.In
Pan
elA
,for
anin
divi
dual
judg
e,th
ism
ean
sdi
ffer
ence
from
the
mea
n.F
orth
eov
eral
lcol
um
n,t
his
isa
test
ofeq
ual
ity
ofm
ean
sby
judg
ear
eba
sed
onF
-tes
ts.I
nP
anel
B,f
orju
dge
bych
arac
teri
stic
,th
isis
ate
stof
diff
eren
ceba
sed
onn
on-p
aram
etri
cK
rusk
al-W
alli
ste
sts.
Sam
ple
dat
aar
eh
and
code
dfr
omth
eP
ubl
icA
cces
sto
Cou
rtE
lect
ron
icR
ecor
ds(P
AC
ER
).T
hey
incl
ude
all
corp
orat
eba
nkr
upt
cies
wit
hsu
ffic
ien
tda
tafi
led
un
der
Ch
apte
r7
orC
hap
ter
11be
twee
n19
95an
d20
01in
the
Fed
eral
Ban
kru
ptcy
Cou
rts
ofA
rizo
na
orth
eS
outh
ern
Dis
tric
tof
New
York
,bu
tex
clu
depr
e-pa
cks,
dism
issa
ls,c
ases
ofsu
bsid
iari
esof
the
sam
eco
mpa
ny
afte
rth
ein
itia
lfil
ing
byth
epa
ren
t,an
dtr
ansf
ers
toot
her
cou
rts
orch
apte
rs(e
xcep
tfo
rC
hap
ter
11to
Ch
apte
r7
con
vers
ion
s,w
hic
har
ein
clu
ded
amon
gC
hap
ter
7ca
ses)
.Th
ela
wsc
hoo
lra
nki
ngs
are
from
2004
U.S
.New
s;A
mer
ica’
sB
est
Gra
du
ate
Sch
ools
,asp
ecia
lis
sue
ofth
eU
.S.N
ews
and
Wor
ldR
epor
t.
Pan
elA
:In
divi
dual
Judg
es
Tot
alA
sset
sF
ract
ion
Fre
quen
cyA
PR
Tot
al
(in
Th
ousa
nds
)U
ltim
atel
yP
aid
ofA
PR
Adh
eren
ceD
ays
ofF
ees/
Tot
alC
redi
tors
Vio
lati
ons
Inde
xP
roce
edin
gsA
sset
sJu
dge
NM
ean
Med
ian
Mea
nM
ean
Mea
nM
ean
Mea
n
Ari
zon
aR
edfi
eld
T.B
aum
,Jr.
27$7
,512
$806
96.1
%17
.2%
85.5
%80
312
.4%
Ch
arle
sG
.Cas
e,II
15$2
1,70
0$9
0497
.3%
22.2
%88
.4%
783
7.5%
Sar
ahS.
Cu
rley
19$5
,899
$483
96.0
%13
.6%
94.1
%79
23.
9%R
ando
lph
J.H
ain
es7
$513
$220
∗92
.6%
37.5
%63
.9%
575
4.4%
Eil
een
Hol
low
ell
3$2
,980
$4,0
2596
.6%
33.3
%81
.4%
746
1.5%
Jam
esM
.Mar
lar
3$4
,316
$4,5
85∗
99.7
%33
.3%
66.7
%74
70.
1%G
eorg
eB
.Nie
lsen
,Jr.
7$6
9,90
0∗$1
,423
92.9
%57
.1%
∗49
.1%
∗58
1∗1.
9%
Tot
al/A
vera
ge81
$18,
200
$806
95.7
%18
.1%
87.5
%78
95.
7%p-
valu
efo
req
ual
ity
(0.4
2)(0
.00)
∗∗∗
(0.0
0)∗∗
∗(0
.00)
∗∗∗
(0.0
0)∗∗
∗(0
.59)
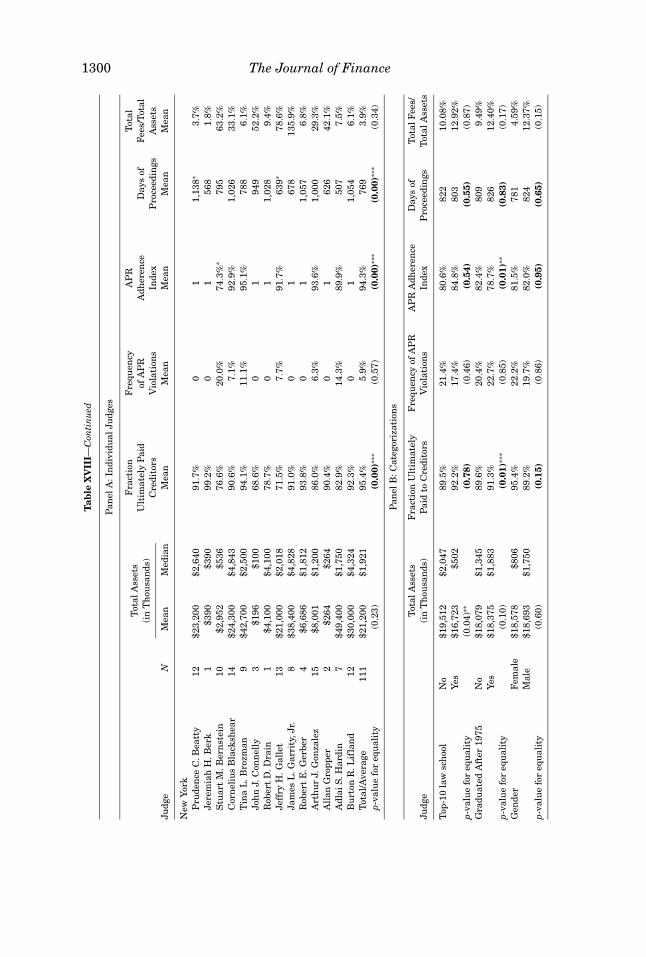
1300 The Journal of FinanceT
able
XV
III—
Con
tin
ued
Pan
elA
:In
divi
dual
Judg
es
Tot
alA
sset
sF
ract
ion
Fre
quen
cyA
PR
Tot
al
(in
Th
ousa
nds
)U
ltim
atel
yP
aid
ofA
PR
Adh
eren
ceD
ays
ofF
ees/
Tot
alC
redi
tors
Vio
lati
ons
Inde
xP
roce
edin
gsA
sset
sJu
dge
NM
ean
Med
ian
Mea
nM
ean
Mea
nM
ean
Mea
n
New
York
Pru
den
ceC
.Bea
tty
12$2
3,20
0$2
,640
91.7
%0
11,
138∗
3.7%
Jere
mia
hH
.Ber
k1
$390
$390
99.2
%0
156
81.
8%S
tuar
tM
.Ber
nst
ein
10$2
,952
$536
76.6
%20
.0%
74.3
%∗
795
63.2
%C
orn
eliu
sB
lack
shea
r14
$24,
300
$4,8
4390
.6%
7.1%
92.9
%1,
026
33.1
%T
ina
L.B
rozm
an9
$42,
700
$2,5
0094
.1%
11.1
%95
.1%
788
6.1%
Joh
nJ.
Con
nel
ly3
$196
$100
68.6
%0
194
952
.2%
Rob
ert
D.D
rain
1$4
,100
$4,1
0078
.7%
01
1,02
89.
4%Je
ffry
H.G
alle
t13
$21,
000
$2,0
1871
.5%
7.7%
91.7
%63
9∗78
.6%
Jam
esL
.Gar
rity
,Jr.
8$3
8,40
0$4
,828
91.0
%0
167
813
5.9%
Rob
ert
E.G
erbe
r4
$6,6
86$1
,812
93.8
%0
11,
057
6.8%
Art
hu
rJ.
Gon
zale
z15
$8,0
01$1
,200
86.0
%6.
3%93
.6%
1,00
029
.3%
All
anG
ropp
er2
$264
$264
90.4
%0
162
642
.1%
Adl
aiS.
Har
din
7$4
9,40
0$1
,750
82.9
%14
.3%
89.9
%50
77.
5%B
urt
onR
.Lif
lan
d12
$30,
000
$4,3
2492
.3%
01
1,05
46.
1%T
otal
/Ave
rage
111
$21,
200
$1,9
2195
.4%
5.9%
94.3
%76
93.
9%p-
valu
efo
req
ual
ity
(0.2
3)(0
.00)
∗∗∗
(0.5
7)(0
.00)
∗∗∗
(0.0
0)∗∗
∗(0
.34)
Pan
elB
:Cat
egor
izat
ion
s
Tot
alA
sset
sF
ract
ion
Ult
imat
ely
Fre
quen
cyof
AP
RA
PR
Adh
eren
ceD
ays
ofT
otal
Fee
s/Ju
dge
(in
Th
ousa
nds
)P
aid
toC
redi
tors
Vio
lati
ons
Inde
xP
roce
edin
gsT
otal
Ass
ets
Top
-10
law
sch
ool
No
$19,
512
$2,0
4789
.5%
21.4
%80
.6%
822
10.0
8%Ye
s$1
6,72
3$5
0292
.2%
17.4
%84
.8%
803
12.9
2%p-
valu
efo
req
ual
ity
(0.0
4)∗∗
(0.7
8)(0
.46)
(0.5
4)(0
.55)
(0.8
7)G
radu
ated
Aft
er19
75N
o$1
8,07
9$1
,345
89.6
%20
.4%
82.4
%80
99.
49%
Yes
$18,
375
$1,8
8391
.3%
22.7
%78
.7%
826
12.4
0%p-
valu
efo
req
ual
ity
(0.1
0)(0
.01)
∗∗∗
(0.8
5)(0
.01)
∗∗(0
.83)
(0.1
7)G
ende
rF
emal
e$1
8,57
8$8
0695
.4%
22.2
%81
.5%
781
4.59
%M
ale
$18,
693
$1,7
5089
.2%
19.7
%82
.0%
824
12.3
7%p-
valu
efo
req
ual
ity
(0.6
0)(0
.15)
(0.8
6)(0
.95)
(0.6
5)(0
.15)
Costs of Bankruptcy 1301
($5.9 million): 12% versus 4%. AZ Judge Nielsen handled the largest cases($69.9 million). Remarkably, he did so much faster than any other judges(581 days vs. an average of 764 days in AZ), but he violated APR in four out of hisseven cases and creditors received less (93%) than they did on average (96%).In NY, Judge Garrity handled large cases ($38.4 million), adhered strongly toAPR, but also allowed very high expense ratios (above 100%!). NY Judge BurtonLifland, notorious for his creditor violations in earlier bankruptcies (such asthat of Eastern Airlines), both stuck to APR in our sample and managed to keepexpenses relatively modest.
A more rigorous analysis shows that judges differ statistically in terms ofthe fraction that they pay out to creditors, how they adhere to APR, and howmany days the proceedings take. AZ judges systematically violate APR, whileNY judges do so only on occasion. In terms of identifiable judge differences, thequality of the alma mater of the judge does not matter. However, judges whohave graduated after 1975 (the mean graduation year in our sample) have seencreditors recover a higher fraction of the firm in total but are less likely to followAPR. We have few observations to obtain statistical significance on gender, butthere is an intriguing correlation worth mentioning—female judges tend to payconsiderably more to creditors, reigning in fees.
VIII. Conclusion
Our paper not only examines the most comprehensive sample of bankruptcycases to date, but also explores the alternative between Chapter 11 reorgani-zations and Chapter 7 liquidations. We find that Chapter 7 cases are system-atically different from Chapter 11 cases along a number of dimensions such asfirm size. After controlling for self-selection (which is important and effective),Chapter 7 seems to offer few advantages: It takes almost as long to resolve,requires similar fees, and in the end provides creditors with lower recoveryrates—often zero—than a comparable Chapter 11 procedure.
We advise caution when interpreting figures that measure the cost ofbankruptcy. These costs are sensitive to the procedure, to the denominator (howassets are measured), and to the central statistic used. More importantly, theyvary widely and predictably from firm to firm. A range of estimates from 2%to 20% can not only be defended, but can even be predicted by our regressionsat bankruptcy onset. Thus, theorists would be well advised not to claim eitheruniformly low or uniformly high bankruptcy costs, but rather to recognize thatbankruptcy costs are modest in some firms, and large in other firms.
Our paper uses a rich data source that also allows us to examine a varietyof factors, such as: jurisdiction (AZ and NY), the identity of the judge, the roleof scale (asset size), managerial equity holdings in the firm, the degree of firmindebtedness, the presence of a debtor’s committee, the number of secured andunsecured creditors as well as their respective claims, the division of the Chap-ter 11 procedure into its three phases, and the legal fees requested and grantedby the court to individual claimants. These variables provide many interesting
1302 The Journal of Finance
associations—again, too many to summarize here in our conclusion, or even tocomprehensively cover in our paper. Therefore, we invite interested readers tofurther explore our data, which we make available on our websites.
REFERENCESAlderson, Michael J., and Brian L. Betker, 1995, Liquidation costs and capital structure, Journal
of Financial Economics 39, 45–69.Altman, Edward I., 1984, A further empirical investigation of the bankruptcy cost question, Journal
of Finance 39, 1067–1089.Ang, James S., Jess H. Chua, and John J. McConnell, 1982, The administrative costs of corporate
bankruptcy: A note, Journal of Finance 37, 219–226.Betker, Brian L., 1995, Management’s incentive, equity’s bargaining power and deviations from
absolute priority in Chapter 11 bankruptcies, Journal of Business 68, 161–184.Bris, Arturo, and Ivo Welch, 2005, The optimal concentration of creditors, Journal of Finance 60,
2193–2212.Cleveland, William S., 1981, LOWESS: A program for smoothing scatterplots by robust locally
weighted regression, American Statistician 35, 54.Eberhart, Allan C., William T. Moore, and Rodney L. Roenfeldt, 1990, Security pricing and devi-
ations from absolute priority rule in bankruptcy proceedings, Journal of Finance 45, 1457–1469.
Eckbo, B. Espen, and Karin S. Thorburn, 2002, Overbidding vs. fire-sales in bankruptcy auctions,Working paper (Series No. 02-04), Tuck School of Business, Dartmouth.
Eckbo, B. Espen, and Karin S. Thorburn, 2003, Control benefits and CEO discipline in automaticbankruptcy auctions, Journal of Financial Economics 69, 227–258.
Franks, Julian R., and Walter N. Torous, 1989, An empirical investigation of U.S. firms in reorga-nization, Journal of Finance 44, 747–769.
Gilson, Stuart C., 1997, Transaction costs and capital structure choice: Evidence from financiallydistressed firms, Journal of Finance 52, 161–196.
Heckman, James J., 1979, Sample selection bias as a specification error, Econometrica 47, 153–161.Hotchkiss, Edith Shwalb, 1995, Post-bankruptcy performance and management turnover, Journal
of Finance 50, 3–21.Kahl, Matthias, 2002, Financial distress as a selection mechanism: Evidence from the United
States, Working paper, Anderson School.Kenny, Lawrence W., Lung-Fei Lee, G.S. Maddala, and Robert P. Trost, 1979, Returns to college
education: An investigation of self-selection bias based on the project talent data, InternationalEconomic Review 20, 775–789.
Lawless, Robert M., Stephen P. Ferris, Narayanan Jayaraman, and Anil K. Makhija, 1994, Aglimpse at professional fees and other direct costs in small firms bankruptcies, Universityof Illinois Law Review 4, 847–888.
LoPucki Lynn M., and Joseph W. Doherty, 2004, The determinants of professional fees in largebankruptcy reorganization cases, Journal of Empirical Legal Studies 1, 111–141.
Lubben, Stephen J., 2000, The direct costs of corporate reorganization: An empirical examination ofprofessional fees in large Chapter 11 cases, American Bankruptcy Law Journal 509, 508–552.
Maddala, G.S., 1983, Limited-Dependent and Qualitative Variables in Econometrics (CambridgeUniversity Press, Cambridge).
Maksimovic, Vojislav, and Gordon Phillips, 1998, Asset efficiency and reallocation decisions ofbankrupt firms, Journal of Finance 53, 1495–1532.
Pulvino, Todd C., 1998, Do asset fire sales exist? An empirical investigation of commercial aircrafttransactions, Journal of Finance 53, 939–978.
Pulvino, Todd C., 1999, Effects of bankruptcy court protection on asset sales, Journal of FinancialEconomics 52, 151–186.
Ravid, S. Abraham, and Stefan Sundgren, 1998, The comparative efficiency of small-firm bankrupt-cies: A study of the U.S. and Finnish bankruptcy codes, Financial Management 27, 28–40.
Costs of Bankruptcy 1303
Shleifer, Andrei, and Robert W. Vishny, 1992, Liquidation values and debt capacity: A marketequilibrium approach, Journal of Finance 47, 1343–1366.
Stromberg, Per, 2000, Conflicts of interest and market illiquidity in bankruptcy auctions: Theoryand tests, Journal of Finance 55, 2641–2691.
Tashjian Elizabeth, Ronald C. Lease, and John J. McConnell, 1996, Prepacks: An empirical analysisof prepacked bankruptcies, Journal of Financial Economics 40, 135–162.
Thorburn, Karin S., 2000, Bankruptcy auctions: Costs, debt recovery, and firm survival, Journalof Financial Economics 58, 337–368.
Warner, Jerold B., 1977, Bankruptcy cost: Some evidence, Journal of Finance 32, 337–347.Weiss, Lawrence A., 1990, Bankruptcy resolution, Journal of Financial Economics 27, 285–314.Weiss, Lawrence A., and Karen H. Wruck, 1998, Information problems, conflicts of interest, and
asset stripping: Chapter 11’s failure in the case of Eastern Airlines, Journal of FinancialEconomics 48, 55–97.
Welch, Ivo, 1997, Why is bank debt senior? A theory of asymmetry and claim priority based oninfluence costs, Review of Financial Studies 10, 1203–1236.
White, Michelle J., 1984, Bankruptcy, liquidation, and reorganization, in D. Logue, ed.: Handbookof Modern Finance (Warren, Gorham & Lamont, Boston, MA), 1–49.